20
Image: JWST @SXSW March 2013 An Equation to Estimate the Probability of Identifying an Inhabited World Within the Next Decade Sara Seager, MIT

Image: JWST @SXSW March 2013
An Equation to Estimate the Probability of Identifying an Inhabited World Within the Next Decade !Sara Seager, MIT!

Acknowledgements Exoplanet Atmospheres and Interiors B. Benneke (Atmospheric Retrieval) R. Hu (Photochemistry) S. Messenger(Biosignature Gases) J. De Wit (Planet Atmospheres) W. Bains (Biosignature Gases) B. Demory (Observations) V. Stamenkovic (Planet Interiors) A. Zsom (Clouds, atmospheres)
Space Engineering C. Pong (ADCS) M. Smith (Optics) M. Knapp (Systems/Camera) J. Nash (Avionics) A. Babuscia (Comm.) I. Sergeev (Avionics) B. Corbin (Structures/Systems) N. Inamdar (Structuresl)
Thank you to my past and present students and postdocs Supported by MIT, NASA (HQ, JPL), Draper Lab, Lincoln Lab

N number of planets with detectable biosignature gasesN* number of stars within the sampleFQ fraction of quiet starsFHZ fraction with rocky planets in the HZFO fraction of observable systemsFL fraction with lifeFS fraction with detectable spectroscopic signatures A “revised” Drake Equation For any star types, any well defined survey
N = N*FQFHZFOFLFS

N number of planets with detectable biosignature gasesN* number of M stars with I < 13FQ fraction of quiet M starsFHZ fraction with rocky planets in the HZFO fraction of observable=transiting systems observable with JWSTFL fraction with lifeFS fraction with detectable spectroscopic signatures
For M stars: TESS/JWST
N = N*FQFHZFOFLFS

Number of Stars
N* should be those accessible to TESS and for planet-hosting stars accessible to atmosphere followup with JWST"• I mag < 13 "• 30,000 to 50,000 stars""• Bochanski 2007; Reid and Hawley 2006"
Term M Stars
N* 30,000
N = N*FQFHZFOFLFS
N*
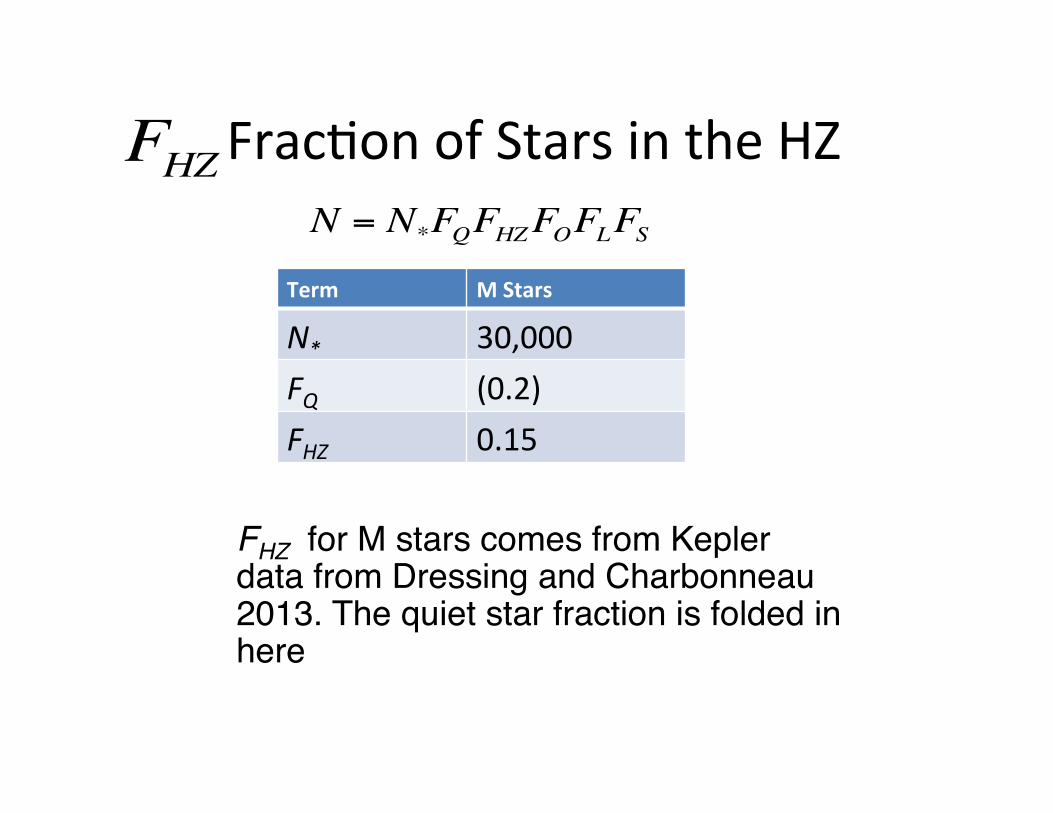
Frac3on of Stars in the HZ
FHZ for M stars comes from Kepler data from Dressing and Charbonneau 2013. The quiet star fraction is folded in here""
Term M Stars
N* 30,000 FQ (0.2) FHZ 0.15
N = N*FQFHZFOFLFS
FHZ

Frac3on of Observable Systems
FO here means fraction of planets that transit and that are observable by JWST. Transiting planets are required for JWST atmosphere followup for small planets in the HZ"
N = N*FQFHZFOFLFS
FO
Term M Stars
N* 30,000 FQ (0.2) FHZ 0.15 FO 0.01 x 0.1

Frac3on with Life
FL is purely speculative"
Term M Stars
N* 30,000 FQ (0.2) FHZ 0.15 FO 0.001 FL 1
N = N*FQFHZFOFLFS
FL

Frac3on with Detectable Spectrscopic Signature
Does life generate a spectroscopic signature? "
Term M Stars
N* 30,000 FQ (0.2) FHZ 0.15 FO 0.001 FL 1 FS 0.5 N 2
N = N*FQFHZFOFLFS
FS

“Nothing would be more tragic in the … exploration of space than to encounter alien life and fail to recognize it” NRC report 2007
We appear stuck with a terracentric view of biosignature gases

Seager, Science 2013 Inner edge: Zsom, Seager, de Wit, arXiv: 1304.3714
The Habitable Zone

Terrestrial Planet Finder
Telescope

Biomass Model as a Plausibility Check for Biosignature Gases
Thermodynamicmodel predicts
necessary biomass
Is biomass neededto generate a
detectablespectrum a
plausible biomass?
!G = !Go – RTln(Qt)
Atmospherephotochemistry model
Source !ux necessaryto maintain thedetectable gasconcentration
Compute minimalspectral feature
needed for detection
Gas concentrationneeded for detection
Planetary scenario:P, T, base chemistry
Hypothesis:biosignature
gas to beevaluated Step 1:
Determineatmospheric gas
concentration
Step 2:Determinerelated gassurface !ux
Step 3:Determine
relatedbiomass
CO2 + H2 CH4 + H2O
Turnbull et al. 2007
"B = !GFSPme
10–12
101
N2
H2
H
NH3
NH2
N2H2
N2H4
H2O
OH
CO2CO
CH4HCN
102
103
104
105
10–8 10–4 100
Mixing ratio
Pres
sure
(Pa)

Biomass Model Es3mate
Pme≈ ΔG R
§ The minimum maintenance energy rate [kJ/g/s]
§ Empirically measured in the lab
§ Tijuis et al. 1993
• Gibbs Free energy yield [kJ/mole]
• Gas production rate [mole/g/s]
• Measured for lab cultures
Pme= Aexp −EA
RT"
#$%
&'

Biomass Model Es3mate
Pme≈ ΔG R
Fsource: biosignature surface flux [mole/m2/s] would be derived from future exoplanet observations, considering photochemistry
R [mole/g/s] can be broken down into relevant quantities
ΣB: biomass surface density [g/m2]
Fsource ≈ R ΣB
ΣB ≈ΔG Fsource
Pme

Cold Haber World: NH3 • Cold Haber World 3H2 + N2 è 2NH3
– NH3 as a biosignature gas on an 90% H2-‐10% N2 planet with life enzyma3cally catalyzing the N2 bond
– NH3 has a short life3me and requires a surface flux for produc3on in thin atmospheres
– Detectable NH3 around a quiet M star with 3.3 ppm, Fsource = 2 x 10¹³ molecules/m2/s, ΔG and ΣB ~ 3 x 10-‐5 g/m2
1.75
1.755
1.76
1.765
1.77
Plan
et R
adius
[Ear
th R
adius
] CH3Cl
CH3Cl
1.75
1.755
1.76
1.765
1.77
Plan
et R
adius
[Ear
th R
adius
] DMS DMS
1.75
1.755
1.76
1.765
1.77
Plan
et R
adius
[Ear
th R
adius
] N2O
N2O
CO2
H2O
H2 - H2
H2 - H2
H2 - H2
CO2
CO2
H2O
H2O
CO2
CO2
H2O
H2O
H2O
CH4
CH4
CH4
0 ppm0.5 ppm0.5 ppm5 ppm5 ppm50 ppm50 ppm500 ppm500 ppm
0 ppm0.5 ppm0.5 ppm5 ppm5 ppm50 ppm50 ppm500 ppm500 ppm
0 ppm0.5 ppm0.5 ppm5 ppm5 ppm50 ppm50 ppm500 ppm500 ppm
Plan
et R
adius
/ St
ellar
Rad
ius
0.016
0.0161
0.0161
0.0162
0.0802
0.0804
0.0806
0.0808
0.081
Plan
et R
adius
/ St
ellar
Rad
ius
0.016
0.0161
0.0161
0.0162
0.0802
0.0804
0.0806
0.0808
0.081
Plan
et R
adius
/ St
ellar
Rad
ius
0.016
0.0161
0.0161
0.0162
0.0802
0.0804
0.0806
0.0808
0.081
0.2 0.5 1 2 5 10 20 50 1001.75
1.755
1.76
1.765
1.77
Wavelength [microns]
Plan
et R
adius
[Ear
th R
adius
]
Plan
et R
adius
/ St
ellar
Rad
ius
0.016
0.0161
0.0161
0.0162
0.0802
0.0804
0.0806
0.0808
0.081
H2 - H2
CO2
CO2
H2OCH4
NH3
NH3
0 ppm0.5 ppm0.5 ppm5 ppm5 ppm50 ppm50 ppm500 ppm500 ppm
Figure shows synthetic transmission spectra for a 10 Earth mass, 1.75 Earth radius planet orbiting a quiet M5 dwarf star Seager et al. submitted to ApJ

Biosignature Gases in H2 Atmospheres
1.75
1.755
1.76
1.765
1.77
Plan
et R
adius
[Ear
th R
adius
] CH3Cl
CH3Cl
1.75
1.755
1.76
1.765
1.77
Plan
et R
adius
[Ear
th R
adius
] DMS DMS
1.75
1.755
1.76
1.765
1.77
Plan
et R
adius
[Ear
th R
adius
] N2O
N2O
CO2
H2O
H2 - H2
H2 - H2
H2 - H2
CO2
CO2
H2O
H2O
CO2
CO2
H2O
H2O
H2O
CH4
CH4
CH4
0 ppm0.5 ppm0.5 ppm5 ppm5 ppm50 ppm50 ppm500 ppm500 ppm
0 ppm0.5 ppm0.5 ppm5 ppm5 ppm50 ppm50 ppm500 ppm500 ppm
0 ppm0.5 ppm0.5 ppm5 ppm5 ppm50 ppm50 ppm500 ppm500 ppm
Plan
et R
adius
/ St
ellar
Rad
ius
0.016
0.0161
0.0161
0.0162
0.0802
0.0804
0.0806
0.0808
0.081
Plan
et R
adius
/ St
ellar
Rad
ius
0.016
0.0161
0.0161
0.0162
0.0802
0.0804
0.0806
0.0808
0.081
Plan
et R
adius
/ St
ellar
Rad
ius
0.016
0.0161
0.0161
0.0162
0.0802
0.0804
0.0806
0.0808
0.081
0.2 0.5 1 2 5 10 20 50 1001.75
1.755
1.76
1.765
1.77
Wavelength [microns]
Plan
et R
adius
[Ear
th R
adius
]
Plan
et R
adius
/ St
ellar
Rad
ius
0.016
0.0161
0.0161
0.0162
0.0802
0.0804
0.0806
0.0808
0.081
H2 - H2
CO2
CO2
H2OCH4
NH3
NH3
0 ppm0.5 ppm0.5 ppm5 ppm5 ppm50 ppm50 ppm500 ppm500 ppm
Proof of concept that biosignature gases can accumulate in an H2-rich atmosphere H is the dominant reactive species (akin to OH) The low UV environments of quiet M stars are most favorable Examples studied shown in Fig.
Seager, Bains, Hu submitted to ApJ


“It’s not going to be easy but we can dream” Dave Latham
N = N*FQFHZFOFLFS Term M Stars
N* 30,000 FQ (0.2) FHZ 0.15 FO 0.001 FL 1 FS 0.5 N 2


