Page 1
September, 2015
Daniel Rabasquinho Gouveia
[Nome completo do autor]
[Nome completo do autor]
[Nome completo do autor]
[Nome completo do autor]
[Nome completo do autor]
[Nome completo do autor]
[Nome completo do autor]
Undergraduate in Engineering and Industrial Management Sciences
[Habilitações Académicas]
[Habilitações Académicas]
[Habilitações Académicas]
[Habilitações Académicas]
[Habilitações Académicas]
[Habilitações Académicas]
[Habilitações Académicas]
An Essay on Agile Project Management Practices
[Título da Tese]
Dissertation for the achievement of an Integrated Master’s degree in
Industrial Engineering and Management
Dissertação para obtenção do Grau de Mestre em
[Engenharia Informática]
Adviser: Prof. Dr. Alexandra Maria Baptista Ramos Tenera, Assistant Professor,
FCT-UNL
Jury:
President: Prof. Dr. Isabel Maria do Nascimento Lopes, Assistant Professor, FCT-UNL
Members: Prof. Dr. Mário José Batista Romão, Associate Professor, ISEG
Prof. Dr. Alexandra Maria Baptista Ramos Tenera, Assistant Professor, FCT-UNL
Page 3
September, 2015
Daniel Rabasquinho Gouveia
[Nome completo do autor]
[Nome completo do autor]
[Nome completo do autor]
[Nome completo do autor]
[Nome completo do autor]
[Nome completo do autor]
[Nome completo do autor]
Undergraduate in Engineering and Industrial Management Sciences
[Habilitações Académicas]
[Habilitações Académicas]
[Habilitações Académicas]
[Habilitações Académicas]
[Habilitações Académicas]
[Habilitações Académicas]
[Habilitações Académicas]
An Essay on Agile Project Management Practices
[Título da Tese]
Dissertation for the achievement of an Integrated Master’s degree in
Industrial Engineering and Management
Dissertação para obtenção do Grau de Mestre em
[Engenharia Informática]
Adviser: Prof. Dr. Alexandra Maria Baptista Ramos Tenera, Assistant Professor,
FCT-UNL
Jury:
President: Prof. Dr. Isabel Maria do Nascimento Lopes, Assistant Professor, FCT-UNL
Members: Prof. Dr. Mário José Batista Romão, Associate Professor, ISEG
Prof. Dr. Alexandra Maria Baptista Ramos Tenera, Assistant Professor, FCT-UNL
Page 5
An Essay on Agile Project Management Practices
Copyright © Daniel Rabasquinho Gouveia, Faculdade de Ciências e Tecnologia,
Universidade Nova de Lisboa.
A Faculdade de Ciências e Tecnologia e a Universidade Nova de Lisboa têm o
direito, perpétuo e sem limites geográficos, de arquivar e publicar esta
dissertação através de exemplares impressos reproduzidos em papel ou de forma
digital, ou por qualquer outro meio conhecido ou que venha a ser inventado, e
de a divulgar através de repositórios científicos e de admitir a sua cópia e
distribuição com objectivos educacionais ou de investigação, não comerciais,
desde que seja dado crédito ao autor e editor.
Page 7
Acknowledgements
I would like to thank the guidance and availability of my coordinator in this thesis
Prof. Alexandra Tenera who took the time, even on late hours, in helping me with this
study.
I would like to thank my family, specially my mother and my father, who always
supported me on my decisions.
To Isabel, I would like to thank the support given day-by-day and for always finding
a way to cherish my day.
I would like to thank my friends, especially Samuel and Tomás, for always looking
out for me and for all the comradeship.
Finally, I would like to thanks Faculdade de Ciências e Tecnologia (FCT) for
lengthening my horizons and for being the most welcoming second home, always
filled with great experiences and friendship.
Page 9
ABSTRACT
The main goals for the current dissertation is to research on how practices and concepts from Agile
Project Management can be applied in a non-IT context and to discover which aspects should be
considered when deciding if whether an Agile approach should be implemented or not. Previous studies
reflect on the adoption for the identified context. However, the recognition of these practices and
concepts by the Project Management field of studies still remains unresolved.
The adoption of Agile Project Management emerges as a manifestation against traditional approaches,
mainly due to their inability of accepting requirements’ changes. Therefore, these practices and
concepts can be considered in order to reduce the risks concerning the increase of competition and
innovation – which does not apply to the IT sector solely.
The current study reviews the literature on Agile Project Management and its adoption across different
sectors in order to assess which practices and concepts can be applied on a non-IT context. Nine
different methods are reviewed, where two of these show a higher relevance – Scrum and Extreme
Programming. The identified practices and concepts can be separated into four different groups:
Cultural and Organizational Structures, Process, Practices, and Artefacts. A framework based on the
work by Boehm & Turner in 2004 is developed in order to support the decision of adopting agile
methods.
A survey intended for project managers was carried in order to assess the implementation of the
identified practices and concepts and to evaluate which variables have the highest importance on the
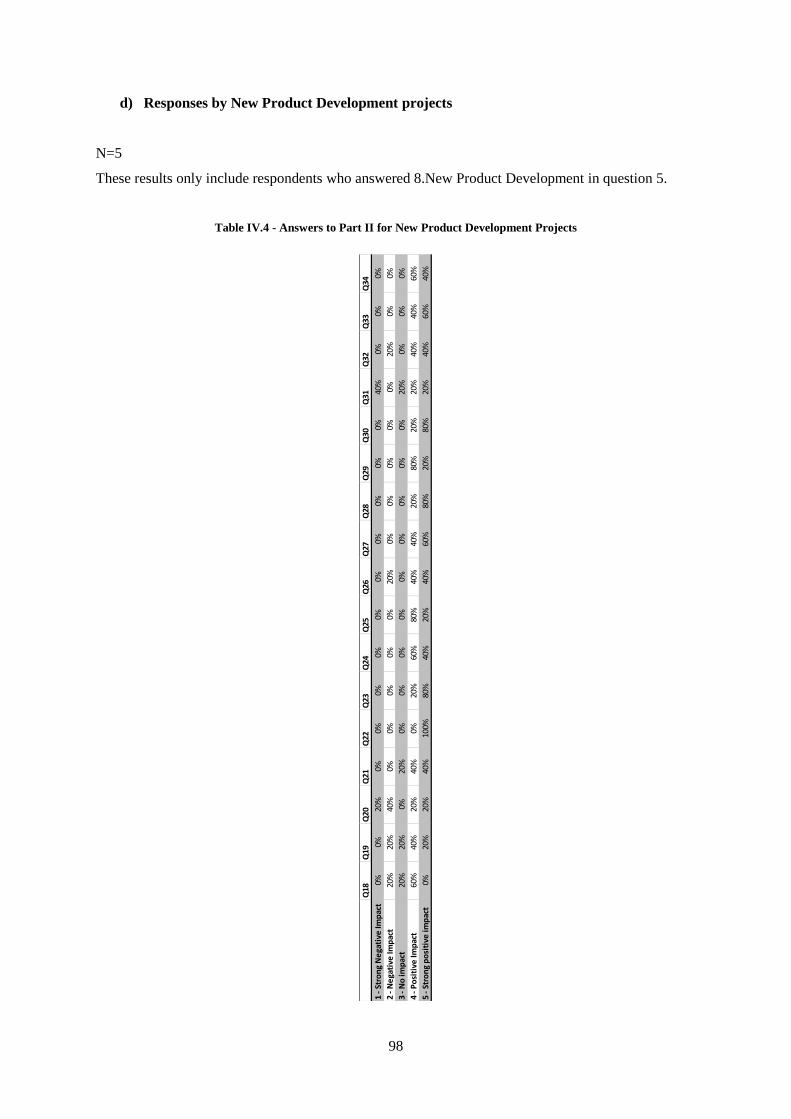
developed decision support framework. It is concluded that New Product Development is the project
type with the highest potential to implement an agile approach and that the Project Final Product’s
Innovativeness, Competitiveness, and the Project Member’s Experience and Autonomy are the most
important aspects to consider an implementation of an Agile approach.
Keywords: Agile Project Management; Project Management; Scrum; Extreme Programming
Page 11
RESUMO
O intuito desta dissertação é investigar em que medida é que as práticas e conceitos utilizados na Gestão
Ágil de Projectos podem ser aplicados num contexto que não as Tecnologias de Informação (TI) e que
critérios devem ser considerados para apoiar a decisão da sua implementação. Estudos anteriores
reflectem sobre a adopção destas práticas no contexto indicado. Contudo, o reconhecimento destas
práticas na Gestão de Projectos ainda permanece por resolver.
A adopção de práticas e conceitos de Gestão Ágil de Projectos surgem como manifestação aos métodos
tradicionais de Gestão de Projectos, maioritariamente pela sua incapacidade de adoptar mudanças.
Assim, estas práticas e conceitos podem ser considerados como forma de reduzir os riscos inerentes ao
aumento da competitividade e da inovação – que se verifica em diversos sectores que não as TI
unicamente.
O presente estudo revê os diferentes métodos ligados à Gestão Ágil de Projectos e a sua adopção em
diferentes sectores, de forma a avaliar que práticas e conceitos podem ser considerados para uma
aplicação num contexto não ligado às TI. Nove diferentes métodos são revistos, onde dois, Scrum e
Extreme Programming, demonstram-se mais relevantes. As práticas e conceitos identificados inserem-
se em quatro grupos principais: estruturas organizacionais e culturais, práticas, processo e ferramentas.
De forma a avaliar a adopção das diferentes práticas e conceitos, uma framework é desenvolvida com
base no trabalho realizado em 2004 por Boehm & Turner.
Para avaliar a adopção das práticas e conceitos identificados e encontrar as variáveis que detêm maior
relevância na framework desenvolvida, realizou-se um questionário vocacionado para gestores de
projecto. Conclui-se que os projectos de desenvolvimento de novos produtos detêm o maior potencial
para a adopção das práticas e conceitos da Gestão Ágil de Projectos e que o Grau de Inovação dos
Produtos Finais de Projecto, a Competitividade e a Experiência e Autonomia dos Membros do Projecto
são os principais aspectos a ter em consideração aquando da implementação das práticas e conceitos
identificados.
Palavras-Chave: Gestão Ágil de Projectos; Gestão de Projectos; Scrum; Extreme Programming
Page 13
i
Contents
1 Introduction ..................................................................................................................................... 1
1.1 Research Context .................................................................................................................... 1
1.2 Motivation and Scope ............................................................................................................. 2
1.3 Research Methodology ........................................................................................................... 2
1.4 Report Structure ...................................................................................................................... 3
2 Literature review on Agile Project Management ............................................................................ 5
2.1 Agile Methods ......................................................................................................................... 6
2.1.1 Scrum Approaches .......................................................................................................... 6
2.1.2 Extreme Programming .................................................................................................. 12
2.1.3 Feature Driven Development ........................................................................................ 17
2.1.4 Rational Unified Process ............................................................................................... 22
2.1.5 Dynamic Systems Development Method ...................................................................... 25
2.1.6 Other Methods .............................................................................................................. 31
2.2 Agile Methods Discussion and Comparison ......................................................................... 34
2.3 Review of Agile Implementations ........................................................................................ 39
2.4 Agile Outside the IT Sector .................................................................................................. 42
2.4.1 Cultural and Organizational Structures ......................................................................... 42
2.4.2 Artefacts ........................................................................................................................ 44
2.4.3 Practices ........................................................................................................................ 46
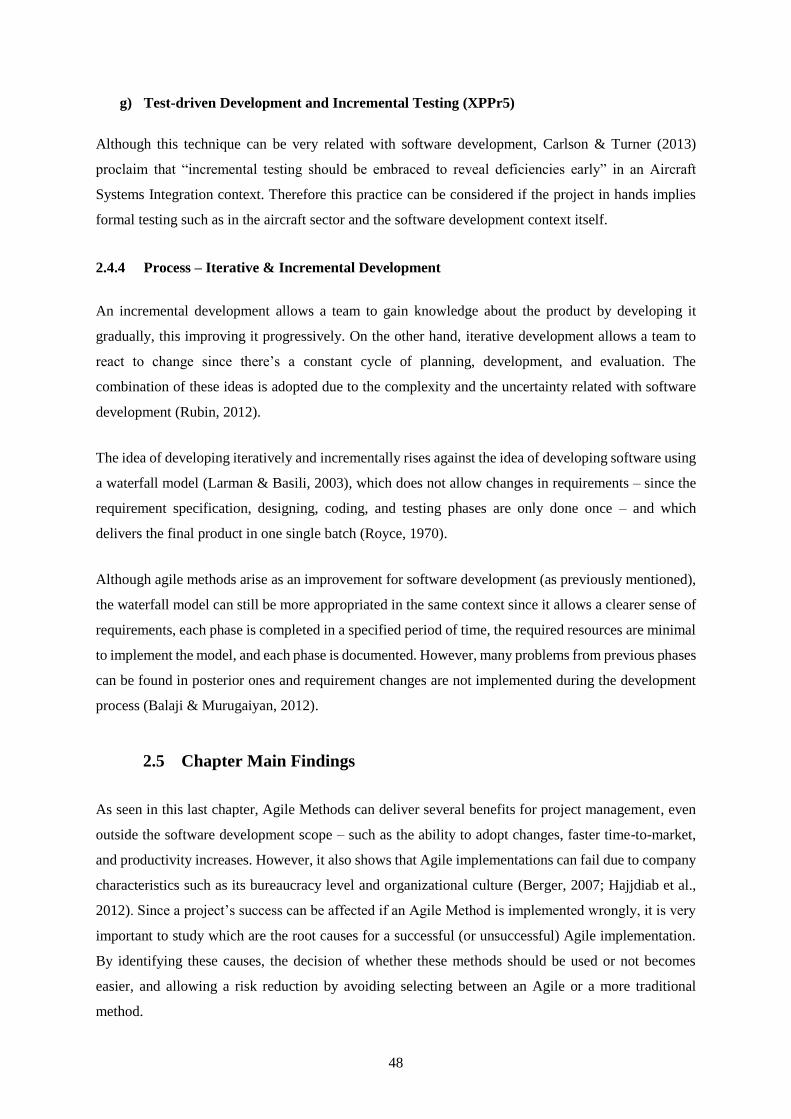
2.4.4 Process – Iterative & Incremental Development .......................................................... 48
2.5 Chapter Main Findings.......................................................................................................... 48
3 A Framework for an Agile Implementation Decision Model ....................................................... 49
3.1 Decision Criteria ................................................................................................................... 51
3.1.1 Personnel ....................................................................................................................... 51
3.1.2 Criticality ...................................................................................................................... 52
3.1.3 Team Size ...................................................................................................................... 52
3.1.4 Close Communication ................................................................................................... 52
3.1.5 Trust Environment ........................................................................................................ 53
Page 14
ii
3.1.6 Low Bureaucracy .......................................................................................................... 53
3.1.7 Innovativeness ............................................................................................................... 54
3.1.8 Scope Vagueness........................................................................................................... 54
3.1.9 Competitiveness ............................................................................................................ 54
4 A Survey on a Potential Implementation of Agile Methods ......................................................... 55
4.1 Survey’s Goals ...................................................................................................................... 55
4.2 Survey’s Specifications ......................................................................................................... 55
4.2.1 Company and Respondent Characteristics (Part I) ....................................................... 56
4.2.2 Assessment on the Framework’s Decision Model (Part II) .......................................... 57
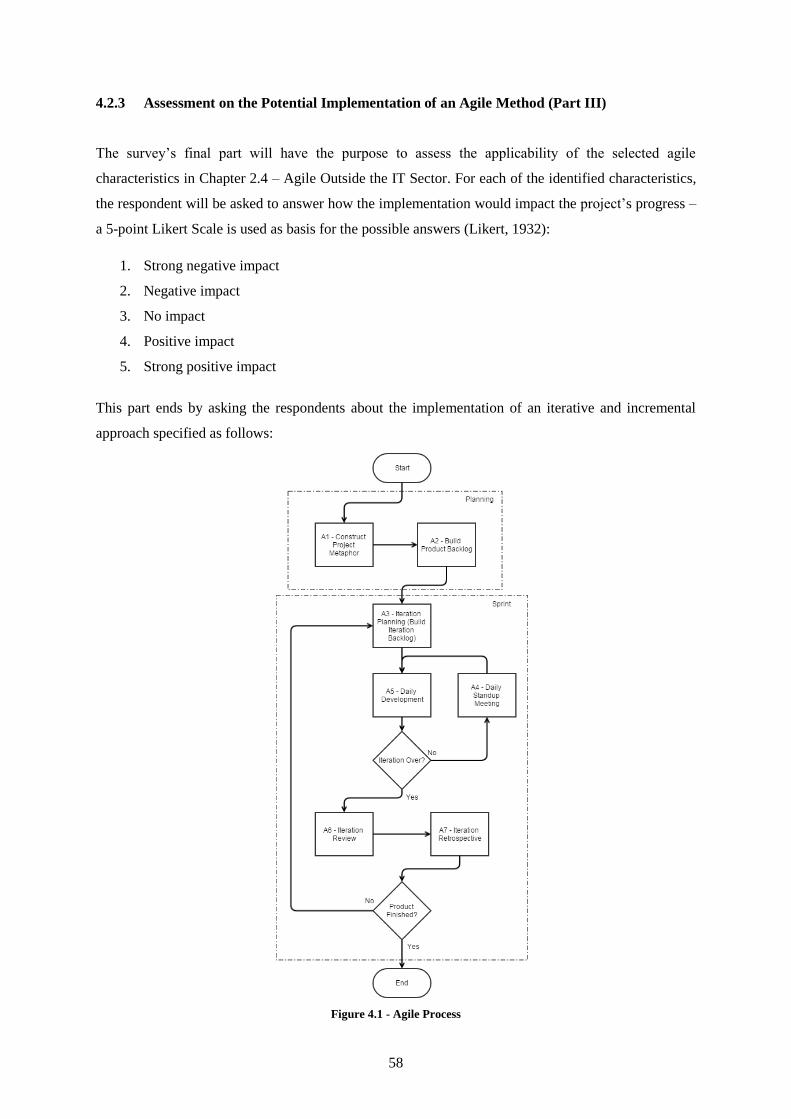
4.2.3 Assessment on the Potential Implementation of an Agile Method (Part III) ................ 58
4.3 Survey’s Results .................................................................................................................... 59
4.3.1 Respondents’ characteristics ......................................................................................... 59
4.3.2 Initial Analysis .............................................................................................................. 63
4.3.3 Independency and Correlation Analysis ....................................................................... 65
4.3.4 Cluster analysis ............................................................................................................. 68
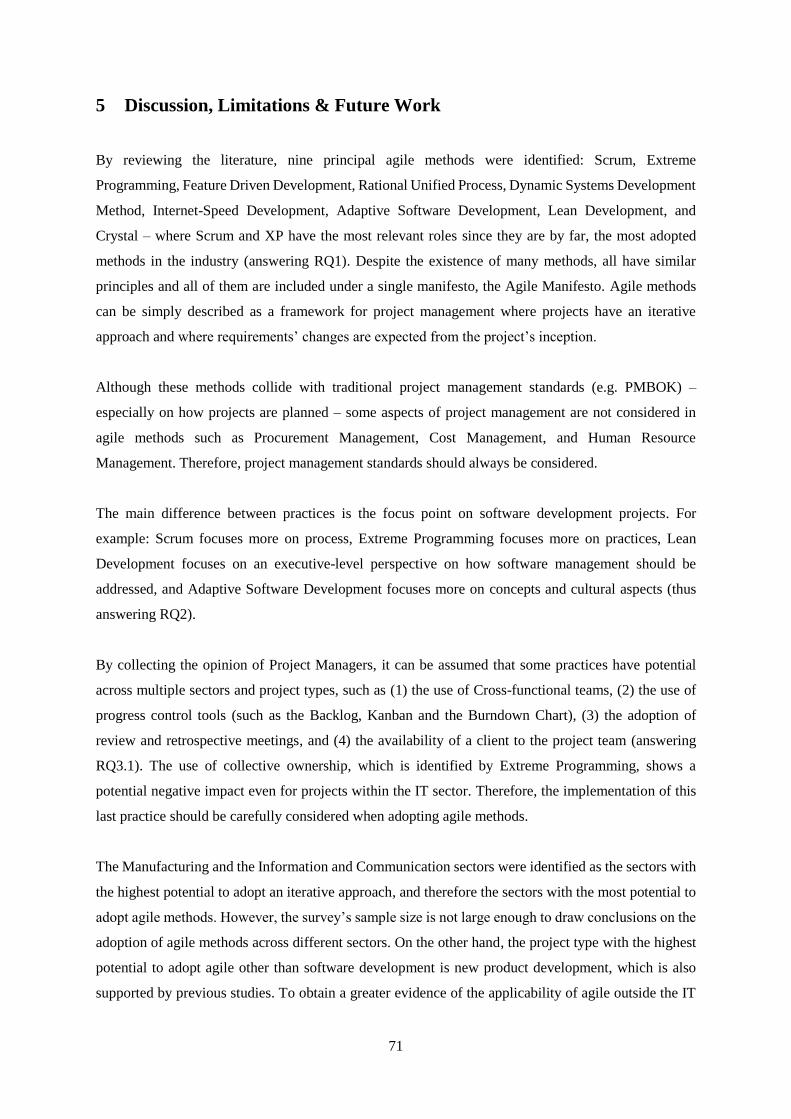
5 Discussion, Limitations & Future Work ....................................................................................... 71
References ............................................................................................................................................. 73
Annex I – Survey .................................................................................................................................. 77
Annex II – Survey Responses to Part II in IT and non-IT companies .................................................. 86
Annex III – Survey Responses to Part II by sector ............................................................................... 89
Annex IV – Survey Responses to Part II by Project Type .................................................................... 95
Annex V – Correlation Analysis ......................................................................................................... 101
Annex VI – Clustering Variables Correlation ..................................................................................... 102
Annex VIII – Cluster Data .................................................................................................................. 105
Page 15
iii
List of Figures
Figure 2.1 – Burndown Chart Example ................................................................................................ 10
Figure 2.2 – Scaled Project Illustration ................................................................................................. 11
Figure 2.3 – XP Lifecycle ..................................................................................................................... 15
Figure 2.4 – FDD Process ..................................................................................................................... 21
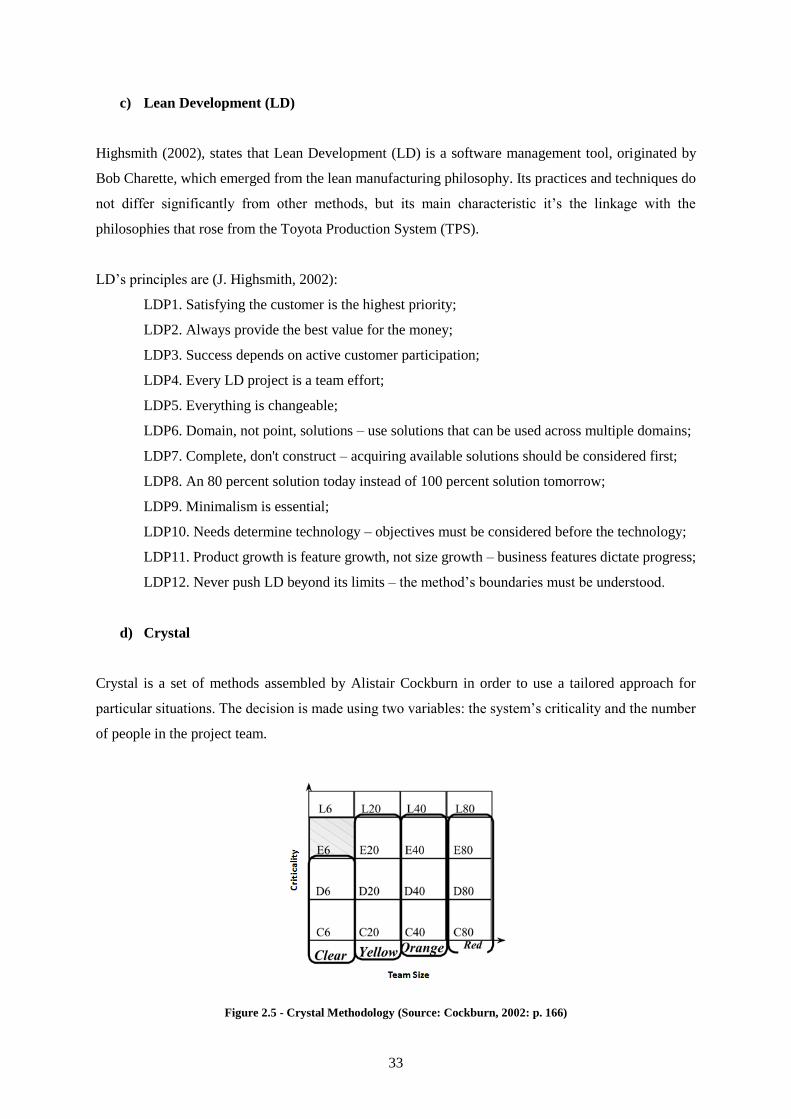
Figure 2.5 - Crystal Methodology ......................................................................................................... 33
Figure 2.6 – Improvements from adopting Agile according to Companies .......................................... 40
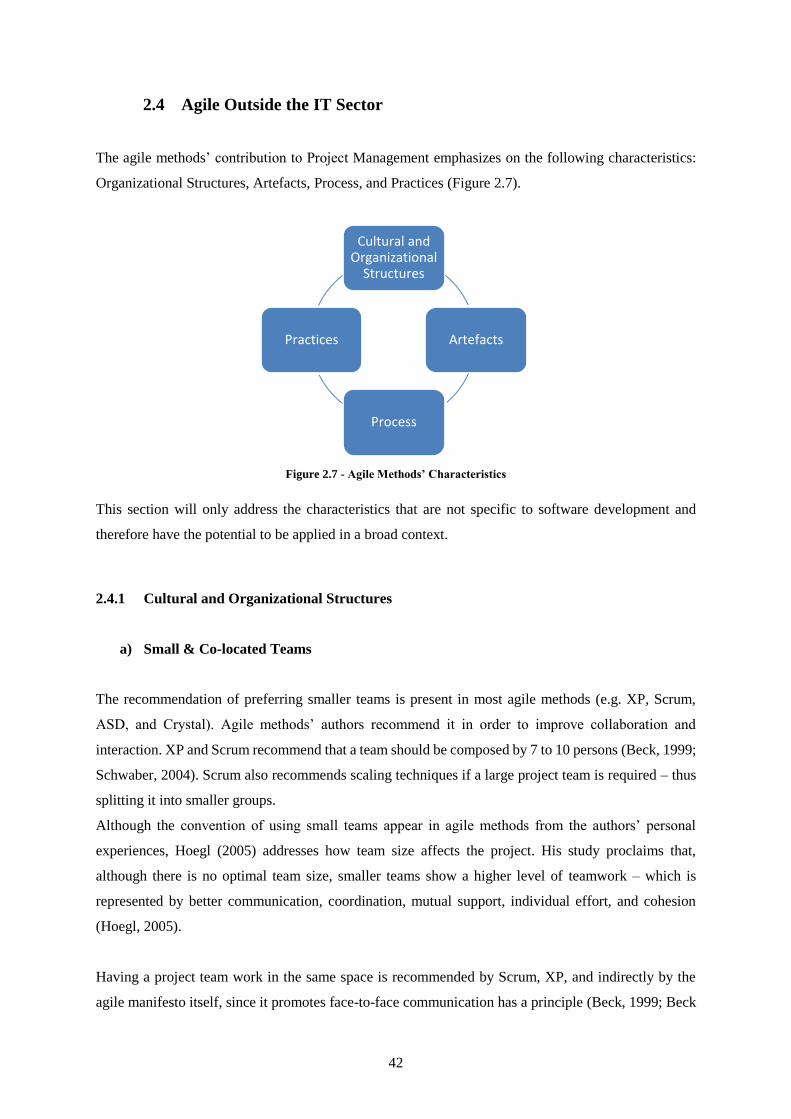
Figure 2.7 - Agile Methods’ Characteristics ......................................................................................... 42
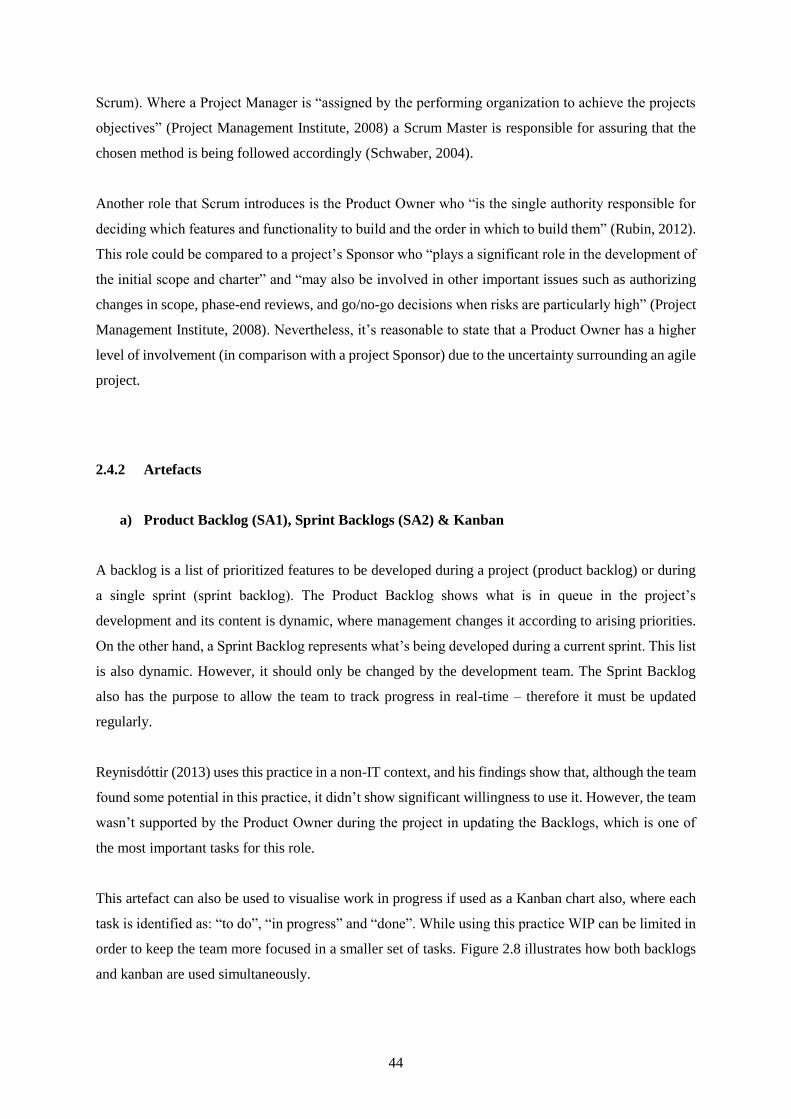
Figure 2.8 - Product Backlog, Sprint Backlog & Kanban..................................................................... 45
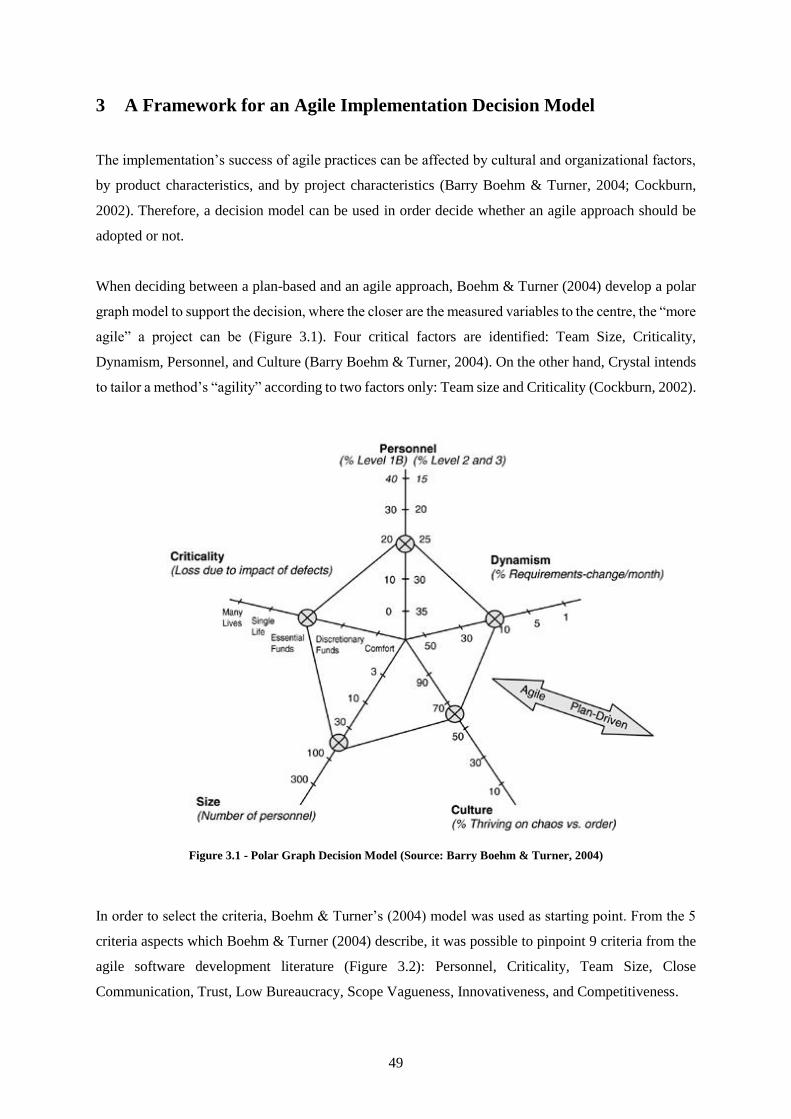
Figure 3.1 - Polar Graph Decision Model ............................................................................................. 49
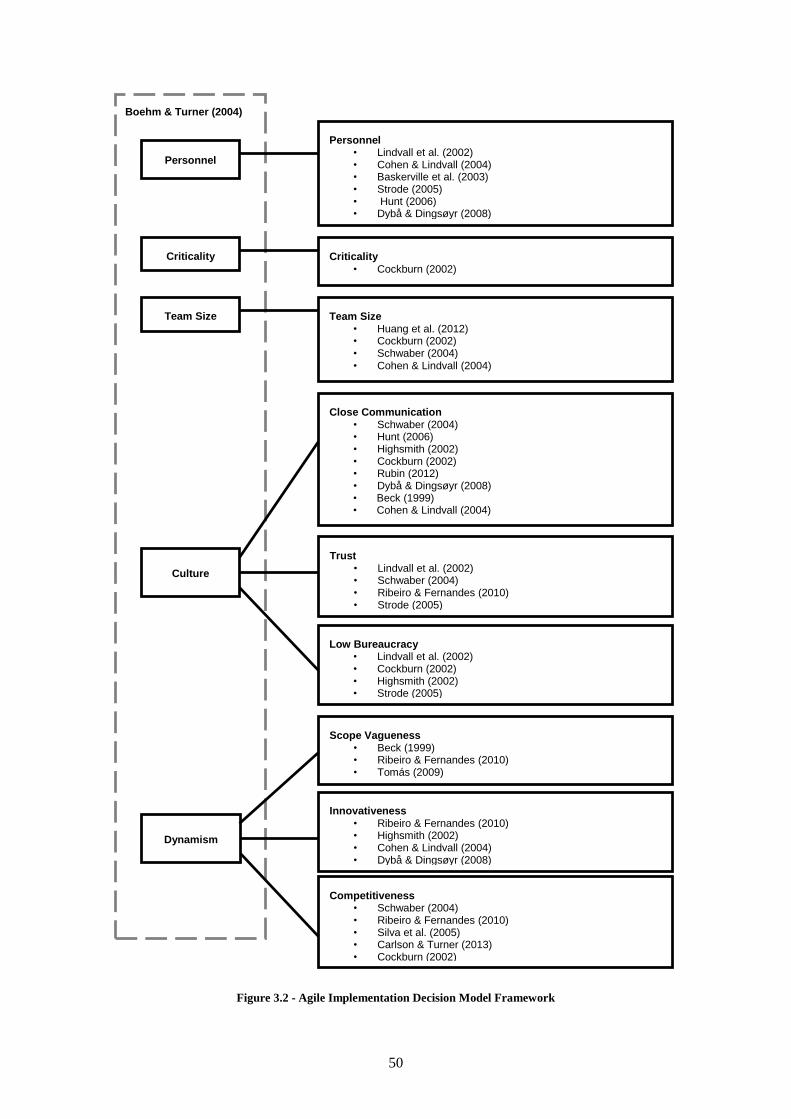
Figure 3.2 - Agile Implementation Decision Model Framework .......................................................... 50
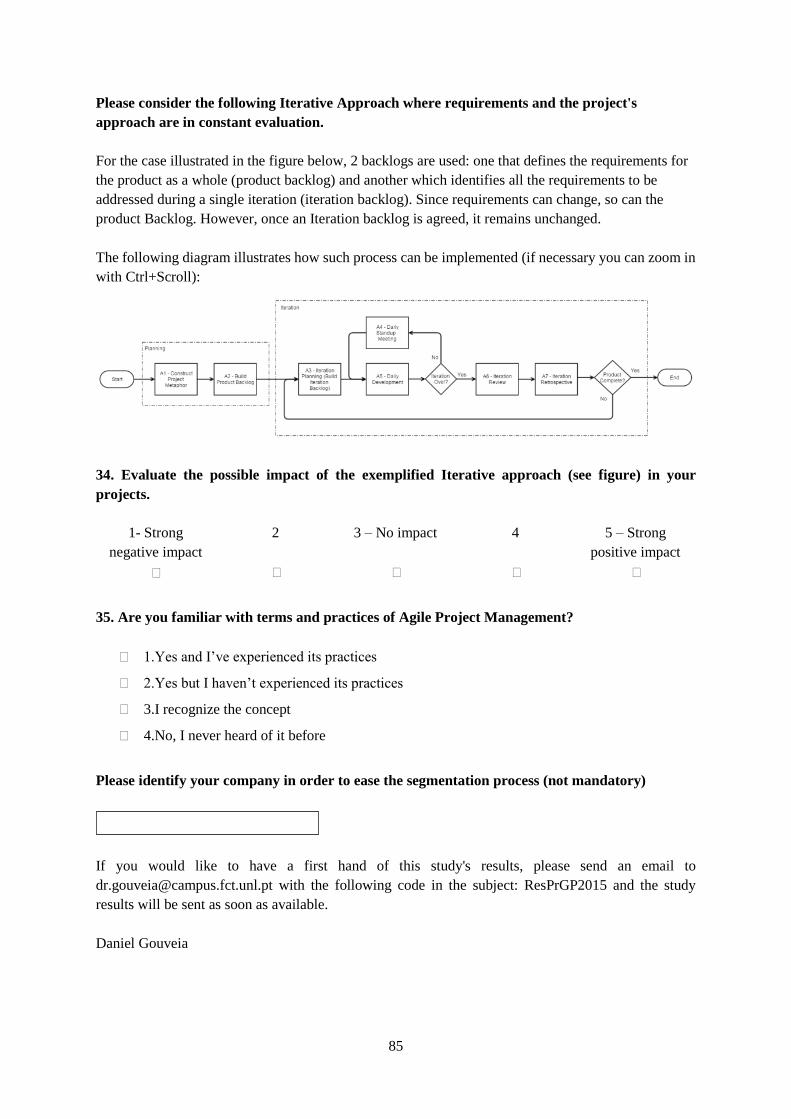
Figure 4.1 - Agile Process ..................................................................................................................... 58
Figure 4.2 – Respondents by Activity Sector ....................................................................................... 60
Figure 4.3 - Respondents by Years of Experience ................................................................................ 60
Figure 4.4 - Respondents by Company's Commercial Presence ........................................................... 61
Figure 4.5 - Number of Respondents by Project Type .......................................................................... 61
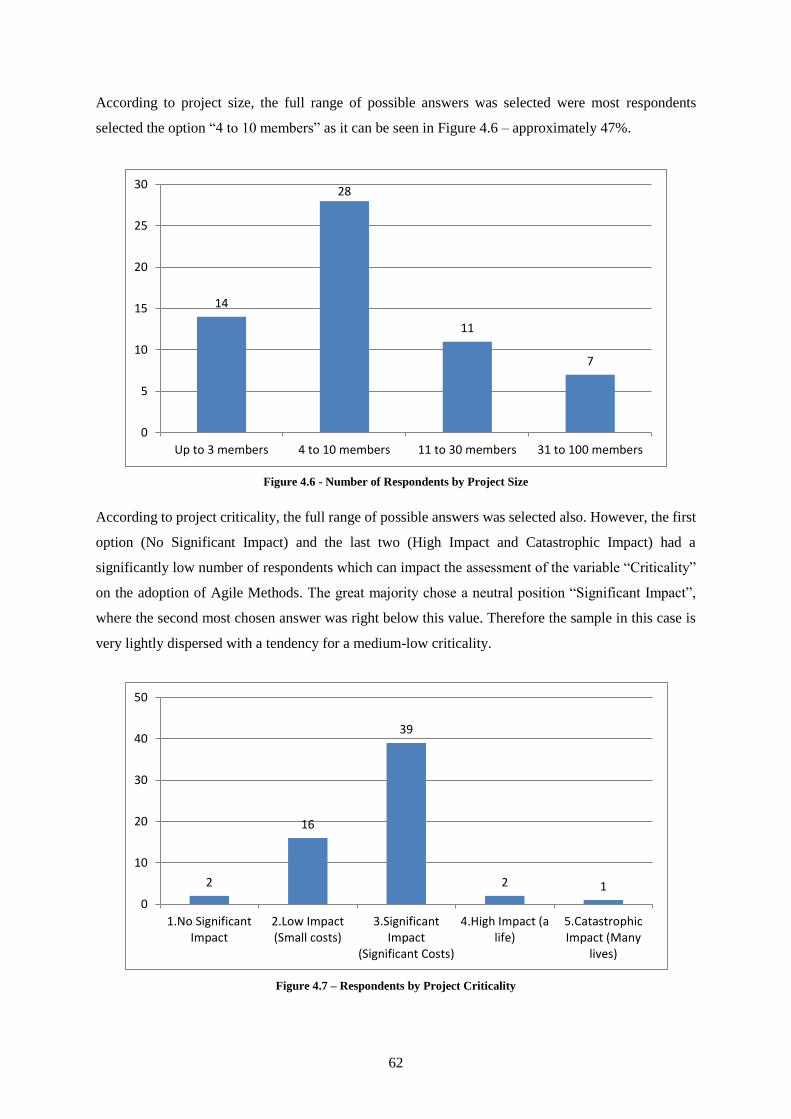
Figure 4.6 - Number of Respondents by Project Size ........................................................................... 62
Figure 4.7 – Respondents by Project Criticality ................................................................................... 62
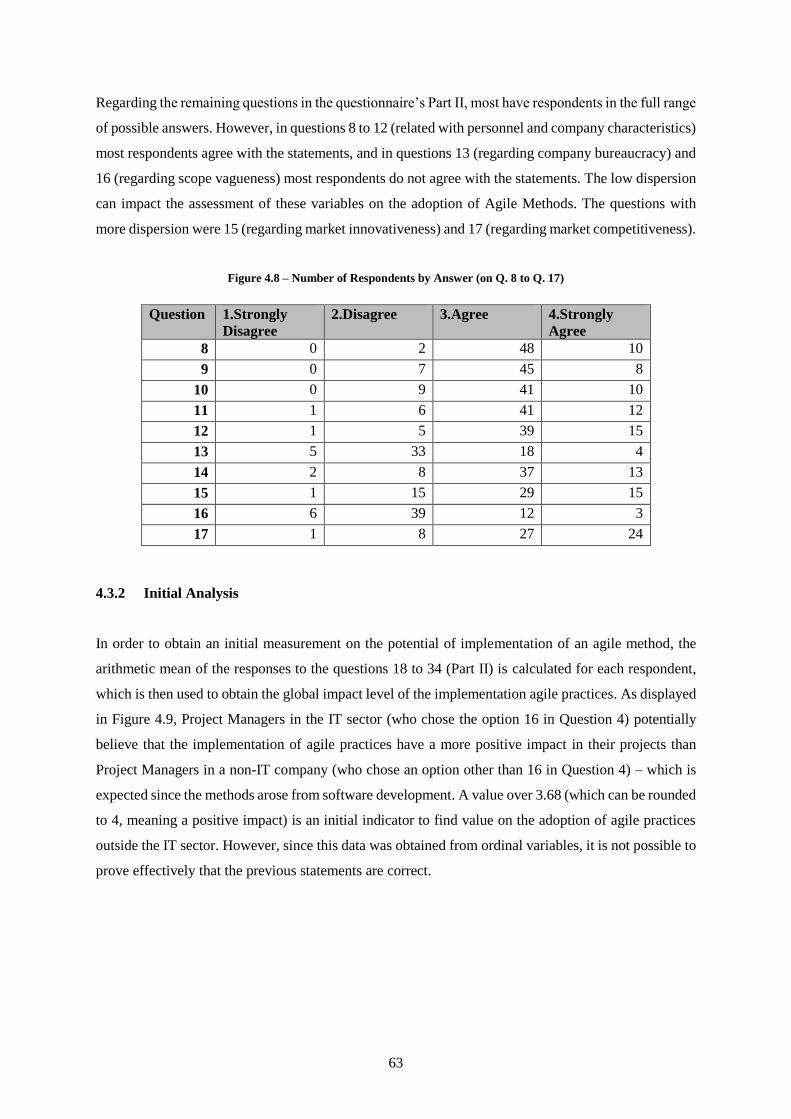
Figure 4.8 – Number of Respondents by Answer (on Q. 8 to Q. 17).................................................... 63
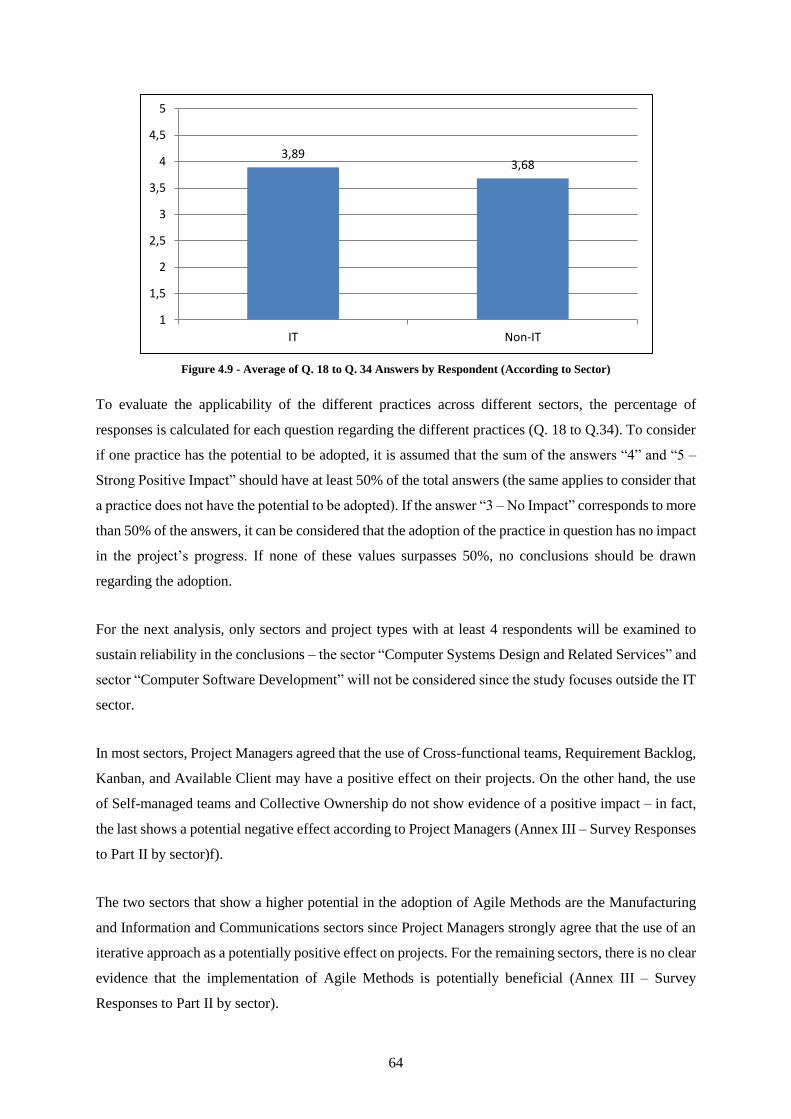
Figure 4.9 - Average of Q. 18 to Q. 34 Answers by Respondent (According to Sector) ...................... 64
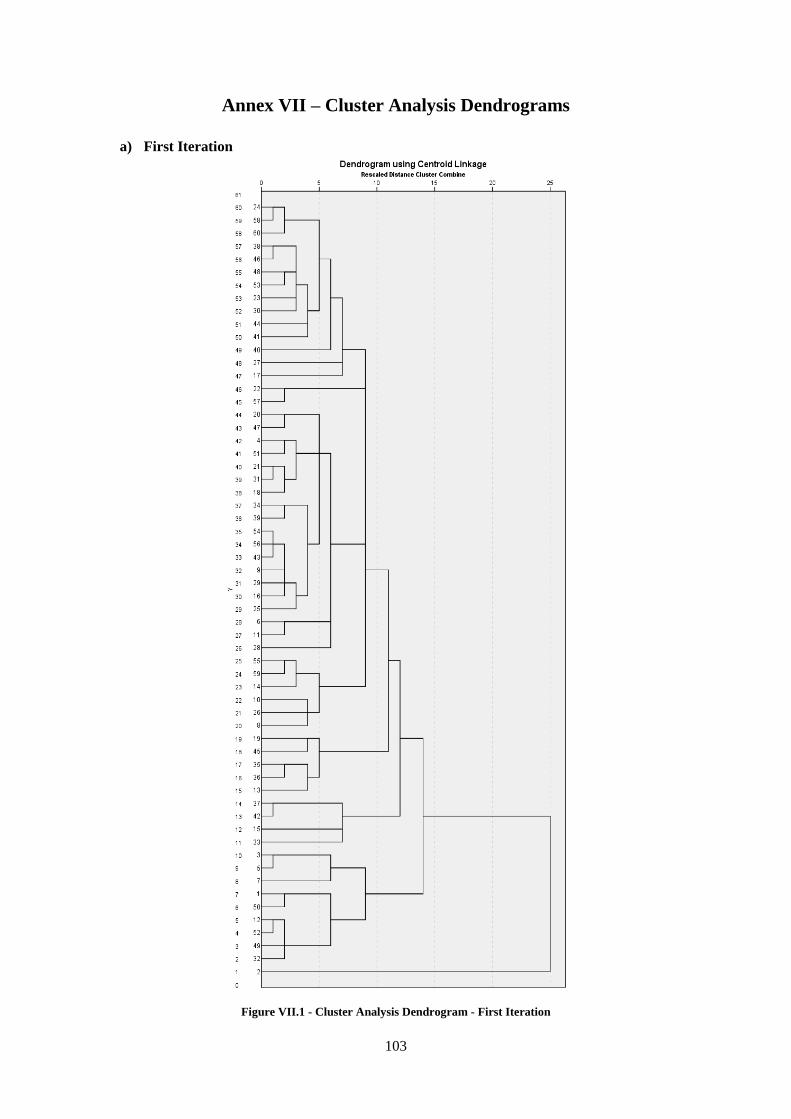
Figure VII.1 - Cluster Analysis Dendrogram - First Iteration ............................................................ 103
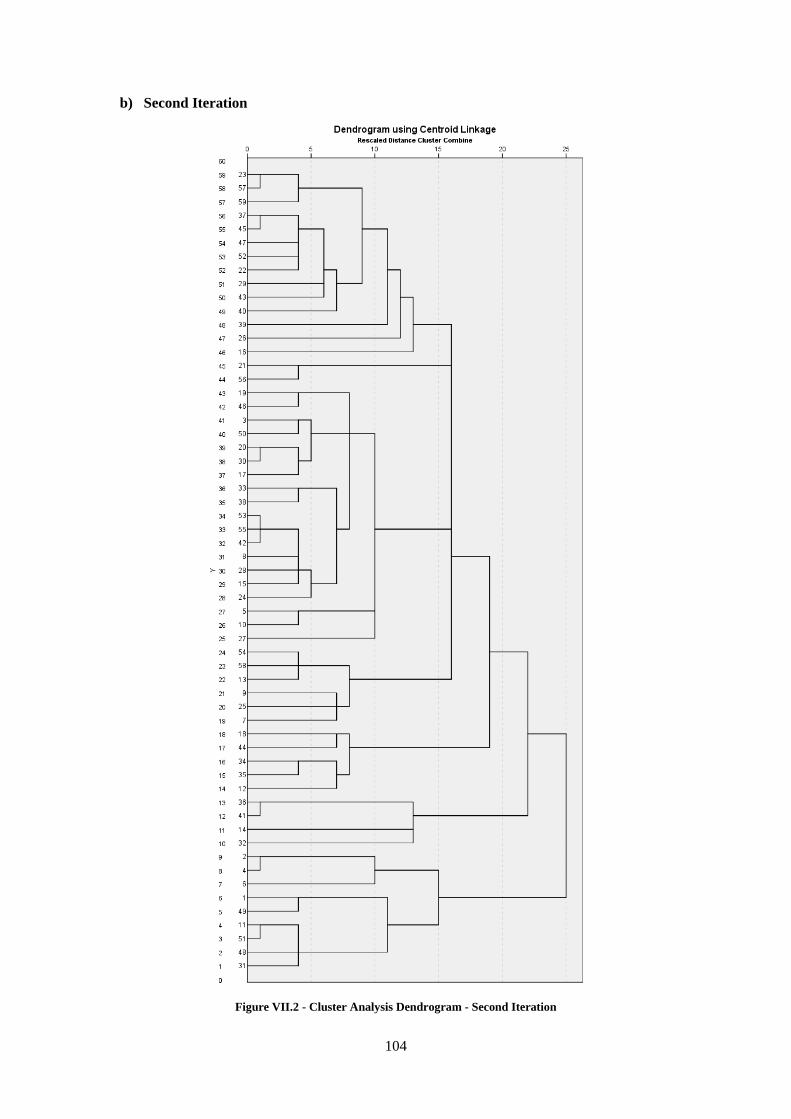
Figure VII.2 - Cluster Analysis Dendrogram - Second Iteration ........................................................ 104
Page 17
v
List of Tables
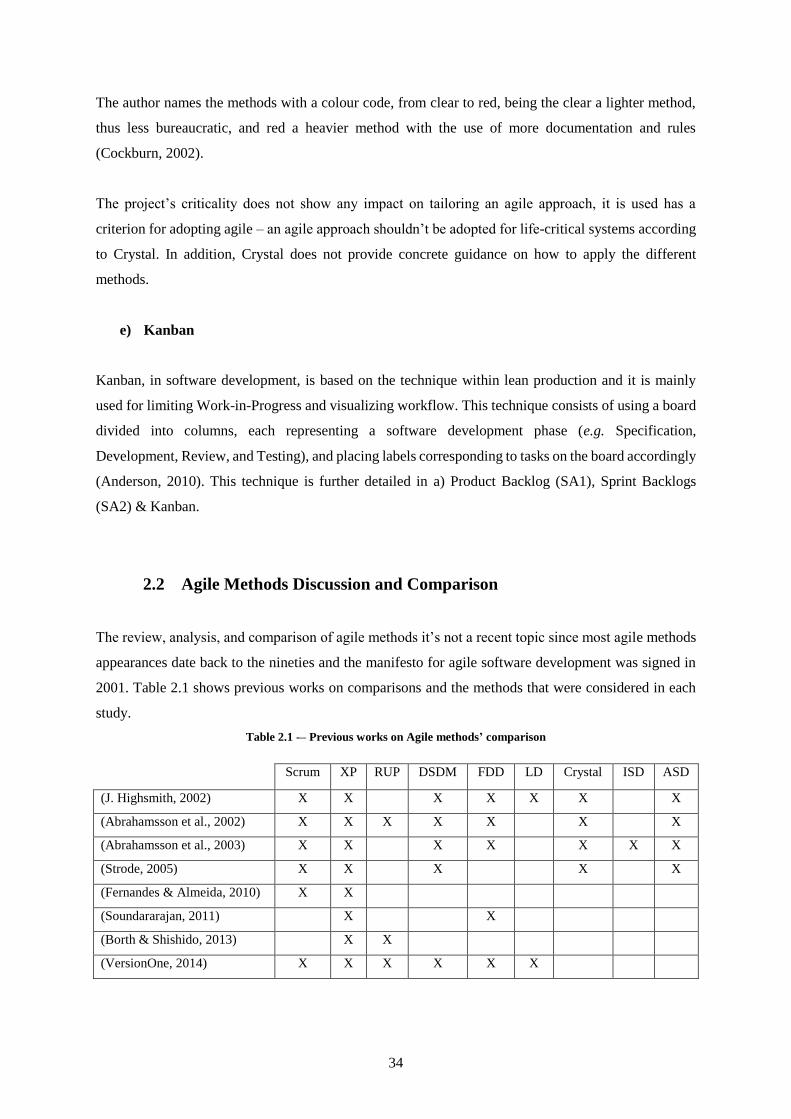
Table 2.1 -– Previous works on Agile methods’ comparison ............................................................... 34
Table 2.2 - -- Distinct Characteristics Between Agile Methods ........................................................... 36
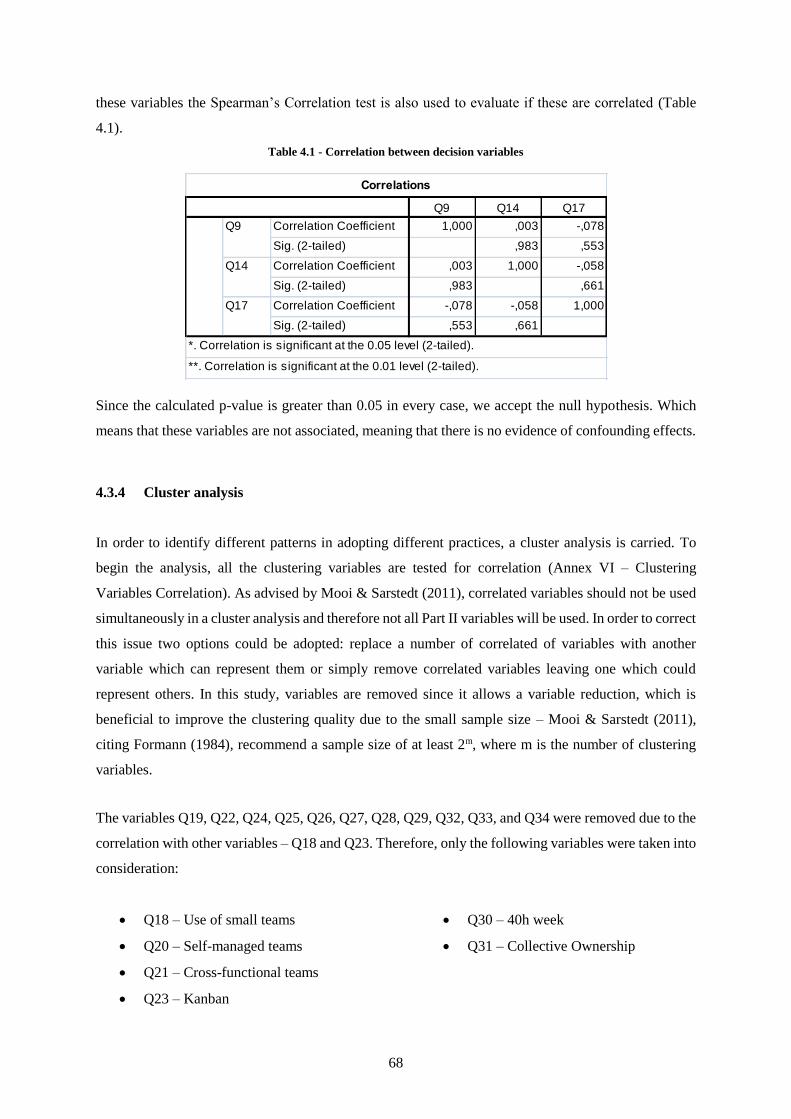
Table 4.1 - Correlation between decision variables .............................................................................. 68
Table II.1 – Responses to Part II in IT Companies ............................................................................... 86
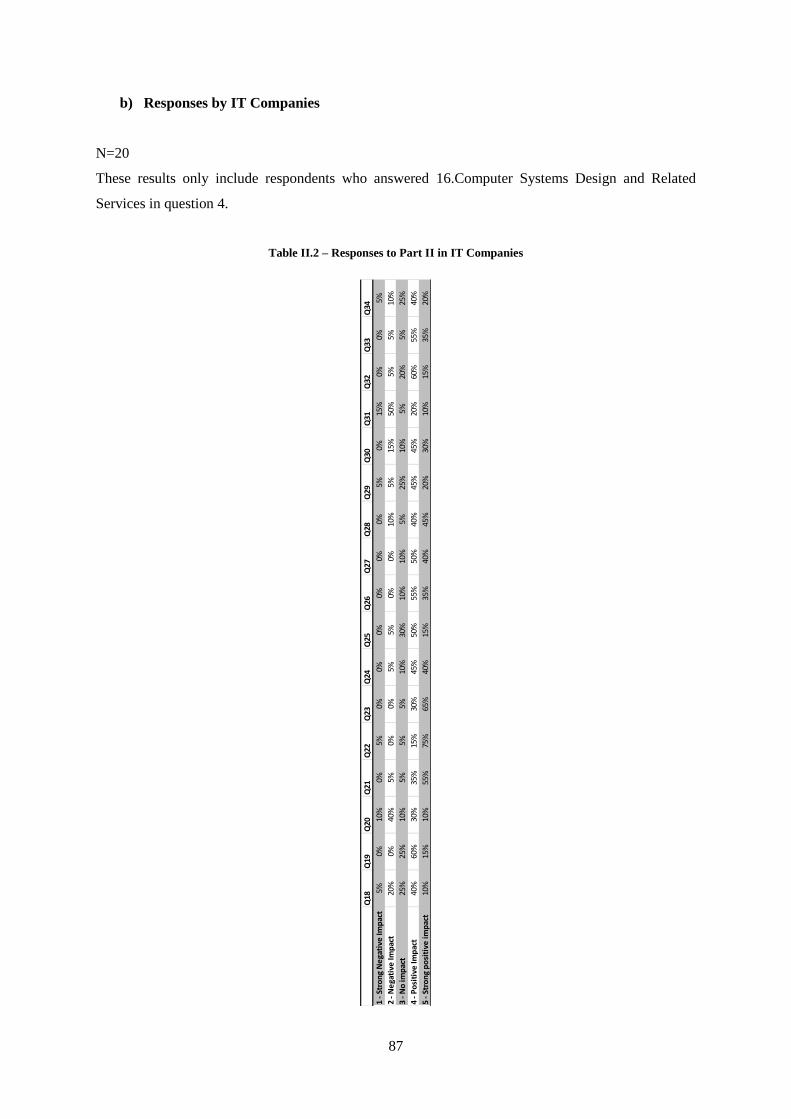
Table II.2 – Responses to Part II in IT Companies ............................................................................... 87
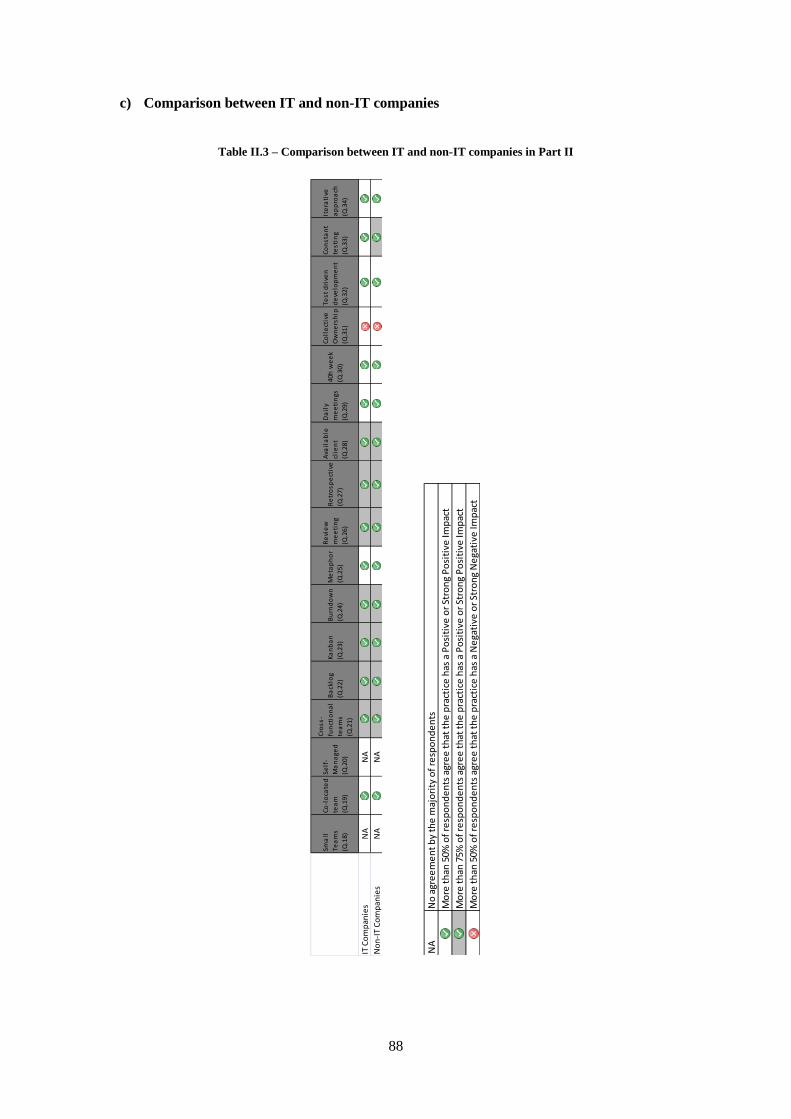
Table II.3 – Comparison between IT and non-IT companies in Part II ................................................ 88
Table III.1 – Responses to Part II in the Manufacturing sector ............................................................ 89
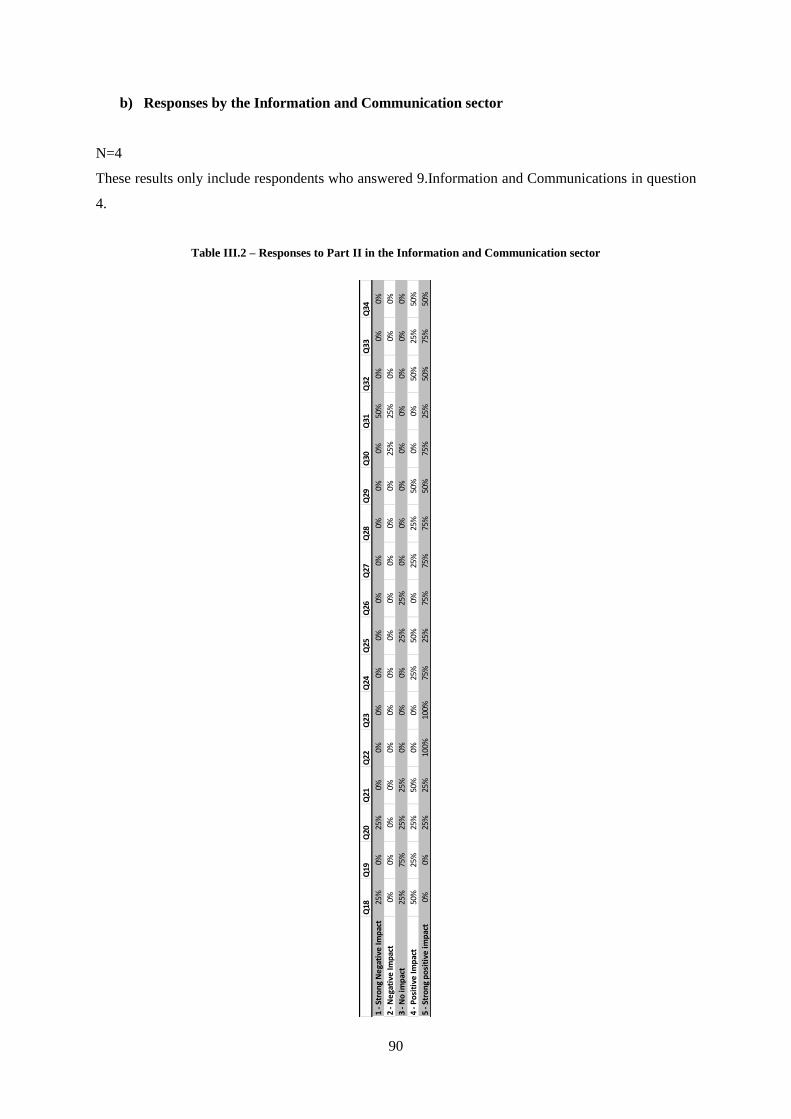
Table III.2 – Responses to Part II in the Information and Communication sector ............................... 90
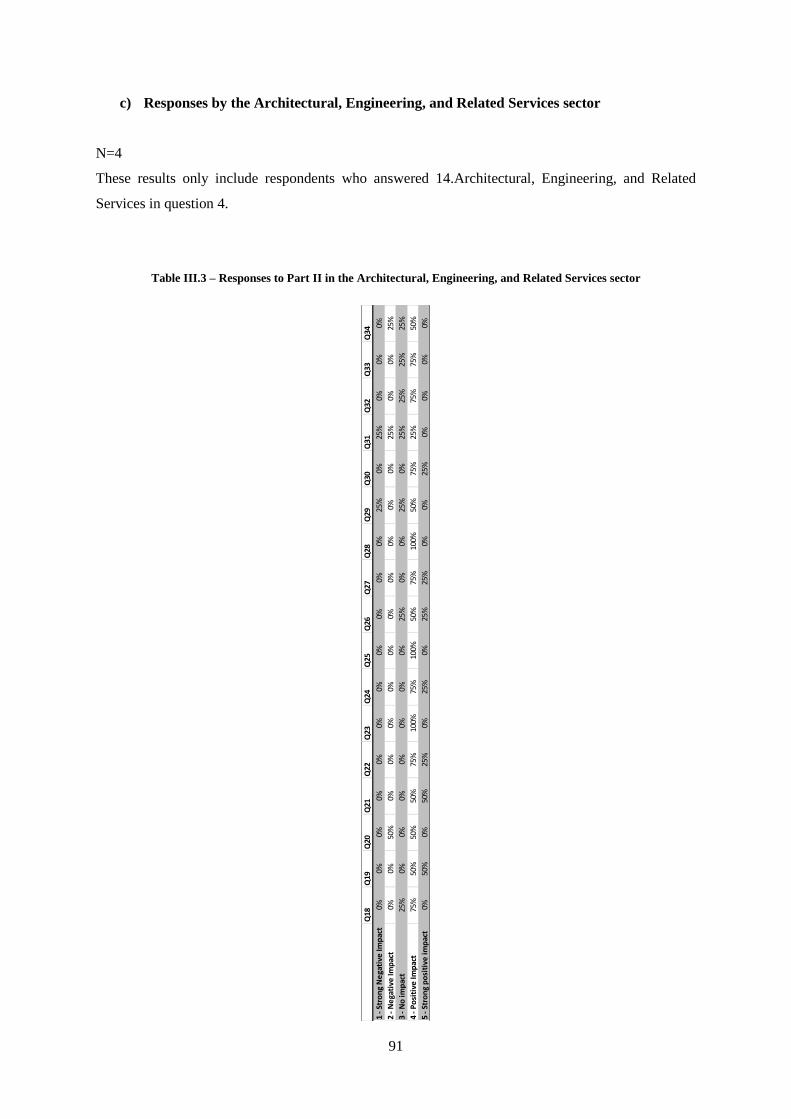
Table III.3 – Responses to Part II in the Architectural, Engineering, and Related Services sector ...... 91
Table III.4 – Responses to Part II in the Management, Scientific, and Technical Consulting Services
sector ..................................................................................................................................................... 92
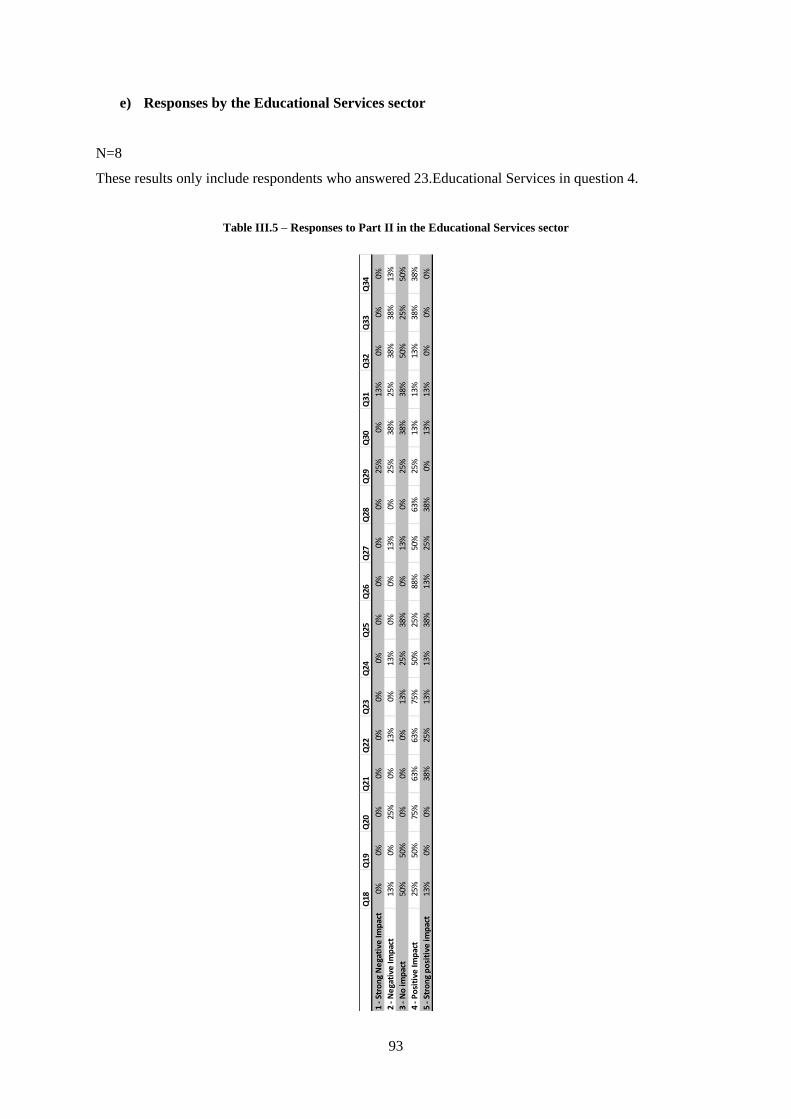
Table III.5 – Responses to Part II in the Educational Services sector .................................................. 93
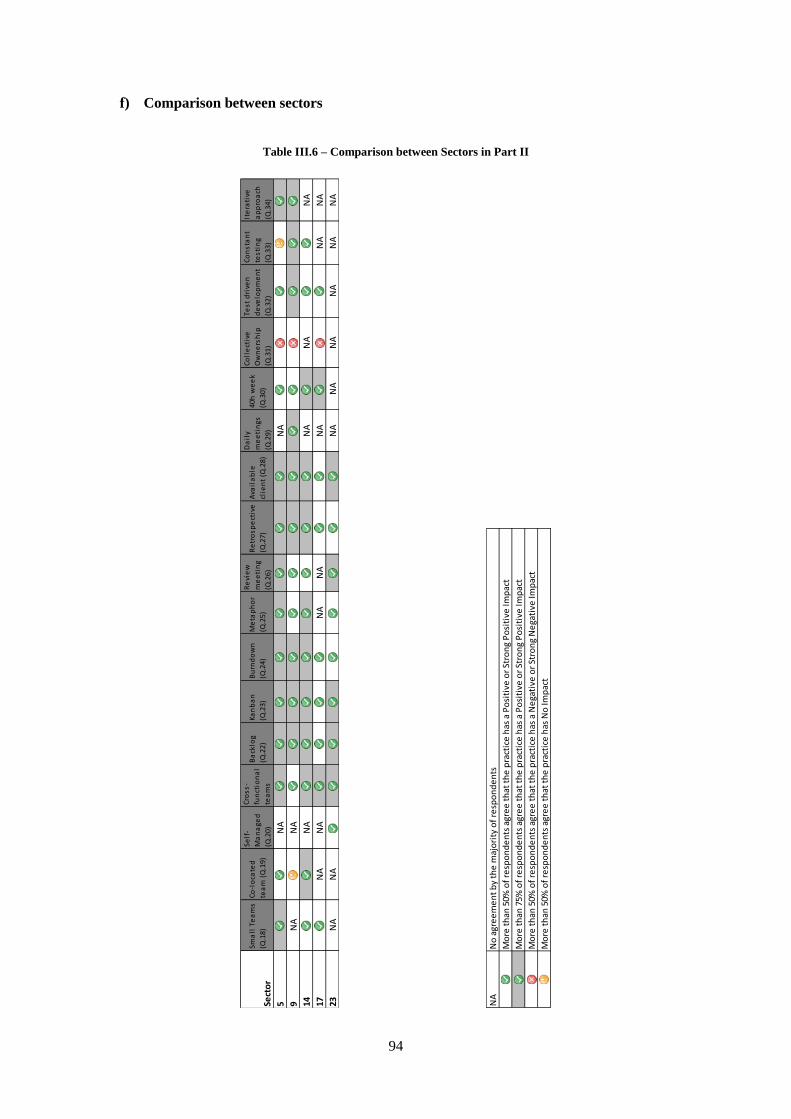
Table III.6 – Comparison between Sectors in Part II ............................................................................ 94
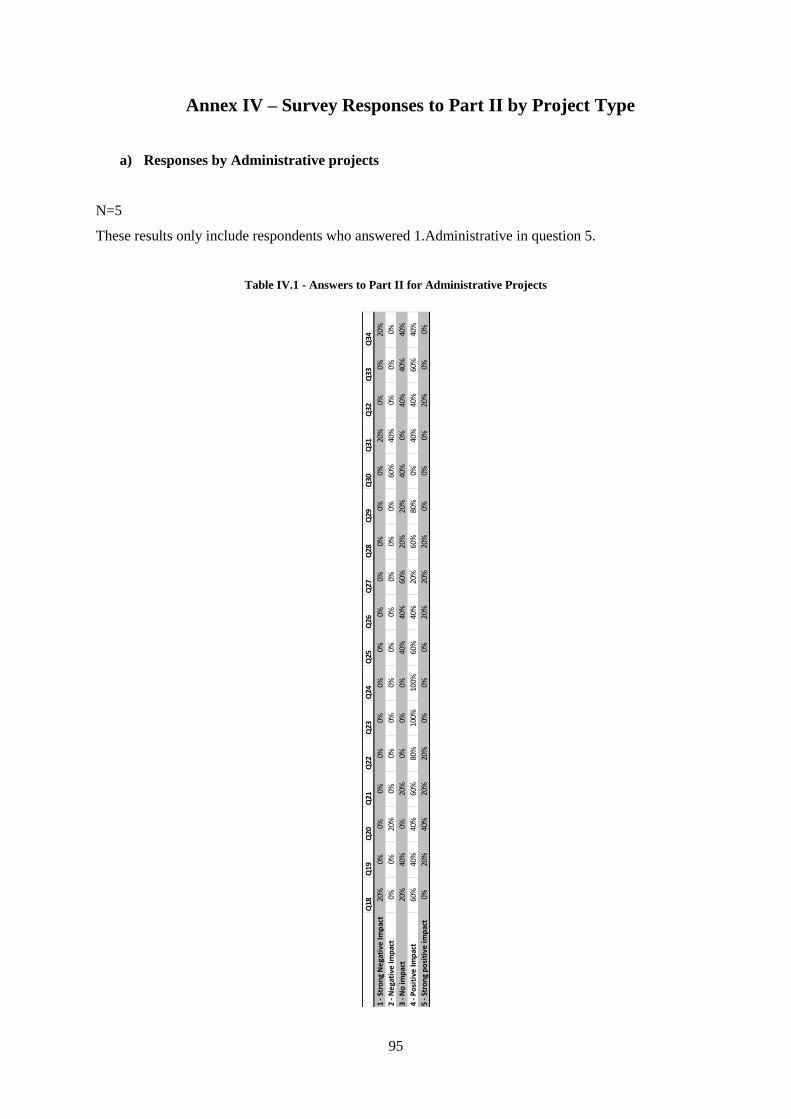
Table IV.1 - Answers to Part II for Administrative Projects ................................................................ 95
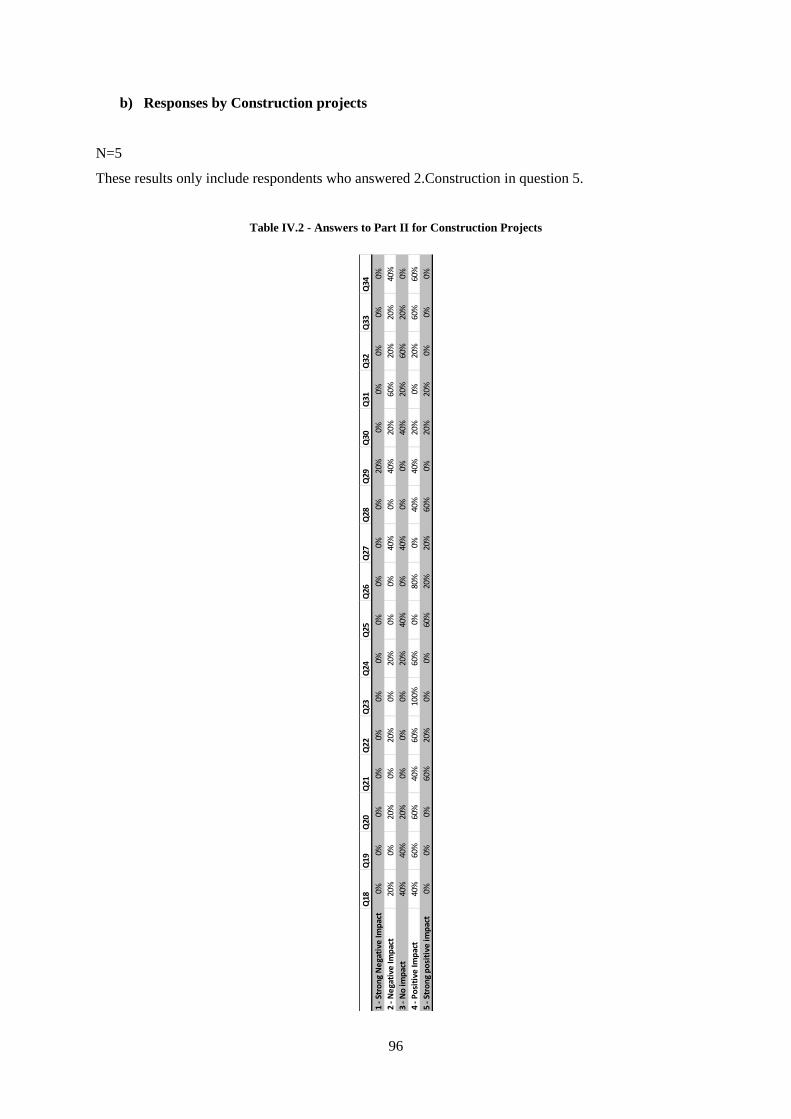
Table IV.2 - Answers to Part II for Construction Projects .................................................................... 96
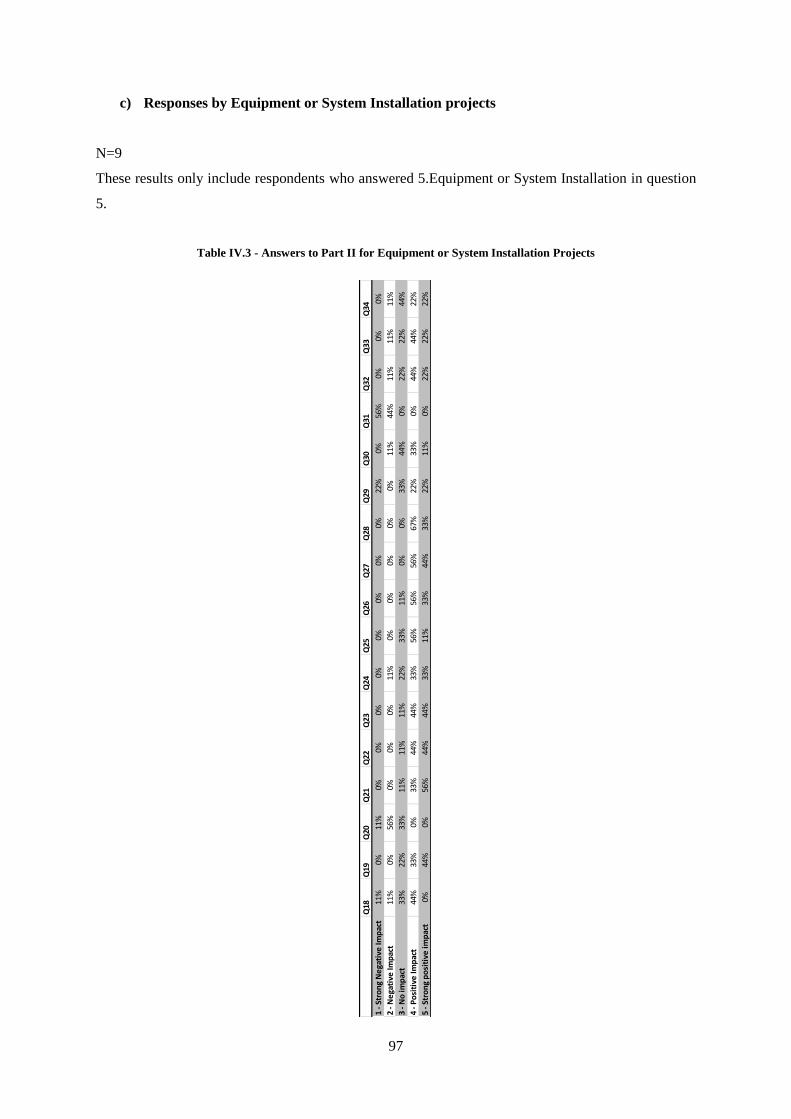
Table IV.3 - Answers to Part II for Equipment or System Installation Projects ................................... 97
Table IV.4 - Answers to Part II for New Product Development Projects ............................................. 98
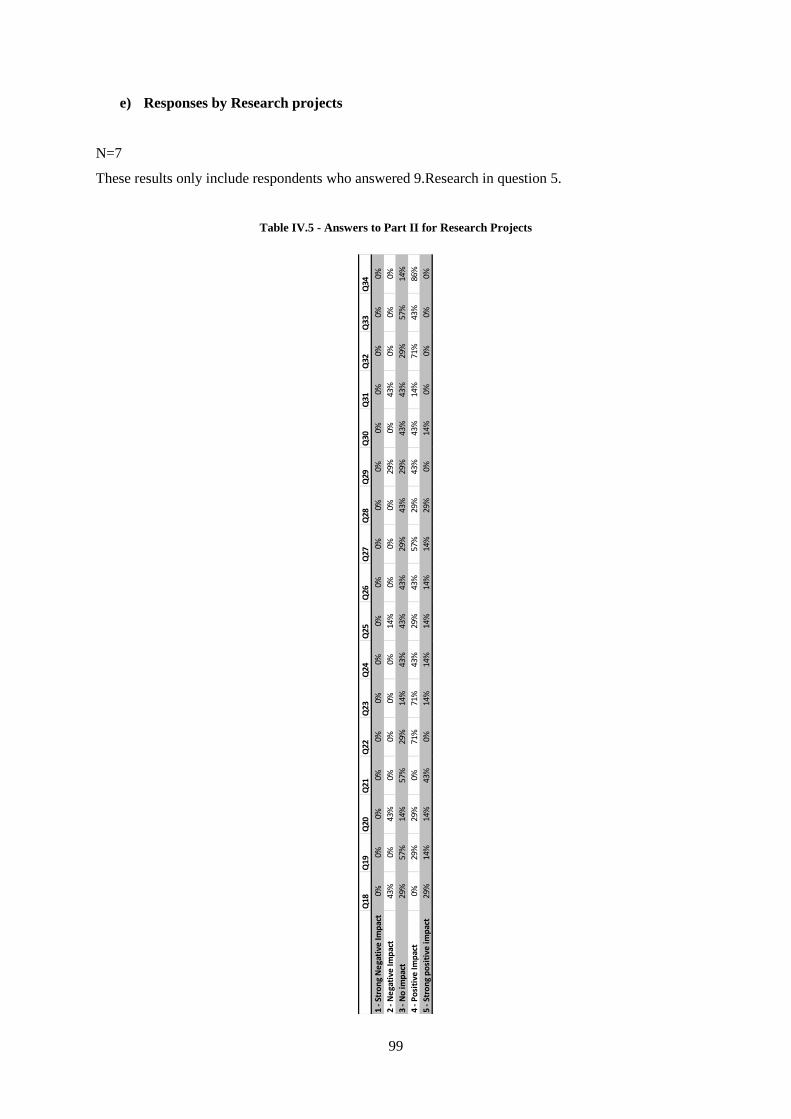
Table IV.5 - Answers to Part II for Research Projects .......................................................................... 99
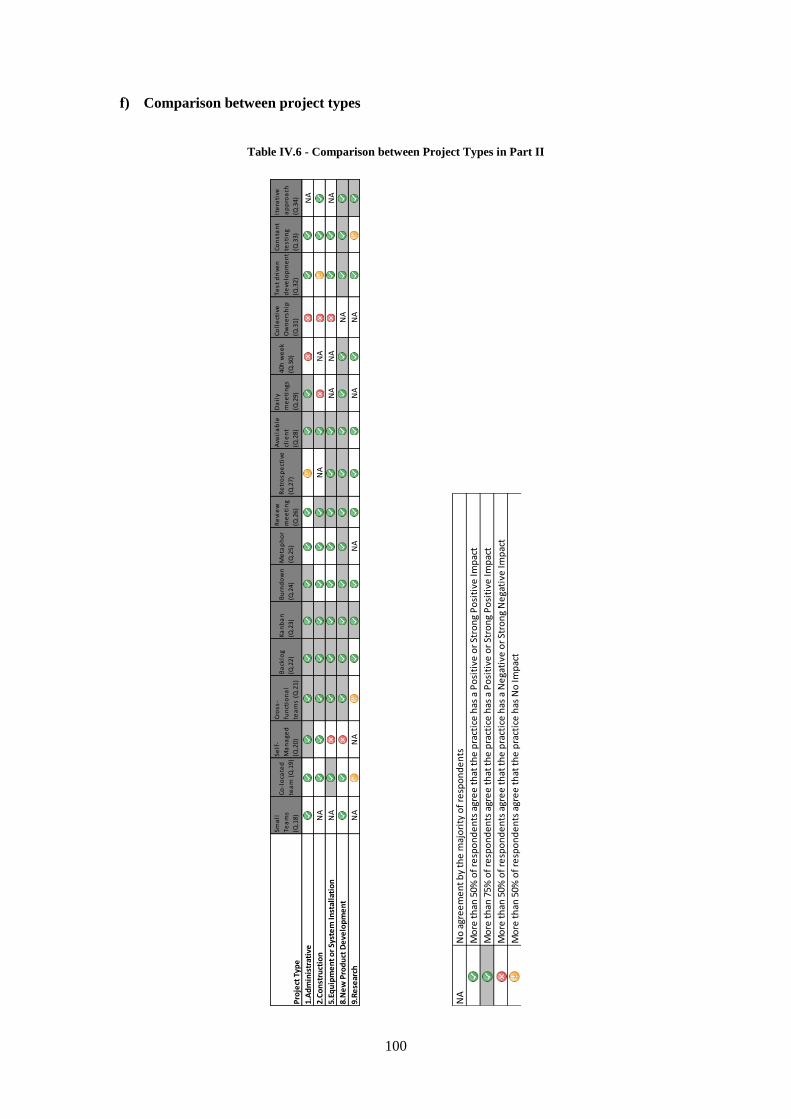
Table IV.6 - Comparison between Project Types in Part II ................................................................ 100
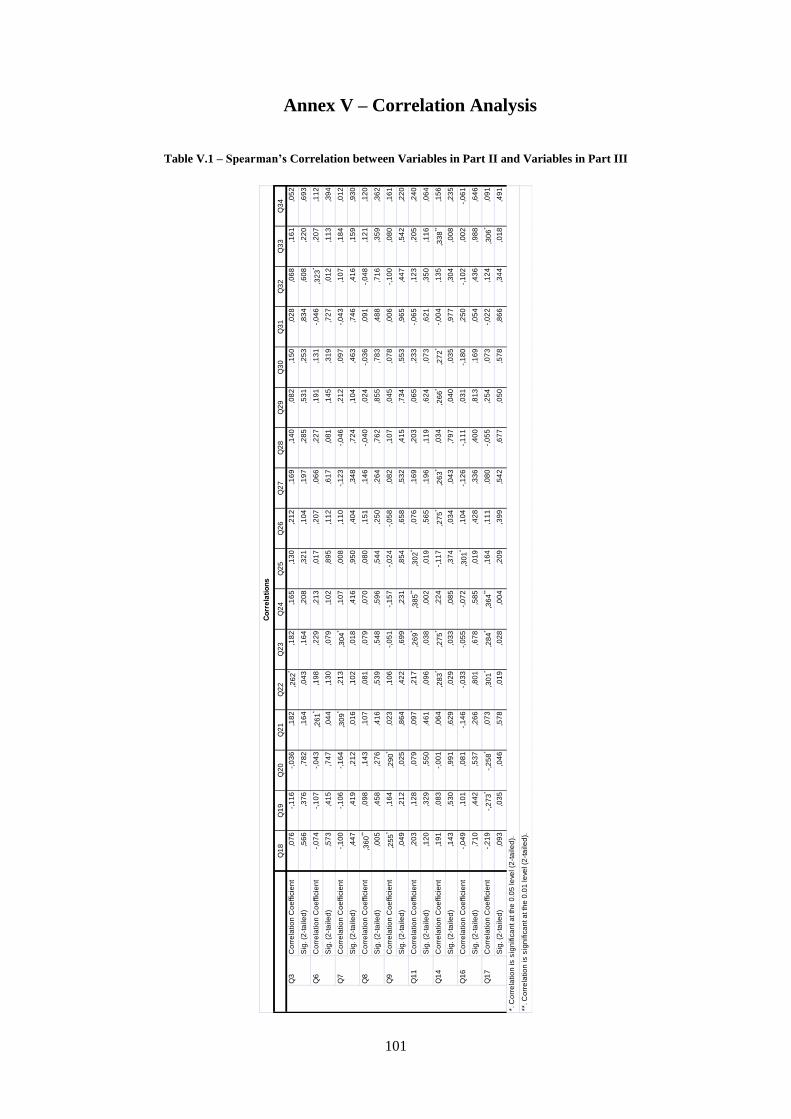
Table V.1 – Spearman’s Correlation between Variables in Part II and Variables in Part III ............. 101
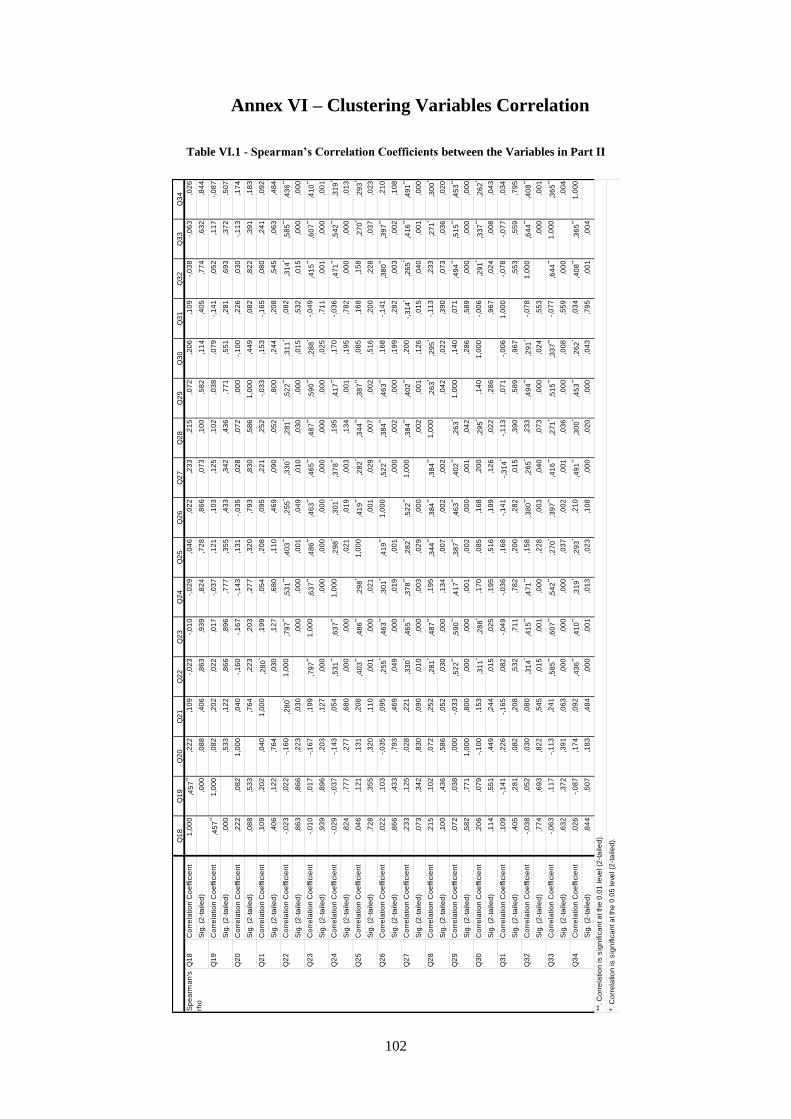
Table VI.1 - Spearman’s Correlation between the Variables in Part II .............................................. 102
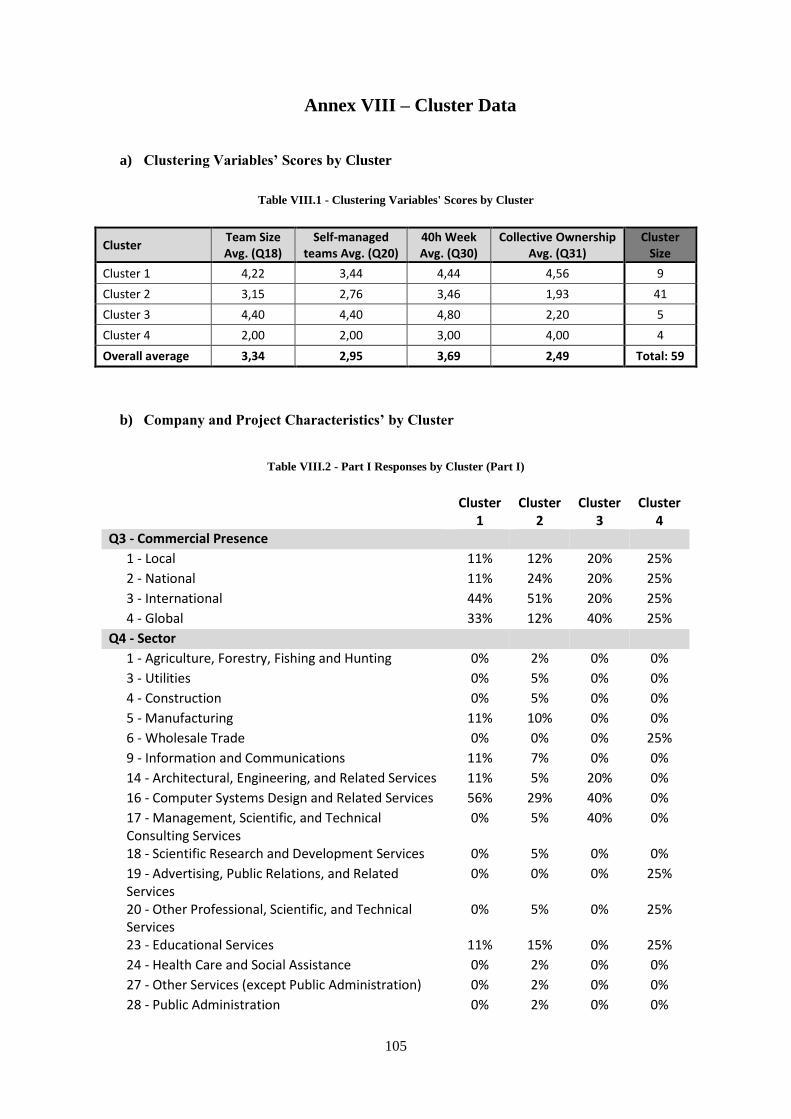
Table VIII.1 - Clustering Variables' Scores by Cluster ...................................................................... 105
Table VIII.2 - Part I Responses by Cluster (Part I) ............................................................................. 105
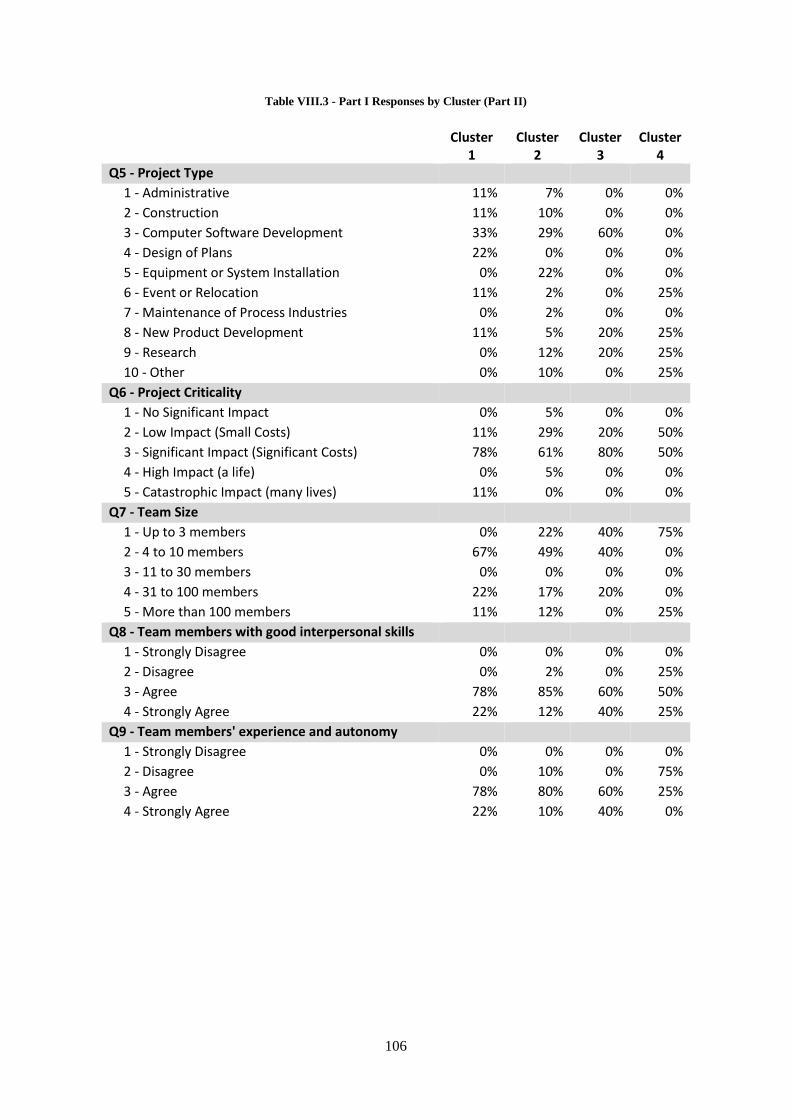
Table VIII.3 - Part I Responses by Cluster (Part II) ........................................................................... 106
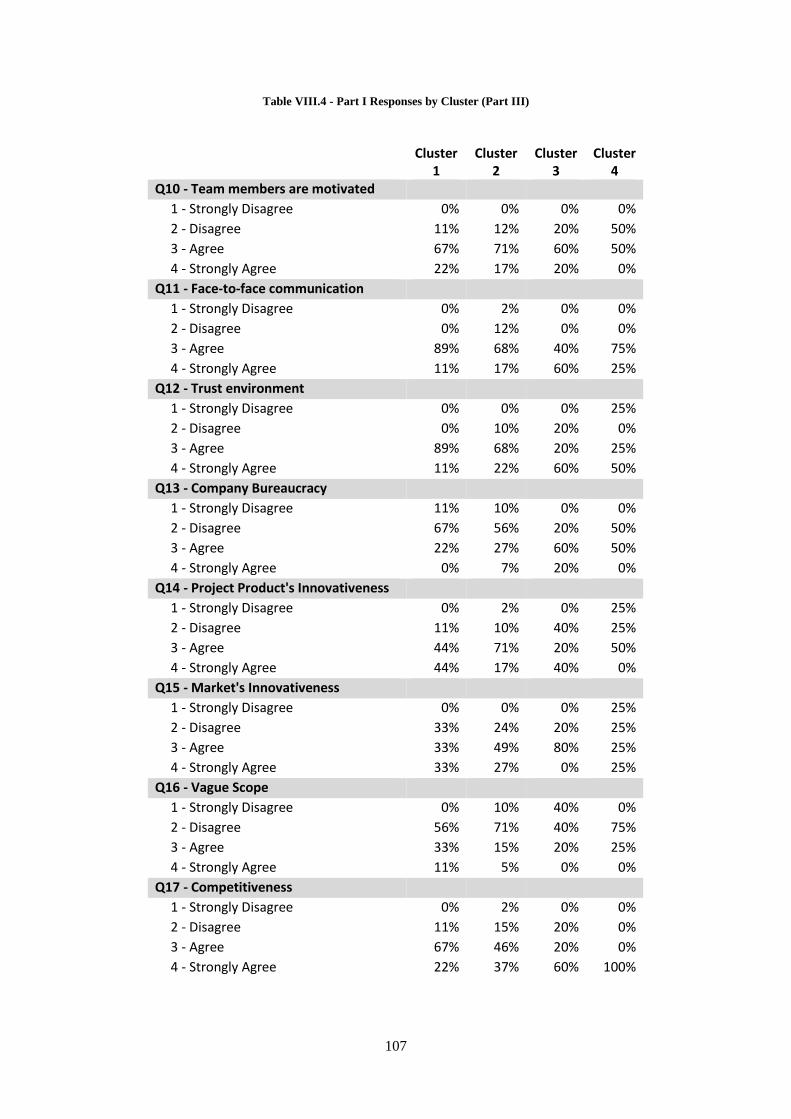
Table VIII.4 - Part I Responses by Cluster (Part III) .......................................................................... 107
Page 19
vii
List of Acronyms
ASD – Adaptive Software Development
AUP – Agile Unified Process
CPM – Critical Path Method
DSDM – Dynamic Systems Development Method
FDD – Feature Driven Development
FDDLc – Feature Driven Development’s Lifecycle
FDDPr – Feature Driven Development’s Practices
ISD – Internet-Speed Development
IT – Information Technology
LD – Lean Development
LDP – Lean Development’s Principles
PERT – Program Evaluation and Review Technique
PMBOK – Project Management Body of Knowledge
RUP – Rational Unified Process
SA – Scrum’s Artefacts
SPr – Scrum’s Practices
SRR – Scrum’s Roles and Responsibilities
XP – Extreme Programming
XPLc – Extreme Programming’s Lifecycle
XPPr – Extreme Programming’s Practices
XPRR – Extreme Programming’s Roles and Responsibilities
XPV – Extreme Programming’s Values
Page 21
1
1 Introduction
1.1 Research Context
A project, as described by the Project Management Body of Knowledge (PMBOK), is a “temporary
endeavour undertaken to create a unique product, service or result” (Project Management Institute,
2008: p. 5), whereas project management consists on “the application of knowledge, skills, tools and
techniques to project activities to meet the project requirements” (Project Management Institute, 2008:
p. 6). Projects can be acknowledged has a key business activity within an enterprise, as they are often
utilized as means of achieving an organization’s strategic plan (Project Management Institute, 2008).
Project management has been a research topic for many decades and the first significant development,
the Gantt chart, dates as far back as 1917, before project management being formalized as a business
process. The Critical Path Method (CPM) and the Program Evaluation and Review Technique (PERT),
both developed in the late 1950’s, are two other models worth mentioning since their relevance in the
field still persists from their creation. More recently, there have been two significant innovations:
Critical Chain Project Management and Agile Project Management Approaches (Hall, 2012).
Due to the fast-paced environment in which companies are nowadays emerged, changes in their
surroundings may be found during a project. Thus enterprises need to respond to this turbulence in order
to maintain competitiveness, which can be achieved by implementing processes that not only react to
change but that embrace it (Cohen & Lindvall, 2004). By embracing change in a project’s lifecycle it’s
also possible to respond to unexpected events such as a change on existing technology or a change in
business priorities.
The emergence of Agile methodologies from software development arise has a manifestation against
traditional methods, considered heavy has far has documentation goes and inapt to employ changes.
Despite their introduction in the nineties, iterative and incremental development (which is the core for
these methods) dates as far back as the mid-1950s (Larman & Basili, 2003). One of the most renowned
events in the Agile Movement, which caught the research’s community attention towards this topic,
was the Manifesto for Agile Software Development publication in 2001. This manifesto lists the values
and principles behind the Agile movement (Beck, Beedle, Bennekum, Cockburn, Cunningham, Fowler,
Grenning, Highsmith, Hunt, Jeffries, Kern, Marick, Martin, Mellor, Schwaber, Sutherland, & Thomas,
2001).
Page 22
2
P. Abrahamsson, Salo, Ronkainen, & Warsta (2002) describe Agile methods has: (1) incremental by
employing small software releases, with rapid changes; (2) cooperative by placing customer and
developers together with close communication; (3) straightforward since they’re well documented, easy
to learn and easy to modify; and (4) adaptive by allowing last moment changes.
1.2 Motivation and Scope
Despite the great interest by the scientific community towards Agile methods, especially since 2001
with the Manifesto’s publication, these methodologies still remain deeply attached to the IT sector.
Although it is possible to find studies which support the use of agile practices within other sectors
(Ribeiro & Fernandes, 2010), the scalability of agile methodologies towards Project Management still
remains unresolved, especially for larger projects (Hall, 2012).
The following work, which was proposed in order to obtain a master’s degree in Industrial Engineering
and Management at Universidade Nova de Lisboa, Faculdade de Ciências e Tecnologia, aims to answer
the following research questions:
RQ1– Which are the current Agile Project Management Approaches?
RQ2– How do current Agile Project Management Approaches compare to each other?
RQ3– Should agile methods be used in a non-IT context?
RQ3.1– Which “agile components” can be used outside the software development scope?
RQ3.2– Which sectors and project types can be considered “agile-prone”?
RQ3.3– How does a company decide whether it should adopt an agile approach or not?
1.3 Research Methodology
To begin the study, the literature on agile methods is reviewed in order to identify practices and to
compare these methods. Once the practices are identified, only those that have potential for an
implementation outside software development are then considered. In order to conclude which company
and project characteristics should be revised when adopting agile practices, an already existing
framework is reviewed. To assess the implementation of the identified practices, and the project and
company characteristics’ role in the adoption of agile methods, a survey is conducted to collect the
opinion of project managers.
Page 23
3
The present study uses both qualitative and quantitative methods, since both the literature’s review and
the survey’s execution played an important role in the study’s output. During the literature’s review,
the importance of company and project characteristics for the implementation of agile practices was
discovered.
The survey is used to validate both the implementation of different agile practices and the relevance of
the identified variables in the developed framework. This technique is used since it is more feasible
than a series of case studies due to deadline issues, despite the greater potential of the second option to
provide insights regarding the study’s goals.
1.4 Report Structure
This dissertation is composed by 6 chapters. The present one aims to introduce this study by answering
what is Agile Project Management, why there’s a drive to develop a dissertation on the adoption of
these practices outside the IT-sector, and how this study’s objectives will be accomplished.
The second chapter has the purpose to extend the knowledge on agile project management in order to
identify features which can be adopted outside the software development context. Nine different
methods are reviewed: Scrum, Extreme Programming, Feature Driven Development, Rational Unified
Process, Dynamic Systems Development Method, Internet-Speed Development, Adaptive Software
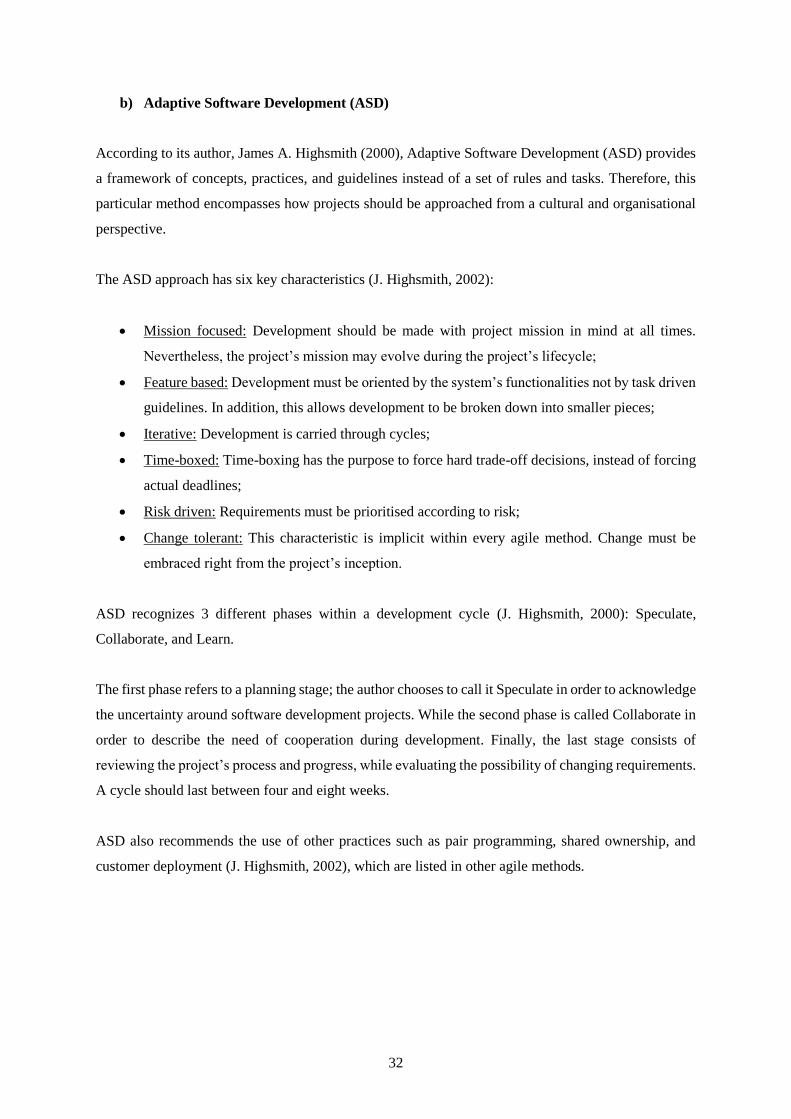
Development, Lean Development, and Crystal.
The third chapter lists the features which have the potential to be adopted outside the IT-sector. These
features are grouped in 4 different types: Cultural and Organizational Structures, Artefacts, Practices,
and Process.
The fourth chapter describes a possible framework to be used in order to support the decision of
implementing agile methods, while the fifth chapter describes the conducted survey and shows its
results.
The last chapter shows this study’s main conclusions and limitations while providing guidance for
future work regarding the implementation of agile practices outside the IT-sector.
Page 25
5
2 Literature review on Agile Project Management
Alistair Cockburn (Crystal methods’ author) denotes that “Agile implies being effective and
manoeuvrable. An Agile process is both light and sufficient.” (Cockburn, 2002: p. 146) While, Barry
Boehm (Spiral Model’s author) states that “agile methods are very lightweight processes that employ
short iteration cycles; actively involve users to establish, prioritize, and verify requirements; and rely
on tacit knowledge within a team as opposed to documentation” (Boehm & Turner, 2005: p.32).
Although there are many methods within the “Agile” line of thought, most of them share the same
principles, values, and practices. In fact, seventeen “agile pioneers” signed a manifesto in 2001 with the
purpose of defining agile software development.
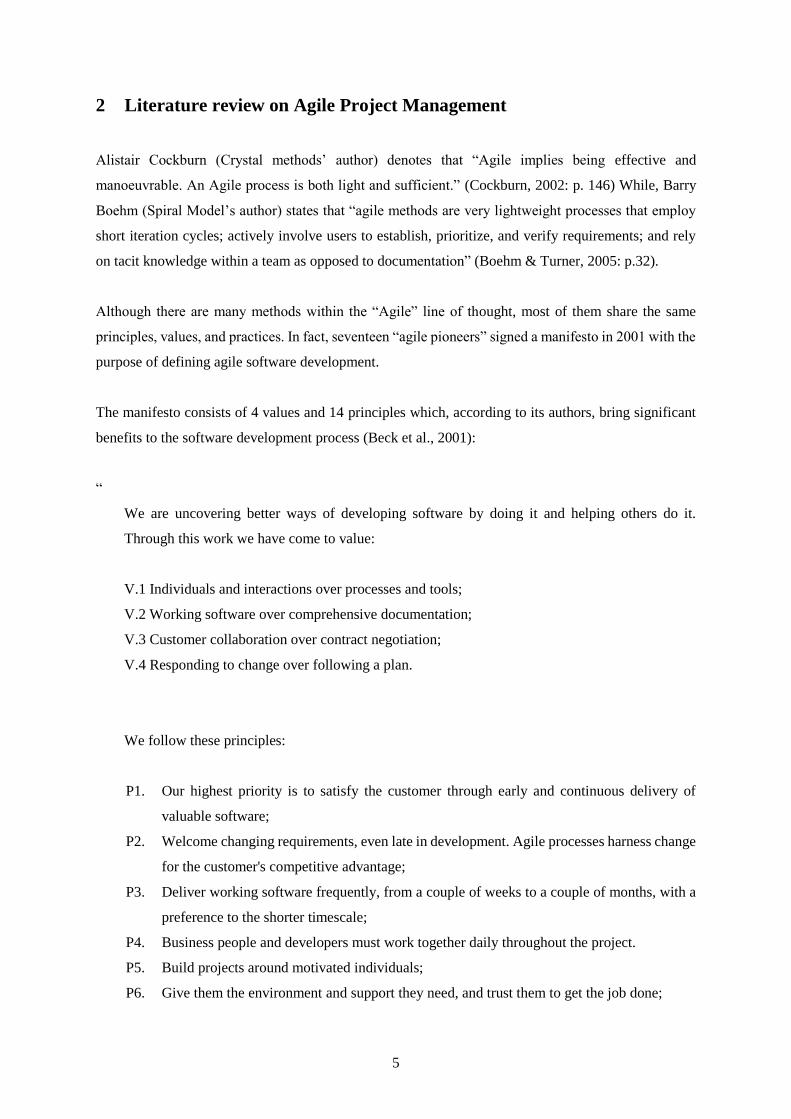
The manifesto consists of 4 values and 14 principles which, according to its authors, bring significant
benefits to the software development process (Beck et al., 2001):
“
We are uncovering better ways of developing software by doing it and helping others do it.
Through this work we have come to value:
V.1 Individuals and interactions over processes and tools;
V.2 Working software over comprehensive documentation;
V.3 Customer collaboration over contract negotiation;
V.4 Responding to change over following a plan.
We follow these principles:
P1. Our highest priority is to satisfy the customer through early and continuous delivery of
valuable software;
P2. Welcome changing requirements, even late in development. Agile processes harness change
for the customer's competitive advantage;
P3. Deliver working software frequently, from a couple of weeks to a couple of months, with a
preference to the shorter timescale;
P4. Business people and developers must work together daily throughout the project.
P5. Build projects around motivated individuals;
P6. Give them the environment and support they need, and trust them to get the job done;
Page 26
6
P7. The most efficient and effective method of conveying information to and within a
development team is face-to-face conversation;
P8. Working software is the primary measure of progress;
P9. Agile processes promote sustainable development;
P10. The sponsors, developers, and users should be able to maintain a constant pace indefinitely;
P11. Continuous attention to technical excellence and good design enhances agility;
P12. Simplicity--the art of maximizing the amount of work not done--is essential;
P13. The best architectures, requirements, and designs emerge from self-organizing teams;
P14. At regular intervals, the team reflects on how to become more effective, then tunes and
adjusts its behaviour accordingly.
“
It is also important to indicate that, in order to cope with constant change in business environments,
agile methods appeared as a reaction against traditional approaches, such as the waterfall model – a
sequential approach for software development (Larman & Basili, 2003). As Abbas, Gravell, & Wills
(2008) describe, before the development of true agile methods, researchers proposed other approaches
such as the V-Model, the Spiral model and then the Rational Unified Process (RUP). However, these
methods where considered too bureaucratic for software development environments.
This section aims to identify, describe, and compare existing methods; while selecting potential
practices and concepts that can be adopted outside a software development context.
2.1 Agile Methods
2.1.1 Scrum Approaches
The term Scrum (short for scrumming) originally derives from rugby, which is a mean of restarting play
after a minor rule infringement where both teams try to gain the ball’s possession. This by pushing to
gain ground in a formation with heads down and arms interlocked.
As referred by Abrahamsson et al. (2002), one of the first references in the literature to the term was
made by Takeuchi and Nonaka (1986) who developed an holistic approach to new product development
(facing the competitiveness between companies around it). The authors use the sport of rugby as a
metaphor: “where a team tries to go the distance as a unit, passing the ball back and forth”. The proposed
Page 27
7
approach indicates six successful management characteristics within the new product development
process in order to “move the scrum downfield” (i.e. to succeed by keeping a sustainable competitive
advantage): built-in instability, self-organizing project teams, overlapping development phases, “multi-
learning”, subtle control and organizational transfer of learning (Takeuchi & Nonaka, 1986).
As a software development process, Scrum was developed by Ken Schwaber and Jeff Sutherland in the
early 1990s to help organizations struggling with complex development projects and it’s currently one
of the most acknowledged agile methodologies (Schwaber, 2004).
One thing that must be referenced is that Scrum relies greatly on progress and development instead of
planning. Schwaber (2004), states that the minimum plan necessary to start a Scrum project consists of
a vision and a Product Backlog – detailed ahead.
In order to fully demonstrate the Scrum process, this section is divided into the description of its
artefacts, practices, and a list of its roles and responsibilities.
a) Roles and Responsibilities
SRR1 – ScrumMaster
The ScrumMaster is usually compared to a Project Manager in a typical project; however these roles
differ in terms of activities and responsibilities. Whereas a Project Manager is responsible to manage
the team, a ScrumMaster is not (the team in a Scrum project is self-managed). The ScrumMaster can
be considered a facilitator, his or hers authority is largely indirect, since he or she is responsible to
ensure that the rules and practices of Scrum are followed. Like a Project Manager, the ScrumMaster is
responsible for the project’s success, and he or she is responsible to help increasing the probability of
success by helping the Product Owner select the most valuable Product Backlog and by helping the
team turn the Product Backlog into functionality (Schwaber, 2004).
SRR2 – Product Owner
The Product Owner’s main responsibility is to decide which features and functionality to build and the
order in which to build them (Rubin, 2012). Thus, the Product Owner must be available to the
Development Team at all times, and the understanding between these subjects is a key element in the
project’s success. The common denominator between the Development Team and the Product Owner
is the Product Backlog (Schwaber, 2004).
Page 28
8
SRR3 – Development Team
The Development Team is responsible to execute the work required to the deliver the required
functionalities. As it was mentioned, the Development Team is self-managed. Thus it’s also responsible
to plan its work. With this line of thought, combined with Scrum’s reliability on face-to-face
communication and teamwork, its implementation intends to achieve synergy (Schwaber, 2004), in
order to maximize the Development Team’s efficiency.
b) Practices
SPr1 – Sprint
The Sprint is a time boxed event of 30 calendar days, where the Development Team produces a
Potentially Shippable Product Increment by completing the tasks required to obtain the functionalities
included in the Sprint Backlog. Thus, the outcome is ready to implement and to present to the project’s
stakeholders and therefore complete in terms of development, testing and documentation (Schwaber,
2004).
SPr2 – Sprint Planning Meeting
The Sprint Planning Meeting is divided into two 4-hour parts. During the first segment, the Product
Owner presents the highest priority requirements in the Product Backlog to the Development Team,
deciding what can be turned into functionality in the next Sprint with the highest Return On Investment
(ROI). During the second segment, the Development Team plans how it will turn requirements into
functionality in the next Sprint (Schwaber, 2004).
SPr3 – Daily Scrum
The Daily Scrum has the purpose to synchronize the Development Team’s work. It’s a 15 minutes
event, also time boxed, and it takes place at the same time every workday, preferably first thing in the
day. For this meeting the whole Development Team must participate. During a Daily Scrum the
ScrumMaster asks the following questions to every Development Team member (Schwaber, 2004):
What have you done since the last Daily Scrum regarding this project?
What will you do between now and the next Daily Scrum meeting regarding this project?
What impedes you from performing your work as effectively as possible?
Once a team member answers every question, the ScrumMaster immediately asks the same three
questions to the next team member. There will be no discussion or debate during the Daily Scrum. If
Page 29
9
necessary, the ScrumMaster and or Team members can discuss about the project once the Daily Scrum
is over.
SPr4 – Sprint Review Meeting
The Sprint Review Meeting is a 4 hour time-boxed event where the Development Team presents the
functionality that is done1 to the Product Owner and the project’s Stakeholders. Once the presentations
are over, stakeholders must give their impressions and discuss any desired changes, prioritizing them.
At the end of this meeting the Product Owner discusses with the stakeholders and the Development
Team a potential rearrangement of the Product Backlog, based on the feedback (Schwaber, 2004).
SPr5 – Sprint Retrospective
The Sprint Review Meeting and the Sprint Retrospective mark the end of every Sprint, both being two
distinct inspect-and-adapt activities. Whereas the sprint review meeting is used to inspect and adapt the
product, the Sprint Retrospective gives an opportunity to inspect and adapt the process (Rubin, 2012).
The Sprint Retrospective Meeting is attended by the Development Team, the ScrumMaster, and
optionally by the Product Owner. This meeting starts by having every Development Team member
answer two questions (Schwaber, 2004):
What went well during the last Sprint?
What could be improved in the next Sprint?
Once every member has answered, the Development Team prioritizes potential improvements that can
be implemented in the next Sprint.
c) Artefacts
Scrum’s artefacts provide visibility to the project’s interveners about its status in terms of progress and
future development. Scrum uses three essential artefacts: the Product Backlog, the Sprint Backlog, and
the Burndown Chart.
SA1 – Product Backlog
In essence, the Product Backlog is a list of prioritized requirements which the Product Owner and the
project’s stakeholders demand. This list is also the link that assures an effective (and also efficient)
communication between the Product Owner and the Development Team.
1 During the Sprint Review Meeting the team only shows the functionality that is done, i.e. potentially shippable.
Page 30
10
The Product Owner is responsible for both creating and managing the Product Backlog (with the
stakeholders’ and the team’s input), always reassuring that its items are placed in the correct order. To
prioritize the Product Backlog’s items one can use factors such as value, cost, knowledge, and risk
(Rubin, 2012).
SA2 – Sprint Backlog
Since the Product Backlog usually represents many months of work, the Development Team is required
to sprint multiple times during a project. During the Sprint Planning Meeting the Product Owner and
the Development Team decide what will be turned into functionality in the next sprint, thus building
the Sprint Backlog. The Development Team is responsible to determine which items it can realistically
turn into functionality by working at a sustainable pace (Rubin, 2012).
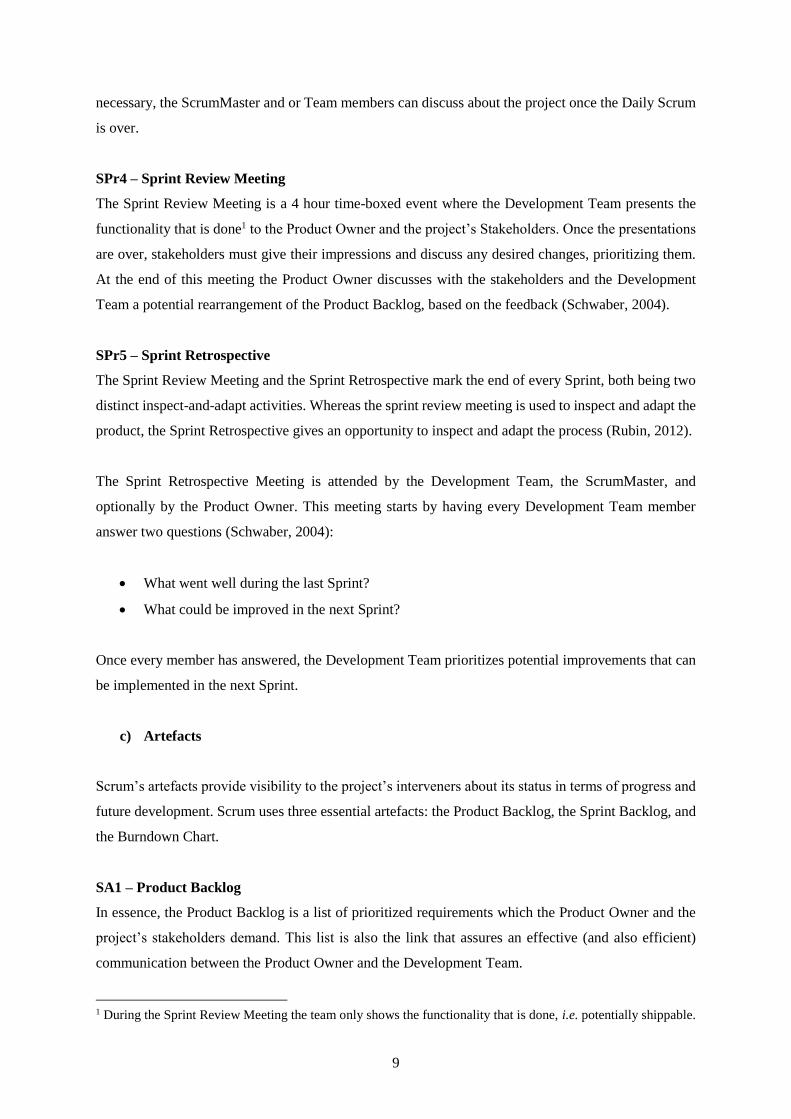
SA3 – Burndown Chart
A Burndown Chart allows the team to know how many hours of work have been completed, and also
how many hours of work remain to complete the Sprint Backlog. This chart must be updated daily and
it’s the ScrumMaster’s responsibility to ensure this.
Using this chart the team can not only track its progress but it can also predict when the Sprint Backlog’s
work will be completed, by computing a trend line on the historical data. Figure 2.1 shows a Burndown
Chart example.
Figure 2.1 – Burndown Chart Example
In the example above the team has developed 120 story points with 130 remaining. By examining the
trend line, it is expected that by the end of the 28th day the team has developed all the select story points
for the current sprint.
0
50
100
150
200
250
300
1 2 3 4 5 6 7 8 9 10 11 12 13 14 15 16 17 18 19 20 21 22 23 24 25 26 27 28 29 30
Sto
ry P
oin
ts R
em
ain
ing
Day
Sprint Burndown Chart
Page 31
11
d) Project Scaling
Although Scrum is considered best suitable for projects that don’t require too many team members,
Schwaber (2004) lists a group of mechanisms that allow the employment of multiple teams in a project,
when necessary. For this author, a project composed by more than one Scrum Team, is referred as a
scaled project. When conducting a scaled project, the architecture that will support it must be developed
beforehand and it must be complete through Sprints. Simultaneously, functionality must be developed
in every Sprint, in order to present to stakeholders afterwards (thus following Scrum rules).
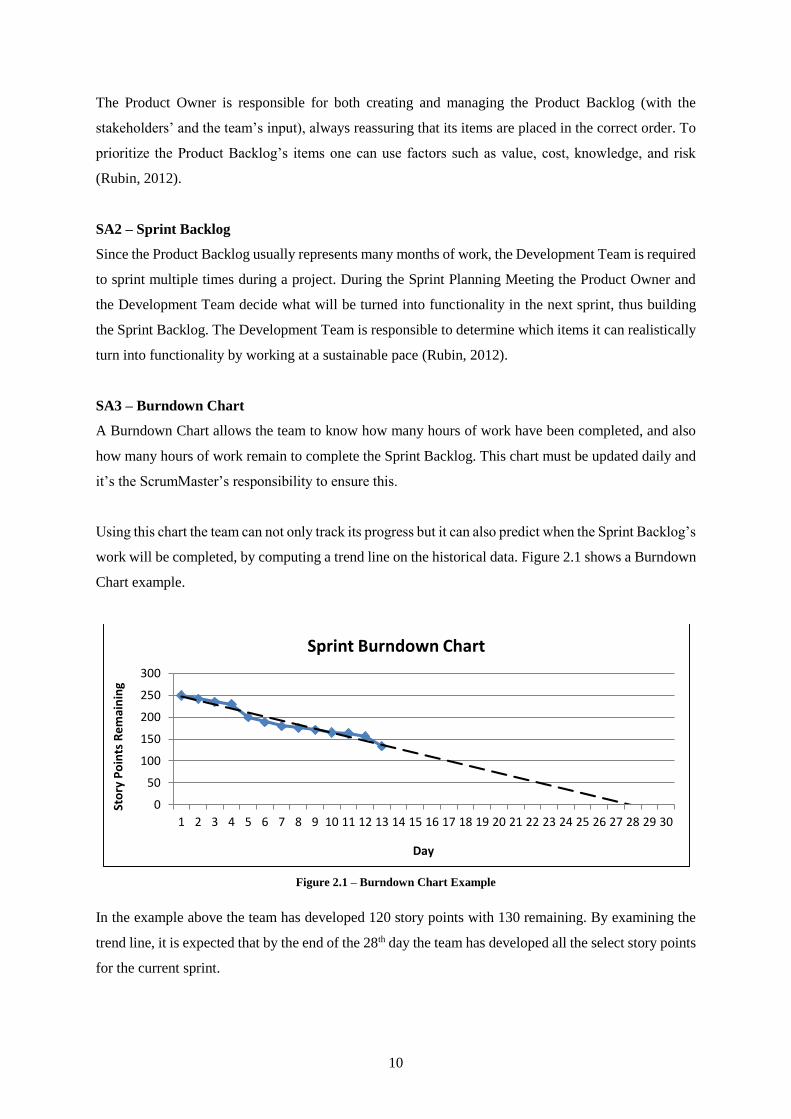
Once a scaled project begins, only one team should sprint as many times as needed in order to build the
scaling infrastructure, and its Product Backlog will include extra non-functional requirements to support
multi-team development. The process of prioritizing these requirements is called staging, it should take
one day only and it occurs before the team’s first sprint (Schwaber, 2004). Figure 2.2 illustrates a scaled
project using Scrum.
Figure 2.2 – Scaled Project Illustration
In order to synchronize the work of several teams, a scaled project usually involves daily Scrum of
Scrums meetings. These meetings are attended by each team’s designated delegate in order to
coordinate inter-team work. Although the Scrum of Scrums meeting can be attended by only one
representative, more than one Development Team member can attend. In a scaled project it’s also
common to split the Sprint Backlog by the project’s teams. The Scrum of Scrums meeting is similar to
the Daily Scrum meeting, where every member answers three questions. Since in a Scrum of Scrums
Page 32
12
meeting every member represents one team, every attendant must answer the following questions
(Rubin, 2012):
What has my team done since we last met that could affect other teams?
What will my team do before we meet again that could affect other teams?
What problems is my team having that it could use help from other teams to resolve?
Scaling practices collide with some Agile principles, such as:
P4. “Business people and developers must work together daily through the project.”
P7. “The most efficient and effective method of conveying information to and within a
development team is face-to-face conversation.”
P13. “The best architectures, requirements, and designs emerge from self-organizing teams.”
However, a project that requires more than one team is, usually, rather complex, thus in order to prevent
chaos some hierarchy should be installed.
2.1.2 Extreme Programming
Extreme Programming, or XP, was developed by Kent Beck in 1999 and it can be described as a set of
best-practices for software development (Abrahamsson, Warsta, Siponen, & Ronkainen, 2003).
According to Beck (1999), XP stands on four values:
XPV1 – Communication: One of XP’s main objectives is to keep the right communications
flowing;
XPV2 – Simplicity: By using XP, the team must always think if a certain solution is the
simplest to solve a problem;
XPV3 – Feedback: Having concrete feedback allows the team to increase its understanding of
the project and to improve its confidence;
XPV4 – Courage: The author defines courage mostly as not having fear to take decisions,
especially when it’s necessary to throw away previous work.
This subchapter is divided into three parts (Practices, Project Lifecycle, and Project Roles) in order to
explain this method.
Page 33
13
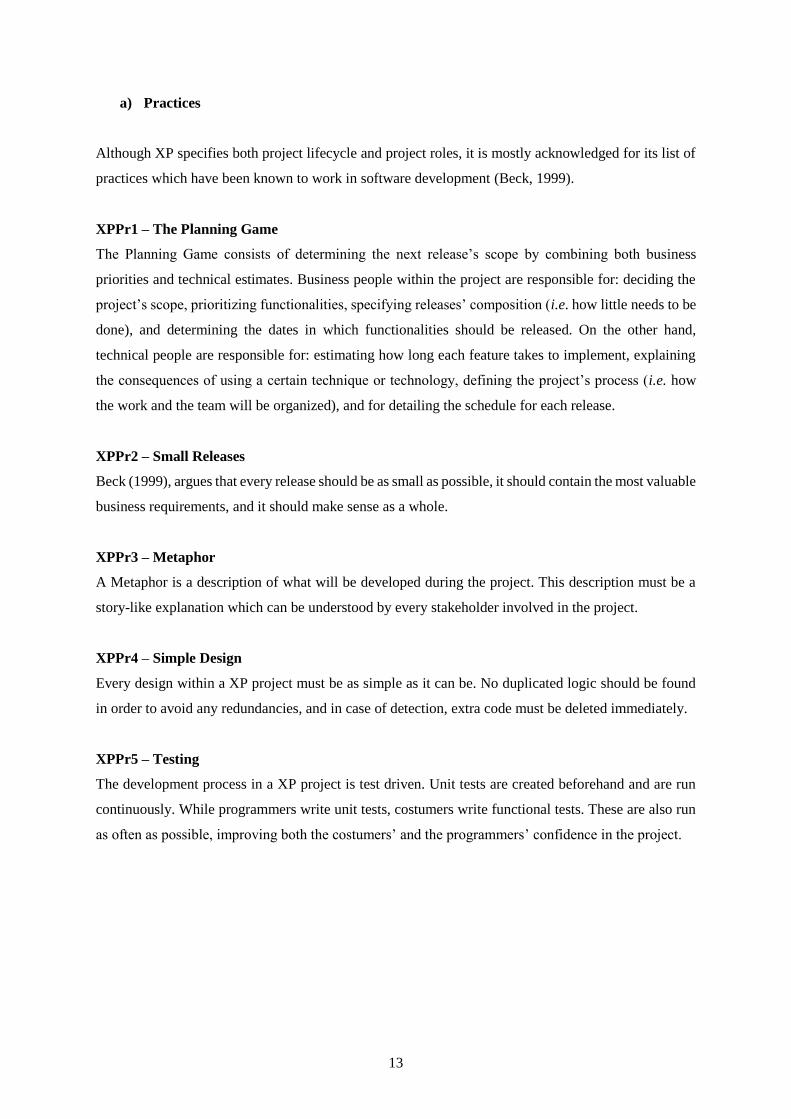
a) Practices
Although XP specifies both project lifecycle and project roles, it is mostly acknowledged for its list of
practices which have been known to work in software development (Beck, 1999).
XPPr1 – The Planning Game
The Planning Game consists of determining the next release’s scope by combining both business
priorities and technical estimates. Business people within the project are responsible for: deciding the
project’s scope, prioritizing functionalities, specifying releases’ composition (i.e. how little needs to be
done), and determining the dates in which functionalities should be released. On the other hand,
technical people are responsible for: estimating how long each feature takes to implement, explaining
the consequences of using a certain technique or technology, defining the project’s process (i.e. how
the work and the team will be organized), and for detailing the schedule for each release.
XPPr2 – Small Releases
Beck (1999), argues that every release should be as small as possible, it should contain the most valuable
business requirements, and it should make sense as a whole.
XPPr3 – Metaphor
A Metaphor is a description of what will be developed during the project. This description must be a
story-like explanation which can be understood by every stakeholder involved in the project.
XPPr4 – Simple Design
Every design within a XP project must be as simple as it can be. No duplicated logic should be found
in order to avoid any redundancies, and in case of detection, extra code must be deleted immediately.
XPPr5 – Testing
The development process in a XP project is test driven. Unit tests are created beforehand and are run
continuously. While programmers write unit tests, costumers write functional tests. These are also run
as often as possible, improving both the costumers’ and the programmers’ confidence in the project.
Page 34
14
XPPr6 – Refactoring
Refactoring consists of restructuring existing code by turning it simpler or by deleting duplication,
without changing the code’s behaviour.
XPPr7 – Pair Programming
In XP projects two people write code using one computer. While one is writing the other is constantly
thinking if the chosen approach is going to work and if the system can somehow be simplified. During
development pairs don’t stand static; they can actually change during a workday.
XPPr8 – Collective Ownership
Everybody has access to every part of the system, which allows anybody to improve existing code when
possible. This practice turns everyone responsible for the whole system.
XPPr9 – Continuous Integration
Code should be integrated into the system as soon as it is ready. The whole system must be tested in
order to accept any changes.
XPPr10 – 40 Hour Week
A team must work a maximum of 40 hours per week. Overtime is allowed but it cannot happen two
weeks in a row. If overtime is required for two weeks in a row it must be viewed as a problem to be
solved.
XPPr11 – On-Site Costumer
The project’s costumer has to be present and available for the team. The costumer should be someone
who will actually use the system in the future.
XPPr12 – Coding Standards
In order to ease collective coding, the team must establish coding standards. The standards incorporate
using the simplest code possible and avoiding redundancies. Communication must also be emphasized
during development.
Page 35
15
b) Project Lifecycle
A typical XP project can be divided into 6 distinct phases (Beck, 1999): Exploration, Planning,
Iterations to First Release, Productionizing, Maintenance, and Death. Figure 2.3 illustrates the lifecycle
of a XP project.
Figure 2.3 – XP Lifecycle
XPLc1 – Exploration
During the exploration phase costumers write story cards and programmers try to become familiarized
with the technology, the tools and the practices they’ll be using during development. The exploration
phase is over when the costumer is satisfied with the number of user stories for a first release and the
programmers feel confident about their understanding of the technology, the tools and the practices that
will be used during the project.
XPLc1 – Planning
The planning phase is where the Planning Game takes place, where costumers and programmers agree
on a date by which the smallest, most valuable set of stories will be done (Beck, 1999).
Page 36
16
XPLc2 – Iterations to First Release
The schedule for the first release must be broken into one to four-week iterations, where each will
produce a set of functional test cases linked to a story card. The first iteration must put the architecture
in place and the subsequent ones must be prioritized by their value for the costumer.
XPLc3 – Productionizing
Productionizing marks the end of a release, where the team certifies that the software is ready for
production. Thus extra checking and testing take place during this phase. During this phase the feedback
cycle must be tightened, i.e. instead of having three-week iterations, for example, the team can start
doing one week iterations.
XPLc4 – Maintenance
This phase consists of evolving the system while keeping it running. This phase consists of multiple
iteration cycles which start with an exploration phase. The team can review story cards that weren’t
implemented in the last iteration and costumers can also write new story cards.
XPLc5 – Death
Once the costumer is satisfied with the system and cannot write any new story cards, development
comes to an end. This final phase consists of documenting a tour of the system.
The project can also come to an end if the system is not delivering, the customer needs features which
cannot be implemented economically or if the defect rate rises to an excessive level.
c) Roles and Responsibilities
XP also has its own list of roles and responsibilities for a project team. They are (Beck, 1999):
Programmer, Customer, Tester, Tracker, Coach, Consultant and “Big Boss”.
XPRR1 – Programmer
Programmers are responsible for writing code as simple as possible and for writing and running unit
tests. They must always have in mind that communication and coordination with other team members
is crucial for the project’s success.
Page 37
17
XPRR2 – Customer
The costumer is responsible for writing and prioritizing user stories, writing functional tests testers.
Since costumers “know what to program” it’s best if they’re the ones that will be using the system
afterwards.
XPRR3 – Tester
The tester is responsible for helping the costumer write functional tests, running all tests regularly, for
broadcasting test results, and making sure that the testing tools run well.
XPRR4 – Tracker
Tracker gives feedback on the project’s process. He traces the accuracy of previous estimates while
giving feedback on how to improve them. The tracker also evaluates if the iteration’s goal is reachable
with the existing resources and if any changes must be made in the process.
XPRR5 – Coach
It is the coach’s responsibility to ensure that the team understands and follows the XP process. Since he
is responsible for the process as a whole, he is also responsible for understanding XP more deeply than
his team.
XPRR6 – Consultant
Sometimes the team gets stuck and needs deep technical knowledge. The consultant is an external
member with a great technical expertise that can help the team when necessary.
XPRR7 – Big Boss
The Big Boss is the project’s manager. He’s responsible for making important decisions and for keeping
a constant communication with the team in order to determine the project’s state, and to find any
problems with the process.
2.1.3 Feature Driven Development
Feature-Driven Development (FDD) is an approach for producing systems which provides methods,
techniques and guidelines to deliver the final product and support the information distribution for every
stakeholder in a project (Palmer & Felsing, 2002). Abrahamsson et al. (2002), argues that FDD was
first reported in (Coad, de Luca, & Lefebvre, 1999) and further developed by Jeff Luca, Peter Coad and
Stephen Palmer (Abrahamsson et al., 2002).
Page 38
18
FDD is branded as a method that: is highly iterative, emphasises quality at each step, delivers frequent
tangible results, and that provides accurate progress and status information with minimum disruption
(Palmer & Felsing, 2002).
This next subchapter is divided into 3 topics – roles practices, and process – since Palmer & Felsing
(2002) explain FDD using these distinct elements.
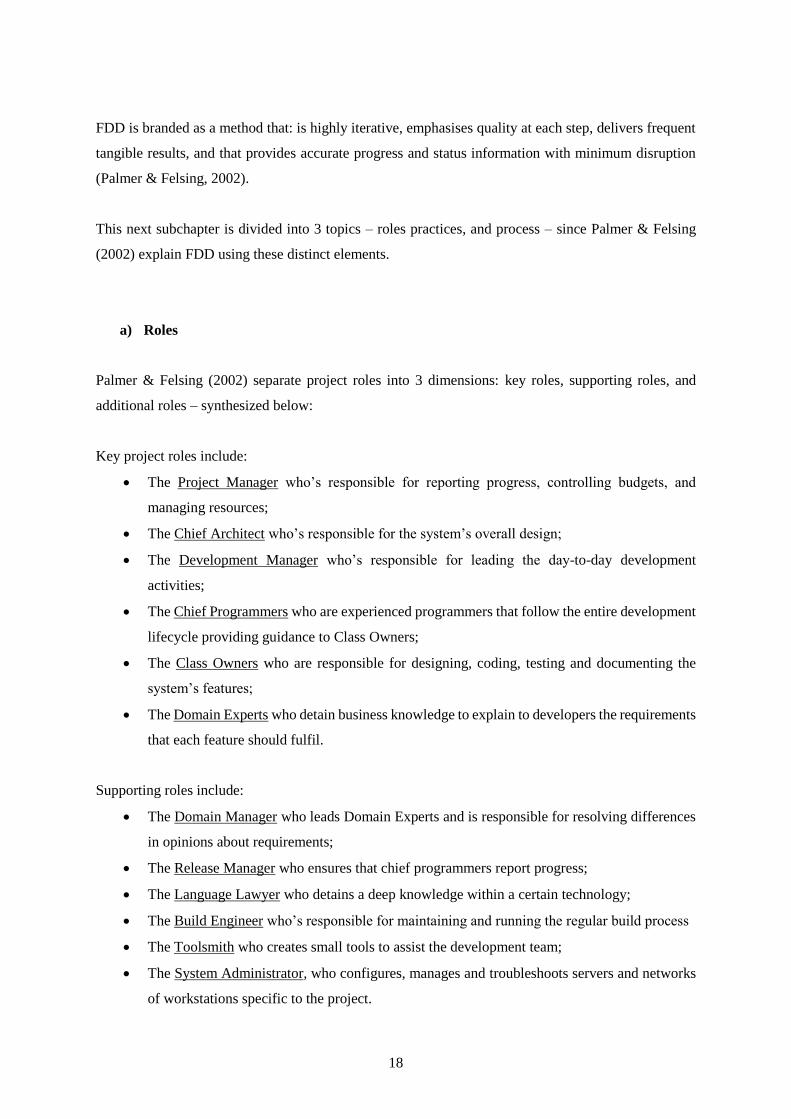
a) Roles
Palmer & Felsing (2002) separate project roles into 3 dimensions: key roles, supporting roles, and
additional roles – synthesized below:
Key project roles include:
The Project Manager who’s responsible for reporting progress, controlling budgets, and
managing resources;
The Chief Architect who’s responsible for the system’s overall design;
The Development Manager who’s responsible for leading the day-to-day development
activities;
The Chief Programmers who are experienced programmers that follow the entire development
lifecycle providing guidance to Class Owners;
The Class Owners who are responsible for designing, coding, testing and documenting the
system’s features;
The Domain Experts who detain business knowledge to explain to developers the requirements
that each feature should fulfil.
Supporting roles include:
The Domain Manager who leads Domain Experts and is responsible for resolving differences
in opinions about requirements;
The Release Manager who ensures that chief programmers report progress;
The Language Lawyer who detains a deep knowledge within a certain technology;
The Build Engineer who’s responsible for maintaining and running the regular build process
The Toolsmith who creates small tools to assist the development team;
The System Administrator, who configures, manages and troubleshoots servers and networks
of workstations specific to the project.
Page 39
19
Additional roles include:
Testers who are responsible for verifying that the system’s functions meet the user’s
requirements;
Deployers who convert existing data to new required formats;
Technical Writers who write and prepare documentation.
It’s also important to emphasize that these roles can be played by different team members, which usually
occurs in smaller projects.
b) Practices
FDD uses the following software best practices (Palmer & Felsing, 2002): Domain Object Modelling,
Developing by Feature, Individual Class (Code) Ownership, Feature Teams, Inspections, Regular
Builds, Configuration Management, and Progress Reporting.
FDDPr1 – Domain Object Modelling
Domain Object Modelling consists of building a class diagram which lists the most important objects
and shows their relationships within a problem domain. This diagram is used to model the overall
system which diminishes incorrect assumptions and inconsistencies during the development process
(Palmer & Felsing, 2002).
FDDPr2 – Developing by Feature
FDD emphasizes developing by feature, this means that a set of features must be made and from this
list the most valuable features (for the client) must be prioritized. It’s important to highlight that features
must be specified in terms of functional requirements, easing the communication between the client and
the development team. FDD supports that each feature (which corresponds to a single iteration) should
be implemented within two weeks (Palmer & Felsing, 2002).
FDDPr3 – Class (Code) Ownership
Class Ownership denotes who is responsible for each class, meaning that only one individual can
maintain and enhance a piece of code. Thus, turning the owner the expert entitled to explain how a piece
of code works, if necessary (Palmer & Felsing, 2002).
Page 40
20
FDDPr4 – Feature Teams
Similarly to class ownership, features are also assigned to different teams. Each team will have an
experienced professional as leader who coordinates the efforts of multiple developers. Palmer & Felsing
(2002), suggest that each team should have three to six people and all the Class Owners who are
responsible for each class within one feature should be in the same team.
FDDPr5 – Inspections
Inspections consist of code review and testing. The primary purpose of inspections is detecting defects,
although there are two other benefits that arise from this activity: knowledge transfer and standards
conformance. Having developers running through code together allows them to explain and learn better
coding practices. Additionally, once developers know that their code will be inspected, they are more
likely to develop according to the agreed coding standards (Palmer & Felsing, 2002).
FDDPr6 – Regular Builds
Having Regular Builds consists on integrating, continuously, the developed code with the rest, building
the complete system. A regular build schedule helps to highlight integration errors early and ensures
the existence of an up-to-date system that can be demonstrated to the client (Palmer & Felsing, 2002).
FDDPr7 – Configuration Management
Configuration Management consists of tracking the changes made on the current work. FDD suggests
tracking changes both in code and in documentation, such as requirements, contracts, test results and
other artefacts (Palmer & Felsing, 2002).
FDDPr8 – Progress Reporting
According to Palmer & Felsing (2002), FDD implies that progress reporting should be done at all levels,
whether inside or outside the project. FDD suggests an approach which allows progress estimation for
each feature. Within every feature each development phase (Domain Walkthrough, Design, Design
Inspection, Code, Code Inspection, and Promote to Build) is weighted in terms of percentage. By
identifying the current phase of a feature, the team is able to track progress more accurately.
Page 41
21
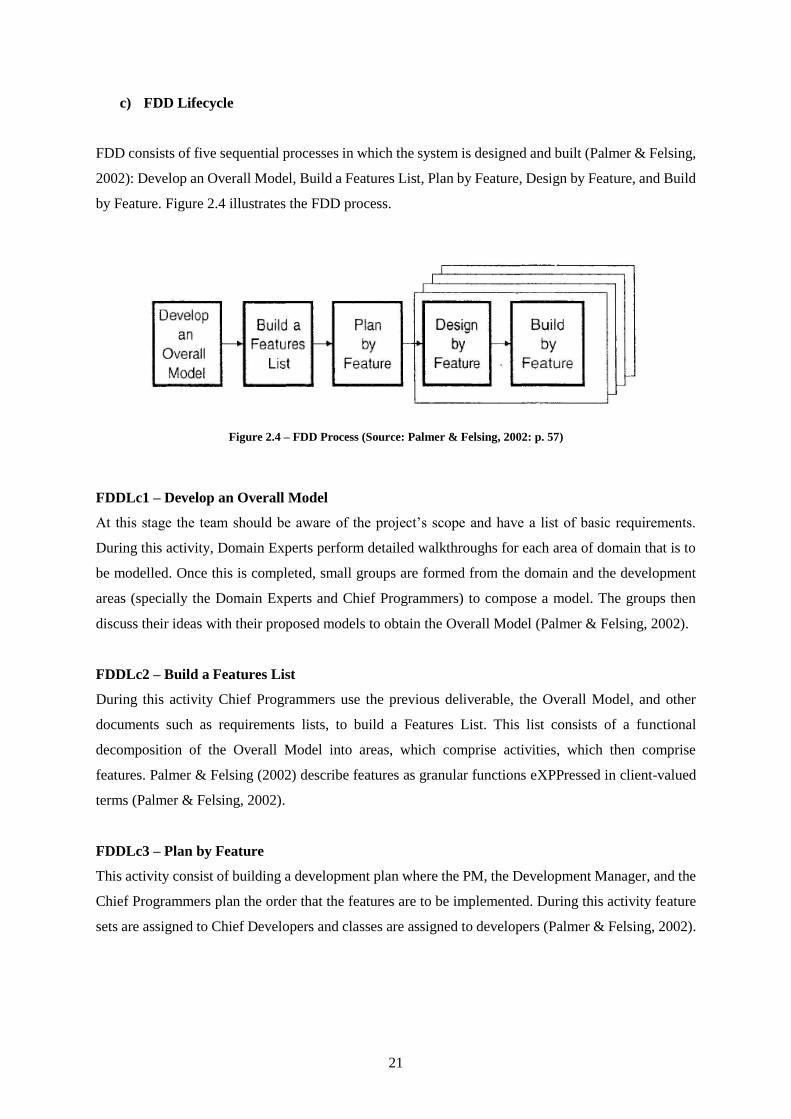
c) FDD Lifecycle
FDD consists of five sequential processes in which the system is designed and built (Palmer & Felsing,
2002): Develop an Overall Model, Build a Features List, Plan by Feature, Design by Feature, and Build
by Feature. Figure 2.4 illustrates the FDD process.
Figure 2.4 – FDD Process (Source: Palmer & Felsing, 2002: p. 57)
FDDLc1 – Develop an Overall Model
At this stage the team should be aware of the project’s scope and have a list of basic requirements.
During this activity, Domain Experts perform detailed walkthroughs for each area of domain that is to
be modelled. Once this is completed, small groups are formed from the domain and the development
areas (specially the Domain Experts and Chief Programmers) to compose a model. The groups then
discuss their ideas with their proposed models to obtain the Overall Model (Palmer & Felsing, 2002).
FDDLc2 – Build a Features List
During this activity Chief Programmers use the previous deliverable, the Overall Model, and other
documents such as requirements lists, to build a Features List. This list consists of a functional
decomposition of the Overall Model into areas, which comprise activities, which then comprise
features. Palmer & Felsing (2002) describe features as granular functions eXPPressed in client-valued
terms (Palmer & Felsing, 2002).
FDDLc3 – Plan by Feature
This activity consist of building a development plan where the PM, the Development Manager, and the
Chief Programmers plan the order that the features are to be implemented. During this activity feature
sets are assigned to Chief Developers and classes are assigned to developers (Palmer & Felsing, 2002).
Page 42
22
FDDLc4 – Design by Feature
During this activity, Chief Programmers schedule the development for the next feature, or group of
features, and then form feature teams by identifying the owners of the classes that comprise the selected
features. Once the development teams are formed they develop a detailed sequence diagram for each
feature being designed and then the Chief Programmer refines the object model accordingly. This
activity is repeated for each feature (Palmer & Felsing, 2002).
FDDLc5 – Build by Feature
During this activity Class Owners implement the required items for their classes to support each feature
and the developed code is tested and inspected in the order determined by the Chief Programmer. This
activity is repeated for each feature (Palmer & Felsing, 2002).
2.1.4 Rational Unified Process
The Rational Unified Process (RUP) was developed and marketed by Rational Software – a software
company acquired by IBM. Despite being considered an agile method, since it “embraces change” and
its process relies on iterative development, RUP contradicts agile principles by adopting “heavy
documentation” during the project’s lifecycle (Borth & Shishido, 2013). In order to describe RUP, it’s
important to comprehend that it was built on the following software best practices (Kruchten, 2000):
Develop Software Iteratively: Allows an early understanding on the project’s lifecycle,
encourages user feedback, enables an objective assessment of the project’s status, spreads
workload throughout the project’s lifecycle, and gives stakeholders a concrete evidence of the
project’s status.
Manage Requirements: Understanding which requirements add the most value to the company;
eliciting, organizing, and documenting the system’s required constraints; evaluating and
assessing the impact on requirement change; and tracking and documenting trade-offs and
decisions
Use Component-based Architectures: A broad description for the system’s architecture that
allows its understanding form multiple perspectives
Visually Model Software: Helps the development team specifying, constructing, and
documenting the system’s behaviour.
Page 43
23
Continuously Verify Software Quality: Since problems are harder to fix after deployment, it’s
crucial to continuously asses the system’s quality in terms of functionality, reliability and
performance.
Control Changes to Software: It is important to coordinate developers’ activity in order to
monitor changes and also to find and react to problems.
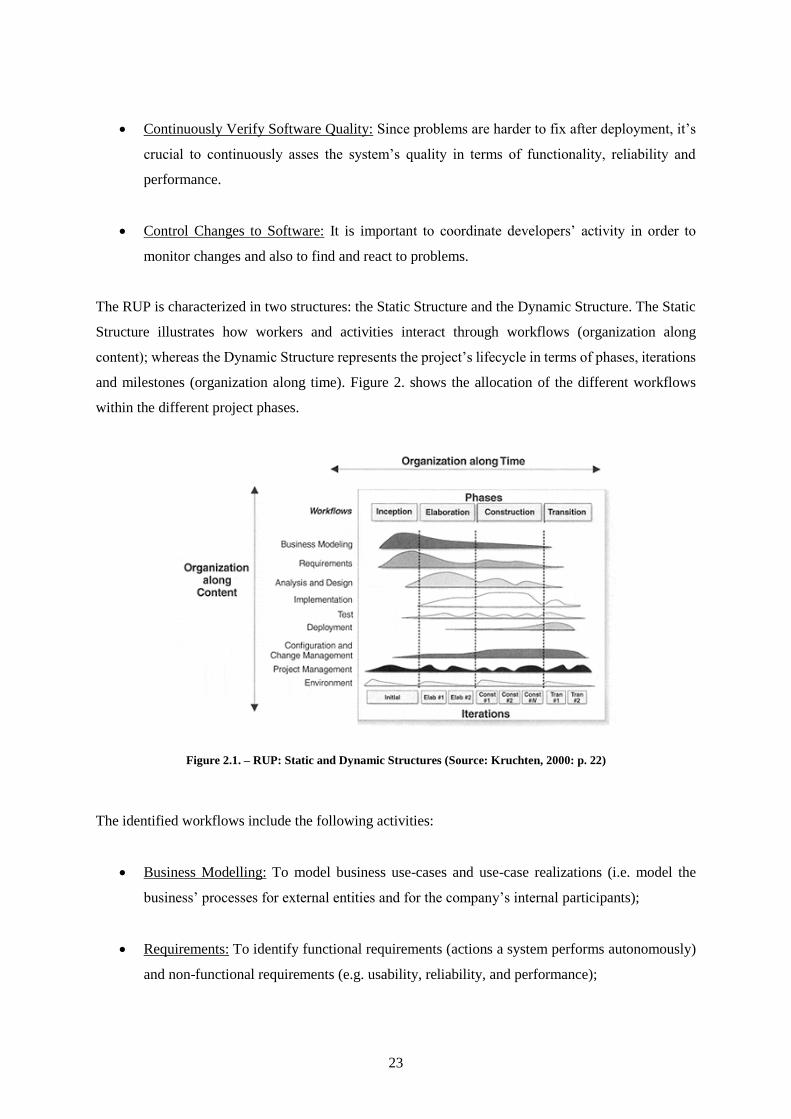
The RUP is characterized in two structures: the Static Structure and the Dynamic Structure. The Static
Structure illustrates how workers and activities interact through workflows (organization along
content); whereas the Dynamic Structure represents the project’s lifecycle in terms of phases, iterations
and milestones (organization along time). Figure 2. shows the allocation of the different workflows
within the different project phases.
Figure 2.1. – RUP: Static and Dynamic Structures (Source: Kruchten, 2000: p. 22)
The identified workflows include the following activities:
Business Modelling: To model business use-cases and use-case realizations (i.e. model the
business’ processes for external entities and for the company’s internal participants);
Requirements: To identify functional requirements (actions a system performs autonomously)
and non-functional requirements (e.g. usability, reliability, and performance);
Page 44
24
Analysis and Design: To specify requirements into an unambiguous design model;
Implementation: To define the organization of the code to be developed, implement and test
components as units, and to integrate into an executable system;
Test: To verify the component’s interaction, the component’s integration, and the requirements’
fulfilment, and to ensure all discovered defects are addressed;
Deployment: To test the software in its final operational environment, to package, distribute,
and installing the final product, and to train end users and the sales force;
Configuration and Change Management: To maintain the integrity of the project’s artifacts;
Project Management: People Management (hiring, training, coaching), Budget Management,
Contract Management, Risk Management, and Project Progress Monitoring activities;
Environment: To provide support in terms of tools, processes, and methods (thus removing
human-intensive and error-prone activities).
Each workflow (Static Structure) is documented graphically, which eases the process’ interpretation,
demonstrating workers’ responsibilities towards activities and artefact creation/management.
Regarding the Dynamic Structure, Kruchten (2000) identifies 4 different phases in a project’s lifecycle:
Inception, Elaboration, Construction, and Transition. The end of each process represents a project
milestone.
During the project’s Inception the team specifies the project’s vision, business case, and its scope. This
phase is concluded with the Lifecycle Objective Milestone. On the other hand, the Elaboration phase is
characterized by planning the necessary activities and resources, specifying features and requirements,
and designing the system’s architecture. The Elaboration phase is concluded with the Lifecycle
Architecture Milestone.
During the Construction phase, the product is built and the team evolves the project’s plans and vision.
The end of this phase corresponds with the Initial Operational Capability Milestone. The final phase
correlates with transitioning the product to its users and the Product Release Milestone marks its end,
concluding the cycle.
Page 45
25
Unlike other Agile Methods, RUP lists artefacts related to Project Management such as Product
Acceptance Plan, Risk Management Plan, Measurement Plan, etc. RUP does not demand the use of all
its artefacts, the method itself is adaptable to different projects, but it gives few guidelines in what
artefacts to implement, thus relying on the project manager’s knowledge and experience.
RUP defines 30 different roles within a project, including: stakeholders, technical and administrative
roles, and also reviewers and analysts for both technical and administrative tasks.
From this method emerged the Agile Unified Process (AUP) – a cut-down, simplified version of the
RUP2.
2.1.5 Dynamic Systems Development Method
According to its consortium website3, the Dynamic Systems Development Method (DSDM) was first
described in 1994, emerging from a method named Rapid Application Development (RAD) from both
the IT and non-IT context. This particular method was developed with efforts from different authors,
since its consortium operates on a collegiate model. Its website provides open-access to the method’s
manual, the DSDM Atern Handbook. This method description is based on the ebook present on the
consortium’s website (DSDM Consortium, 2008).
DSDM’s main concept is to have the product’s functionality as a variable, instead of the project’s
schedule, cost or quality. Thus, countering traditional approaches where resources are added, the
delivery date is extended, or quality becomes compromised if the project goes off track.
a) Process
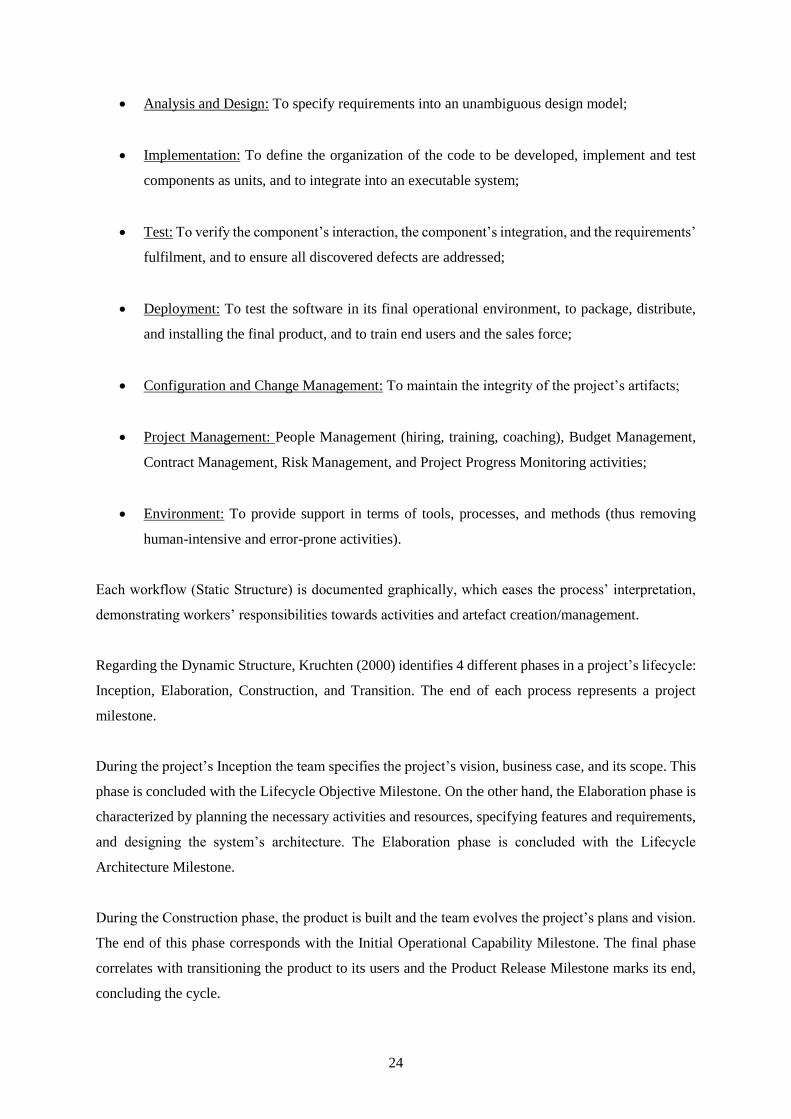
DSDM’s lifecycle has seven distinct phases (Figure 2.): Pre-Project, Feasibility, Foundations,
Exploration, Engineering, Deployment, and Post-Project.
2 See Edeki, C. (2013). Agile Unified Process. International Journal of Computer Science and Mobile
Applications, 1(3), 13-17 3 www.dsdm.org
Page 46
26
Figure 2.2. – DSDM Lifecycle (Source: http://www.dsdm.org/content/6-lifecycle)
Pre-Project
The Pre-Project phase consists of formalising the project’s proposal, placing its context on the
organization’s current activity. Its objectives are: to describe what business problem will be addressed
with the final result, to identify who will be the project’s Business Sponsor and Business Visionary, to
access the project’s harmony with business strategy, and also to scope, plan, and resource the Feasibility
phase.
Feasibility
This phase provides the first opportunity to study the project’s viability in terms of both business and
technical perspectives. Despite having this phase in the project’s inception, its viability should be
continually assessed throughout its lifecycle. This stage’s objectives are: to determine if there is a
feasible solution to the business problem described during Pre-Project, to identify the benefits to arise
with the end result, to outline possible approaches for delivery and for project management, to describe
organisation aspects, to state rough estimates of timescale and costs, and to plan the Foundations phase.
Foundations
During the Foundations phase the team builds perspectives of business, solutions and management in
order to provide a clear project focus. The objectives for this phase are: to create a list o high-level
requirements, to describe the business processes to be supported by the solution, to detail the Business
Case for the project, to design the solution’s architecture, to describe how quality will be assured, to
describe how progress will be tracked and reported, to baseline a schedule for development and
deployment activities, and finally to describe, asses and manage the project’s risk.
Page 47
27
Exploration
The Exploration phase is used to iteratively investigate detailed business requirements and translate
them into a viable solution, detailing the high-level requirements which were established in the previous
phase. This phase’s objective is to create a functional solution that demonstrably meets the needs of the
business and to provide an early view of the final product to the wider organisation.
Engineering
The Engineering phase is used to evolve the preliminary solution created during the Exploration phase.
This can be characterized as a continuous development of the final product in terms of performance,
capacity, security, supportability, and maintainability. This phase can work iteratively with the
Exploration phase.
Deployment
This phase’s primary purpose is to implement the project’s solution. Therefore, distributing or selling
it outside of the organisation or, in some cases, inside the organisation if the project’s main client is in
fact within the organisation. As secondary objectives, the Deployment phase is used as a review point
for future development and to formally bring the project to a close. There are 4 possible outcomes from
this phase:
All requirements have been fulfilled – project goes to the Post-Project phase;
A major change of scope was discovered – project goes back to the Foundations phase;
Features that were already planned are now added – project goes back to the Exploration phase;
The next increment will solely address technical aspects – project goes back to the Engineering
phase.
Post-Project
The Post-Project phase, which occurs once the final product’s value can be measured (three to six
months prior to the project’s completion), acts as an assessment in order to prove if whether the benefits
described during the project were achieved.
b) Artefacts
DSDM enumerates different deliverables which are associated with different phases of the project’s
lifecycle. Figure 2. illustrates DSDM’s artefacts and the phases in which they are used. These
deliverables, which are referred to as products, can be labelled as business-focused (orange),
management interests (blue) or simply contributors to the evolving and delivered solution (green)
Page 48
28
depending on their purpose. DSDM, like RUP, also points out that not all the deliverables are mandatory
for every project, their use will usually depend on contractual relationships and corporate standards.
Figure 2.3. – DSDM Artefacts (Source: http://www.dsdm.org/content/8-products)
During Pre-Project only one brief deliverable is presented, named Terms of Reference. This can be a
short document, a simple email or even a verbal agreement which will be sufficient to allow a potential
project to enter the next phase. This artefact contains a brief outline of the business’ needs, the project’s
objectives, and the project’s scope to address those needs.
The Feasibility phase is composed by the delivery of two distinct documents: The Feasibility
Assessment and the Outline Plan. The first provides a high-level overview of the project, while
assessing its feasibility from a business and technical perspective, and addressing risk by presenting a
description and a mitigation strategy for any risks significant enough to influence the project’s viability.
On the other hand, the Outline Plan provides an overview of the project from a management and solution
delivery perspective, while describing the resources required for the project, the organisational structure
and processes needed, an outline schedule for the project overall, and a detailed plan for the Foundations
phase.
During the Foundations phase, six different documents can be produced according to the DSDM: the
Business Foundations, the Management Foundations, the Solutions Foundations, the Prioritised
Requirements List, the Delivery Plan, and the Delivery Control Pack.
Page 49
29
The Business Foundations provides relevant information about transformation of the organisation’s
processes and how the project will contribute to the required change. The Management Foundations
describes governance and organisational aspects of the project, demonstrating how the project will be
managed. Thus, providing a validation of the project’s objectives and Success Criteria, the project’s
organisation (including roles and responsibilities), a description of the project’s monitoring tools, and
an overview of the key deliverables. The Solution Foundations is used to define the development
approach, the system’s architecture, and to demonstrate a solution prototype.
The Prioritised Requirements List, as its name suggests, describes the requirements which the project
needs to address in order to meet its objectives. The prioritisation is done according to the MoSCoW
method4. The Delivery Plan refines and elaborates the schedule described in the Outline Plan. Both
documents are used during the Exploration and the Engineering phases.
Finally, the Delivery Control Pack comprises reports, documents and logs related to the project’s status.
This can include the use of an issues log, a communications log, a burn-down chart, and/or a project
dashboard. This artefact, or set of artefacts, has relevance in the project until its Deployment phase.
The Exploration and Engineering phases include the elaboration of five products: the Timebox Plan,
the Timebox Review Record, the Deployment Plan, the Evolving Solution, and the Solution Assurance
Pack.
The Timebox Plan simply elaborates the schedules on the Delivery Plan, while the Timebox Review
Record is basically a trace on the project’s formal acceptance of the completed deliverables.
The Deployment Plan is a detailed plan for the Deployment phase, which includes a description of the
work to be completed, the dates associated with the key activities and milestones, the allocation of
resources, and an identification of contingency plans.
The Evolving Solution which is used to demonstrate the current understanding of the requirements is
composed by five parts: the Business Model which demonstrates the solution’s functionality, the Design
Model which illustrates how architectural areas should be developed, Prototype Solutions which allow
the team to address technical alternatives, the Business User Documentations which is required to help
support the effective operation of the solution, and the Support Documentation which provides technical
guidance that is required to support live operation of the solution.
4 The MoSCoW method is a requirement prioritization technique, where requirements are labelled as “Must”,
Should”, “Could”, or “Would” according with their relevance in guaranteeing the final product’s success
(Brennan, 2009).
Page 50
30
The Solution Assurance Pack is composed by three parts: the Solution Review Records which provide
a record of all review activity for deliverable components, the Business Testing Pack that demonstrates
the assessment of the solution in terms of business requirements, and the Technical Testing Pack which
demonstrates the assessment of the solution in terms of technical requirements.
The Deployment phase includes the development of two products: the Deployed Solution (which is
basically the end result for the current increment), and the Project Review Report that includes what
has been accomplished in the last increment and that links it to the Business Case that justified it.
Finally, the Post-Project phase includes only one deliverable, the Benefits Assessment, which describes
how the solution’s benefits have actually accrued.
c) Roles and Responsibilities
Like most of Agile methods DSDM also provides a list of roles and responsibilities within a project
team. These roles can be divided into three categories: Project-level roles, Solution Development, and
Other roles.
Within the Project-level roles are managers and co-ordinators of the project, including the Business
Sponsor who provides the overall strategic direction and funding, the Business Visionary who’s
responsible for interpreting the business’ needs (as referred by the Business Sponsor), the Project
Manager who ensures that the project’s resources are used effectively to create the final solution, and
the Technical Co-ordinator who is responsible for ensuring that the project is technically coherent and
meets the desired technical quality standards.
Within the Solutions Development sector there are six different roles: the Team Leader, the Business
Ambassador, the Business Advisor, the Solution Developer, the Business Analyst, and the Solution
Tester.
The Team Leader, who reports to the Project Manager, ensures that a Solution Development Team
functions as a whole and meets its objectives, co-ordinating product delivery aspects at a detailed level.
The Business Ambassador provides the necessary business input for the solution’s development. On
the other hand, the Business Advisor, who’s not a direct participant in the Development Team, provides
specialist input for the solution’s development. Usually, this role is endorsed by a future user of the
Page 51
31
solution or by someone who can simply provide legal or regulatory advice. The Business Analyst
facilitates the communication between business and technical participants by ensuring it is done
unambiguously and timely.
The Solution Developer, who is responsible for translating the business requirements and turning them
into a deployable solution, is also responsible for producing unit tests. Alternatively, the Solution
Testers are responsible for testing the solution as a whole.
The two other roles in the DSDM are the Workshop Facilitator who’s a moderator during project
meetings and the Atern Coach who’s responsible for ensuring that the DSDM is being employed
correctly.
2.1.6 Other Methods
a) Internet-Speed Development (ISD)
Internet-Speed Development (ISD) provides a framework in order to handle fast releases, which are
necessary to cope with the fast-paced software development environments. This method draws from the
Synch-and-Stabilize approach by Microsoft (Abrahamsson et al., 2003).
The method Synch-and-Stabilize consists on separating the project in three or four subprojects, where
features are developed according to priority. During each development cycle developers work in parallel
with constant builds, tests and bug-fixes (Cusumano & Selby, 1997).
ISD focuses on the following practices (Baskerville, Ramesh, Levine, Pries-Heje, & Slaughter, 2003):
Parallel Development, Constant Releases, Tools Utilization to speed design and coding, Customer
Integration in the development environment, Stable Architecture Establishment, Components Reuse,
Ignore Maintenance (new versions are developed from scratch and products are not documented due to
their short life-span), and Tailoring the method daily.
Despite ISD’s label as a project management framework, it is used for the ongoing operational
environment of software development within internet-based enterprises, where there is no clear start
nor end dates in product development and where deadlines can be flexible at a certain extent
(Baskerville et al., 2003).
Page 52
32
b) Adaptive Software Development (ASD)
According to its author, James A. Highsmith (2000), Adaptive Software Development (ASD) provides
a framework of concepts, practices, and guidelines instead of a set of rules and tasks. Therefore, this
particular method encompasses how projects should be approached from a cultural and organisational
perspective.
The ASD approach has six key characteristics (J. Highsmith, 2002):
Mission focused: Development should be made with project mission in mind at all times.
Nevertheless, the project’s mission may evolve during the project’s lifecycle;
Feature based: Development must be oriented by the system’s functionalities not by task driven
guidelines. In addition, this allows development to be broken down into smaller pieces;
Iterative: Development is carried through cycles;
Time-boxed: Time-boxing has the purpose to force hard trade-off decisions, instead of forcing
actual deadlines;
Risk driven: Requirements must be prioritised according to risk;
Change tolerant: This characteristic is implicit within every agile method. Change must be
embraced right from the project’s inception.
ASD recognizes 3 different phases within a development cycle (J. Highsmith, 2000): Speculate,
Collaborate, and Learn.
The first phase refers to a planning stage; the author chooses to call it Speculate in order to acknowledge
the uncertainty around software development projects. While the second phase is called Collaborate in
order to describe the need of cooperation during development. Finally, the last stage consists of
reviewing the project’s process and progress, while evaluating the possibility of changing requirements.
A cycle should last between four and eight weeks.
ASD also recommends the use of other practices such as pair programming, shared ownership, and
customer deployment (J. Highsmith, 2002), which are listed in other agile methods.
Page 53
33
c) Lean Development (LD)
Highsmith (2002), states that Lean Development (LD) is a software management tool, originated by
Bob Charette, which emerged from the lean manufacturing philosophy. Its practices and techniques do
not differ significantly from other methods, but its main characteristic it’s the linkage with the
philosophies that rose from the Toyota Production System (TPS).
LD’s principles are (J. Highsmith, 2002):
LDP1. Satisfying the customer is the highest priority;
LDP2. Always provide the best value for the money;
LDP3. Success depends on active customer participation;
LDP4. Every LD project is a team effort;
LDP5. Everything is changeable;
LDP6. Domain, not point, solutions – use solutions that can be used across multiple domains;
LDP7. Complete, don't construct – acquiring available solutions should be considered first;
LDP8. An 80 percent solution today instead of 100 percent solution tomorrow;
LDP9. Minimalism is essential;
LDP10. Needs determine technology – objectives must be considered before the technology;
LDP11. Product growth is feature growth, not size growth – business features dictate progress;
LDP12. Never push LD beyond its limits – the method’s boundaries must be understood.
d) Crystal
Crystal is a set of methods assembled by Alistair Cockburn in order to use a tailored approach for
particular situations. The decision is made using two variables: the system’s criticality and the number
of people in the project team.
Figure 2.5 - Crystal Methodology (Source: Cockburn, 2002: p. 166)
Page 54
34
The author names the methods with a colour code, from clear to red, being the clear a lighter method,
thus less bureaucratic, and red a heavier method with the use of more documentation and rules
(Cockburn, 2002).
The project’s criticality does not show any impact on tailoring an agile approach, it is used has a
criterion for adopting agile – an agile approach shouldn’t be adopted for life-critical systems according
to Crystal. In addition, Crystal does not provide concrete guidance on how to apply the different
methods.
e) Kanban
Kanban, in software development, is based on the technique within lean production and it is mainly
used for limiting Work-in-Progress and visualizing workflow. This technique consists of using a board
divided into columns, each representing a software development phase (e.g. Specification,
Development, Review, and Testing), and placing labels corresponding to tasks on the board accordingly
(Anderson, 2010). This technique is further detailed in a) Product Backlog (SA1), Sprint Backlogs
(SA2) & Kanban.
2.2 Agile Methods Discussion and Comparison
The review, analysis, and comparison of agile methods it’s not a recent topic since most agile methods
appearances date back to the nineties and the manifesto for agile software development was signed in
2001. Table 2.1 shows previous works on comparisons and the methods that were considered in each
study.
Table 2.1 -– Previous works on Agile methods’ comparison
Scrum XP RUP DSDM FDD LD Crystal ISD ASD
(J. Highsmith, 2002) X X X X X X X
(Abrahamsson et al., 2002) X X X X X X X
(Abrahamsson et al., 2003) X X X X X X X
(Strode, 2005) X X X X X
(Fernandes & Almeida, 2010) X X
(Soundararajan, 2011) X X
(Borth & Shishido, 2013) X X
(VersionOne, 2014) X X X X X X
Page 55
35
Highsmith (2002) does not focus directly on the comparison between methods. Instead, the author
describes how agile software development ecosystems can be tailored to fit into an organization’s
culture. Nonetheless, Highsmith reviews the existing agile methods and denotes their distinctive
characteristics.
Abrahamsson et al. (2002) and Abrahamsson et al. (2003) use a similar approach to compare methods.
However, Abrahamsson et al. (2003) focuses on the methods’ comparison itself, which results on a
study that is more thorough than the previous. The analysis is separated into five dimensions: Covered
lifecycle stages, project management support, vagueness, adaptableness, and empirical evidence.
Strode (2005), carries a method comparison also. Despite its focal point being the search of the most
suitable environments for agile methods through a series of case studies from nine software projects
using both agile and non-agile approaches.
Soundararajan (2011) assesses the “goodness” in organizational adoption of three agile methods: XP,
FDD and a custom developed method. The analysis uses three metrics: Adequacy, Capability, and
Effectiveness.
Borth & Shishido (2013) compare two methods, RUP and XP, highlighting their similarities and
discrepancies. The authors use seven distinct dimensions for the comparison: Team Communication,
Supporting Software, Roles & Responsibilities, Code Ownership, Time Allocation and Effort,
Professional Certification, and Successful Case Studies.
VersionOne (2014) is the eighth release of an annual survey on the state of agile software development.
The survey aims to learn about the adoption of Agile methods in IT companies from North America
and Europe. Since this survey has been conducted from 2007, previous releases allow insight in the
progress of agile adoption within the IT sector (VersionOne, 2007a, 2007b, 2008, 2009, 2010, 2012,
2013).
Through these studies and the description of several agile methods it is possible to find both similarities
and differences between them. In terms of common properties, Strode (2005) provides a great insight
to this subject. The author identifies incremental development with iterations, active user involvement,
constant feedback, teamwork, and team empowerment has common properties in all the methods
(Strode, 2005). Table 2.2 sumarizes the distinct characteristics between the different methods.
Page 56
36
Table 2.2 - -- Distinct Characteristics Between Agile Methods
Method Key Characteristics
Scrum Focuses on project management and process
Method for new product development (however, the examples are usually for
Software Development)
The most notorious method in the IT sector
XP Lists Software Development best practices
Based on practical settings
RUP/AUP Well defined and documented
Has a wide range of software support tools
Not considered a “true” Agile Method due to its heavy use of documentation
DSDM Has a consortium for the method’s development and to guide new practitioners
Wide range of artefacts based on programming activities
Shows little guidance in how practices can be adopted
FDD Emphasis on system modelling
Recommended for large scale systems
LD Addresses agile through an executive-level perspective
Approach based on lean production
Crystal Based on practical settings
Focuses on adopting the correct approach according to the project’s
characteristics
ISD Focuses on project management
Doesn’t describe practices
ASD Focuses on concepts and company culture
Scrum
This method’s main characteristic it’s its project management support. The method does not present
technical solutions for software development. Instead, it covers the managerial aspect for projects with
this nature. Scrum focuses on constant monitoring and within the software development cycle its
attention is drawn to Requirements Specification and Integration Tests, describing their process with
concrete guidance. Nevertheless, it provides project management support for the Design, Coding and
Unit Testing phases also. It is the most notorious agile method in the industry (VersionOne, 2014) and
it’s also known for being compatible with XP .
Page 57
37
XP
Has mentioned before, XP can be labelled as a set of software development best practices. Unlike
Scrum, it does not give a comprehensive project management view. Nevertheless, it shows concrete
processes and practices from the Requirements Specification to the System Test phases within the
software development cycle. It is known as a programmer centred method, it emerged from practical
settings and it’s described has the method that follows the Agile Manifesto’s principles and values more
closely. In addition, its benefits are supported by empirical evidence, since the literature provides
supporting studies.
VersionOne surveys (2007 to 2014) show a small percentage of XP implementations, declining
significantly since 2007. However, the surveys also show the relevance of XP practices in IT companies
– where 30% of the companies claim the use of Pair Programming (a practice which belongs solely to
XP), thus screening the misconception of each method’s practices within the industry.
RUP/AUP
Although RUP supports some agile principles, it is not considered a truly agile method mainly due to
its use of “heavy” documentation. However, it can be acknowledged has a well defined method which
covers the entire software development cycle and it’s also supported by diverse software tools in order
to aid its implementation.
Unlike truly agile methods, RUP supports the use of large, non-collocated teams in the software
development process. It also limits the empowerment of project members, assigning teams and/or
individuals to specific activities, whereas other methods tend to define project roles with a broader
approach.
RUP’s popularity in the industry is significantly low, where 1% of the companies inquired by
VersionOne (2014) claim the use of this method.
DSDM
DSDM was the first truly agile method to be released and it’s the only one which requires a consortium
membership in order to have access to its white papers (Abrahamsson et al., 2002). Although limiting
access to the method itself, its consortium aids the method’s development while supporting its
practitioners (J. Highsmith, 2002).
DSDM, like the RUP, covers the entire software development lifecycle while providing project
management support. However, the method does not provide concrete guidance since it denotes that
Page 58
38
each organization is different and should develop its own practices – not providing any guidance how
it should be done (Abrahamsson et al., 2003).
In terms of visibility in the IT sector, VersionOne (2014) denotes that only 1% of the inquired
companies claim the use of DSDM, which declined significantly since 8% claimed its use in 2007
(VersionOne, 2007b).
FDD
FDD’s main distinctive characteristic is its emphasis on modelling. In fact, it suggests building an
overall model in the project’s inception instead of doing it through iterations. However, it may suffer
changes during the project’s iterations (Palmer & Felsing, 2002). Although this practice reduces the
ability to accommodate change later in the development cycle, it also allows the method to be used on
the development of larger scale systems (Soundararajan, 2011).
Even though FDD provides a concrete set of practices, it also denotes that these should be adapted
according to the team’s experience in which the method does not present any guidance whatsoever
(Abrahamsson et al., 2003).
According to VersionOne’s surveys, this method’s popularity in the IT sector has never been truly
significant since 2007 (VersionOne, 2007a, 2008, 2010, 2012, 2014).
LD
Lean Development’s most distinctive characteristic is its linkage with lean production, and while other
methods focus on actual programming activities or bottom level management, LD approaches software
development through an executive-level perspective (J. Highsmith, 2002). In terms of industry
adoption, only 2% of the surveyed companies claim using Lean Development in their software
development projects (VersionOne, 2014).
Crystal
Crystal, like XP, was developed through a practitioner perspective. However, it focuses on detailing
which practices can be used according to a certain domain (J. Highsmith, 2002). Despite Crystal’s
method tailoring approach solid explanation, it does not provide concrete guidance on how to
implement the correct practices across every project domain (Abrahamsson et al., 2003).
Page 59
39
ISD
According to Abramsson et al. (2003), Internet Speed Development covers the whole software
development lifecycle spectrum. The authors also state that although it provides a Project Management
support across the whole lifecycle, it does not describe concrete guidance or practices. ISD can also be
labelled as a method that can be applied to distinct situations and its benefits are supported by empirical
evidence (Abrahamsson et al., 2003).
As mentioned before, ISD can be labelled as a framework to support the ongoing operational
environment of software development within internet-based enterprises (Baskerville et al., 2003).
ASD
ASD focuses on managing software development projects which are under intense time pressure and
have constant changes in requirements (Strode, 2005). In addition, its attention is drawn to concepts
and culture, instead of actual software practices (Abrahamsson et al., 2002, 2003; J. A. Highsmith,
2002).
2.3 Review of Agile Implementations
VersionOne (2014) provides an overview of implications from agile implementations. It states that 15%
of the inquired companies never had an agile project fail. It also denotes that most companies which
had failed agile projects answered that the cause of failure is due to company philosophy and cultural
resistance (VersionOne, 2014).
VersionOne (2014) also identifies the observed improvements by adopting Agile practices within
companies– illustrated in Figure 2.6.
Page 60
40
Figure 2.6 – Improvements from adopting Agile according to Companies (Source: VersionOne, 2014: p. 7)
With a more specific scope, Layman, Williams, & Cunningham (2006), who study the impact of agile
practices experimentally, state that the followed project had better post-release quality and similar or
better productivity – in comparison to industry averages – by implementing XP practices.
From their 2 year industrial case study, Mann & Maurer (2005) observed that customer satisfaction
increased and developers decreased their overtime – thus allowing a more sustainable pace – after
implementing a Scrum process into an existing software development project (Mann & Maurer, 2005).
Contrary to the results from the previous studies, Hajjdiab, Taleb, & Ali (2012) and Berger (2007) don’t
meet the benefits that agile methods deliver according to their authors. Instead, the first study fails to
implement an agile method based on Scrum due to organizational culture (the company was used to a
waterfall process and heavy documentation requirements) and lack of experience with agile method
implementations. The second study concludes that the implementation of an agile method affected the
project’s progress due to the company’s bureaucratic structure, thus causing significant delays.
However, the project’s developers and the company’s Client Department considered the
implementation a success.
These studies, which coincide with VersionOne (2014) in the leading causes of failed agile projects,
address the importance of cultural organization when adopting their practices and principles.
0% 20% 40% 60% 80% 100%
Ability to manage changing priorities
Increased productivity
Improved project visibility
Improved team morale
Faster time-to-market
Enhanced software quality
Reduce risk
Better alignment between IT & business objectives
Simplify development process
Enhanced software maintainability/extensibility
Improved/increased engineering discipline
Manage distributed teams
Surveyed Companies
Page 61
41
With a scope which doesn’t involve software development solely, Carlson & Turner (2013) identify the
following studies in order assess the applicability of agile methods to Aircraft Systems Integration
(Carlson & Turner, 2013):
Huang, Darrin, & Knuth (2012), who adopt Scrum and XP practices for the development of
two small satellites, recommend the adoption of several agile practices and principles in
Hardware System Engineering projects – particularly small and co-located teams organized in
a flat structure, and testing from inception phases;
Savolainen, Kuusela, & Vilavaara (2010), who study the transition of adopting agile methods
into two product development projects, prove that agile methods can be scalable. However, the
study demonstrates that, in this context, a higher level orchestration is required (with a use of a
higher level backlog) and the team members’ experience has a great impact in the adoption’s
success;
Waldmann (2011), who concludes that requirements engineering activities can benefit from the
use of agile methods by implementing an agile framework into a hearing solutions company.
The study emphasizes that the practice of prioritizing work can provide great benefit to this
context because of its resources constraints.
Outside the IT sector, Reynisdóttir (2013) applies Scrum practices and principles to a Mechanical
Product Development project. The author concludes that Scrum can be applied in non-IT environments
and that it can improve a team’s work and progress. The author also states that adaptations might be
needed, which is already recommended in the literature for software development projects
(Reynisdóttir, 2013).
Despite the existence of case studies for agile implementations, the benefits of using agile practices and
principles cannot be assumed as certain, since empirical evidence still remains scarce. In addition, the
replication of results can be difficult to obtain since a project can be affected by several factors (Pinto
& Slevin, 1987) which are hard to measure beforehand (e.g. human and cultural factors) and others that
are exterior to the project (e.g. economic downturns and changes in governmental regulations).
Page 62
42
2.4 Agile Outside the IT Sector
The agile methods’ contribution to Project Management emphasizes on the following characteristics:
Organizational Structures, Artefacts, Process, and Practices (Figure 2.7).
Figure 2.7 - Agile Methods’ Characteristics
This section will only address the characteristics that are not specific to software development and
therefore have the potential to be applied in a broad context.
2.4.1 Cultural and Organizational Structures
a) Small & Co-located Teams
The recommendation of preferring smaller teams is present in most agile methods (e.g. XP, Scrum,
ASD, and Crystal). Agile methods’ authors recommend it in order to improve collaboration and
interaction. XP and Scrum recommend that a team should be composed by 7 to 10 persons (Beck, 1999;
Schwaber, 2004). Scrum also recommends scaling techniques if a large project team is required – thus
splitting it into smaller groups.
Although the convention of using small teams appear in agile methods from the authors’ personal
experiences, Hoegl (2005) addresses how team size affects the project. His study proclaims that,
although there is no optimal team size, smaller teams show a higher level of teamwork – which is
represented by better communication, coordination, mutual support, individual effort, and cohesion
(Hoegl, 2005).
Having a project team work in the same space is recommended by Scrum, XP, and indirectly by the
agile manifesto itself, since it promotes face-to-face communication has a principle (Beck, 1999; Beck
Cultural and Organizational
Structures
Artefacts
Process
Practices
Page 63
43
et al., 2001; Schwaber, 2004). As the use of small teams, agile methods do not recommend the use of
co-located teams based on scientific findings. However, Reed & Knight’s (2010) study shows that
virtual environments are more exposed to risk in comparison with co-located ones – using Insufficient
Knowledge Transfer, Lack of Cohesion, Cultural or Language Differences, Inadequate Technical
Resources, Resource Inexperience with Company and Processes, Loss of key resources, and Hidden
Agendas as risk factors (Reed & Knight, 2010).
b) Self-Organizing Teams
This principle is present in the actual agile manifesto, proclaiming that “The best architectures,
requirements, and designs emerge from self-organizing teams” (Beck et al., 2001). No empirical
findings were discovered relating self-management and team performance. However, Yang & Guy
(2011) conclude that, the level of self-management correlates positively with the level of resource
attainment, which hereby correlates positively with job satisfaction. The same study also demonstrates
the strong positive influence of teamwork in performance.
Another curious finding is the simultaneous coercive and enabling influence of self-managed teams by
Proença (2010). This study demonstrates the effect of company culture on the implementation of self-
managed teams in an organization. The author finds that elements such as complementary HR practices
and proximity among workers from different hierarchical levels, influence the beneficial effect and
receptiveness towards implementing the use of self-managed teams (Proença, 2010). This finding
relates with the influence of company culture in adopting agile methods, where bureaucracy and
hierarchical differences hinder their implementation.
c) Cross-functional Teams
Although the term “cross-functional” is not emphasized in the agile literature, the need of assigning
“business people” and “technical people” to projects is proclaimed. The agile manifesto reads:
“Business people and developers must work together daily throughout the project” (Beck et al., 2001).
These groups represent the ability to identify products and functionalities that have relevant business
value (“business people”) and the ability to produce such products (“technical people”).
d) Project Roles
Agile methods adopt a different approach for project organization. The most distinct difference is the
roles of a Project Manager (in a traditional approach) and a Scrum Master (in an agile approach using
Page 64
44
Scrum). Where a Project Manager is “assigned by the performing organization to achieve the projects
objectives” (Project Management Institute, 2008) a Scrum Master is responsible for assuring that the
chosen method is being followed accordingly (Schwaber, 2004).
Another role that Scrum introduces is the Product Owner who “is the single authority responsible for
deciding which features and functionality to build and the order in which to build them” (Rubin, 2012).
This role could be compared to a project’s Sponsor who “plays a significant role in the development of
the initial scope and charter” and “may also be involved in other important issues such as authorizing
changes in scope, phase-end reviews, and go/no-go decisions when risks are particularly high” (Project
Management Institute, 2008). Nevertheless, it’s reasonable to state that a Product Owner has a higher
level of involvement (in comparison with a project Sponsor) due to the uncertainty surrounding an agile
project.
2.4.2 Artefacts
a) Product Backlog (SA1), Sprint Backlogs (SA2) & Kanban
A backlog is a list of prioritized features to be developed during a project (product backlog) or during
a single sprint (sprint backlog). The Product Backlog shows what is in queue in the project’s
development and its content is dynamic, where management changes it according to arising priorities.
On the other hand, a Sprint Backlog represents what’s being developed during a current sprint. This list
is also dynamic. However, it should only be changed by the development team. The Sprint Backlog
also has the purpose to allow the team to track progress in real-time – therefore it must be updated
regularly.
Reynisdóttir (2013) uses this practice in a non-IT context, and his findings show that, although the team
found some potential in this practice, it didn’t show significant willingness to use it. However, the team
wasn’t supported by the Product Owner during the project in updating the Backlogs, which is one of
the most important tasks for this role.
This artefact can also be used to visualise work in progress if used as a Kanban chart also, where each
task is identified as: “to do”, “in progress” and “done”. While using this practice WIP can be limited in
order to keep the team more focused in a smaller set of tasks. Figure 2.8 illustrates how both backlogs
and kanban are used simultaneously.
Page 65
45
Figure 2.8 - Product Backlog, Sprint Backlog & Kanban
The Product Backlog, which is built during the project’s planning phase, lists the entire project’s
requirements with their priority and estimation. This list is not fixed it can (and should be) changed
throughout the project.
For each sprint a Sprint Backlog is constructed during the Sprint Planning. In the previous example, 2
requirements are chosen (the two with the highest priority) and broken into sets of tasks. The tasks are
then labelled as “Ready” once the task is ready for development, “In Progress” when its development
has begun, and finally “Complete” once the task has been fully developed and tested – the technique of
labelling the tasks’ stage is named Kanban.
b) Burndown Chart (SA3)
The Burndown Chart, like the Sprint Backlog allows the team to keep track of progress, but it adds the
ability to visually determine if the project’s pace will allow a timely delivery. In Reynisdóttir’s (2013)
study, the team considers the Burndown Chart useful for the release as a whole, and therefore it doesn’t
need a constant update like software development project requires (Reynisdóttir, 2013). Scrum advises
that this artefact should be updated daily. However, from Reynisdóttir’s findings, its update periodicity
should be dimensioned according with the project’s characteristics.
Page 66
46
2.4.3 Practices
a) Metaphor (XPPr3)
The Metaphor which is recommended by XP, it’s a document which describes the project’s result in a
story like format. It is used to maintain cohesion within a team, and although it does not need to provide
an extensive explanation of the project’s end result, it must be sufficiently elucidatory to each team
member and stakeholders. This practice can be used if a project’s scope is ambiguous during its
inception as a mean to keep consistency within the team (Beck, 1999).
b) Sprint Review (SPr4) & Sprint Retrospective (SPr5)
Although both events occur at the end of a sprint (usually in the same day) they are used for two very
distinct purposes. While the Sprint Review is used to present what was accomplished during the last
sprint, the Sprint Retrospective is used to evaluate the process in use and to propose changes in order
to facilitate communication, teamwork and effectiveness.
The Sprint Review should be approached as a presentation for key stakeholders and for the Product
Owner to demonstrate progress, and more importantly, to obtain feedback and adapt the Product
Backlog accordingly. From Reynisdóttir’s experiment, the Sprint Review had no purpose according to
the project team. The author states that this practice is one of the most challenging to implement and
recommends structuring the attendees list for this activity according on the feedback they can provide
and depending on the content that the team has to present (Reynisdóttir, 2013).
For the Sprint Retrospective, Reynisdóttir (2013) states that the team didn’t found significant value in
this practice. However, the author points out that during the final sprints, when the team was more
familiarized and comfortable with the practices, some suggestions were made and implemented.
c) Onsite Customer (XPPr11)
As the name suggests, onsite costumer consists of having a client available full-time to provide feedback
on the product or service being developed, thus allowing the team to avoid unnecessary work and
corrections. While this practice provides relevant knowledge it also steers development facilitating
business decisions. Although it seems simple to implement, having an onsite costumer fulltime can be
“costly, difficult, and demanding” (Koskela & Abrahamsson, 2004). Based on Koskela & Abrahamsson
(2004) findings, it is recommended that costumer can work nearby, but not necessarily in the same
room.
Page 67
47
Williams, Packlick, & Coburn (2007) and Farell, Narang, Kapitan, & Webber (2002) conclude that this
practice can be very rewarding for the project due to the significant knowledge transfer attained.
However, both studies provide few recommendations, such as managing costumer expectations and
creating a trust environment in order to improve the practice.
d) Daily Stand-up Meetings (SPr5)
Daily Stand-up Meetings, suggested by both XP and Scrum, are used to synchronize the teams work,
where each team member shares what is being developed individually and the difficulties encountered.
These meetings should be time-boxed (15 minutes preferably) and do not have the purpose to discuss
solutions and to suggest any recommendations. In Reynisdóttir’s study, the team was receptive towards
this practice and declared that it was beneficial for project’s progress (Reynisdóttir, 2013).
e) 40 Hour Week (XPPr10)
This practice, which is recommended in XP, suggests that the project team must not work more than 40
hours a week. However, extra hours can be employed in times of higher pressure and tight deadlines. If
the Scrum Master finds two weeks in which the team is working extra hours, this cause must be handled
has a problem to be addressed. This practice is used to keep the team more focused and more productive,
thus maintaining a continuous development pace.
Using data from a manufacturing context that dates back to the first world war, Pencavel (2014)
concludes that “employees at work for a long time may experience fatigue or stress that not only reduces
his or her productivity but also increases the probability of errors, accidents, and sickness”. Although it
is not accurate to extrapolate Pencavel’s results to another context, the study can sustain the negative
impact of working long hours on productivity.
f) Collective Ownership (XPPr8)
This practice which is recommended by XP, suggests that every team member can access and modify
every development in order to improve the final result. Every development must be in a common
location in order to be accessible to every team member. No studies were found in order to gain
significant insight on the experience with this practice. However, Silva, Kon, & Torteli (2005) and
Grossman, Bergin, Leip, Merritt, & Gotel (2004) state that, in their experiments, developers adopted
the practice easily.
Page 68
48
g) Test-driven Development and Incremental Testing (XPPr5)
Although this technique can be very related with software development, Carlson & Turner (2013)
proclaim that “incremental testing should be embraced to reveal deficiencies early” in an Aircraft
Systems Integration context. Therefore this practice can be considered if the project in hands implies
formal testing such as in the aircraft sector and the software development context itself.
2.4.4 Process – Iterative & Incremental Development
An incremental development allows a team to gain knowledge about the product by developing it
gradually, this improving it progressively. On the other hand, iterative development allows a team to
react to change since there’s a constant cycle of planning, development, and evaluation. The
combination of these ideas is adopted due to the complexity and the uncertainty related with software
development (Rubin, 2012).
The idea of developing iteratively and incrementally rises against the idea of developing software using
a waterfall model (Larman & Basili, 2003), which does not allow changes in requirements – since the
requirement specification, designing, coding, and testing phases are only done once – and which
delivers the final product in one single batch (Royce, 1970).
Although agile methods arise as an improvement for software development (as previously mentioned),
the waterfall model can still be more appropriated in the same context since it allows a clearer sense of
requirements, each phase is completed in a specified period of time, the required resources are minimal
to implement the model, and each phase is documented. However, many problems from previous phases
can be found in posterior ones and requirement changes are not implemented during the development
process (Balaji & Murugaiyan, 2012).
2.5 Chapter Main Findings
As seen in this last chapter, Agile Methods can deliver several benefits for project management, even
outside the software development scope – such as the ability to adopt changes, faster time-to-market,
and productivity increases. However, it also shows that Agile implementations can fail due to company
characteristics such as its bureaucracy level and organizational culture (Berger, 2007; Hajjdiab et al.,
2012). Since a project’s success can be affected if an Agile Method is implemented wrongly, it is very
important to study which are the root causes for a successful (or unsuccessful) Agile implementation.
By identifying these causes, the decision of whether these methods should be used or not becomes
easier, and allowing a risk reduction by avoiding selecting between an Agile or a more traditional
method.
Page 69
49
3 A Framework for an Agile Implementation Decision Model
The implementation’s success of agile practices can be affected by cultural and organizational factors,
by product characteristics, and by project characteristics (Barry Boehm & Turner, 2004; Cockburn,
2002). Therefore, a decision model can be used in order decide whether an agile approach should be
adopted or not.
When deciding between a plan-based and an agile approach, Boehm & Turner (2004) develop a polar
graph model to support the decision, where the closer are the measured variables to the centre, the “more
agile” a project can be (Figure 3.1). Four critical factors are identified: Team Size, Criticality,
Dynamism, Personnel, and Culture (Barry Boehm & Turner, 2004). On the other hand, Crystal intends
to tailor a method’s “agility” according to two factors only: Team size and Criticality (Cockburn, 2002).
Figure 3.1 - Polar Graph Decision Model (Source: Barry Boehm & Turner, 2004)
In order to select the criteria, Boehm & Turner’s (2004) model was used as starting point. From the 5
criteria aspects which Boehm & Turner (2004) describe, it was possible to pinpoint 9 criteria from the
agile software development literature (Figure 3.2): Personnel, Criticality, Team Size, Close
Communication, Trust, Low Bureaucracy, Scope Vagueness, Innovativeness, and Competitiveness.
Page 70
50
Figure 3.2 - Agile Implementation Decision Model Framework
Personnel
Culture
Team Size
Criticality
Close Communication • Schwaber (2004) • Hunt (2006) • Highsmith (2002) • Cockburn (2002) • Rubin (2012) • Dybå & Dingsøyr (2008) • Beck (1999) • Cohen & Lindvall (2004)
Personnel • Lindvall et al. (2002) • Cohen & Lindvall (2004) • Baskerville et al. (2003) • Strode (2005) • Hunt (2006) • Dybå & Dingsøyr (2008)
Criticality
• Cockburn (2002)
Team Size • Huang et al. (2012) • Cockburn (2002) • Schwaber (2004) • Cohen & Lindvall (2004)
Trust • Lindvall et al. (2002) • Schwaber (2004) • Ribeiro & Fernandes (2010) • Strode (2005)
Low Bureaucracy • Lindvall et al. (2002) • Cockburn (2002) • Highsmith (2002) • Strode (2005)
Boehm & Turner (2004)
Scope Vagueness • Beck (1999) • Ribeiro & Fernandes (2010) • Tomás (2009)
Innovativeness • Ribeiro & Fernandes (2010) • Highsmith (2002) • Cohen & Lindvall (2004) • Dybå & Dingsøyr (2008) •
Competitiveness • Schwaber (2004) • Ribeiro & Fernandes (2010) • Silva et al. (2005) • Carlson & Turner (2013) • Cockburn (2002)
Dynamism
Page 71
51
The criteria Personnel, Criticality, and Team Size were extracted from the original model directly, while
3 company Culture traits were discovered in the literature which can describe an “agile-prone”
company: Close Communication, Trust Environment, and Low Bureaucracy.
Finally, Dynamism, which is measured by the frequency of requirements’ changes, can be related with
3 factors: Scope Vagueness, Innovativeness, and Market Competitiveness. These characteristics
describe the rapidly changing environment of software development itself and the consequent need of
adopting agile practices, thus in order to evaluate the potential dynamism of a project, these
characteristics should be assessed.
“Culture” and “Dynamism” were not used directly in the present framework directly since these
variables are not easily measurable beforehand, especially for early agile adopters.
Despite finding some evidence between the model variables and this framework’s variables in the
literature, no empirical evidence was discovered.
The following section discusses these criteria while showing their potential impact on an agile
implementation or in a project’s success.
3.1 Decision Criteria
3.1.1 Personnel
As identified by the authors in Figure 3.2, an Agile project should be composed by individuals who
(Baskerville et al., 2003; Cohen & Lindvall, 2004; Dybå & Dingsøyr, 2008; Hunt, 2006; Lindvall et al.,
2002; Strode, 2005):
Have good interpersonal skills;
Are experienced – i.e. have been involved in similar projects;
Have drive and initiative;
Have autonomy and corporate responsibility.
Most agile methods mention the importance of softskills in individuals, where communication abilities
and motivation are usually emphasized.
Page 72
52
Having experienced people in a project can be considered has a success factor for an agile or non-agile
project. However, Cohen & Lindvall (2004) consider that in order for an agile project to succeed, 25%
to 33% of the project team must be composed by experienced people (Cohen & Lindvall, 2004).
3.1.2 Criticality
This criterion was initially introduced by Crystal’s author Alistair Cockburn (Barry Boehm & Turner,
2004). Although Cockburn (2002) acknowledges the importance of criticality, there are no clear
scenarios where this criterion is used when selecting a method. Nevertheless, the author states that the
more critical a system is to be developed, the “harder” should be the selected method since criticality
requires more rigour and ceremony (Cockburn, 2002).
3.1.3 Team Size
Most of the agile methods mention that large teams constraints the implementation of agile practices.
This happens due to the rapidly changing environment that an agile project holds whilst communication
flows through face-to-face feedback (Sampaio, 2011). Huang et al. (2012), through their case study of
agile implementations, recommend the use of small empowered teams with direct link to the project
sponsor in order to promote a project’s agility (Huang et al., 2012).
3.1.4 Close Communication
Communication is a key subject in agile methods, as they rely on face-to-face interaction between
project members (including stakeholders). In order to adopt agile effectively, the team must be
comfortable with close interaction and constant feedback since agile methods require these features to
spread information across the team.
As Rubin (2012) and Sampaio (2011) describe, the Development Team must keep transparent high-
bandwidth communications, where impediments such as approvals and sign-off procedures must be
identified and eliminated to enhance communication performance and where the team must keep a clear
understanding to avoid misinterpretations of the project’s progress (Rubin, 2012; Sampaio, 2011).
The Agile Manifesto also describes that “the most efficient and effective method of conveying
information to and within a development team is face-to-face conversation” (Beck et al., 2001).
Page 73
53
3.1.5 Trust Environment
Trust between project members is mentioned in almost all agile methods, the Agile Manifesto states the
following: “Build projects around motivated individuals. Give them the environment and support they
need, and trust them to get the job done” (Beck et al., 2001).
Agile methods must rely on trust since teams are empowered to make autonomous decisions, and
progress is measured from feedback (i.e. daily stand-up meetings, sprint reviews, and informal
conversations). As Dybå & Dingsøyr’s (2008) state, trust is an important characteristic for a successful
XP project (Dybå & Dingsøyr, 2008). And as Abrahamsson et al. (2002) describe, “adopting agile
practices also requires a cultural shift, (...) placing more trust on the ability and competence of the
development team” (Abrahamsson et al., 2002). Berger (2007) also states that “a climate of trust, co-
operation, collaborative and flexible working practices coupled with authoritative fast decision-making
are necessary if iterative development is to succeed” (Berger, 2007).
In fact, Reed & Knight (2010), who explore the risks between virtual and co-located teams, hypothesize
that teams with a high level of trust are expected to have a low level of hidden agendas – which the
authors identify as risk factor for project success (Reed & Knight, 2010).
Therefore, trust between project participants (including key stakeholders) should be used as criteria for
an agile implementation, and, in addition, it can also be considered for project risk analysis.
3.1.6 Low Bureaucracy
Bureaucracy can be described as “a system of government or administration by a hierarchy of
professional administrators following clearly defined procedures in a routine and organized manner”
(Oxford University Press, 2015). An agile-prone environment is one that includes constant changes
while enabling the empowerment of people (Strode, 2005).
Berger (2007), who studies the actual impact of a bureaucratic environment on a project that uses agile
practices, states that a bureaucratic and hierarchical society has a coercive impact on project
development progress. The author also states that a blame culture is particular prevalent where the
organizational nature is one of bureaucracy and hierarchical status, thus impacting the “fast,
authoritative decision-making activities that are crucial for an Agile process” (Berger, 2007).
In addition, agile methods focus on keeping the bureaucracy within the development process as low as
possible in order to allocate more effort to development instead of administrative tasks (Cervone, 2011).
Page 74
54
In conclusion, it is arguable that the more bureaucratic a company is the greater is the effort required
when adapting accordingly to implement agile practices.
3.1.7 Innovativeness
Ribeiro & Fernandes (2010) point out that rapidly evolving technologies and the appearance of low-
cost innovative products are among the most relevant external factors that lead construction SME
companies adopt agile practices (Ribeiro & Fernandes, 2010).
Olson, Walker, & Ruekert (1995), who study the moderating role of product innovativeness on
organizational structures for new product development, recommend participative and self-governing
structures when exploring innovative concepts and more “bureaucratic and formal coordination
mechanisms to manage projects involving familiar line extensions”. In addition, the innovativeness of
a product can affect the cooperation between team members, where the more innovative a product to
be developed is the more cooperative a team will be.
From the studies identified above, it is arguable to state that both market and product innovativeness
may have a significant impact on the adoption of agile practices.
3.1.8 Scope Vagueness
Software development projects usually have vague initial requirements since the project’s costumers
don’t have a clear design of how the final product should be. The requirements evolve during the
project’s course since costumers perceive how their needs can be addressed by the software to be
developed (Beck, 1999; Schwaber, 2004). Since the initial scope does not specify the final product to
its full extent, an approach which embraces change should be implemented.
Beck (1999) states that XP should be implemented when requirements are vague or changing and Tomás
(2009) also points out that agile teams deal with vague problems and must have the ability to do so.
3.1.9 Competitiveness
One of the reasons to adopt agile practices is the reduction of time-to-market to sustain competitive
advantage (VersionOne, 2014). Therefore, a company may be obliged to change its management
methods to a more agile approach. Ribeiro & Fernandes (2010) findings sustain that worsening
competitive market conditions is one of the main factors which are forcing construction SMEs to change
management practices to more agile approaches.
Page 75
55
4 A Survey on a Potential Implementation of Agile Methods
4.1 Survey’s Goals
In order to evaluate the implementation of agile practices within different contexts a survey is
constructed with the following goals:
G1. To learn if agile has the potential to be implemented in a non-IT context and what practices
have more potential – in compliance with RQ3.1;
G2. To learn how the identified factors in the previous framework impact the implementation of
the different practices – in compliance with RQ3.3;
G3. To learn what type of companies and projects are more “agile-prone” – in compliance with
RQ3.2;
This section specifies the survey’s characteristics and provides its results’ discussion.
4.2 Survey’s Specifications
The survey will evaluate project managers’ opinion on the impact of a potential implementation of agile
practices on their projects. A study of different implementations of agile practices and the impact on
the actual success of ongoing projects would be more reliable. However, this approach would be
significantly more time consuming. For this survey, each respondent will be asked to have a recently
finished or ongoing project in mind.
An initial questionnaire was created and the following changes were introduced:
Questions and answers were numbered in order to ease the results’ discussion
“Agile vocabulary” (e.g. sprint, Scrum Master) was removed in order to avoid biased results –
agile supporters would be more prone to support the adoption of agile practices.
The practices’ explanations were removed – only small descriptions remained since
respondents could be more inclined to find a positive impact if the practices were in fact
explained. This also allowed shortening the questionnaire, thus reducing the answers’ duration.
The answers in multiple choice questions were shortened, which allowed a reduction on the
average answering duration.
A country identification question was introduced in order to study if it has impact on the
answers
A suggestion box was introduced at the end of the questionnaire in order to identify
improvements
Page 76
56
The final survey is composed by 3 parts. The first part will gather information about the respondent,
about the company’s sector and the type of a recently finished or ongoing project; the second part will
be used to evaluate the factors identified on the previous framework for a recently finished or ongoing
project; and the third part will assess the potential success of different practices through the respondent’s
opinion.
The survey has a final question: “Are you familiar with terms and practices of Agile Project
Management?” This question will allow assessing how known Agile Project Management, according
to different sectors – especially outside the IT sector. This question is placed last in the survey so that
respondents won’t associate the practices with any particular Agile method immediately, thus
maintaining a higher reliability in the results.
The following sections will explain the use of each question within the three parts described above. The
questionnaire can be found attached in Annex I – Survey.
4.2.1 Company and Respondent Characteristics (Part I)
Q.1. – This question is used to assess the respondent’s experience as a project manager in the identified
sector. To answer this question the respondent will have a text box which can be filled with any value
between 1 and 50 – the answer will be in years.
Q.2. – This question will be used to assess if the acknowledgement of agile methods is significantly
different in companies from different countries.
Q.3. – This question will be used to assess if the acknowledgement of agile methods is significantly
different in companies with different commercial presence.
Q.4. – This question will be used to assess the applicability of agile practices in the different sectors.
The possible answers for this question will be the highest level categories included in the 2012 NAICS
– North American Industry Classification System (United States Census Bureau, 2015), except for the
group “Professional, Scientific, and Technical Services” which will be split into its 3rd level categories
to identify IT companies. The answers from IT companies will not be used for the analysis – IT
companies can be identified with the group “5415 – Computer Systems Design and Related Services”.
Q.5. – This question will be used to assess the applicability of agile practices according to project type.
The possible answers for this question will be the project types defined by Youker, 1999.
Page 77
57
4.2.2 Assessment on the Framework’s Decision Model (Part II)
The questions within this section are used to evaluate the company and the project according to the
framework in Chapter 3 and it is composed by 11 questions – Q.6. to Q.17.
Q.6 and Q.7 are used to assess the project’s the criticality and the team size impact on the adoption of
agile practices respectively. The possible answers for both questions are based on Boehm & Turner’s
(2004) polar graph model.
Q.8 to Q.17 have 4 possible answers to avoid a neutral position – “Strongly Disagree”, “Disagree”,
“Agree”, and “Strongly Agree” – and are used for the following purposes:
Q.8./Q.9./Q.10. – These 3 questions will be used to evaluate the personnel according to the
profile recommended for agile practices.
Q.11. – This question will allow the assessment of a company’s communication culture on the
adoption of agile practices.
Q.12. – This question will allow the assessment of a company’s trust environment on the
adoption of agile practices.
Q.13. – This question will allow the assessment of a company’s bureaucracy level on the
adoption of agile practices.
Q.14./Q.15. – These questions will allow an assessment of both product innovativeness and
market innovativeness impact on the adoption of agile practices.
Q.16. – This question will allow the assessment of a project’s scope vagueness on the adoption
of agile practices.
Q.17. – This question will allow the assessment of market competition on the adoption of agile
practices.
Page 78
58
4.2.3 Assessment on the Potential Implementation of an Agile Method (Part III)
The survey’s final part will have the purpose to assess the applicability of the selected agile
characteristics in Chapter 2.4 – Agile Outside the IT Sector. For each of the identified characteristics,
the respondent will be asked to answer how the implementation would impact the project’s progress –
a 5-point Likert Scale is used as basis for the possible answers (Likert, 1932):
1. Strong negative impact
2. Negative impact
3. No impact
4. Positive impact
5. Strong positive impact
This part ends by asking the respondents about the implementation of an iterative and incremental
approach specified as follows:
Figure 4.1 - Agile Process
Page 79
59
The process starts by constructing the Project’s metaphor (XPPr3) and the Project Backlog (SA1), these
two tasks can be grouped as a “planning phase” since these are only carried in the project’s inception
(not considering the changes that the product backlog can suffer during the project). One characteristic
that is not represented in the flowchart is the fact that the product backlog can be changed during the
project – this is explained aside in the survey.
Each sprint starts with an Iteration Planning (SPr2), which is mainly composed by the construction of
a sprint backlog (SA2) and its inherent activities, followed by the daily activity with a meeting every
morning (SPr3). At the end of each iteration, the Review (SPr4) and Retrospective Meetings (SPr5) are
carried.
4.3 Survey’s Results
The following section shows the survey respondents’ characteristics and details the analysis carried out
with the survey’s responses – two core analyses were carried: and a correlation analysis between the
responses in the Part I and Part II, and a cluster analysis with the responses for the Part II.
The survey was online from the 28th of April 2015 until the 20th of July 2015 and it gathered a total of
85 responses of which 61 were complete – from the 61 answers, 1 was removed due to data
incongruence (the first choice was selected on every question).
4.3.1 Respondents’ characteristics
The survey’s sample used for the study is composed by 60 answers in which 20 (approximately 33%)
belong to the sector “Computer Systems Design and Related Services”, whereas outside this sector, 8
answers belong to the sector “Educational Services”, and 5 to the Manufacturing sector – the remaining
13 sectors have 4 or less respondents, totalling a sum of 16 different sectors within the survey’s sample
(see Figure 4.2 – Respondents by ) – where 28 where identified beforehand. In closing, out of the 60
answers, 20 belong to the IT sector and 40 to other sectors.
Page 80
60
Figure 4.2 – Respondents by Activity Sector
Figure 4.3 shows the distribution according to the respondent’s years of experience as project managers.
The mode of this variable within the sample is 10 years and the average 8.2 years. Despite having 5
respondents with 0 years of experience of project management, no responses were removed.
Figure 4.3 - Respondents by Years of Experience
1
1
1
1
1
1
2
2
2
3
4
4
4
5
8
20
0 5 10 15 20 25
1.Agriculture, Forestry, Fishing and Hunting
19.Advertising, Public Relations, and Related…
24.Health Care and Social Assistance
27.Other Services (except Public Administration)
28.Public Administration
6.Wholesale Trade
18.Scientific Research and Development Services
3.Utilities
4.Construction
20.Other Professional, Scientific, and Technical…
14.Architectural, Engineering, and Related Services
17.Management, Scientific, and Technical…
9.Information and Communications
5.Manufacturing
23.Educational Services
16.Computer Systems Design and Related Services
Number of Respondents
14
13
17
9
5
2
0
2
4
6
8
10
12
14
16
18
≤2 >2 and ≤5 >5 and ≤10 >10 and ≤15 >15 and ≤20 >20
Years of Experience
Page 81
61
Most of the sample’s respondents manage projects for companies with presence in more than one
country – 39 respondents, 65% of the sample.
Figure 4.4 - Respondents by Company's Commercial Presence
All 10 project types, including “Other”, were selected by respondents, were the predominant project
type selected was Computer Software development with 18 respondents (Figure 4.5).
Figure 4.5 - Number of Respondents by Project Type
8
13
28
11
0
5
10
15
20
25
30
1.Local 2.National 3.International 4.GlobalCommercial Presence
5
7
5
1
3
9
2
18
5
5
0 5 10 15 20
10.Other
9.Research
8.New Product Development
7.Maintenance of Process Industries
6.Event or Relocation
5.Equipment or System Installation
4.Design of Plans
3.Computer Software Development
2.Construction
1.Administrative
Number of Respondents
Page 82
62
According to project size, the full range of possible answers was selected were most respondents
selected the option “4 to 10 members” as it can be seen in Figure 4.6 – approximately 47%.
Figure 4.6 - Number of Respondents by Project Size
According to project criticality, the full range of possible answers was selected also. However, the first
option (No Significant Impact) and the last two (High Impact and Catastrophic Impact) had a
significantly low number of respondents which can impact the assessment of the variable “Criticality”
on the adoption of Agile Methods. The great majority chose a neutral position “Significant Impact”,
where the second most chosen answer was right below this value. Therefore the sample in this case is
very lightly dispersed with a tendency for a medium-low criticality.
Figure 4.7 – Respondents by Project Criticality
14
28
11
7
0
5
10
15
20
25
30
Up to 3 members 4 to 10 members 11 to 30 members 31 to 100 members
2
16
39
2 1
0
10
20
30
40
50
1.No SignificantImpact
2.Low Impact(Small costs)
3.SignificantImpact
(Significant Costs)
4.High Impact (alife)
5.CatastrophicImpact (Many
lives)
Page 83
63
Regarding the remaining questions in the questionnaire’s Part II, most have respondents in the full range
of possible answers. However, in questions 8 to 12 (related with personnel and company characteristics)
most respondents agree with the statements, and in questions 13 (regarding company bureaucracy) and
16 (regarding scope vagueness) most respondents do not agree with the statements. The low dispersion
can impact the assessment of these variables on the adoption of Agile Methods. The questions with
more dispersion were 15 (regarding market innovativeness) and 17 (regarding market competitiveness).
Figure 4.8 – Number of Respondents by Answer (on Q. 8 to Q. 17)
Question 1.Strongly
Disagree
2.Disagree 3.Agree 4.Strongly
Agree
8 0 2 48 10
9 0 7 45 8
10 0 9 41 10
11 1 6 41 12
12 1 5 39 15
13 5 33 18 4
14 2 8 37 13
15 1 15 29 15
16 6 39 12 3
17 1 8 27 24
4.3.2 Initial Analysis
In order to obtain an initial measurement on the potential of implementation of an agile method, the
arithmetic mean of the responses to the questions 18 to 34 (Part II) is calculated for each respondent,
which is then used to obtain the global impact level of the implementation agile practices. As displayed
in Figure 4.9, Project Managers in the IT sector (who chose the option 16 in Question 4) potentially
believe that the implementation of agile practices have a more positive impact in their projects than
Project Managers in a non-IT company (who chose an option other than 16 in Question 4) – which is
expected since the methods arose from software development. A value over 3.68 (which can be rounded
to 4, meaning a positive impact) is an initial indicator to find value on the adoption of agile practices
outside the IT sector. However, since this data was obtained from ordinal variables, it is not possible to
prove effectively that the previous statements are correct.
Page 84
64
Figure 4.9 - Average of Q. 18 to Q. 34 Answers by Respondent (According to Sector)
To evaluate the applicability of the different practices across different sectors, the percentage of
responses is calculated for each question regarding the different practices (Q. 18 to Q.34). To consider
if one practice has the potential to be adopted, it is assumed that the sum of the answers “4” and “5 –
Strong Positive Impact” should have at least 50% of the total answers (the same applies to consider that
a practice does not have the potential to be adopted). If the answer “3 – No Impact” corresponds to more
than 50% of the answers, it can be considered that the adoption of the practice in question has no impact
in the project’s progress. If none of these values surpasses 50%, no conclusions should be drawn
regarding the adoption.
For the next analysis, only sectors and project types with at least 4 respondents will be examined to
sustain reliability in the conclusions – the sector “Computer Systems Design and Related Services” and
sector “Computer Software Development” will not be considered since the study focuses outside the IT
sector.
In most sectors, Project Managers agreed that the use of Cross-functional teams, Requirement Backlog,
Kanban, and Available Client may have a positive effect on their projects. On the other hand, the use
of Self-managed teams and Collective Ownership do not show evidence of a positive impact – in fact,
the last shows a potential negative effect according to Project Managers (Annex III – Survey Responses
to Part II by sector)f).
The two sectors that show a higher potential in the adoption of Agile Methods are the Manufacturing
and Information and Communications sectors since Project Managers strongly agree that the use of an
iterative approach as a potentially positive effect on projects. For the remaining sectors, there is no clear
evidence that the implementation of Agile Methods is potentially beneficial (Annex III – Survey
Responses to Part II by sector).
3,893,68
1
1,5
2
2,5
3
3,5
4
4,5
5
IT Non-IT
Page 85
65
Regarding project type, and similarly to the identified sectors above, the majority of the Project
Managers agreed that the use of Cross-functional teams, Requirement Backlog, Kanban, and Available
Client may have a positive effect on projects, while Collective Ownership may have a potential negative
effect (Annex IV – Survey Responses to Part II by Project Type).
The project type that shows a higher potential in the adoption of Agile Methods is New Product
Development (Annex IV – Survey Responses to Part II by Project Type), which is aligned with the
literature regarding the adoption outside the IT sector because of its uncertainty (Reynisdóttir, 2013;
Schwaber, 2004).
Although not as clear as the previous project type, Construction (Annex IV – Survey Responses to Part
II by Project Type) can also be considered potentially prone to the adoption of Agile Methods according
to Project Managers, which is aligned with the findings of Ribeiro & Fernandes (2010) for construction
SME’s – the analysis was not extended to the companies’ commercial presence due to the small sample
size.
“Research” is another project type that may benefit with the implementation of an iterative approach
according to Project Managers. However, the same does not apply to the remaining practices (Annex
IV – Survey Responses to Part II by Project Type).
Regarding the adoption on all non-IT sectors, more than 75% of the Project Managers agreed that the
use of Cross-functional teams, Requirement Backlog, Burndown Chart, Kanban, and Available Client
may have a positive effect on projects. The remaining practices also have some potential outside the IT
sector according to more than 50% of Project Managers – excluding the use of small and self-managed
project teams, and the collective ownership of contents, where regarding this last practice, more than
50% of Project Managers outside the IT sector agreed that it may actually have a negative effect on
projects.
4.3.3 Independency and Correlation Analysis
In order to assess the relationship of company and project characteristics (independent variables) with
the adoption of agile practices (dependent variables), two different tests are attempted – the χ2 test and
Spearman’s Rank-Order Correlation test between the answers from Part I and Part II (since Part I is
mainly composed by both nominal and ordinal variables and Part II by ordinal variables).
The attempt on using the χ2 test (to test the independence between the answers of Q.2, Q.4, and Q.5
from the answers in Q.18 to Q.34) was not successful since the assumptions to perform this test were
Page 86
66
not met – more than 20% of the expected counts are less than 5 and individual expected counts are
greater than 1 (Siegel, 1956). In order to use the variables Q.4 and Q.5, these were grouped in 2 different
groups only – IT and non-IT sector, and Software Development and non Software Development projects
respectively. However, the χ2 test assumptions were still not met. Siegel (1956) suggests that the Fisher
test can be used to replace the χ2 test. Nevertheless, the author suggests it for 2x2 tables only, which is
not the case for the identified variables.
In order to correlate the variables correspondent to the questions Q.1, Q.3, Q.6, Q.7-Q.17, with the
variables regarding the impact on the adoption of agile practices (Q.18 to Q.34) the Spearman’s
Correlation test is used since the identified variables are ordinal.
The performed test is made with a significance value (α) of 0.05 and it evaluates the following
hypothesis:
H0: There is no association between the variables, according to respondents
H1: There is a monotonic association between the variables, according to respondents
If p-value < 0.05 we reject H0
Significant correlation was found between the following variables (Annex V):
Company Size (Q3) with the use of a Requirement’s Backlog (Q22)
Project Criticality (Q6) with the use of Cross-functional Teams (Q21) and Test-driven
development (Q32)
Team Size (Q7) with the use of Cross-functional Teams (Q21) and Kanban (Q23)
Project member’s interpersonal skills (Q8) with the use of small teams (Q18)
Project member’s experience & autonomy (Q9) with the use of small (Q18), and self-managed-
teams (Q20)
Face-to-Face communication (Q11) with the use of Kanban (Q23), Burndown chart (Q24), and
Metaphor (Q25)
Project Products’ Innovativeness (Q14) with the use of Requirement’s Backlog (Q22), Kanban
(Q23), Review Meetings (Q26), Retrospective Meetings (Q27), Daily Meetings (Q29), 40h
week (Q30), and constant testing (Q33)
Scope Vagueness (Q16) with the use of Metaphor (Q25)
Competitiveness (Q17) with the use of Co-located teams (Q19), Self-managed teams (Q20),
Requirement’s Backlog (Q22), Kanban (Q23), Burndown Chart (Q24), and constant testing
(Q33)
Page 87
67
The first correlated pair of variables does not show any clear relevance since the great majority of
Project Managers (86%) agree that the use of a Requirement’s Backlog can have a beneficial effect on
projects.
The correlation between Project Criticality and the use of Cross-functional Teams does not show a clear
relevance since 85% of Project Managers responded that this practice may have a positive impact on
projects. However, the correlation between Project Criticality and test-driven development should be
reviewed more carefully. Although the used test does not provide statistical evidence on a positive
correlation between variables, the positive correlation signal suggests this finding – despite the previous
belief that the more critical a project is, the “less agile” it should be. Nevertheless, this finding is
convincing since critical projects potentially have a high number of tests as a response to high risk
(Project Management Institute, 2008), and the use of test driven development could improve the
awareness for testing activities.
Like the first identified pair of variables, the correlation significance may not show any relevance since
the great majority of respondents agreed on the adoption of some practices. These are: The use of Cross-
functional teams (Q21), Requirement’s Backlog (Q22), Kanban (Q23), Burndown Chart (Q24),
Retrospective Meetings (Q27), and Available Client (Q28). Therefore, the correlation between the
independent variables and these will not be reviewed due to the lack of relevance.
The correlation between the member’s interpersonal skills and the use of small teams may simply
suggest that since smaller teams have a closer interaction, the more skilful members are in cooperating
with each other, the better for the project’s progress – although the used test does not prove a positive
correlation, the fact that the correlation sign is greater than 0 suggests this finding.
The correlation between project members’ experience and the use of self-organizing teams proves that
this variable should be considered in adopting agile methods since this practice is recurrently mentioned
in agile methods and it is one of the agile principles (P13).
The correlation between product innovativeness with a lot of Agile’s practices and principles suggests
that it should also be considered when adopting agile methods. The same applies to competitiveness,
which correlates with the use of self-managed teams – a principle identified in the agile manifesto (P13),
as mentioned before.
In conclusion, the variables which show the highest importance in supporting the decision of adopting
agile practices are: Project member’s experience & autonomy (Q9), Project Products’ Innovativeness
(Q14), and Competitiveness (Q17). In order to confirm that there are no confounding effects between
Page 88
68
these variables the Spearman’s Correlation test is also used to evaluate if these are correlated (Table
4.1).
Table 4.1 - Correlation between decision variables
Since the calculated p-value is greater than 0.05 in every case, we accept the null hypothesis. Which
means that these variables are not associated, meaning that there is no evidence of confounding effects.
4.3.4 Cluster analysis
In order to identify different patterns in adopting different practices, a cluster analysis is carried. To
begin the analysis, all the clustering variables are tested for correlation (Annex VI – Clustering
Variables Correlation). As advised by Mooi & Sarstedt (2011), correlated variables should not be used
simultaneously in a cluster analysis and therefore not all Part II variables will be used. In order to correct
this issue two options could be adopted: replace a number of correlated of variables with another
variable which can represent them or simply remove correlated variables leaving one which could
represent others. In this study, variables are removed since it allows a variable reduction, which is
beneficial to improve the clustering quality due to the small sample size – Mooi & Sarstedt (2011),
citing Formann (1984), recommend a sample size of at least 2m, where m is the number of clustering
variables.
The variables Q19, Q22, Q24, Q25, Q26, Q27, Q28, Q29, Q32, Q33, and Q34 were removed due to the
correlation with other variables – Q18 and Q23. Therefore, only the following variables were taken into
consideration:
Q18 – Use of small teams
Q20 – Self-managed teams
Q21 – Cross-functional teams
Q23 – Kanban
Q30 – 40h week
Q31 – Collective Ownership
Q9 Q14 Q17
Correlation Coefficient 1,000 ,003 -,078
Sig. (2-tailed) ,983 ,553
Correlation Coefficient ,003 1,000 -,058
Sig. (2-tailed) ,983 ,661
Correlation Coefficient -,078 -,058 1,000
Sig. (2-tailed) ,553 ,661
Q17
*. Correlation is significant at the 0.05 level (2-tailed).
**. Correlation is significant at the 0.01 level (2-tailed).
Q9
Q14
Correlations
Page 89
69
Despite the great reduction of clustering variables, six variables is still a lot for the sample size (26 = 64
and N = 60). To reduce this number, 2 variables are discarded since the majority of Project Managers
have the same opinion (Annex II – Survey Responses to Part II in IT and non-IT companies) – Q21,
and Q23 (despite the fact that this last variable would be used to represent 10 other, the respondents’
opinion is also one-sided towards the implementation of these 10 other practices).
The Hierarchical Clustering analysis method was employed to obtain the different clusters, by using the
squared euclidean distances from the clusters centroids. Annex VII – Cluster Analysis Dendrograms a)
shows the first obtained results, where it is possible to identify one clear outlier, which creates a single
cluster – respondent 2. This case was removed from the sample and the cluster analysis is performed
again with the same configuration.
To begin the analysis, 4 clusters are considered initially by observing the dendrogram in Annex VII –
Cluster Analysis Dendrograms b). The first cluster is composed by respondents who identified the four
clustering variables as potentially beneficial above average (Annex VIII – Cluster Data) – especially
the practice of collective ownership. Comparing with other clusters, this one is mostly composed by IT
companies and also shows more respondents which identified their project’s scope as vague (Annex
VIII – Cluster Data).
The second cluster, which is composed by most cases, does not show any clear sign for a potential
adoption of the identified clustering variables and no clear project/company characteristic are identified
(Annex VIII – Cluster Data).
The third cluster shows the higher potential for adopting all the practices regarding the clustering
variable, excluding the collective ownership. The cluster is composed by Software Development, New
Product Development, and Research projects (Annex VIII – Cluster Data) – which have been identified
as projects which could benefit with the adoption of agile practices.
Finally, the fourth cluster only shows a potential adoption of the practice “Collective Ownership” unlike
all the others. The only characteristic that contrasts with the other clusters is market competitiveness,
where all respondents agree that their company is within a very competitive market (Annex VIII –
Cluster Data).
The cluster analysis does not show any new relevant finding. However, it helps demonstrating that the
IT Sector shows a higher potential in adopting agile practices (even if the project type is not software
development) and that agile practices should be considered for research and new product development
projects (along with software development).
Page 91
71
5 Discussion, Limitations & Future Work
By reviewing the literature, nine principal agile methods were identified: Scrum, Extreme
Programming, Feature Driven Development, Rational Unified Process, Dynamic Systems Development
Method, Internet-Speed Development, Adaptive Software Development, Lean Development, and
Crystal – where Scrum and XP have the most relevant roles since they are by far, the most adopted
methods in the industry (answering RQ1). Despite the existence of many methods, all have similar
principles and all of them are included under a single manifesto, the Agile Manifesto. Agile methods
can be simply described as a framework for project management where projects have an iterative
approach and where requirements’ changes are expected from the project’s inception.
Although these methods collide with traditional project management standards (e.g. PMBOK) –
especially on how projects are planned – some aspects of project management are not considered in
agile methods such as Procurement Management, Cost Management, and Human Resource
Management. Therefore, project management standards should always be considered.
The main difference between practices is the focus point on software development projects. For
example: Scrum focuses more on process, Extreme Programming focuses more on practices, Lean
Development focuses on an executive-level perspective on how software management should be
addressed, and Adaptive Software Development focuses more on concepts and cultural aspects (thus
answering RQ2).
By collecting the opinion of Project Managers, it can be assumed that some practices have potential
across multiple sectors and project types, such as (1) the use of Cross-functional teams, (2) the use of
progress control tools (such as the Backlog, Kanban and the Burndown Chart), (3) the adoption of
review and retrospective meetings, and (4) the availability of a client to the project team (answering
RQ3.1). The use of collective ownership, which is identified by Extreme Programming, shows a
potential negative impact even for projects within the IT sector. Therefore, the implementation of this
last practice should be carefully considered when adopting agile methods.
The Manufacturing and the Information and Communication sectors were identified as the sectors with
the highest potential to adopt an iterative approach, and therefore the sectors with the most potential to
adopt agile methods. However, the survey’s sample size is not large enough to draw conclusions on the
adoption of agile methods across different sectors. On the other hand, the project type with the highest
potential to adopt agile other than software development is new product development, which is also
supported by previous studies. To obtain a greater evidence of the applicability of agile outside the IT
Page 92
72
sector, this project type should be considered in future studies. Construction and research projects were
also identified as potential “agile prone” projects (answering RQ3.2).
In order to adopt agile methods, project and company characteristics should be considered. From the
framework described in this study, nine different characteristics where identified to support the decision
of implementing agile. The first characteristic, Personnel, indicates that team members should have
good interpersonal skills and should be experienced and autonomous for an agile implementation to
succeed. The second, Criticality, indicates that agile projects should not have a high criticality (i.e
should not have risks with a high impact). However, one agile practice – test driven development –
showed to be relevant for critical projects. Team size, shows that agile projects should be composed by
small teams. Three different cultural traits where identified: Close Communication, Trust Environment,
and Low Bureaucracy should exist in order to succeed in implementing agile. Finally, the company’s
and the project final products’ Innovativeness, the Scope’s Vagueness and the market’s
Competitiveness should be considered when adopting agile.
However, from these nine, only three different characteristics showed to be utterly important when
considering an agile implementation, these were: the project members’ experience and autonomy, the
project’s final products innovativeness and the market’s competitiveness in which the company is
included (answering RQ3.3). An advice for future studies is to discover from these variables which has
the most importance for the decision.
The carried cluster analysis did not show any new relevant findings. However, it helped demonstrating
that the IT Sector shows a higher potential in adopting agile methods and that agile practices and
concepts should be considered for research and new product development projects.
Since the study was made with the answers of project managers, two main limitations can be found.
Firstly, the company and project’s characterization (made through the survey’s Part I) is made according
to the opinion of several respondents. And therefore there is not a true sense of scale in these answers
for these characteristics. Secondly, the potential on adopting agile practices is also based on opinion,
and therefore the study does not show true empirical evidence on the adoption of agile practices, but
only an insight based on opinion. In order to surpass these limitations, it is advised for future work to
use a single observant to evaluate project and company characteristics, and to use implementation case
studies in projects using different practices where the success is then measured with continuous
variables – especially time and budget compliance. Another difficulty encountered was the assessment
of agile implementation in different sectors. In order to do it more effectively it is advised a much larger
sample size than the one obtained in this study.
Page 93
73
References
Abbas, N., Gravell, A. M., & Wills, G. B. (2008). Historical Roots of Agile Methods: Where Did “Agile
Thinking” Come From? In Agile Processes in Software Engineering and Extreme Programming
(Vol. 9, pp. 94–103). Berlin, Heidelberg: Springer Berlin Heidelberg. http://doi.org/10.1007/978-
3-540-68255-4_10
Abrahamsson, P., Salo, O., Ronkainen, J., & Warsta, J. (2002). Agile software development methods:
Review and Analysis. Espoo: VTT Publications.
Abrahamsson, P., Warsta, J., Siponen, M. T., & Ronkainen, J. (2003). New Directions on Agile
Methods: A Comparative Analysis. In 25th International Conference on Software Engineering,
2003 Proceedings. (pp. 244–254). Portland: IEEE Computer Society.
http://doi.org/10.1109/ICSE.2003.1201204
Anderson, D. J. (2010). Kanban: Successful Evolutionary Change for Technology Organizations. Blue
Hole Press.
Balaji, S., & Murugaiyan, M. (2012). Waterfall Vs V-Model Vs Agile : A Comparitive Study on SDLC.
International Journal of Information and Business Management, 2(1), 26–30.
Baskerville, R., Ramesh, B., Levine, L., Pries-Heje, J., & Slaughter, S. (2003). Is Internet-Speed
Software Development Different ? Software, IEEE, 20(6), 70–77.
http://doi.org/10.1109/MS.2003.1241369
Beck, K. (1999). Extreme Programming Explained: Embrace Change (1st ed., Vol. 92). Boston:
Addison-Wesley Professional.
Beck, K., Beedle, M., Bennekum, A. van, Cockburn, A., Cunningham, W., Fowler, M., … Thomas, D.
(2001). Manifesto for Agile Software Development. Retrieved February 15, 2015, from
http://agilemanifesto.org/
Berger, H. (2007). Agile development in a bureaucratic arena—A case study experience. International
Journal of Information Management, 27(6), 386–396.
http://doi.org/10.1016/j.ijinfomgt.2007.08.009
Boehm, B., & Turner, R. (2004). Balancing Agility and Discipline (1st ed.). Addison-Wesley
Professional.
Boehm, B., & Turner, R. (2005). Management Challenges to Implementing Agile Processes in
Traditional Development Organizations. IEEE Software, 22(5), 30–39.
http://doi.org/10.1109/MS.2005.129
Borth, M. R., & Shishido, H. Y. (2013). A Comparative Analysis of Two Software Development
Methodologies: Rational Unified Process and Extreme Programming. Revista Vértices, 15(3),
143–157. http://doi.org/10.5935/1809-2667.20130035
Brennan, K. (2009). A Guide to the Business Analysis Body of Knowledge (BABOK Guide) (2nd ed.).
International Institute of Business Analysis.
Carlson, R., & Turner, R. (2013). Review of Agile Case Studies for Applicability to Aircraft Systems
Integration. Procedia Computer Science, 16, 469–474. http://doi.org/10.1016/j.procs.2013.01.049
Cervone, H. F. (2011). Understanding agile project management methods using Scrum. OCLC Systems
& Services, 27(1), 18–22. http://doi.org/10.1108/10650751111106528
Coad, P., de Luca, J., & Lefebvre, E. (1999). Java Modeling In Color With UML: Enterprise
Components and Process. Pearson PTR.
Cockburn, A. (2002). Agile Software Development (1st ed.). Addison-Wesley Professional.
Cohen, D., & Lindvall, M. (2004). An Introduction to Agile Methods. Advances In Computers, 62, 1–
66. http://doi.org/10.1016
Cusumano, M. A., & Selby, R. W. (1997). How Microsoft Builds Software. Communications of the
ACM, 40(6), 53–61. http://doi.org/10.1145/255656.255698
Page 94
74
DSDM Consortium. (2008). DSDM Atern V2. (A. Craddock, B. Fazackerley, S. Messenger, B. Roberts,
& J. Stapleton, Eds.). Ashford: DSDM Consortium.
Dybå, T., & Dingsøyr, T. (2008). Empirical studies of agile software development: A systematic review.
Information and Software Technology, 50(9-10), 833–859.
http://doi.org/10.1016/j.infsof.2008.01.006
Edeki, C. (2013). Agile Unified Process. International Journal of Computer Science and Mobile
Applications, 1(3), 13–17.
Farell, C., Narang, R., Kapitan, S., & Webber, H. (2002). Towards an Effective Onsite Customer
Practice. In XP 2002. Sardinia.
Fernandes, J. M., & Almeida, M. (2010). Classification and Comparison of Agile Methods. In 2010
Seventh International Conference on the Quality of Information and Communications Technology
(pp. 391–396). Porto: IEEE. http://doi.org/10.1109/QUATIC.2010.71
Grossman, F., Bergin, J., Leip, D., Merritt, S., & Gotel, O. (2004). One XP Experience: Introducing
Agile (XP) Software Development into a Culture that is Willing but not Ready. In H. Lutfiyya, J.
Singer, & D. A. Stewart (Eds.), CASCON ’04 Proceedings of the 2004 conference of the Centre
for Advanced Studies on Collaborative research (pp. 242–254). Markham, Ontario: IBM Press.
Hajjdiab, H., Taleb, A. S., & Ali, J. (2012). An Industrial Case Study for Scrum Adoption. Journal of
Software, 7(1), 237–242. http://doi.org/10.4304/jsw.7.1.237-242
Hall, N. G. (2012). Project management: Recent developments and research opportunities. Journal of
Systems Science and Systems Engineering, 21(2), 129–143. http://doi.org/10.1007/s11518-012-
5190-5
Highsmith, J. (2000). Adaptive Software Development: a collaborative approach to managing complex
systems. New York: Dorset House Publishing Co.
Highsmith, J. (2002). Agile Software Development Ecosystems. Indianapolis: Addison-Wesley.
Highsmith, J. A. (2002). Agile Software Development Ecosystems. Addison-Wesley. Retrieved from
http://books.google.pt/books?id=8Or-q-EXdgEC
Hoegl, M. (2005). Smaller teams — better teamwork : How to keep project teams small. Business
Horizons, 48(3), 209–214. http://doi.org/10.1016/j.bushor.2004.10.013
Huang, P. M., Darrin, a. G., & Knuth, a. a. (2012). Agile hardware and software system engineering
for innovation. In 2012 IEEE Aerospace Conference (pp. 1–10). Big Sky, MT: IEEE.
http://doi.org/10.1109/AERO.2012.6187425
Hunt, J. (2006). Agile Software Construction. London: Springer London. http://doi.org/10.1007/1-
84628-262-4
Koskela, J., & Abrahamsson, P. (2004). Software Process Improvement. (T. Dingsøyr, Ed.)Software
Process Improvement (Vol. 3281). Berlin, Heidelberg: Springer Berlin Heidelberg.
http://doi.org/10.1007/b102170
Kruchten, P. (2000). The Rational Unified Process: An Introduction (2nd ed.). Massachusetts: Addison
Wesley Longman.
Larman, C., & Basili, V. R. (2003). Iterative and incremental developments. a brief history. Computer,
36(6), 47–56. http://doi.org/10.1109/MC.2003.1204375
Layman, L., Williams, L., & Cunningham, L. (2006). Motivations and measurements in an agile case
study, 52, 654–667. http://doi.org/10.1016/j.sysarc.2006.06.009
Likert, R. (1932). A Technique for the measturement of Attittudes. Archives of Psychology, 22(140),
55.
Page 95
75
Lindvall, M., Basili, V., Boehm, B., Costa, P., Dangle, K., Shull, F., … Zelkowitz, M. (2002). Empirical
Findings in Agile Methods. In D. Wells & L. Williams (Eds.), Extreme Programming and Agile
Methods — XP/Agile Universe 2002 SE - 19 (Vol. 2418, pp. 197–207). Springer Berlin
Heidelberg. http://doi.org/10.1007/3-540-45672-4_19
Mann, C., & Maurer, F. (2005). A Case Study on the Impact of Scrum on Overtime and Customer
Satisfaction. In ADC ’05 Proceedings of the Agile Development Conference (pp. 70–79).
Washington DC, USA: IEEE Computer Society. http://doi.org/10.1109/ADC.2005.1
Mooi, E., & Sarstedt, M. (2011). A Concise Guide to Market Research. Analysis (Vol. 2). Berlin,
Heidelberg: Springer Berlin Heidelberg. http://doi.org/10.1007/978-3-642-12541-6
Olson, E. M., Walker, O. C., & Ruekert, R. W. (1995). Organizing for Effective New Product
Development : The Moderating Role of Product Innovativeness. Journal of Marketing,
59(January), 48–62.
Oxford University Press. (2015). OED Online. Retrieved January 23, 2015, from
http://www.oed.com/view/Entry/24905?redirectedFrom=bureaucracy#eid
Palmer, S. R., & Felsing, J. (2002). A Practical Guide to Feature-Driven Development (1st ed.). Upper
Saddle River: Prentice Hall.
Pencavel, J. (2014). The Productivity of Working Hours. The Economic Journal.
http://doi.org/10.1111/ecoj.12166
Pinto, J. K., & Slevin, D. P. (1987). Critical factors in successful project implementation. Engineering
Management, IEEE Transactions on, 34(1), 22–27. http://doi.org/10.1109/TEM.1987.6498856
Proença, T. (2010). Self-managed work teams: an enabling or coercive nature. The International
Journal of Human Resource Management, 21(3), 337–354.
http://doi.org/10.1080/09585190903546870
Project Management Institute. (2008). A Guide to the Project Management Body of Knowledge (4th
ed.). Pennsylvania: Project Management Institute.
Reed, A. H., & Knight, L. V. (2010). Project Risk Differences Between Virtual and Co-Located Teams.
Journal of Computer Information Systems, 51(1), 19–30.
Reynisdóttir, Þ. (2013). Scrum in Mechanical Product Development: Case Study of a Mechanical
Product Development Team using Scrum. Chalmers University of Technology.
Ribeiro, F. L., & Fernandes, M. T. (2010). Exploring agile methods in construction small and medium
enterprises: a case study. Journal of Enterprise Information Management, 23(2), 161–180.
http://doi.org/10.1108/17410391011019750
Royce, W. W. (1970). Managing the Development of Large Software Systems. In IEEE WESCON
Proceedings (pp. 1–9). Los Angeles.
Rubin, K. S. (2012). Essential Scrum: A Practical Guide to the Most Popular Agile Process (1st ed.).
New Jersey: Addison-Wesley Professional.
Sampaio, D. (2011). Applicability of Agile Methodologies in Global Software Development Projects -
A Scrum Case Study. Instituto Universitário de Lisboa.
Savolainen, J., Kuusela, J., & Vilavaara, A. (2010). Transition to Agile Development - Rediscovery of
Important Requirements Engineering Practices. In 2010 18th IEEE International Requirements
Engineering Conference (pp. 289–294). Sydney: IEEE. http://doi.org/10.1109/RE.2010.41
Schwaber, K. (2004). Agile Project Management with Scrum. (L. Engelman & R. Van Steenburgh,
Eds.) (1st ed.). Washington: Microsoft Press.
Siegel, S. (1956). Nonparametric statistics for the Behavioral Sciences. New York: McGraw-Hill.
Page 96
76
Silva, A., Kon, F., & Torteli, C. (2005). XP South of the Equator: An eXPerience Implementing XP in
Brazil. In H. Baumeister, M. Marchesi, & M. Holcombe (Eds.), Extreme Programming and Agile
Processes in Software Engineering (Vol. 3556, pp. 10–18). Berlin, Heidelberg: Springer Berlin
Heidelberg. http://doi.org/10.1007/b137278
Soundararajan, S. (2011). A Methodology for Assessing Agile Software Development Approaches.
Retrieved from http://arxiv.org/abs/1108.0427
Strode, D. E. (2005). The Agile Methods: An Analytical Comparison of Five Agile Methods and an
Ivestigation of Their Target Environment. Massey University. Retrieved from
http://hdl.handle.net/10179/515
Takeuchi, H., & Nonaka, I. (1986). The new new product development game. Journal of Product
Innovation Management, 3(3), 205–206. http://doi.org/10.1016/0737-6782(86)90053-6
United States Census Bureau. (2015). 2012 North American Industry Classification System.
VersionOne. (2007a). 2nd Annual Survey: The State of Agile Development. Retrieved from
http://www.versionone.com/pdf/StateOfAgileDevelopmet2_FullDataReport.pdf
VersionOne. (2007b). Survey: The State of Agile Development. Retrieved from
http://www.versionone.com/pdf/2006-state-of-agile-survey.pdf
VersionOne. (2008). 3rd Annual Survey: The State of Agile Development. Retrieved from
http://www.versionone.com/pdf/3rdAnnualStateOfAgile_FullDataReport.pdf
VersionOne. (2009). 4th Annual Survey: The State of Agile Development. Retrieved from
http://www.versionone.com/pdf/2009_state_of_agile_development_survey_results.pdf
VersionOne. (2010). 5th Annual: State of Agile Survey. Retrieved from
http://www.versionone.com/pdf/2010_State_of_Agile_Development_Survey_Results.pdf
VersionOne. (2012). 6th Annual: State of Agile Survey. Retrieved from
https://www.versionone.com/pdf/2010_State_of_Agile_Development_Survey_Results.pdf
VersionOne. (2013). 7th Annual: State of Agile Development Survey. Retrieved from
http://www.versionone.com/pdf/7th-Annual-State-of-Agile-Development-Survey.pdf
VersionOne. (2014). 8th Annual State of Agile Survey. Retrieved from
http://stateofagile.versionone.com/8th-annual-state-of-agile-form/
Williams, M., Packlick, J., & Coburn, S. (2007). How We Made Onsite Customer Work - An Extreme
Success Story. In Agile Conference (AGILE), 2007 (pp. 334 – 338). Washington, DC: IEEE.
http://doi.org/10.1109/AGILE.2007.33
Youker, R. (1999). The Difference Between Different Types of Projects. In The Project Management
Institute 1999 Conference. Philadelphia.
Page 97
77
Annex I – Survey
The following survey was conceived to study the agility of current Project Management practices and
was developed within the scope of a Master’s dissertation research study in Industrial Engineering.
To answer this survey, please consider an ongoing or recently finished project which you are (or have
been) managing for your company that could be representative of your practices as a project manager
in your organization.
The survey will take 10 min approximately and if any question arises regarding the present survey,
please send an email to [email protected] with the subject: "Survey - Project Management
Practices".
All answers are confidential and the respondent source will not be identified.
Thanks in advance for your invaluable collaboration!
Daniel Gouveia
1. How long (in years) have you been responsible for managing projects?
2. In which country was your company formed?
3. What kind of commercial presence does your company have?
1.Local
2.National
3.International
4.Global
Page 98
78
4. Which is the most relevant sector of your company?
1.Agriculture, Forestry, Fishing and Hunting
2.Mining, Quarrying, and Oil and Gas Extraction
3.Utilities
4.Construction
5.Manufacturing
6.Wholesale Trade
7.Retail Trade
8.Transportation and Warehousing
9.Information and Communications
10.Finance and Insurance
11.Real Estate and Rental and Leasing
12.Legal Services
13.Accounting, Tax Preparation, Bookkeeping, and Payroll Services
14.Architectural, Engineering, and Related Services
15.Specialized Design Services
16.Computer Systems Design and Related Services
17.Management, Scientific, and Technical Consulting Services
18.Scientific Research and Development Services
19.Advertising, Public Relations, and Related Services
20.Other Professional, Scientific, and Technical Services
21.Management of Companies and Enterprises
22.Administrative and Support and Waste Management and Remediation Services
23.Educational Services
24.Health Care and Social Assistance
25.Arts, Entertainment, and Recreation
26.Accommodation and Food Services
27.Other Services (except Public Administration)
28.Public Administration
Page 99
79
5. The chosen project fits best in which category?
1.Administrative (e.g. installing a new accounting system)
2.Construction
3.Computer Software Development
4.Design of Plans (e.g. architectural or engineering plans)
5.Equipment or System Installation (e.g. a telephone system or IT system)
6.Event or Relocation (e.g. Olympiads or a move into a new building)
7.Maintenance of Process Industries (e.g. petrochemical plant or electric generating station)
8.New Product Development
9.Research
10.Other. Which?
Please answer the following questions accordingly:
6. What would be the maximum impact of a project failure?
1.No Significant Impact
2.Low Impact (Small Costs)
3.Significant Impact (Significant Costs)
4.High Impact (a life)
5.Catastrophic Impact (many lives)
7. How big is the project team?
Up to 3 members
4 to 10 members
11 to 30 members
31 to 100 members
More than 100 members
Page 100
80
For the following sentences, please state your position:
8. In the chosen project, team members have good interpersonal skills.
1.Strongly Disagree
2.Disagree
3.Agree
4.Strongly Agree
9. In the chosen project, team members are experienced and autonomous.
1.Strongly Disagree
2.Disagree
3.Agree
4.Strongly Agree
10. In the chosen project, team members are motivated individuals.
1.Strongly Disagree
2.Disagree
3.Agree
4.Strongly Agree
11. Face-to-face communication is preferred over formal communication.
1.Strongly Disagree
2.Disagree
3.Agree
4.Strongly Agree
12. The company has a trust environment between individuals.
1.Strongly Disagree
2.Disagree
3.Agree
4.Strongly Agree
Page 101
81
13. The company is highly bureaucratic.
1.Strongly Disagree
2.Disagree
3.Agree
4.Strongly Agree
14. The project's final products are highly innovative.
1.Strongly Disagree
2.Disagree
3.Agree
4.Strongly Agree
15. The market in which your company operates is highly innovative.
1.Strongly Disagree
2.Disagree
3.Agree
4.Strongly Agree
16. The project’s initial scope is vague by nature.
1.Strongly Disagree
2.Disagree
3.Agree
4.Strongly Agree
17. The market in which your company operates is highly competitive.
1.Strongly Disagree
2.Disagree
3.Agree
4.Strongly Agree
Page 102
82
Please state your opinion on the plausible impact arising from the implementation of the following
practices in your projects:
18. Project teams must be kept as small as possible.
1- Strong
negative impact
2 3 – No impact 4 5 – Strong
positive impact
a a a a a
19. The Project team must work in the same space.
1- Strong
negative impact
2 3 – No impact 4 5 – Strong
positive impact
a a a a a
20. Project teams are self-managed.
1- Strong
negative impact
2 3 – No impact 4 5 – Strong
positive impact
a a a a a
21. Teams should be cross-functional in two basic dimensions: people who can identify business
value and people with technical knowledge.
1- Strong
negative impact
2 3 – No impact 4 5 – Strong
positive impact
a a a a a
22. A list of requirements split into tasks (which are estimated and prioritized) is made available
and is visibly displayed for the project team at all times.
1- Strong
negative impact
2 3 – No impact 4 5 – Strong
positive impact
a a a a a
23. Use of a chart which complements the list of requirements identifying tasks as "Ready",
"Ongoing", and "Complete".
1- Strong
negative impact
2 3 – No impact 4 5 – Strong
positive impact
a a a a a
Page 103
83
24. Using tracking graphs which plot workload over the elapsed time, allowing also an
estimation of completion by drawing a trend line (only complete tasks are used to update the
graph).
1- Strong
negative impact
2 3 – No impact 4 5 – Strong
positive impact
a a a a a
25. A final product scenario must be read by every team member and is always available for
consultation.
1- Strong
negative impact
2 3 – No impact 4 5 – Strong
positive impact
a a a a a
26. Use of Project Review Meetings generally supported by the use of presentations to show the
main accomplishments to previously selected key stakeholders.
1- Strong
negative impact
2 3 – No impact 4 5 – Strong
positive impact
a a a a a
27. The use of Project Retrospective Meetings attended by the project team to discuss the
current processes and to propose new approaches in order to improve communication,
teamwork, etc.
1- Strong
negative impact
2 3 – No impact 4 5 – Strong
positive impact
a a a a a
28. An end user or a representative is always close and available to act as a consultant whenever
the project team needs.
1- Strong
negative impact
2 3 – No impact 4 5 – Strong
positive impact
a a a a a
29. Daily Meetings take place where every team member answers the following questions:
"What have you contributed to the project since last meeting?", "What will you deliver between
now and the next meeting?", and "Is there anything that is preventing you to work as efficiently
as possible?" (No prolonged discussions are allowed at these meetings)
1- Strong
negative impact
2 3 – No impact 4 5 – Strong
positive impact
a a a a a
Page 104
84
30. A week's work cannot be longer than 40 hours except for meeting tight schedules. (If extra-
work is recurrent it must be addressed as a problem)
1- Strong
negative impact
2 3 – No impact 4 5 – Strong
positive impact
a a a a a
31. Every piece of work can be edited by any project member.
1- Strong
negative impact
2 3 – No impact 4 5 – Strong
positive impact
a a a a a
32. Functional tests are written up before any development takes place. These tests are then
used as requirements.
1- Strong
negative impact
2 3 – No impact 4 5 – Strong
positive impact
a a a a a
33. Tests are carried out constantly, and if possible, applied to small parts of the final product.
1- Strong
negative impact
2 3 – No impact 4 5 – Strong
positive impact
a a a a a
Page 105
85
Please consider the following Iterative Approach where requirements and the project's
approach are in constant evaluation.
For the case illustrated in the figure below, 2 backlogs are used: one that defines the requirements for
the product as a whole (product backlog) and another which identifies all the requirements to be
addressed during a single iteration (iteration backlog). Since requirements can change, so can the
product Backlog. However, once an Iteration backlog is agreed, it remains unchanged.
The following diagram illustrates how such process can be implemented (if necessary you can zoom in
with Ctrl+Scroll):
34. Evaluate the possible impact of the exemplified Iterative approach (see figure) in your
projects.
1- Strong
negative impact
2 3 – No impact 4 5 – Strong
positive impact
a a a a a
35. Are you familiar with terms and practices of Agile Project Management?
1.Yes and I’ve experienced its practices
2.Yes but I haven’t experienced its practices
3.I recognize the concept
4.No, I never heard of it before
Please identify your company in order to ease the segmentation process (not mandatory)
If you would like to have a first hand of this study's results, please send an email to
[email protected] with the following code in the subject: ResPrGP2015 and the study
results will be sent as soon as available.
Daniel Gouveia
Page 106
86
Annex II – Survey Responses to Part II in IT and non-IT companies
a) Responses by Non-IT companies
N=40
These results exclude respondents who answered 16.Computer Systems Design and Related Services
in question 4.
Table II.1 – Responses to Part II in IT Companies
Q18
Q19
Q20
Q21
Q22
Q23
Q24
Q25
Q26
Q27
Q28
Q29
Q30
Q31
Q32
Q33
Q34
1 -
Stro
ng
Ne
gati
ve Im
pac
t8%
0%8%
0%3%
3%0%
0%0%
0%0%
10%
0%20
%3%
3%3%
2 -
Ne
gati
ve Im
pac
t15
%8%
33%
3%5%
3%8%
8%3%
5%5%
15%
20%
40%
13%
15%
8%
3 -
No
imp
act
30%
40%
18%
15%
8%10
%15
%30
%20
%18
%10
%20
%28
%20
%25
%28
%25
%
4 -
Po
siti
ve Im
pac
t35
%38
%35
%40
%50
%53
%50
%40
%48
%48
%43
%40
%30
%13
%43
%40
%55
%
5 -
Stro
ng
po
siti
ve im
pac
t13
%15
%8%
43%
35%
33%
28%
23%
30%
30%
43%
15%
23%
8%18
%15
%10
%
Page 107
87
b) Responses by IT Companies
N=20
These results only include respondents who answered 16.Computer Systems Design and Related
Services in question 4.
Table II.2 – Responses to Part II in IT Companies
Q18
Q19
Q20
Q21
Q22
Q23
Q24
Q25
Q26
Q27
Q28
Q29
Q30
Q31
Q32
Q33
Q34
1 -
Stro
ng
Ne
gati
ve Im
pac
t5%
0%10
%0%
5%0%
0%0%
0%0%
0%5%
0%15
%0%
0%5%
2 -
Ne
gati
ve Im
pac
t20
%0%
40%
5%0%
0%5%
5%0%
0%10
%5%
15%
50%
5%5%
10%
3 -
No
imp
act
25%
25%
10%
5%5%
5%10
%30
%10
%10
%5%
25%
10%
5%20
%5%
25%
4 -
Po
siti
ve Im
pac
t40
%60
%30
%35
%15
%30
%45
%50
%55
%50
%40
%45
%45
%20
%60
%55
%40
%
5 -
Stro
ng
po
siti
ve im
pac
t10
%15
%10
%55
%75
%65
%40
%15
%35
%40
%45
%20
%30
%10
%15
%35
%20
%
Page 108
88
c) Comparison between IT and non-IT companies
Table II.3 – Comparison between IT and non-IT companies in Part II
Sm
all
Te
am
s
(Q.1
8)
Co
-lo
cate
d
tea
m
(Q.1
9)
Se
lf-
Ma
na
ge
d
(Q.2
0)
Cro
ss
-
fun
ctio
na
l
tea
ms
(Q.2
1)
Ba
cklo
g
(Q.2
2)
Ka
nb
an
(Q.2
3)
Bu
rnd
ow
n
(Q.2
4)
Me
tap
ho
r
(Q.2
5)
Re
vie
w
me
eti
ng
(Q.2
6)
Re
tro
sp
ect
ive
(Q.2
7)
Ava
ila
ble
clie
nt
(Q.2
8)
Da
ily
me
eti
ng
s
(Q.2
9)
40
h w
ee
k
(Q.3
0)
Co
lle
ctiv
e
Ow
ne
rsh
ip
(Q.3
1)
Te
st
dri
ven
de
velo
pm
en
t
(Q.3
2)
Co
ns
tan
t
tes
tin
g
(Q.3
3)
Ite
rati
ve
ap
pro
ach
(Q.3
4)
IT C
om
pan
ies
NA
NA
No
n-I
T C
om
pan
ies
NA
NA
NA
No
agr
ee
me
nt
by
the
maj
ori
ty o
f re
spo
nd
en
ts
Mo
re t
han
50%
of
resp
on
de
nts
agr
ee
th
at t
he
pra
ctic
e h
as a
Po
siti
ve o
r St
ron
g P
osi
tive
Imp
act
Mo
re t
han
75%
of
resp
on
de
nts
agr
ee
th
at t
he
pra
ctic
e h
as a
Po
siti
ve o
r St
ron
g P
osi
tive
Imp
act
Mo
re t
han
50%
of
resp
on
de
nts
agr
ee
th
at t
he
pra
ctic
e h
as a
Ne
gati
ve o
r St
ron
g N
ega
tive
Imp
act
Page 109
89
Annex III – Survey Responses to Part II by sector
a) Responses by the Manufacturing sector
N=5
These results only include respondents who answered 5.Manufacturing in question 4.
Table III.1 – Responses to Part II in the Manufacturing sector
Q18
Q19
Q20
Q21
Q22
Q23
Q24
Q25
Q26
Q27
Q28
Q29
Q30
Q31
Q32
Q33
Q34
1 -
Stro
ng
Ne
gati
ve Im
pac
t0%
0%0%
0%0%
0%0%
0%0%
0%0%
0%0%
0%0%
0%0%
2 -
Ne
gati
ve Im
pac
t0%
0%40
%0%
0%0%
0%0%
0%0%
0%20
%20
%60
%20
%20
%0%
3 -
No
imp
act
20%
40%
20%
0%20
%20
%20
%20
%0%
0%20
%40
%20
%20
%20
%60
%20
%
4 -
Po
siti
ve Im
pac
t60
%40
%40
%60
%40
%40
%60
%60
%80
%80
%40
%20
%40
%0%
40%
0%60
%
5 -
Stro
ng
po
siti
ve im
pac
t20
%20
%0%
40%
40%
40%
20%
20%
20%
20%
40%
20%
20%
20%
20%
20%
20%
Page 110
90
b) Responses by the Information and Communication sector
N=4
These results only include respondents who answered 9.Information and Communications in question
4.
Table III.2 – Responses to Part II in the Information and Communication sector
Q18
Q19
Q20
Q21
Q22
Q23
Q24
Q25
Q26
Q27
Q28
Q29
Q30
Q31
Q32
Q33
Q34
1 -
Stro
ng
Ne
gati
ve Im
pac
t25
%0%
25%
0%0%
0%0%
0%0%
0%0%
0%0%
50%
0%0%
0%
2 -
Ne
gati
ve Im
pac
t0%
0%0%
0%0%
0%0%
0%0%
0%0%
0%25
%25
%0%
0%0%
3 -
No
imp
act
25%
75%
25%
25%
0%0%
0%25
%25
%0%
0%0%
0%0%
0%0%
0%
4 -
Po
siti
ve Im
pac
t50
%25
%25
%50
%0%
0%25
%50
%0%
25%
25%
50%
0%0%
50%
25%
50%
5 -
Stro
ng
po
siti
ve im
pac
t0%
0%25
%25
%10
0%10
0%75
%25
%75
%75
%75
%50
%75
%25
%50
%75
%50
%
Page 111
91
c) Responses by the Architectural, Engineering, and Related Services sector
N=4
These results only include respondents who answered 14.Architectural, Engineering, and Related
Services in question 4.
Table III.3 – Responses to Part II in the Architectural, Engineering, and Related Services sector
Q18
Q19
Q20
Q21
Q22
Q23
Q24
Q25
Q26
Q27
Q28
Q29
Q30
Q31
Q32
Q33
Q34
1 -
Stro
ng
Ne
gati
ve Im
pac
t0%
0%0%
0%0%
0%0%
0%0%
0%0%
25%
0%25
%0%
0%0%
2 -
Ne
gati
ve Im
pac
t0%
0%50
%0%
0%0%
0%0%
0%0%
0%0%
0%25
%0%
0%25
%
3 -
No
imp
act
25%
0%0%
0%0%
0%0%
0%25
%0%
0%25
%0%
25%
25%
25%
25%
4 -
Po
siti
ve Im
pac
t75
%50
%50
%50
%75
%10
0%75
%10
0%50
%75
%10
0%50
%75
%25
%75
%75
%50
%
5 -
Stro
ng
po
siti
ve im
pac
t0%
50%
0%50
%25
%0%
25%
0%25
%25
%0%
0%25
%0%
0%0%
0%
Page 112
92
d) Responses by the Management, Scientific, and Technical Consulting Services sector
N=4
These results only include respondents who answered 17.Management, Scientific, and Technical
Consulting Services in question 4.
Table III.4 – Responses to Part II in the Management, Scientific, and Technical Consulting Services sector
Q18
Q19
Q20
Q21
Q22
Q23
Q24
Q25
Q26
Q27
Q28
Q29
Q30
Q31
Q32
Q33
Q34
1 -
Stro
ng
Ne
gati
ve Im
pac
t0%
0%25
%0%
0%0%
0%0%
0%0%
0%0%
0%25
%0%
0%25
%
2 -
Ne
gati
ve Im
pac
t25
%25
%25
%0%
25%
25%
25%
25%
0%0%
25%
50%
0%50
%25
%25
%0%
3 -
No
imp
act
0%25
%0%
0%0%
0%0%
25%
50%
25%
0%0%
0%25
%0%
25%
25%
4 -
Po
siti
ve Im
pac
t50
%25
%25
%25
%50
%25
%50
%25
%0%
50%
25%
25%
25%
0%50
%50
%50
%
5 -
Stro
ng
po
siti
ve im
pac
t25
%25
%25
%75
%25
%50
%25
%25
%50
%25
%50
%25
%75
%0%
25%
0%0%
Page 113
93
e) Responses by the Educational Services sector
N=8
These results only include respondents who answered 23.Educational Services in question 4.
Table III.5 – Responses to Part II in the Educational Services sector
Q18
Q19
Q20
Q21
Q22
Q23
Q24
Q25
Q26
Q27
Q28
Q29
Q30
Q31
Q32
Q33
Q34
1 -
Stro
ng
Ne
gati
ve Im
pac
t0%
0%0%
0%0%
0%0%
0%0%
0%0%
25%
0%13
%0%
0%0%
2 -
Ne
gati
ve Im
pac
t13
%0%
25%
0%13
%0%
13%
0%0%
13%
0%25
%38
%25
%38
%38
%13
%
3 -
No
imp
act
50%
50%
0%0%
0%13
%25
%38
%0%
13%
0%25
%38
%38
%50
%25
%50
%
4 -
Po
siti
ve Im
pac
t25
%50
%75
%63
%63
%75
%50
%25
%88
%50
%63
%25
%13
%13
%13
%38
%38
%
5 -
Stro
ng
po
siti
ve im
pac
t13
%0%
0%38
%25
%13
%13
%38
%13
%25
%38
%0%
13%
13%
0%0%
0%
Page 114
94
f) Comparison between sectors
Table III.6 – Comparison between Sectors in Part II
Sect
or
Sma
ll T
ea
ms
(Q.1
8)
Co
-lo
cate
d
tea
m (
Q.1
9)
Self
-
Ma
na
ged
(Q.2
0)
Cro
ss-
fun
ctio
na
l
tea
ms
(Q.2
1)
Ba
cklo
g
(Q.2
2)
Ka
nb
an
(Q.2
3)
Bu
rnd
ow
n
(Q.2
4)
Me
tap
ho
r
(Q.2
5)
Re
vie
w
me
eti
ng
(Q.2
6)
Re
tro
spe
ctiv
e
(Q.2
7)
Ava
ila
ble
clie
nt
(Q.2
8)
Da
ily
me
eti
ngs
(Q.2
9)
40
h w
ee
k
(Q.3
0)
Co
lle
ctiv
e
Ow
ne
rsh
ip
(Q.3
1)
Test
dri
ven
de
velo
pm
en
t
(Q.3
2)
Co
nst
an
t
test
ing
(Q.3
3)
Ite
rati
ve
ap
pro
ach
(Q.3
4)
5N
AN
A
9N
AN
A
14N
AN
AN
AN
A
17N
AN
AN
AN
AN
AN
AN
A
23N
AN
AN
AN
AN
AN
AN
AN
A
NA
No
agr
ee
me
nt
by
the
maj
ori
ty o
f re
spo
nd
en
ts
Mo
re t
han
50%
of
resp
on
de
nts
agr
ee
th
at t
he
pra
ctic
e h
as a
Po
siti
ve o
r St
ron
g P
osi
tive
Imp
act
Mo
re t
han
75%
of
resp
on
de
nts
agr
ee
th
at t
he
pra
ctic
e h
as a
Po
siti
ve o
r St
ron
g P
osi
tive
Imp
act
Mo
re t
han
50%
of
resp
on
de
nts
agr
ee
th
at t
he
pra
ctic
e h
as a
Ne
gati
ve o
r St
ron
g N
ega
tive
Imp
act
Mo
re t
han
50%
of
resp
on
de
nts
agr
ee
th
at t
he
pra
ctic
e h
as N
o Im
pac
t
Page 115
95
Annex IV – Survey Responses to Part II by Project Type
a) Responses by Administrative projects
N=5
These results only include respondents who answered 1.Administrative in question 5.
Table IV.1 - Answers to Part II for Administrative Projects
Q18
Q19
Q20
Q21
Q22
Q23
Q24
Q25
Q26
Q27
Q28
Q29
Q30
Q31
Q32
Q33
Q34
1 -
Stro
ng
Ne
gati
ve Im
pac
t20
%0%
0%0%
0%0%
0%0%
0%0%
0%0%
0%20
%0%
0%20
%
2 -
Ne
gati
ve Im
pac
t0%
0%20
%0%
0%0%
0%0%
0%0%
0%0%
60%
40%
0%0%
0%
3 -
No
imp
act
20%
40%
0%20
%0%
0%0%
40%
40%
60%
20%
20%
40%
0%40
%40
%40
%
4 -
Po
siti
ve Im
pac
t60
%40
%40
%60
%80
%10
0%10
0%60
%40
%20
%60
%80
%0%
40%
40%
60%
40%
5 -
Stro
ng
po
siti
ve im
pac
t0%
20%
40%
20%
20%
0%0%
0%20
%20
%20
%0%
0%0%
20%
0%0%
Page 116
96
b) Responses by Construction projects
N=5
These results only include respondents who answered 2.Construction in question 5.
Table IV.2 - Answers to Part II for Construction Projects
Q18
Q19
Q20
Q21
Q22
Q23
Q24
Q25
Q26
Q27
Q28
Q29
Q30
Q31
Q32
Q33
Q34
1 -
Stro
ng
Ne
gati
ve Im
pac
t0%
0%0%
0%0%
0%0%
0%0%
0%0%
20%
0%0%
0%0%
0%
2 -
Ne
gati
ve Im
pac
t20
%0%
20%
0%20
%0%
20%
0%0%
40%
0%40
%20
%60
%20
%20
%40
%
3 -
No
imp
act
40%
40%
20%
0%0%
0%20
%40
%0%
40%
0%0%
40%
20%
60%
20%
0%
4 -
Po
siti
ve Im
pac
t40
%60
%60
%40
%60
%10
0%60
%0%
80%
0%40
%40
%20
%0%
20%
60%
60%
5 -
Stro
ng
po
siti
ve im
pac
t0%
0%0%
60%
20%
0%0%
60%
20%
20%
60%
0%20
%20
%0%
0%0%
Page 117
97
c) Responses by Equipment or System Installation projects
N=9
These results only include respondents who answered 5.Equipment or System Installation in question
5.
Table IV.3 - Answers to Part II for Equipment or System Installation Projects
Q18
Q19
Q20
Q21
Q22
Q23
Q24
Q25
Q26
Q27
Q28
Q29
Q30
Q31
Q32
Q33
Q34
1 -
Stro
ng
Ne
gati
ve Im
pac
t11
%0%
11%
0%0%
0%0%
0%0%
0%0%
22%
0%56
%0%
0%0%
2 -
Ne
gati
ve Im
pac
t11
%0%
56%
0%0%
0%11
%0%
0%0%
0%0%
11%
44%
11%
11%
11%
3 -
No
imp
act
33%
22%
33%
11%
11%
11%
22%
33%
11%
0%0%
33%
44%
0%22
%22
%44
%
4 -
Po
siti
ve Im
pac
t44
%33
%0%
33%
44%
44%
33%
56%
56%
56%
67%
22%
33%
0%44
%44
%22
%
5 -
Stro
ng
po
siti
ve im
pac
t0%
44%
0%56
%44
%44
%33
%11
%33
%44
%33
%22
%11
%0%
22%
22%
22%
Page 118
98
d) Responses by New Product Development projects
N=5
These results only include respondents who answered 8.New Product Development in question 5.
Table IV.4 - Answers to Part II for New Product Development Projects
Q18
Q19
Q20
Q21
Q22
Q23
Q24
Q25
Q26
Q27
Q28
Q29
Q30
Q31
Q32
Q33
Q34
1 -
Stro
ng
Ne
gati
ve Im
pac
t0%
0%20
%0%
0%0%
0%0%
0%0%
0%0%
0%40
%0%
0%0%
2 -
Ne
gati
ve Im
pac
t20
%20
%40
%0%
0%0%
0%0%
20%
0%0%
0%0%
0%20
%0%
0%
3 -
No
imp
act
20%
20%
0%20
%0%
0%0%
0%0%
0%0%
0%0%
20%
0%0%
0%
4 -
Po
siti
ve Im
pac
t60
%40
%20
%40
%0%
20%
60%
80%
40%
40%
20%
80%
20%
20%
40%
40%
60%
5 -
Stro
ng
po
siti
ve im
pac
t0%
20%
20%
40%
100%
80%
40%
20%
40%
60%
80%
20%
80%
20%
40%
60%
40%
Page 119
99
e) Responses by Research projects
N=7
These results only include respondents who answered 9.Research in question 5.
Table IV.5 - Answers to Part II for Research Projects
Q18
Q19
Q20
Q21
Q22
Q23
Q24
Q25
Q26
Q27
Q28
Q29
Q30
Q31
Q32
Q33
Q34
1 -
Stro
ng
Ne
gati
ve Im
pac
t0%
0%0%
0%0%
0%0%
0%0%
0%0%
0%0%
0%0%
0%0%
2 -
Ne
gati
ve Im
pac
t43
%0%
43%
0%0%
0%0%
14%
0%0%
0%29
%0%
43%
0%0%
0%
3 -
No
imp
act
29%
57%
14%
57%
29%
14%
43%
43%
43%
29%
43%
29%
43%
43%
29%
57%
14%
4 -
Po
siti
ve Im
pac
t0%
29%
29%
0%71
%71
%43
%29
%43
%57
%29
%43
%43
%14
%71
%43
%86
%
5 -
Stro
ng
po
siti
ve im
pac
t29
%14
%14
%43
%0%
14%
14%
14%
14%
14%
29%
0%14
%0%
0%0%
0%
Page 120
100
f) Comparison between project types
Table IV.6 - Comparison between Project Types in Part II
Pro
ject
Typ
e
Sma
ll
Tea
ms
(Q.1
8)
Co
-lo
cate
d
tea
m (
Q.1
9)
Self
-
Ma
na
ged
(Q.2
0)
Cro
ss-
fun
ctio
na
l
tea
ms
(Q.2
1)
Ba
cklo
g
(Q.2
2)
Ka
nb
an
(Q.2
3)
Bu
rnd
ow
n
(Q.2
4)
Me
tap
ho
r
(Q.2
5)
Re
vie
w
me
eti
ng
(Q.2
6)
Re
tro
spe
ctiv
e
(Q.2
7)
Ava
ila
ble
clie
nt
(Q.2
8)
Da
ily
me
eti
ngs
(Q.2
9)
40
h w
ee
k
(Q.3
0)
Co
lle
ctiv
e
Ow
ne
rsh
ip
(Q.3
1)
Test
dri
ven
de
velo
pm
en
t
(Q.3
2)
Co
nst
an
t
test
ing
(Q.3
3)
Ite
rati
ve
ap
pro
ach
(Q.3
4)
1.A
dm
inis
trat
ive
NA
2.C
on
stru
ctio
nN
AN
AN
A
5.Eq
uip
me
nt
or
Syst
em
Inst
alla
tio
n
NA
NA
NA
NA
8.N
ew
Pro
du
ct D
eve
lop
me
nt
NA
9.R
ese
arch
NA
NA
NA
NA
NA
NA
No
agr
ee
me
nt
by
the
maj
ori
ty o
f re
spo
nd
en
ts
Mo
re t
han
50%
of
resp
on
de
nts
agr
ee
th
at t
he
pra
ctic
e h
as a
Po
siti
ve o
r St
ron
g P
osi
tive
Imp
act
Mo
re t
han
75%
of
resp
on
de
nts
agr
ee
th
at t
he
pra
ctic
e h
as a
Po
siti
ve o
r St
ron
g P
osi
tive
Imp
act
Mo
re t
han
50%
of
resp
on
de
nts
agr
ee
th
at t
he
pra
ctic
e h
as a
Ne
gati
ve o
r St
ron
g N
ega
tive
Imp
act
Mo
re t
han
50%
of
resp
on
de
nts
agr
ee
th
at t
he
pra
ctic
e h
as N
o Im
pac
t
Page 121
101
Annex V – Correlation Analysis
Table V.1 – Spearman’s Correlation between Variables in Part II and Variables in Part III
Q1
8Q
19
Q2
0Q
21
Q2
2Q
23
Q2
4Q
25
Q2
6Q
27
Q2
8Q
29
Q3
0Q
31
Q3
2Q
33
Q3
4
Co
rre
latio
n C
oe
ffic
ien
t,0
76
-,1
16
-,0
36
,18
2,2
62
*,1
82
,16
5,1
30
,21
2,1
69
,14
0,0
82
,15
0,0
28
,06
8,1
61
,05
2
Sig
. (2
-ta
ile
d)
,56
6,3
76
,78
2,1
64
,04
3,1
64
,20
8,3
21
,10
4,1
97
,28
5,5
31
,25
3,8
34
,60
8,2
20
,69
3
Co
rre
latio
n C
oe
ffic
ien
t-,
07
4-,
10
7-,
04
3,2
61
*,1
98
,22
9,2
13
,01
7,2
07
,06
6,2
27
,19
1,1
31
-,0
46
,32
3*
,20
7,1
12
Sig
. (2
-ta
ile
d)
,57
3,4
15
,74
7,0
44
,13
0,0
79
,10
2,8
95
,11
2,6
17
,08
1,1
45
,31
9,7
27
,01
2,1
13
,39
4
Co
rre
latio
n C
oe
ffic
ien
t-,
10
0-,
10
6-,
16
4,3
09
*,2
13
,30
4*
,10
7,0
08
,11
0-,
12
3-,
04
6,2
12
,09
7-,
04
3,1
07
,18
4,0
12
Sig
. (2
-ta
ile
d)
,44
7,4
19
,21
2,0
16
,10
2,0
18
,41
6,9
50
,40
4,3
48
,72
4,1
04
,46
3,7
46
,41
6,1
59
,93
0
Co
rre
latio
n C
oe
ffic
ien
t,3
60
**,0
98
,14
3,1
07
,08
1,0
79
,07
0,0
80
,15
1,1
46
-,0
40
,02
4-,
03
6,0
91
-,0
48
,12
1,1
20
Sig
. (2
-ta
ile
d)
,00
5,4
58
,27
6,4
16
,53
9,5
48
,59
6,5
44
,25
0,2
64
,76
2,8
55
,78
3,4
88
,71
6,3
59
,36
2
Co
rre
latio
n C
oe
ffic
ien
t,2
55
*,1
64
,29
0*
,02
3,1
06
-,0
51
-,1
57
-,0
24
-,0
58
,08
2,1
07
,04
5,0
78
,00
6-,
10
0,0
80
,16
1
Sig
. (2
-ta
ile
d)
,04
9,2
12
,02
5,8
64
,42
2,6
99
,23
1,8
54
,65
8,5
32
,41
5,7
34
,55
3,9
65
,44
7,5
42
,22
0
Co
rre
latio
n C
oe
ffic
ien
t,2
03
,12
8,0
79
,09
7,2
17
,26
9*
,38
5**
,30
2*
,07
6,1
69
,20
3,0
65
,23
3-,
06
5,1
23
,20
5,2
40
Sig
. (2
-ta
ile
d)
,12
0,3
29
,55
0,4
61
,09
6,0
38
,00
2,0
19
,56
5,1
96
,11
9,6
24
,07
3,6
21
,35
0,1
16
,06
4
Co
rre
latio
n C
oe
ffic
ien
t,1
91
,08
3-,
00
1,0
64
,28
3*
,27
5*
,22
4-,
11
7,2
75
*,2
63
*,0
34
,26
6*
,27
2*
-,0
04
,13
5,3
38
**,1
56
Sig
. (2
-ta
ile
d)
,14
3,5
30
,99
1,6
29
,02
9,0
33
,08
5,3
74
,03
4,0
43
,79
7,0
40
,03
5,9
77
,30
4,0
08
,23
5
Co
rre
latio
n C
oe
ffic
ien
t-,
04
9,1
01
,08
1-,
14
6-,
03
3-,
05
5-,
07
2,3
01
*,1
04
-,1
26
-,1
11
,03
1-,
18
0,2
50
-,1
02
,00
2-,
06
1
Sig
. (2
-ta
ile
d)
,71
0,4
42
,53
7,2
66
,80
1,6
78
,58
5,0
19
,42
8,3
36
,40
0,8
13
,16
9,0
54
,43
6,9
88
,64
6
Co
rre
latio
n C
oe
ffic
ien
t-,
21
9-,
27
3*
-,2
58
*,0
73
,30
1*
,28
4*
,36
4**
,16
4,1
11
,08
0-,
05
5,2
54
,07
3-,
02
2,1
24
,30
6*
,09
1
Sig
. (2
-ta
ile
d)
,09
3,0
35
,04
6,5
78
,01
9,0
28
,00
4,2
09
,39
9,5
42
,67
7,0
50
,57
8,8
66
,34
4,0
18
,49
1
Correlations
Q3
Q6
Q7
Q8
Q9
Q1
7
*. C
orr
ela
tio
n is
sig
nific
an
t a
t th
e 0
.05
le
vel (2
-ta
ile
d).
**. C
orr
ela
tio
n is
sig
nific
an
t a
t th
e 0
.01
le
vel (2
-ta
ile
d).
Q1
1
Q1
4
Q1
6
Page 122
102
Annex VI – Clustering Variables Correlation
Table VI.1 - Spearman’s Correlation Coefficients between the Variables in Part II
Q1
8Q
19
Q2
0Q
21
Q2
2Q
23
Q2
4Q
25
Q2
6Q
27
Q2
8Q
29
Q3
0Q
31
Q3
2Q
33
Q3
4
Co
rre
latio
n C
oe
ffic
ien
t1
,00
0,4
57
**,2
22
,10
9-,
02
3-,
01
0-,
02
9,0
46
,02
2,2
33
,21
5,0
72
,20
6,1
09
-,0
38
-,0
63
,02
6
Sig
. (2
-ta
ile
d)
,00
0,0
88
,40
6,8
63
,93
9,8
24
,72
8,8
66
,07
3,1
00
,58
2,1
14
,40
5,7
74
,63
2,8
44
Co
rre
latio
n C
oe
ffic
ien
t,4
57
**1
,00
0,0
82
,20
2,0
22
,01
7-,
03
7,1
21
,10
3,1
25
,10
2,0
38
,07
9-,
14
1,0
52
,11
7-,
08
7
Sig
. (2
-ta
ile
d)
,00
0,5
33
,12
2,8
66
,89
6,7
77
,35
5,4
33
,34
2,4
36
,77
1,5
51
,28
1,6
93
,37
2,5
07
Co
rre
latio
n C
oe
ffic
ien
t,2
22
,08
21
,00
0,0
40
-,1
60
-,1
67
-,1
43
,13
1-,
03
5,0
28
,07
2,0
00
-,1
00
,22
6,0
30
-,1
13
,17
4
Sig
. (2
-ta
ile
d)
,08
8,5
33
,76
4,2
23
,20
3,2
77
,32
0,7
93
,83
0,5
86
1,0
00
,44
9,0
82
,82
2,3
91
,18
3
Co
rre
latio
n C
oe
ffic
ien
t,1
09
,20
2,0
40
1,0
00
,28
0*
,19
9,0
54
,20
8,0
95
,22
1,2
52
-,0
33
,15
3-,
16
5,0
80
,24
1,0
92
Sig
. (2
-ta
ile
d)
,40
6,1
22
,76
4,0
30
,12
7,6
80
,11
0,4
69
,09
0,0
52
,80
0,2
44
,20
8,5
45
,06
3,4
84
Co
rre
latio
n C
oe
ffic
ien
t-,
02
3,0
22
-,1
60
,28
0*
1,0
00
,79
7**
,53
1**
,40
3**
,25
5*
,33
0*
,28
1*
,52
2**
,31
1*
,08
2,3
14
*,5
85
**,4
36
**
Sig
. (2
-ta
ile
d)
,86
3,8
66
,22
3,0
30
,00
0,0
00
,00
1,0
49
,01
0,0
30
,00
0,0
15
,53
2,0
15
,00
0,0
00
Co
rre
latio
n C
oe
ffic
ien
t-,
01
0,0
17
-,1
67
,19
9,7
97
**1
,00
0,6
37
**,4
86
**,4
63
**,4
65
**,4
87
**,5
90
**,2
88
*-,
04
9,4
15
**,6
07
**,4
10
**
Sig
. (2
-ta
ile
d)
,93
9,8
96
,20
3,1
27
,00
0,0
00
,00
0,0
00
,00
0,0
00
,00
0,0
25
,71
1,0
01
,00
0,0
01
Co
rre
latio
n C
oe
ffic
ien
t-,
02
9-,
03
7-,
14
3,0
54
,53
1**
,63
7**
1,0
00
,29
8*
,30
1*
,37
8**
,19
5,4
17
**,1
70
-,0
36
,47
1**
,54
2**
,31
9*
Sig
. (2
-ta
ile
d)
,82
4,7
77
,27
7,6
80
,00
0,0
00
,02
1,0
19
,00
3,1
34
,00
1,1
95
,78
2,0
00
,00
0,0
13
Co
rre
latio
n C
oe
ffic
ien
t,0
46
,12
1,1
31
,20
8,4
03
**,4
86
**,2
98
*1
,00
0,4
19
**,2
82
*,3
44
**,3
87
**,0
85
,16
8,1
58
,27
0*
,29
3*
Sig
. (2
-ta
ile
d)
,72
8,3
55
,32
0,1
10
,00
1,0
00
,02
1,0
01
,02
9,0
07
,00
2,5
16
,20
0,2
28
,03
7,0
23
Co
rre
latio
n C
oe
ffic
ien
t,0
22
,10
3-,
03
5,0
95
,25
5*
,46
3**
,30
1*
,41
9**
1,0
00
,52
2**
,38
4**
,46
3**
,16
8-,
14
1,3
80
**,3
97
**,2
10
Sig
. (2
-ta
ile
d)
,86
6,4
33
,79
3,4
69
,04
9,0
00
,01
9,0
01
,00
0,0
02
,00
0,1
99
,28
2,0
03
,00
2,1
08
Co
rre
latio
n C
oe
ffic
ien
t,2
33
,12
5,0
28
,22
1,3
30
*,4
65
**,3
78
**,2
82
*,5
22
**1
,00
0,3
84
**,4
02
**,2
00
-,3
14
*,2
65
*,4
16
**,4
91
**
Sig
. (2
-ta
ile
d)
,07
3,3
42
,83
0,0
90
,01
0,0
00
,00
3,0
29
,00
0,0
02
,00
1,1
26
,01
5,0
40
,00
1,0
00
Co
rre
latio
n C
oe
ffic
ien
t,2
15
,10
2,0
72
,25
2,2
81
*,4
87
**,1
95
,34
4**
,38
4**
,38
4**
1,0
00
,26
3*
,29
5*
-,1
13
,23
3,2
71
*,3
00
*
Sig
. (2
-ta
ile
d)
,10
0,4
36
,58
6,0
52
,03
0,0
00
,13
4,0
07
,00
2,0
02
,04
2,0
22
,39
0,0
73
,03
6,0
20
Co
rre
latio
n C
oe
ffic
ien
t,0
72
,03
8,0
00
-,0
33
,52
2**
,59
0**
,41
7**
,38
7**
,46
3**
,40
2**
,26
3*
1,0
00
,14
0,0
71
,49
4**
,51
5**
,45
3**
Sig
. (2
-ta
ile
d)
,58
2,7
71
1,0
00
,80
0,0
00
,00
0,0
01
,00
2,0
00
,00
1,0
42
,28
6,5
89
,00
0,0
00
,00
0
Co
rre
latio
n C
oe
ffic
ien
t,2
06
,07
9-,
10
0,1
53
,31
1*
,28
8*
,17
0,0
85
,16
8,2
00
,29
5*
,14
01
,00
0-,
00
6,2
91
*,3
37
**,2
62
*
Sig
. (2
-ta
ile
d)
,11
4,5
51
,44
9,2
44
,01
5,0
25
,19
5,5
16
,19
9,1
26
,02
2,2
86
,96
7,0
24
,00
8,0
43
Co
rre
latio
n C
oe
ffic
ien
t,1
09
-,1
41
,22
6-,
16
5,0
82
-,0
49
-,0
36
,16
8-,
14
1-,
31
4*
-,1
13
,07
1-,
00
61
,00
0-,
07
8-,
07
7,0
34
Sig
. (2
-ta
ile
d)
,40
5,2
81
,08
2,2
08
,53
2,7
11
,78
2,2
00
,28
2,0
15
,39
0,5
89
,96
7,5
53
,55
9,7
95
Co
rre
latio
n C
oe
ffic
ien
t-,
03
8,0
52
,03
0,0
80
,31
4*
,41
5**
,47
1**
,15
8,3
80
**,2
65
*,2
33
,49
4**
,29
1*
-,0
78
1,0
00
,64
4**
,40
8**
Sig
. (2
-ta
ile
d)
,77
4,6
93
,82
2,5
45
,01
5,0
01
,00
0,2
28
,00
3,0
40
,07
3,0
00
,02
4,5
53
,00
0,0
01
Co
rre
latio
n C
oe
ffic
ien
t-,
06
3,1
17
-,1
13
,24
1,5
85
**,6
07
**,5
42
**,2
70
*,3
97
**,4
16
**,2
71
*,5
15
**,3
37
**-,
07
7,6
44
**1
,00
0,3
65
**
Sig
. (2
-ta
ile
d)
,63
2,3
72
,39
1,0
63
,00
0,0
00
,00
0,0
37
,00
2,0
01
,03
6,0
00
,00
8,5
59
,00
0,0
04
Co
rre
latio
n C
oe
ffic
ien
t,0
26
-,0
87
,17
4,0
92
,43
6**
,41
0**
,31
9*
,29
3*
,21
0,4
91
**,3
00
*,4
53
**,2
62
*,0
34
,40
8**
,36
5**
1,0
00
Sig
. (2
-ta
ile
d)
,84
4,5
07
,18
3,4
84
,00
0,0
01
,01
3,0
23
,10
8,0
00
,02
0,0
00
,04
3,7
95
,00
1,0
04
Sp
ea
rma
n's
rho
Q1
8
Q1
9
Q2
0
Q2
1
Q2
2
Q2
3
Q2
4
Q2
5
Q2
6
Q2
7
Q2
8
Q2
9
Q3
0
Q3
1
Q3
2
Q3
3
Q3
4
**. C
orr
ela
tio
n is
sig
nific
an
t a
t th
e 0
.01
le
vel (2
-ta
ile
d).
*. C
orr
ela
tio
n is
sig
nific
an
t a
t th
e 0
.05
le
vel (2
-ta
ile
d).
Page 123
103
Annex VII – Cluster Analysis Dendrograms
a) First Iteration
Figure VII.1 - Cluster Analysis Dendrogram - First Iteration
Page 124
104
b) Second Iteration
Figure VII.2 - Cluster Analysis Dendrogram - Second Iteration
Page 125
105
Annex VIII – Cluster Data
a) Clustering Variables’ Scores by Cluster
Table VIII.1 - Clustering Variables' Scores by Cluster
Cluster Team Size Avg. (Q18)
Self-managed teams Avg. (Q20)
40h Week Avg. (Q30)
Collective Ownership Avg. (Q31)
Cluster Size
Cluster 1 4,22 3,44 4,44 4,56 9
Cluster 2 3,15 2,76 3,46 1,93 41
Cluster 3 4,40 4,40 4,80 2,20 5
Cluster 4 2,00 2,00 3,00 4,00 4
Overall average 3,34 2,95 3,69 2,49 Total: 59
b) Company and Project Characteristics’ by Cluster
Table VIII.2 - Part I Responses by Cluster (Part I)
Cluster 1
Cluster 2
Cluster 3
Cluster 4
Q3 - Commercial Presence
1 - Local 11% 12% 20% 25%
2 - National 11% 24% 20% 25%
3 - International 44% 51% 20% 25%
4 - Global 33% 12% 40% 25%
Q4 - Sector
1 - Agriculture, Forestry, Fishing and Hunting 0% 2% 0% 0%
3 - Utilities 0% 5% 0% 0%
4 - Construction 0% 5% 0% 0%
5 - Manufacturing 11% 10% 0% 0%
6 - Wholesale Trade 0% 0% 0% 25%
9 - Information and Communications 11% 7% 0% 0%
14 - Architectural, Engineering, and Related Services 11% 5% 20% 0%
16 - Computer Systems Design and Related Services 56% 29% 40% 0%
17 - Management, Scientific, and Technical Consulting Services
0% 5% 40% 0%
18 - Scientific Research and Development Services 0% 5% 0% 0%
19 - Advertising, Public Relations, and Related Services
0% 0% 0% 25%
20 - Other Professional, Scientific, and Technical Services
0% 5% 0% 25%
23 - Educational Services 11% 15% 0% 25%
24 - Health Care and Social Assistance 0% 2% 0% 0%
27 - Other Services (except Public Administration) 0% 2% 0% 0%
28 - Public Administration 0% 2% 0% 0%
Page 126
106
Table VIII.3 - Part I Responses by Cluster (Part II)
Cluster 1
Cluster 2
Cluster 3
Cluster 4
Q5 - Project Type
1 - Administrative 11% 7% 0% 0%
2 - Construction 11% 10% 0% 0%
3 - Computer Software Development 33% 29% 60% 0%
4 - Design of Plans 22% 0% 0% 0%
5 - Equipment or System Installation 0% 22% 0% 0%
6 - Event or Relocation 11% 2% 0% 25%
7 - Maintenance of Process Industries 0% 2% 0% 0%
8 - New Product Development 11% 5% 20% 25%
9 - Research 0% 12% 20% 25%
10 - Other 0% 10% 0% 25%
Q6 - Project Criticality
1 - No Significant Impact 0% 5% 0% 0%
2 - Low Impact (Small Costs) 11% 29% 20% 50%
3 - Significant Impact (Significant Costs) 78% 61% 80% 50%
4 - High Impact (a life) 0% 5% 0% 0%
5 - Catastrophic Impact (many lives) 11% 0% 0% 0%
Q7 - Team Size
1 - Up to 3 members 0% 22% 40% 75%
2 - 4 to 10 members 67% 49% 40% 0%
3 - 11 to 30 members 0% 0% 0% 0%
4 - 31 to 100 members 22% 17% 20% 0%
5 - More than 100 members 11% 12% 0% 25%
Q8 - Team members with good interpersonal skills
1 - Strongly Disagree 0% 0% 0% 0%
2 - Disagree 0% 2% 0% 25%
3 - Agree 78% 85% 60% 50%
4 - Strongly Agree 22% 12% 40% 25%
Q9 - Team members' experience and autonomy
1 - Strongly Disagree 0% 0% 0% 0%
2 - Disagree 0% 10% 0% 75%
3 - Agree 78% 80% 60% 25%
4 - Strongly Agree 22% 10% 40% 0%
Page 127
107
Table VIII.4 - Part I Responses by Cluster (Part III)
Cluster
1 Cluster
2 Cluster
3 Cluster
4 Q10 - Team members are motivated
1 - Strongly Disagree 0% 0% 0% 0%
2 - Disagree 11% 12% 20% 50%
3 - Agree 67% 71% 60% 50%
4 - Strongly Agree 22% 17% 20% 0%
Q11 - Face-to-face communication
1 - Strongly Disagree 0% 2% 0% 0%
2 - Disagree 0% 12% 0% 0%
3 - Agree 89% 68% 40% 75%
4 - Strongly Agree 11% 17% 60% 25%
Q12 - Trust environment
1 - Strongly Disagree 0% 0% 0% 25%
2 - Disagree 0% 10% 20% 0%
3 - Agree 89% 68% 20% 25%
4 - Strongly Agree 11% 22% 60% 50%
Q13 - Company Bureaucracy
1 - Strongly Disagree 11% 10% 0% 0%
2 - Disagree 67% 56% 20% 50%
3 - Agree 22% 27% 60% 50%
4 - Strongly Agree 0% 7% 20% 0%
Q14 - Project Product's Innovativeness
1 - Strongly Disagree 0% 2% 0% 25%
2 - Disagree 11% 10% 40% 25%
3 - Agree 44% 71% 20% 50%
4 - Strongly Agree 44% 17% 40% 0%
Q15 - Market's Innovativeness
1 - Strongly Disagree 0% 0% 0% 25%
2 - Disagree 33% 24% 20% 25%
3 - Agree 33% 49% 80% 25%
4 - Strongly Agree 33% 27% 0% 25%
Q16 - Vague Scope
1 - Strongly Disagree 0% 10% 40% 0%
2 - Disagree 56% 71% 40% 75%
3 - Agree 33% 15% 20% 25%
4 - Strongly Agree 11% 5% 0% 0%
Q17 - Competitiveness
1 - Strongly Disagree 0% 2% 0% 0%
2 - Disagree 11% 15% 20% 0%
3 - Agree 67% 46% 20% 0%
4 - Strongly Agree 22% 37% 60% 100%