IOP Conference Series: Materials Science and Engineering OPEN ACCESS An evaluation of 1D loss model collections for the off-design performance prediction of automotive turbocharger compressors To cite this article: P Harley et al 2013 IOP Conf. Ser.: Mater. Sci. Eng. 52 042011 View the article online for updates and enhancements. You may also like Simulation on the Performance of a Driven Fan Made by Polyester/Epoxy interpenetrate polymer network (IPN) Mohd Fahrul Hassan, Azmil Jamri, Azli Nawawi et al. - Turbocharging small size engine to increase engine output: An assessment of turbocharger study field H M Herzwan, A Azri and M Rizalman - An experimental procedure to determine heat transfer properties of turbochargers J R Serrano, P Olmeda, A Páez et al. - Recent citations A Centrifugal Compressor Performance Map Empirical Prediction Method for Automotive Turbochargers Antonios Fatsis et al - This content was downloaded from IP address 201.143.229.156 on 24/12/2021 at 18:44
Transcript
IOP Conference Series: Materials Science and Engineering
OPEN ACCESS
An evaluation of 1D loss model collections for theoff-design performance prediction of automotiveturbocharger compressorsTo cite this article: P Harley et al 2013 IOP Conf. Ser.: Mater. Sci. Eng. 52 042011
View the article online for updates and enhancements.
You may also likeSimulation on the Performance of a DrivenFan Made by Polyester/Epoxyinterpenetrate polymer network (IPN)Mohd Fahrul Hassan, Azmil Jamri, AzliNawawi et al.
-
Turbocharging small size engine toincrease engine output: An assessment ofturbocharger study fieldH M Herzwan, A Azri and M Rizalman
-
An experimental procedure to determineheat transfer properties of turbochargersJ R Serrano, P Olmeda, A Páez et al.
-
Recent citationsA Centrifugal Compressor PerformanceMap Empirical Prediction Method forAutomotive TurbochargersAntonios Fatsis et al
-
This content was downloaded from IP address 201.143.229.156 on 24/12/2021 at 18:44
Abstract. Single-zone modelling is used to assess different collections of impeller 1D loss
models. Three collections of loss models have been identified in literature, and the background
to each of these collections is discussed. Each collection is evaluated using three modern
automotive turbocharger style centrifugal compressors; comparisons of performance for each
of the collections are made. An empirical data set taken from standard hot gas stand tests for
each turbocharger is used as a baseline for comparison. Compressor range is predicted in this
study; impeller diffusion ratio is shown to be a useful method of predicting compressor surge
in 1D, and choke is predicted using basic compressible flow theory. The compressor designer
can use this as a guide to identify the most compatible collection of losses for turbocharger
compressor design applications. The analysis indicates the most appropriate collection for the
design of automotive turbocharger centrifugal compressors.
1. Introduction
Modern turbocharger requirements are no longer orientated around maximum power output from the
internal combustion (IC) engine. Designers are now focused on fuel efficiency and instant torque at
low engine speeds. With the quantum shift from high power IC engine designs to small gasoline
turbocharged engines, the design ethic is now completely different; map width is now the priority
instead of maximum pressure ratio (PR).
Early centrifugal compressor design was focused around design point performance. In the
automotive turbocharging application there is no single definitive operating condition, but instead
there is an operating envelope. In an urban application the vehicle drive cycle could be described as
inherently stop-start, in which case there is a need for high efficiency at low PR and low mass flow
rates. Also crucial is the need for very fast response (instant PR) which leads to instabilities toward the
surge side of the map. The compressor must also be able to deliver the maximum mass flow rate
necessary to meet the engine requirements.
The design, and therefore performance, of modern automotive turbocharger compressor stages is
very different to what one might refer to as classic industrial/process stages (with fixed operating
points). The result is that the existing 1D off-design performance prediction methods have difficulty
estimating state-of-the-art turbocharger compressor maps. Therefore, there is a need for further
improvement of the current 1D methods with new performance targets in place.
6th International Conference on Pumps and Fans with Compressors and Wind Turbines IOP PublishingIOP Conf. Series: Materials Science and Engineering 52 (2013) 042011 doi:10.1088/1757-899X/52/4/042011
Content from this work may be used under the terms of the Creative Commons Attribution 3.0 licence. Any further distributionof this work must maintain attribution to the author(s) and the title of the work, journal citation and DOI.
Published under licence by IOP Publishing Ltd 1
2. Compressors
Comparisons made in this section are relative to typical automotive turbocharger compressor stages
designed using the criterion described in the introduction; three centrifugal compressors are used and
will henceforth be referred to as C-1, C-2, and C-3.
The Galvas [1] study had its origins at NASA in 1974. Galvas notes that the compressor is ‘built by
a commercial engine manufacturer’, and gives an example of a turboshaft engine (it is reasonable to
surmise that it is an aircraft engine centrifugal compressor). The compressor has a relatively narrow
performance map with a peak efficiency of ~0.82 and peak PR of ~6.3. This suggests that unlike a
turbocharger compressor, it has been designed for a particular operating condition. Geometry
comparisons to small turbocharger compressors are presented in Table 1.
The Oh [2] study uses the three Eckardt impellers, and one referred to as the KIMM impeller. The
Eckardt compressors were designed and manufactured in the mid 1970’s. As Eckardt’s Impeller ‘A’ is
the backswept design, comparisons are made with this compressor in Table 1. Unfortunately the
application of the KIMM impeller is unknown; however the same comparisons are drawn in Table 1.
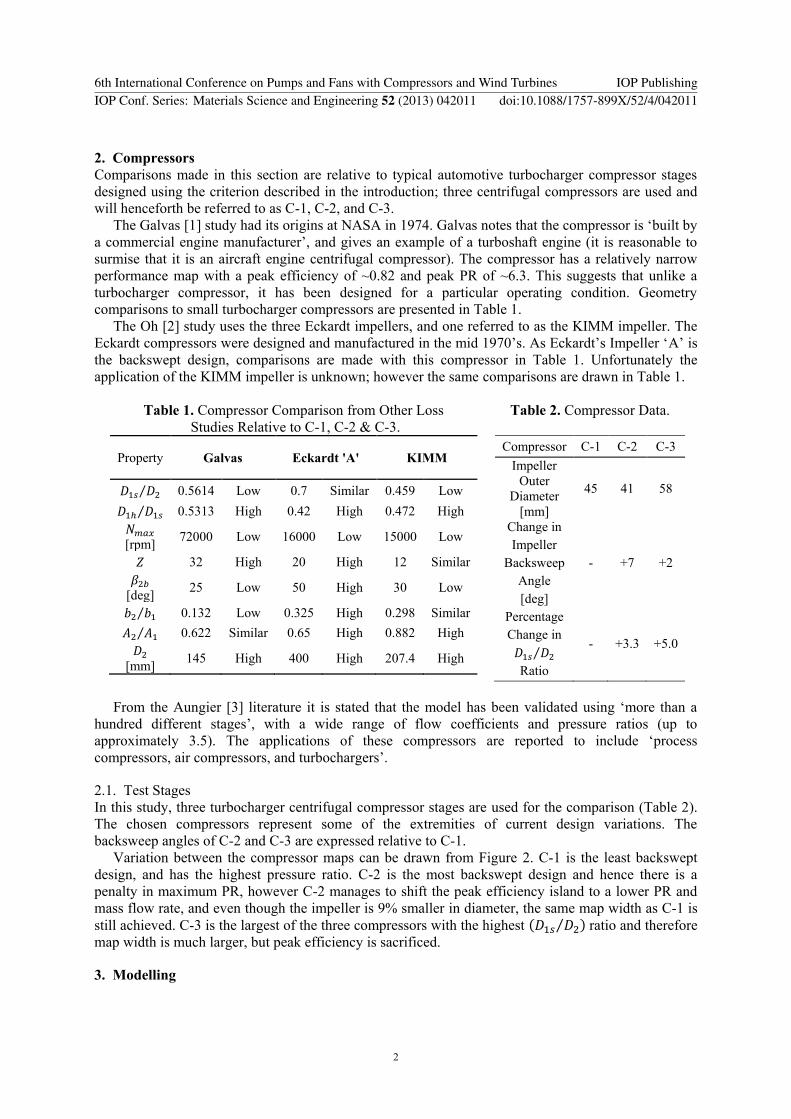
Table 1. Compressor Comparison from Other Loss
Studies Relative to C-1, C-2 & C-3.
Table 2. Compressor Data.
Property Galvas Eckardt 'A' KIMM
⁄ 0.5614 Low 0.7 Similar 0.459 Low
⁄ 0.5313 High 0.42 High 0.472 High
[rpm] 72000 Low 16000 Low 15000 Low
32 High 20 High 12 Similar
[deg] 25 Low 50 High 30 Low
⁄ 0.132 Low 0.325 High 0.298 Similar
⁄ 0.622 Similar 0.65 High 0.882 High
[mm]
145 High 400 High 207.4 High
Compressor C-1 C-2 C-3
Impeller
Outer
Diameter
[mm]
45 41 58
Change in
Impeller
Backsweep
Angle
[deg]
- +7 +2
Percentage
Change in
⁄
Ratio
- +3.3 +5.0
From the Aungier [3] literature it is stated that the model has been validated using ‘more than a
hundred different stages’, with a wide range of flow coefficients and pressure ratios (up to
approximately 3.5). The applications of these compressors are reported to include ‘process
compressors, air compressors, and turbochargers’.
2.1. Test Stages
In this study, three turbocharger centrifugal compressor stages are used for the comparison (Table 2).
The chosen compressors represent some of the extremities of current design variations. The
backsweep angles of C-2 and C-3 are expressed relative to C-1.
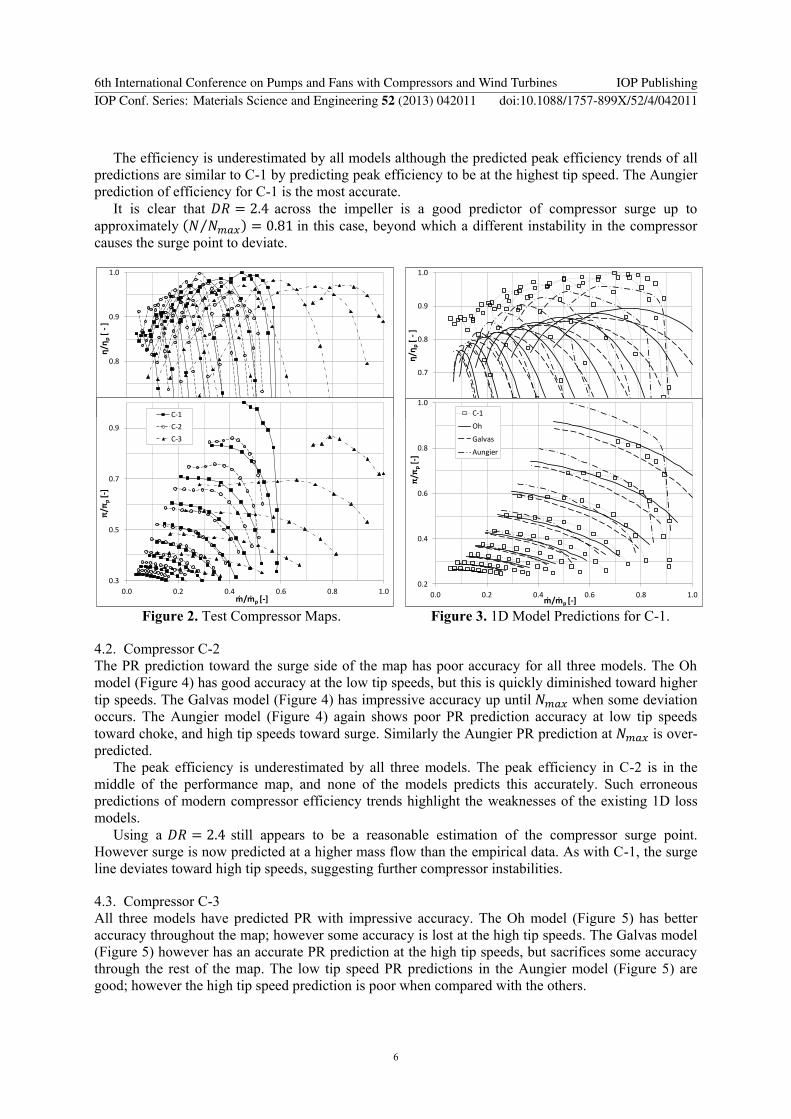
Variation between the compressor maps can be drawn from Figure 2. C-1 is the least backswept
design, and has the highest pressure ratio. C-2 is the most backswept design and hence there is a
penalty in maximum PR, however C-2 manages to shift the peak efficiency island to a lower PR and
mass flow rate, and even though the impeller is 9% smaller in diameter, the same map width as C-1 is
still achieved. C-3 is the largest of the three compressors with the highest ( ⁄ ) ratio and therefore
map width is much larger, but peak efficiency is sacrificed.
3. Modelling
6th International Conference on Pumps and Fans with Compressors and Wind Turbines IOP PublishingIOP Conf. Series: Materials Science and Engineering 52 (2013) 042011 doi:10.1088/1757-899X/52/4/042011
2
Off-design performance can be modelled using several different techniques. These range from the
different 1D modelling methods to 3D solving of the Navier-Stokes equations. Common 1D modelling
techniques are Zero-Zone (statistical, Casey and Robinson [4]), Single-Zone (mean-line), and Two-
Zone (Japikse [5]). 3D Computational Fluid Dynamics (CFD) techniques exist, most commonly
solving a simplified set of Navier-Stokes equations coupled with a proven turbulence model.
3.1. 1D Modelling
The purpose of this study is to provide the compressor designer with knowledge of the limitations
surrounding 1D Single-Zone modelling. Many authors/developers have amassed a collection of loss
models to suit particular applications, and typically this works quite well. Empirical data is required to
verify any model, and also to develop any improved empirical loss models.
3.1.1. Single-zone Modelling. The single-zone code used in this study is based upon fundamental fluid
flow equations [5]. Impeller overall dimensions are input; inlet and exit blade angles, blade thickness
(at the RMS diameter where relevant), and the number of main and splitter blades. This is
supplemented with basic vaneless diffuser and volute geometry. The meridional shape of the impeller
is developed using Bezier curves for the hub and shroud, and by inputting a blade sweep angle, the
impeller flow length along the mean-line is estimated. The streamwise starting position of the splitter
blades is also input, and is used to calculate an equivalent number of main blades using a method
adapted from Aungier [3] (Eqn. 1):
( ) ( )
where , and represents the leading edge of the main blades.
The impeller solver iterates impeller outlet total temperature until mass flow is conserved. The
vaneless diffuser is simulated using the Herbert [6] method, and the scroll volute is calculated using
the Weber and Koronowski [7] method.
Galvas and Oh both use the Wiesner [8] slip factor, while Aungier [3] uses his own modified
version of the Wiesner slip factor.
Gas properties and inlet flow conditions must be specified and the values used are typical ambient
conditions as shown in Table 3. Relevant gas properties are assumed to be constant at all stages in the
compressor and the inlet flow angle is always assumed to be axial.
Table 3. 1D Model Inlet Flow Conditions. Table 4. Impeller Loss Model Collections.
Flow Properties Unit
Inlet Total Temperature 300 K
Inlet Total Pressure 101325 Pa
Ratio of Specific Heats 1.395 -
Gas Constant 287 J/kgK
Inlet Flow Angle 0 deg
Viscosity Data
Reference Viscosity at 18.27 µPas
Reference Temperature 291.15 K
Sutherland's Constant 120 K
Loss Galvas Oh Aungier
External
Recirculation • • •
Disk Friction • • •
Leakage
• •
Internal
Incidence • • •
Skin Friction • • •
Blade Loading • • •
Clearance • • •
Exit Mixing
• •
Shock
•
Choking
•
Distortion
•
3.1.2. Impeller Loss Models. Three complete collections of loss models from three different authors
have been chosen (Table 4). Loss models are divided into two groups; internal and external. Internal
6th International Conference on Pumps and Fans with Compressors and Wind Turbines IOP PublishingIOP Conf. Series: Materials Science and Engineering 52 (2013) 042011 doi:10.1088/1757-899X/52/4/042011
3
losses are those which contribute to a reduction of the ideal total pressure rise predicted when using
the Euler work equation. External losses contribute to a rise in total temperature over and above the
ideal rise suggested by the Euler work equation but do not contribute to the desired outcome of
pressure rise.
Three individual loss model collections are used. The loss models contained in each of these are
detailed in Table 4. All of the losses noted here and used in the current Single-Zone model are taken
directly from the literature. Although all three loss collections may make estimations of the same
overall loss, they do not necessarily use the same correlation.
3.1.3. Compressor Surge. Oh [2] does not report on how surge and choke are predicted. Galvas [1]
suggests using the Lieblein diffusion factor as an impeller stall criterion, while Aungier [3] suggests
his own diffusion ratio based on the impeller relative throat velocity and exit relative velocity. Galvas
also provides an empirically derived relationship which defines compressor surge based on vaned
diffuser performance. However, the majority of automotive stages operate with vaneless diffusers,
meaning this correlation is not applicable in this study.
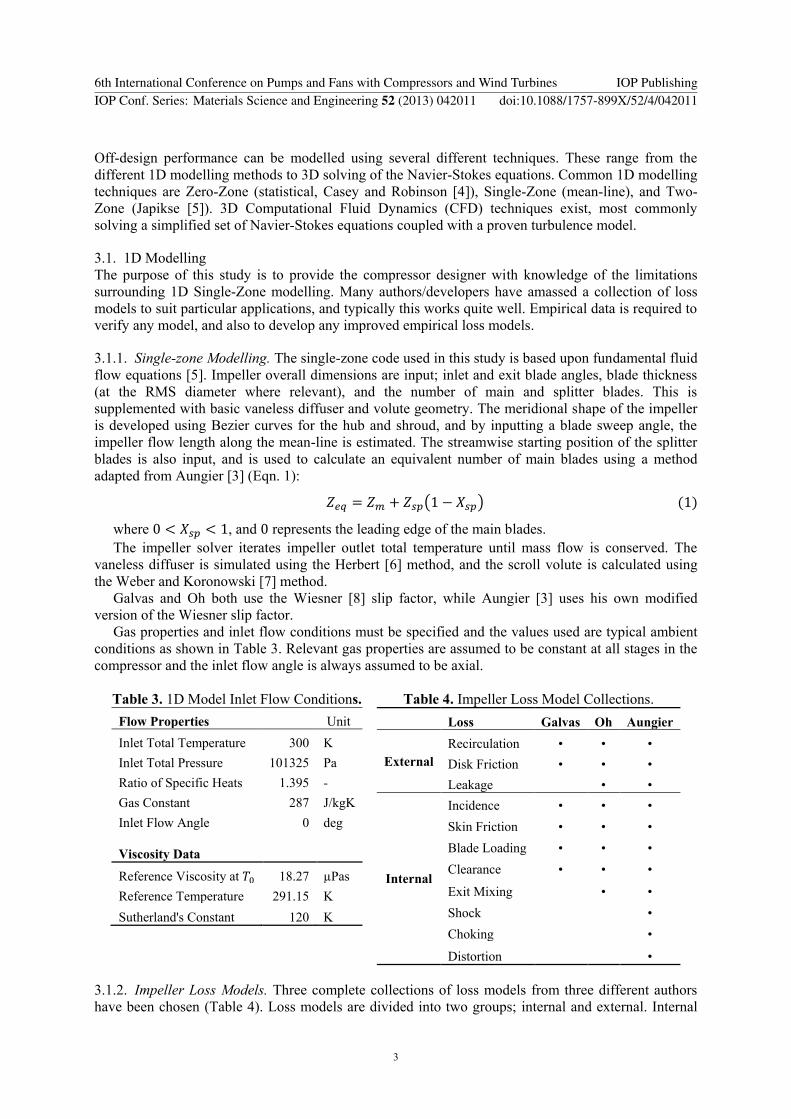
For the current work, compressor surge is assumed to be driven by the impeller diffusion ratio as
defined by Eqn. 2.
( )
Figure 1. Impeller DR at Surge for each Speedline for C-1.
In order to define a value for at which surge occurred, a single-passage CFD model was
produced to model C-1. A RANS simulation was carried out using ANSYS CFX and the SST
turbulence model provided with it. The model consisted of stationary inlet and vaneless diffuser
domains and a rotating domain for the impeller with frozen rotor interfaces between them. It contained
approximately 1.6e6 cells and had a y+ of less than 2 in the majority of the domains. Convergence was
defined as the RMS residuals falling below 1e-4; imbalances in mass, momentum and energy reducing
below 0.01%, and the efficiency fluctuating within ±0.05%. Surge was defined as the lowest mass
flow rate for a given rotational speed where the convergence criterion could no longer be met.
As seen in Figure 1, the impeller at which surge occurred remained relatively constant at
approximately 2.4 until higher tip speeds. At a transition region is seen, indicating that
another component other than the impeller is the limiting factor. At the two highest tip speeds the
limiting impeller . This can also be identified in Figure 2 since the surge flow rate for C-1 is
considerably higher at the higher tip speeds. For this study the impeller is assumed to be the only
component driving surge conditions and so a value of has been selected.
3.1.4. Compressor Choke. Galvas [1] suggests predicting choke using a correlation proposed by
Rodgers [9], in which the choking mass flow rate is a function of relative Mach number and blade
0.0
0.5
1.0
1.5
2.0
2.5
3.0
0.0 0.2 0.4 0.6 0.8 1.0 1.2
DR
[-]
Mu2 [-]
C-1
6th International Conference on Pumps and Fans with Compressors and Wind Turbines IOP PublishingIOP Conf. Series: Materials Science and Engineering 52 (2013) 042011 doi:10.1088/1757-899X/52/4/042011
4
angle at the inlet RMS diameter. Aungier [3] has a choking loss (Table 4) applied which inevitably
means that the efficiency will decrease rapidly, leading to numerical instability.
In this study, choke was predicted using a combination of two methods. At relatively low tip speeds
the compressor is never truly choked before a pressure ratio of unity is achieved, whereas at relatively
high tip speeds, the compressor is definitely choked as no further increase in mass can be passed. The
maximum passable mass flow rate appears to increase with tip speed; this is explained by Dixon [10].
Dixon’s method was used to calculate the theoretical area at which choking occurs (Eqn. 3). The
choked area was then compared to a throat area as estimated by Eqn. 4.
( ( )
( ))
( )
( )
where √
(
) ( ) ( )
If the calculated choking area is less than the throat area, the stage is assumed choked. Also if the
total-total isentropic efficiency drops below 0.4, the stage is assumed choked. Typically the efficiency
is used at low tip speeds, and the throat check is used at high tip speeds.
4. Data Comparison
Predicted maps are compared here with the corresponding hot gas stand test data which has been
corrected for the effect of heat transfer using the method of Casey and Fesich [11]. The correction
procedure of C-1, C-2, and C-3 is described by Harley et al. [12]. All test data has been provided by
IHI Charging Systems International; it has been collected in accordance with SAE J1826 [13] using a
standard 2-loop hot gas stand.
Comparisons with the efficiency can contain errors due to the inevitable heat transfer involved in
turbocharger gas stand data along with the assumptions of the heat transfer correction method used. It
is still reasonable to compare the efficiency trends, however the absolute error between the corrected
efficiency and the predicted efficiency should be treated with some care.
All data is non-dimensionalised using the maximum values ( ) found from the test data and
the corresponding predicted data. Each compressor is assessed in turn, and the different loss model
collections benchmarked against each other. It is important to note that flow range is being predicted
in this study, as described previously. For all predictions, a value of is used to predict the
surge point as described earlier. The presented is total-total across the stage, and the efficiency is
corrected isentropic total-total efficiency.
4.1. Compressor C-1
The PR predictions from the Oh and Galvas models are impressive for C-1 (Figure 3). As tip speed
increases, some accuracy is lost in the Aungier and Galvas (Figure 3) predictions, but the Oh method
predicts the PR very well at . The Aungier prediction for C-1 performs well in two regions, low
tip speeds toward surge, and higher tip speeds toward choke. Accuracy is lost toward the choked side
of the map at higher tip speeds in the Oh and Galvas models as there is no contraction of the throat
area simulated; thus the choked mass flow is overestimated. The Aungier model predicts the choking
flow rate at with good accuracy. The flattening of the PR characteristic curve toward surge is
not predicted by any of the models.
6th International Conference on Pumps and Fans with Compressors and Wind Turbines IOP PublishingIOP Conf. Series: Materials Science and Engineering 52 (2013) 042011 doi:10.1088/1757-899X/52/4/042011
5
The efficiency is underestimated by all models although the predicted peak efficiency trends of all
predictions are similar to C-1 by predicting peak efficiency to be at the highest tip speed. The Aungier
prediction of efficiency for C-1 is the most accurate.
It is clear that across the impeller is a good predictor of compressor surge up to
approximately ( ⁄ ) in this case, beyond which a different instability in the compressor
causes the surge point to deviate.
Figure 2. Test Compressor Maps. Figure 3. 1D Model Predictions for C-1.
4.2. Compressor C-2
The PR prediction toward the surge side of the map has poor accuracy for all three models. The Oh
model (Figure 4) has good accuracy at the low tip speeds, but this is quickly diminished toward higher
tip speeds. The Galvas model (Figure 4) has impressive accuracy up until when some deviation
occurs. The Aungier model (Figure 4) again shows poor PR prediction accuracy at low tip speeds
toward choke, and high tip speeds toward surge. Similarly the Aungier PR prediction at is over-
predicted.
The peak efficiency is underestimated by all three models. The peak efficiency in C-2 is in the
middle of the performance map, and none of the models predicts this accurately. Such erroneous
predictions of modern compressor efficiency trends highlight the weaknesses of the existing 1D loss
models.
Using a still appears to be a reasonable estimation of the compressor surge point.
However surge is now predicted at a higher mass flow than the empirical data. As with C-1, the surge
line deviates toward high tip speeds, suggesting further compressor instabilities.
4.3. Compressor C-3
All three models have predicted PR with impressive accuracy. The Oh model (Figure 5) has better
accuracy throughout the map; however some accuracy is lost at the high tip speeds. The Galvas model
(Figure 5) however has an accurate PR prediction at the high tip speeds, but sacrifices some accuracy
through the rest of the map. The low tip speed PR predictions in the Aungier model (Figure 5) are
good; however the high tip speed prediction is poor when compared with the others.
0.7
0.8
0.9
1.0
0.0 0.2 0.4 0.6 0.8 1.0
η/η
p[
-]
0.3
0.5
0.7
0.9
0.0 0.2 0.4 0.6 0.8 1.0
π/π
p[-
]
ṁ/ṁp [-]
C-1
C-2
C-3
0.6
0.7
0.8
0.9
1.0
0.0 0.2 0.4 0.6 0.8 1.0η
/ηp
[ -
]
0.2
0.4
0.6
0.8
1.0
0.0 0.2 0.4 0.6 0.8 1.0
π/π
p[-
]
ṁ/ṁp [-]
C-1
Oh
Galvas
Aungier
6th International Conference on Pumps and Fans with Compressors and Wind Turbines IOP PublishingIOP Conf. Series: Materials Science and Engineering 52 (2013) 042011 doi:10.1088/1757-899X/52/4/042011
6
The peak efficiency trend of C-3 resembles that of C-2 with a peak in the centre of the map. Again,
all three models under-predict the peak efficiency, and none of the models accurately predict the
location peak efficiency.
A does not suffice in this case; C-3 can handle more diffusion in the impeller as would
be expected by it having the highest ( ⁄ ) ratio. Compressor choking for C-3 is still overestimated
but potentially a more accurate prediction for both models than for C-1 & C-2. It appears from the test
data that C-3 could have passed more mass flow as neither the efficiency nor PR characteristic curves
drop off.
Figure 4. 1D Model Predictions for C-2. Figure 5. 1D Model Predictions for C-3.
5. Conclusions
Three different loss model collections have been used to simulate the performance maps of three
modern centrifugal compressors found in automotive turbochargers. The limitations of these loss
model collections have been displayed relative to modern turbocharger compressors. The Galvas
model performed best at high tip speeds for the compressors with a higher ( ⁄ ) ratio although the
Oh model performs best across the majority of the PR map for all three compressors. Trends in the
loss of accuracy were noted, specifically:
Flattening of the PR characteristic curve toward the surge margin;
Changing gradient of the surge line at relatively high tip speeds;
Peak efficiency in modern automotive compressors is in the center of the map.
The most robust loss model collection for use with centrifugal compressors typically found in
automotive turbocharger stages is the Galvas collection; it has the best performance prediction at high
tip speeds and has acceptable performance prediction across the remainder of the map, whereas the
loss in accuracy when using the Oh collection at high tip speeds is less acceptable. Furthermore the
Galvas collection uses the least number of loss models and hence equations, which also helps with the
robustness of performance prediction program.
The loss models evaluated do not fully represent a loss in total pressure as seen in the test stages
when the PR characteristic curve flattens toward surge. It could be suggested from this characteristic
that an internal loss is not being properly accounted for, particularly in the region where one expects to
find recirculation in the impeller passage.
0.6
0.7
0.8
0.9
1.0
0.0 0.2 0.4 0.6 0.8 1.0
η/η
p[
-]
0.2
0.4
0.6
0.8
1.0
0.0 0.2 0.4 0.6 0.8 1.0
π/π
p[-
]
ṁ/ṁp [-]
C-2
Oh
Galvas
Aungier
0.6
0.7
0.8
0.9
1.0
0 0.2 0.4 0.6 0.8 1
η/η
p[
-]
0.2
0.4
0.6
0.8
1.0
0.0 0.2 0.4 0.6 0.8 1.0
π/π
p[-
]
ṁ/ṁp [-]
C-3
Oh
Galvas
Aungier
6th International Conference on Pumps and Fans with Compressors and Wind Turbines IOP PublishingIOP Conf. Series: Materials Science and Engineering 52 (2013) 042011 doi:10.1088/1757-899X/52/4/042011
7
The impeller diffusion ratio is shown to represent a good prediction of compressor surge at low tip
speeds; however at higher tip speeds the surge point shifts to higher mass flow rates suggesting further
component instability within the compressor. The impeller diffusion ratio of 2.4 is shown to be a good
representation of compressor surge for stages C-1 and C-2, however C-3 can handle more diffusion
and therefore a higher limiting diffusion ratio would be required. As for variation of the diffusion ratio
from stage to stage, it appears to be related to the level of backsweep applied, and the ( ⁄ ) ratio.
Acknowledgements
The authors would like to thank IHI Charging Systems International for their technical support and
provision of the required compressor geometry and test data. Thanks are also given to ANSYS Inc for
the use of their software for numerical modelling in this research programme.
Nomenclature Acoustic Velocity (m/s)
Area (m2)
Diameter (m)
Diffusion Ratio (-)
Mass Flow Rate (kg/s)
Tip Mach Number (-),
√
Rotational Speed (rev/min)
Gas Constant (J/kgK)
Blade Thickness (m)
Temperature (K)
Blade Velocity (m/s)
Relative Velocity (m/s)
Meridional Position (-)
Number of Blades (-)
Flow/Blade Angle Relative to Meridional (deg)
Ratio of Specific Heats (-)
Total-Total Isentropic Efficiency (-)
Total-Total Pressure Ratio (-)
Density (kg/m3)
PR Pressure Ratio (-)
Abbreviations
IC Internal Combustion
Subscripts
0 Total Conditions
1 Impeller Inlet
Impeller Exit
Blade
Equivalent Number
Hub
Main Blades
Maximum
Peak
Shroud
Splitter Blades
Throat
Superscripts
* Choked Condition
References
[1] Galvas M R 1974 Fortran Program for Predicting Off-design Performance of Centrifugal
Compressors (Cleveland: NASA Lewis Research Center)
[2] Oh H W, Yoon E S and Chung M K 1997 Proceedings of the Institution of Mechanical
Engineers, Part A: Journal of Power and Energy 211(4) 331-8.
[3] Aungier R H 2000 Centrifugal Compressors: A Strategy for Aerodynamic Design and Analysis
(New York: ASME Press)
[4] Casey M V and Robinson C J 2011 A Method to Estimate the Performance of a Centrifugal
Compressor Stage Proceedings of ASME Turbo Expo 2011: Power for Land, Sea and Air,
(Vancouver, Canada, 6-10 June 2011)
[5] Japikse D 1988 Centrifugal compressor design and performance (Vermont: Concepts NREC)
[6] Herbert M V 1980 A Method of Performance Prediction for Centrifugal Compressors (London:
HMSO)
[7] Weber C R and Koronowski M E 1986 Meanline performance prediction of volutes in
centrifugal compressors ASME, International Gas Turbine Conference and Exhibit, 31st
(Duesseldorf, West Germany, June 8-12, 1986)
[8] Wiesner F J 1967 Journal of Engineering for Power 89 558
[9] Rodgers C 1964 Journal of Engineering for Power 86 161
[10] Dixon S L 1998 Fluid Mechanics and Thermodynamics of Turbomachinery (Oxford:
6th International Conference on Pumps and Fans with Compressors and Wind Turbines IOP PublishingIOP Conf. Series: Materials Science and Engineering 52 (2013) 042011 doi:10.1088/1757-899X/52/4/042011
8
Butterworth-Heinemann)
[11] Casey M V and Fesich T M 2010 Journal of engineering for gas turbines and power 132(7)
072302
[12] Harley P, Spence S, Filsinger D, Dietrich M. and Early J 2012 An Evaluation of 1D Design
Methods for the Off-Design Performance Prediction of Automotive Turbocharger
Compressors Proceedings of ASME Turbo Expo 2012: Power for Land, Sea and Air,
(Copenhagen, Denmark, 11-15 June 2012 )
[13] SAE 1995 Turbocharger Gas Stand Test Code (Pennsylvania, USA: Society of Automotive
Engineers)
6th International Conference on Pumps and Fans with Compressors and Wind Turbines IOP PublishingIOP Conf. Series: Materials Science and Engineering 52 (2013) 042011 doi:10.1088/1757-899X/52/4/042011