An evaluation of genotyping by sequencing (GBS)to map the Breviaristatum-e (ari-e) locus incultivated barleyHui Liu1,4†, Micha Bayer1†, Arnis Druka1, Joanne R Russell1, Christine A Hackett2, Jesse Poland3, Luke Ramsay1,Pete E Hedley1 and Robbie Waugh1,5*
Abstract: We explored the use of genotyping by sequencing (GBS) on a recombinant inbred line population (GPMx)derived from a cross between the two-rowed barley cultivar ‘Golden Promise’ (ari-e.GP/Vrs1) and the six-rowed cultivar‘Morex’ (Ari-e/vrs1) to map plant height. We identified three Quantitative Trait Loci (QTL), the first in a region encompassingthe spike architecture gene Vrs1 on chromosome 2H, the second in an uncharacterised centromeric region onchromosome 3H, and the third in a region of chromosome 5H coinciding with the previously described dwarfinggene Breviaristatum-e (Ari-e).
Background: Barley cultivars in North-western Europe largely contain either of two dwarfing genes; Denso onchromosome 3H, a presumed ortholog of the rice green revolution gene OsSd1, or Breviaristatum-e (ari-e) onchromosome 5H. A recessive mutant allele of the latter gene, ari-e.GP, was introduced into cultivation via the cv.‘Golden Promise’ that was a favourite of the Scottish malt whisky industry for many years and is still used inagriculture today.
Results: Using GBS mapping data and phenotypic measurements we show that ari-e.GP maps to a small geneticinterval on chromosome 5H and that alternative alleles at a region encompassing Vrs1 on 2H along with a regionon chromosome 3H also influence plant height. The location of Ari-e is supported by analysis of near-isogenic linescontaining different ari-e alleles. We explored use of the GBS to populate the region with sequence contigs fromthe recently released physically and genetically integrated barley genome sequence assembly as a step towardsAri-e gene identification.
Conclusions: GBS was an effective and relatively low-cost approach to rapidly construct a genetic map of theGPMx population that was suitable for genetic analysis of row type and height traits, allowing us to preciselyposition ari-e.GP on chromosome 5H. Mapping resolution was lower than we anticipated. We found the GBS datamore complex to analyse than other data types but it did directly provide linked SNP markers for subsequenthigher resolution genetic analysis.
Keywords: Barley, Dwarfing gene, Genotyping by sequencing, Physical map
* Correspondence: [email protected]†Equal contributors1Cell and Molecular Sciences, The James Hutton Institute, Invergowrie,Dundee, Scotland DD2 5DA, UK5Division of Plant Sciences, James Hutton Institute, Invergowrie, TheUniversity of Dundee. College of Life Sciences, Dundee, Scotland DD2 5DA,UKFull list of author information is available at the end of the article
BackgroundBarley (Hordeum vulgare L.) is a diploid (2n = 14) eco-nomically important cereal crop and genetic model forsmall grain temperate cereals. Golden Promise (GP) is atwo-rowed UK spring barley cultivar, and is currentlythe most responsive genotype for barley genetic trans-formation. Also, because of its unique properties, themalt extracted from GP is used to distil a number of sig-nature Single Malt Scotch whiskies such as Macallanand Glengoyne. It is a primary induced gamma-ray mu-tant derivative of the barley cultivar Maythorpe, and isknown to contain a mutation in Breviaristatum-e (Ari-e).This mutation in Ari-e in GP (ari-e.GP, also referredto in the literature as GP erectoides) causes a semi-dwarfing phenotype that has been used widely in barleycultivar development (especially in Scotland) to shortenstraw length and reduce the severity of lodging. GP isalso susceptible to several fungal pathogens, has shortawns (as well as being dwarf), reduced internode lengthand shows a measure of tolerance to salt [1]. Genetic ana-lysis has previously located ari-e.GP to barley chromo-some 5H as a quantitative trait locus (QTL) influencingplant height, and physiological studies have confirmed itsrelative insensitivity to the addition of exogenous gibberel-lic acid (GA3) [2]. The Ari-e gene has not yet been clonedalthough it was recently mapped as a height QTL usingthe tools of contemporary biometrical genetics in a com-plex three-way cross [3].Over the past two decades, many molecular tools have
been developed in barley to enable genetic research[4-9]. The primary focus has been the construction ofmolecular marker-based genetic linkage maps that canbe leveraged for mapping genes of interest and subse-quent marker assisted selection in breeding programs.These have been applied to discover, dissect and ma-nipulate genes determining a range of simple and com-plex traits. Because of their value, accompanied by theirincreasing use in genetics and breeding, there has been acontinual drive to both reduce marker costs and to avoidascertainment issues [10] while at the same time enhan-cing flexibility and marker throughput per assay. It istherefore appropriate that new developments in markertechnology are both explored and thoroughly evaluatedagainst the current state of the art. Now that next gener-ation sequencing (NGS) technology has been shown tobe capable of discovering and genotyping thousands ofmarkers across almost any genome of interest at lowcost and in a single step, a current debate is whethersequence-based genotyping methods are ready to replacemany of the established and widely used tools such ashighly-multiplex Single Nucleotide Polymorphism (SNP)platforms [9].Available sequence-based genotyping methods generally
rely upon the use of restriction enzymes to produce a
reduced representation of the non-repetitive (low copy)regions of the genome. Restriction site-associated genomicDNA (RAD) typing is such an approach and has beenused in several species for the construction of linkagemaps and application in QTL analyses [11]. In barley,a RAD linkage map was recently produced in a doublehaploid population and used for QTL analysis [12].Elshire and colleagues [13] subsequently described asimilar but more straightforward method of genotypingby sequencing (GBS) which works effectively in 96-well(or higher) plate assays. GBS was originally developedfor high-resolution association studies in maize [14]and, like RAD, has been extended to a range of specieswith complex genomes. A two-enzyme GBS protocolhas now been developed that produces a uniform libraryfor sequencing and has been applied to both wheat andbarley [15]. This GBS approach has been shown to besuited to genetic analysis of rapeseed, lupin, lettuce,switchgrass, soybean, and maize [16-20].In this report, our biological objective was to identify
at high resolution the genetic location of the ari-e.GPsemi-dwarfing gene of cultivated barley. However, as asequence assembly of the barley genome has just beenpublished [21,22], we also wanted to use a sequence-basedgenetic marker methodology that would in principle allowus to link directly to the genome sequence assemblies andphysical map, ultimately as a shortcut to facilitate theidentification of the Ari-e gene. We therefore chose toexplore use of the two-enzyme based GBS method, usingdigestion of genomic DNA with a six-base methylationsensitive ‘rare-cutter’ and a four-base ‘common cutter’enzyme. We combined this with the Illumina NGS plat-form and developed a downstream informatics pipeline todiscover co-dominant (SNPs) in an F11 single-seed descentmapping population from a Golden Promise (GP) byMorex (Mx) cross. In contrast to GP, Mx is a tall springsix-rowed North American barley variety with desirablemalting and brewing characteristics. Most importantly,Mx is the reference cultivar used in the barley genomesequencing efforts. Our genetic analysis using GBS datafrom the recombinant inbred (RIL) population confirmedthe location of ari-e.GP on barley chromosome 5H. In theprocess we discovered 1,949 high-confidence SNPs thatwe could associate with contigs in the NGS sequence as-semblies and physical map.
Results and discussionGolden Promise by Morex population (GPMx) andvariation in plant heightA recombinant inbred line (RIL) population of 160 F11single-seed descent lines from a GP by Mx cross was de-veloped over seven years, from 2003–2012, at the JamesHutton Institute. The 136 F11 RILs used in this studycomprised 56 two-rowed and 80 six-rowed accessions.
Liu et al. BMC Genomics 2014, 15:104 Page 2 of 11http://www.biomedcentral.com/1471-2164/15/104
The population segregates quantitatively for height asshown in Figure 1 varying between different RILs from60 to 130 cm. Asymmetric transgressive segregation ofplant height across the GPMx population can be ob-served – there were around 40 lines taller than Morex,but only about 10 shorter than Golden Promise. ThePearson correlation between the heights in the two yearswas 0.887. Two lines showed a marked difference inheight between the two years.
Generation of PstI reference sequences from barleygenome assembliesTo facilitate genetic analysis by GBS we first extracted aset of 64 bp reference sequences flanking all predictedPstI restriction sites from barley genome assemblies ofthe cultivars Morex (genome coverage: (53X) [22]), Bow-man (26X) and Barke (20X) using the ‘restrict’ programfrom the EMBOSS suite of tools (see Methods). For culti-var Morex, 343,854 restriction sites were identified, yield-ing a total of 633,331 GBS reference sequences present on251,433 unique Morex genome assembly contigs. Of allthe identified sites, 54,377 flanking sequences had to beexcluded because the restriction site was too close to thestart or end of an assembled genomic contig and thereforeextraction of the full 64 bp sequence was impossible. Ex-traction of additional sequences unique to the genome as-semblies of cultivars Bowman and Barke yielded a further71,519 and 97,764 sequences, respectively. After removalof chloroplast (cp) sequences a total of 802,046 referencesequences remained that were subsequently used for readmapping. More than half (54%) of the 64 bp referencesequences stemmed from Morex contigs that contain
regions of homology to full length cDNAs or expressedgenes, previously mapped genetic markers (cM) or se-quences that have chromosome arm assignments based onsurvey sequencing of flow sorted chromosome arms [23].
GBS reads of GPMxWe generated three 48-plex GPMx GBS libraries(GPMx_1-3) representing all 136 progenies and theparents, which were repeatedly represented in each li-brary for QC purposes. We used PstI combined withMseI to digest genomic DNA, with the PstI overhangsequence located in the barcode adapter adjacent tothe barcode sequence, and the MseI overhang sequencelocated in common Y-adapter [15] (barcode sequencesin Additional file 1: Table S1). Single-end sequencing start-ing from the barcoded adapter was performed using Illu-mina chemistry. Pilot sequencing the GPMx_1 library onan Illumina GAII platform generated more than 61 millionsingle-end reads of 72 bp in length. Of these, over 58 Mreads were categorised as having a correct barcode andPstI overhang sequence (from here we call this proportionof the sequences ‘categorised reads’). Further sequencingof all three GPMx population libraries, each on one lane ofan Illumina HiSeq2000, generated a total of 622 M readsof 100 bp and more than 482 M remaining as categorisedreads (see criteria below). The average number of cate-gorised reads obtained per lane was 28.5 M on the Illu-mina GA II and 160 M on the Illumina HiSeq2000. Byapplying various filtering criteria (i.e. presence of accuratebarcode and complete PstI overhang sequence, and no un-determined nucleotides (Ns) in the reads), the percentagesof categorised reads were 93.4% (Illumina GA II) and
1301201101009080706050
140
130
120
110
100
90
80
70
60
50
2-row6-row
plant height2010 (cm)
plan
t hei
ght
200
9 (c
m)
MorexGolden Promise
GoldenPromise
Morex
Figure 1 Scatterplot of plant height measurements of individual GPMx lines collected from the plants grown in polytunnel (in 2009,Y-axis) and in the field (in 2010, X-axis). Two-rowed lines are shown in blue and six-rowed in red.
Liu et al. BMC Genomics 2014, 15:104 Page 3 of 11http://www.biomedcentral.com/1471-2164/15/104
77.5% (Illumina Hiseq2000). After deconvolution the dis-tribution of the number of reads per sample ranged from520,427 to 6,554,933 (Additional file 2: Table S2). The readdistribution was relatively even across the population,with only 3 of the 138 lines having less than a millionreads. For the parents, we obtained 8.2 M reads fromGolden Promise and 11.5 M from Morex, due to repeatsequencing. All sequence reads generated from GPMxwere submitted to the Sequence Read Archive sectionof the European Nucleotide Archive (ENA) (submission:ERP002594 Genotyping by sequencing of a barley map-ping population).
Co-dominant markers from the GPMx population datasetsIn total, 461 M categorized reads from the GPMx map-ping population were mapped to the 64 bp reference se-quences using the Bowtie mapping tool [24]. In order toreduce the number of false positive SNPs during down-stream analysis, only a single mismatch per read wasallowed, and only uniquely mapped reads were included,leaving 46% of 461 M reads mapped to the reference.These categorized reads were then evaluated for singlebase-pair differences across the population. We removedall dominant markers from the dataset because of ourinability to distinguish null alleles from missing data.Using these highly conservative criteria, we identified aninitial set of 1,949 co-dominant SNPs with robust allelecalls across the population.
Linkage mapping of GPMx populationThe 1,949 codominant SNPs were analysed using Join-Map. They were first checked for identical pairs basedon segregation data across the population and on thisbasis 267 were excluded, always dropping the SNPmarker with the lower quality score in each identicalpair. A further 291 SNPs were excluded as they hadmore than 20% missing values. The remaining 1,391high confidence SNPs were clustered into seven linkagegroups with the number of markers per group rangingfrom 109 to 270, with nine remaining isolated at a LODof six. These linkage groups were ordered using Join-Map’s maximum likelihood mapping algorithm. SNPswith a poor fit to the neighbouring SNPs were excludedand the linkage analysis was rerun leaving a total of1,332 unique high quality SNPs incorporated into themap. The numbers of co-dominant GBS SNPs are pre-sented in Table 1.
Location of SIX ROWED SPIKE 1A major developmental gene, SIX ROWED SPIKE 1(VRS1), segregates in the GPMx population. The VRS1gene has previously been identified [25] and pro-foundly affects barley spike morphology, but its effecton other plant traits such as height in GPMx is notknown. Barley plants carrying a recessive vrs1 allele (e.g.vrs1.a Morex) develop spikes containing six rows of grainin contrast to the ancestral wild type spike whichdevelops only two rows (e.g. Vrs1.b Golden Promise).Alternative alleles at VRS1 also influence the number oftillers that develop on a plant and could, as suggestedpreviously, affect plant height, and this would influenceour subsequent analysis of ari-e.GP. The most signifi-cant associations between row type and SNPs were withMR_2568613P909R13 and MR_57812P2860R48. Bothmapped to 80.5 cM on chromosome 2H (Figure 2A). All80 six-rowed lines had the same genotype as Morex,while the 56 two-rowed lines had the same genotypeas Golden Promise (i.e. there were no recombinants be-tween these markers and VRS1).
A major plant height QTL overlaps with theBreviaristatum-e (Ari-e) locusWe mapped plant height as a quantitative trait for eachyear separately using the GPMx GBS linkage map. A per-mutation test with 1,000 permutations had a 95th percent-ile of 3.0 for each year’s height data, and this was used as agenome-wide LOD threshold. This resulted in the identifi-cation of three significant plant height QTLs on chromo-somes 2H, 3H and 5H (Figure 2). The major plant heightQTL was located on chromosome 5H (Figure 2C). Foreach year’s height data, the SNP most closely associatedwith height was MR_47526P1793R57 at 29.7 cM onchromosome 5H. This SNP explained 55.2% of the vari-ance in height in 2009, with the ‘bb’ genotype having amean height 27.5 (SE 2.1) cm higher than the ‘aa’ geno-type, and 61.6% of the variance in height in 2010, withthe ‘bb’ genotype having a mean height 24.8 (SE 1.7) cmhigher than the ‘aa’ genotype.Previously, it was shown that Golden Promise carries a
mutation in the dwarfing gene known as Breviaristra-tum-e (Ari-e) [26]. The position of the gene has beenroughly estimated as about 30 cM from the SHORTRACHILLA HAIR (srh) locus [27]. Two induced mutantalleles of Ari-e (ari-e.GP (Golden Promise) and ari-e.1(cv. ‘Bonus’)), were introgressed as BC6F3 lines into the
Figure 2 QTL LOD profiles of plant height and the position of VRS1, determined using 138 GPMx RILs. Only chromosomes withsignificant QTLs are shown: 2H on panel A, 3H on panel B and 5H on panel C. Vertical lines below the graphs show markers on the GBS map.Marker names and GBS map positions surrounding relevant loci are also shown. Co-segregating markers are outlined. The 2009 data are shown inred and 2010 data are in blue. The horizontal dotted line shows the significance threshold. Boxes show the one-LOD support intervals, and whiskersshow the two-LOD intervals.
Liu et al. BMC Genomics 2014, 15:104 Page 5 of 11http://www.biomedcentral.com/1471-2164/15/104
background of cv. ‘Bowman’ resulting in lines BW042 andBW043 [28]. Cross-referencing the SNP markers thatdefine the introgressed region in BW043 (ari-e.GP),which has a genetically well-defined introgression, withthe barley genome sequence assembly [22] supports ari-e.GP as the gene underlying the plant height QTL identifiedusing the GPMx population. This also supports the earlyobservation of Ari-e being linked to srh [27], as BW873, anearly isogenic line of cv. Bowman carrying srh, containsan introgressed segment located 10–30 cM distal to theGPMx height QTL [28].Restricted multiple QTL mapping (rMQM) detected two
further QTLs for height, the most significant markers beingMR_1631678P782F7 at 51.6 cM on chromosome 3H (forboth years) (Figure 2B) and a region near VRS1 (80.5 cM)on 2H (Figure 2A). For the latter, in 2009 the most signifi-cant marker was MR_1435185P85F60 at 82.0 cM while in2010 the most significant marker was MR_48841P1435F22at 83.2 cM. Regression analysis (in Genstat) was usedto model the joint effects of these three locations onheight. There were no significant interactions amongthe three QTLs, and so an additive regression on SNPMR_47526P1793R57 from 5H, SNP MR_1631678P782F7 from 3H and Vrs1/vrs1 on 2H (for consistencyacross years) was used. In 2009, these three locationsjointly explained 76.6% of the variance in height. ForMR_1631678P782F7 on 3H, the ‘bb’ Morex allele has amean height 9.7 (se 1.7) cm higher than the ‘aa’ GP allele,and the vrs1 types (six-row) on 2H had a mean height10.1 (se 1.7) cm lower than the Vrs1 (two-row) types. In2010, these three locations jointly explained 77.5% of thevariance in height. For MR_1631678P782F7 (3H), the ‘bb’allele has a mean height 8.9 (se 1.4) cm higher than the‘aa’ allele and the vrs1 types (six-row) (2H) have a meanheight 6.8 (se 1.4) cm lower than the Vrs1 (two-row) types.The effect of excluding the two lines with discrepantheights in the two years was investigated, but the QTL lo-cations were unchanged and the differences in the param-eter estimates were negligible.
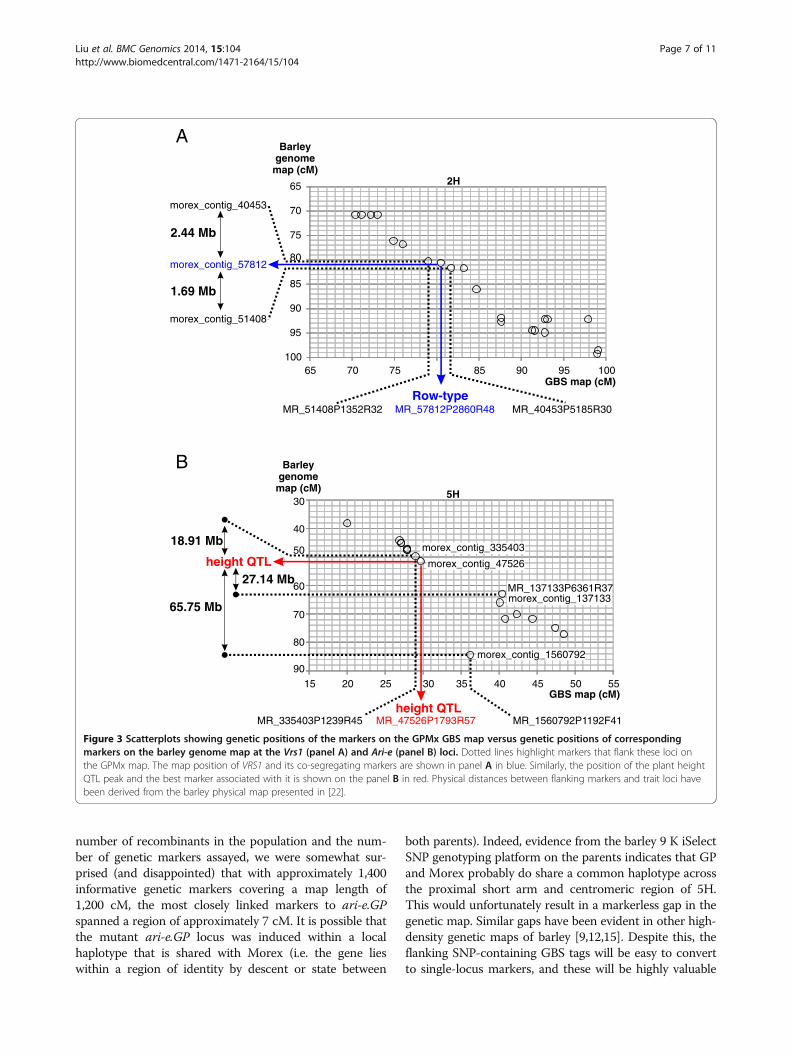
What is the resolution of the GPMx GBS map at Ari-e.GP?To explore the potential of using GBS and the GPMxRIL population as a platform for gene identification, weused the barley genome assembly to determine the genecontent surrounding Vrs1, Ari-e and the flanking GBSmarkers. As the Vrs1 gene is known [25] we investigatedthe interval containing the two GBS markers that co-segregated with Vrs1 and that fell between markers,MR_51408P1352R32 and MR_40453P5185R30. These de-fined a 1.5 cM interval on the GPMx GBS map. Currentinformation [21,22] indicates this interval corresponds to4.13 Mb on the barley physical map (Figure 3A). It con-tains an estimated 52 genes, resulting in a gene density es-timate of 12.6 genes/Mb and defining this locus as gene
rich (the genome-wide average gene density in barley is 5genes/Mb).Unlike VRS1, the identity of Ari-e is not known. The
QTL peak for plant height in GPMx (i.e. the ari-e.GPlocus) is associated with GBS marker MR_47526P1793R57 which is flanked by MR_335403P1239R45 andMR_1560792P1192F41. These three markers define a7.2 cM interval on the GPMx GBS map. However onthe barley physical map marker MR_137133P6361R37(morex_contig_137133) appears to be positioned errone-ously (Figure 3B) making it difficult to estimate the sizeof the relevant interval (Figure 3B). Replacing MR_137133P6361R37 with a distal marker, MR_137133P6361R37, the interval defined is 46 Mb and contains an esti-mated 397 genes. We then investigated a more recentordering of sequence contigs on the barley genome pro-vided by the POPSEQ methodology [29]. There, thesame region corresponds to a 3.3 cM genetic interval inthe Barke × Morex population and a 2.1 cM interval inthe Oregon Wolfe populations respectively. This regioncontains over 7,000 anchored sequence contigs spanninga total sequence length of approximately 10 Mb [29]. Asthe contig sequences represent only a small portion ofthe physical sequence, Ari-e appears to be located ina relatively low recombining region. Despite residualrecombination within this genetic interval, the lackof detected polymorphism suggests that the originalparental haplotypes may be similar in this region andincreased resolution will likely need to be sought indifferent populations.
ConclusionsWe have shown that GBS is an effective approach forthe generation of marker-dense genetic maps in cultivatedbarley. The short sequence tags enabled us to directlyanchor the regions containing both VRS1 and ari-e.GP tothe recently released integrated genetic and physical se-quence assembly of the barley genome and to crudely de-fine the physical size of the two genetic intervals that weinvestigated. Our hope was that the flanking markerswould ultimately assist us in identifying ari-e.GP. Giventhe resolution we obtained around ari-e.GP this seems un-likely. Our data also indicate that a region encompassingthe major morphological gene VRS1, which determinesrow-type and number of tillers in barley on 2H and an un-known locus on 3H, also affect plant height in the GPMxpopulation.An important practical outcome of this work for us was
that we found the GBS data more challenging to handleand subsequently to analyse than the current multiplexSNP assay technology we routinely run in the lab [9]. In-deed, this may discourage some groups from adopting theGBS approach. Nevertheless, as the principal determinantof resolution in genetic studies is a combination of the
Liu et al. BMC Genomics 2014, 15:104 Page 6 of 11http://www.biomedcentral.com/1471-2164/15/104
number of recombinants in the population and the num-ber of genetic markers assayed, we were somewhat sur-prised (and disappointed) that with approximately 1,400informative genetic markers covering a map length of1,200 cM, the most closely linked markers to ari-e.GPspanned a region of approximately 7 cM. It is possible thatthe mutant ari-e.GP locus was induced within a localhaplotype that is shared with Morex (i.e. the gene lieswithin a region of identity by descent or state between
both parents). Indeed, evidence from the barley 9 K iSelectSNP genotyping platform on the parents indicates that GPand Morex probably do share a common haplotype acrossthe proximal short arm and centromeric region of 5H.This would unfortunately result in a markerless gap in thegenetic map. Similar gaps have been evident in other high-density genetic maps of barley [9,12,15]. Despite this, theflanking SNP-containing GBS tags will be easy to convertto single-locus markers, and these will be highly valuable
Figure 3 Scatterplots showing genetic positions of the markers on the GPMx GBS map versus genetic positions of correspondingmarkers on the barley genome map at the Vrs1 (panel A) and Ari-e (panel B) loci. Dotted lines highlight markers that flank these loci onthe GPMx map. The map position of VRS1 and its co-segregating markers are shown in panel A in blue. Similarly, the position of the plant heightQTL peak and the best marker associated with it is shown on the panel B in red. Physical distances between flanking markers and trait loci havebeen derived from the barley physical map presented in [22].
Liu et al. BMC Genomics 2014, 15:104 Page 7 of 11http://www.biomedcentral.com/1471-2164/15/104
for identifying additional recombinants around ari-e.GPand, if pursued further using a map based approach, ul-timately the identification of the gene.
MethodsPlant material and DNA samplesThe GPMx population was developed from a cross be-tween a two-rowed barley (Golden Promise, ari-e.GP/Vrs1) and six-rowed barley (Morex, Ari-e/vrs1) at theJames Hutton Institute (JHI). DNAs were extractedfrom one week old seedling tissue using the DNeasyPlant Mini kit (Qiagen). Three 48-plex GBS librarieswere constructed from a set of 138 progenies from theF11 single-seed descent generation, along with repli-cated samples of each parent, respectively.
Plant growth and phenotypingTen seeds harvested from a single F9 generation plant ofthe GPMx RIL population were planted in soil in a poly-tunnel in spring 2009. Planting was randomized andplants grown using automatic watering. Plant heightmeasurements were performed on mature plants priorto harvest. Plant height for each line was determined byselecting the 3–5 longest tillers and measuring the dis-tance from the ground to the top spikelets (excludingawns). Bulked seeds harvested from 3–5 plants of eachline of the F10 generation of the GPMx RIL populationwere planted in the field in spring 2010. Before planting,TGW (Thousand Grain Weight) of each sample was de-termined and used to calculate the weight of the seedsto be planted in 1x 2.5 m plots (so that each plot hasabout the same number of seeds). In total, 17 randomlyselected lines and parents were planted as randomizedreplicates (2-3X). Plant height measurements were per-formed 3–4 weeks after anthesis following the sameprocedure as above. Lodged plants were lifted beforemeasuring their height.
Constructing GBS librariesGBS libraries were constructed in a similar manner toPoland et al. [15]. Briefly:A set of 48 barcoded adapters (Additional file 1:
Table S1) were generated from complementary oligo-nucleotides (Sigma) with a PstI overhang sequence andunique barcodes of length 4 nt to 8 nt. In addition, acommon Y-adapter was generated corresponding tothe 5’ TA overhang generated by MseI. Top and bot-tom strand complementary oligonucleotides for eachadapter (50 μM) were annealed using the followingprogram: 95°C for 2 min, decrease to 25°C by 0.1°C/s,hold at 25°C for 30 min. Annealed adapters were di-luted 1:10 and their concentration measured usingPicoGreen. Barcoded adapters were normalised to2 ng/μl and the common Y-adapter to 40 ng/μl.
DNAs were digested in 30 μl reactions containing200 ng of genomic DNA, 1 × NEB buffer 4, 8 u PstI-HF,8 u MseI, incubated at 37°C for 3 h, then 80°C for20 min to inactivate the enzymes. For ligation, 4 ngannealed barcoded adapter and 200 ng annealed com-mon Y-adapter were added along with 1 × T4 DNA lig-ase buffer and 200 u T4 ligase in a total volume of 50 μl.All 48 ligation reactions were incubated at 22°C for 2 h,then 65°C for 20 min.An aliquot (5 μl) was removed from each ligation reac-
tion, pooled, purified using QIAquick PCR PurificationKit (Qiagen) and eluted in 30 μl of dH2O. PCR amplifica-tion was conducted in 50 μl reactions containing 4 μl ofpooled and purified library DNA, 1 × high fidelity Phusionpolymerase buffer, 0.2 μM dNTP, 0.2 μM primer 1 (com-plementary to barcode adapter), 0.2 μM primer 2 (comple-mentary to common Y-adapter), 1 u Phusion polymeraseTaq. PCR was conducted as follows: 98°C for 30 s forone cycle; 20 cycles of 98°C for 10 s, 65°C for 20 s, 68°Cfor 20 s; one cycle of 75°C for 5 min, cool to 4°C. ThePCR enriched library was gel-purified, selecting the200–500 bp size fraction, using the MinElute Gel Ex-traction Kit (Qiagen), eluted in 12 μl dH2O, and qualityand quantity of the library measured using a Nanodropand Agilent Bioanalyzer.
Sequencing and processing raw GBS dataSingle-end sequencing from the PstI sites was carried outusing Illumina GA II and/or HiSeq2000 sequencer: of thethree GBS libraries (GPMx_1, GpMx_2 & GPMx_3), ini-tially GPMx_1 was sequenced on two lanes of IlluminaGAII and subsequently all three GBS libraries were se-quenced on one lane each of Illumina HiSeq2000. All GBSsequences were submitted to Sequence Read Archive sec-tion of the European Nucleotide Archive (ENA) (submis-sion: ERP002594 Genotyping by sequencing of a barleymapping population).
Generation of reference sequencesReference sequences for the mapping of GBS tags weregenerated from existing genomic assemblies of the bar-ley cultivars Morex, Bowman and Barke based on Illu-mina whole genome shotgun sequencing. As a first stepin the workflow (see Additional file 3: Figure S1 for adiagram of the full workflow), the EMBOSS programrestrict (http://emboss.sourceforge.net/) was used to dis-cover PstI restriction sites in the assemblies. Customwritten Java code was then used to extract from theMorex genomic assembly two separate flanking 64 bpsequences extending the restriction site in forward andin reverse direction. This process was repeated for theother two cultivar assemblies and the extracted 64 bp se-quences were then compared with the sequences gener-ated from cultivar Morex assembly using the standalone
Liu et al. BMC Genomics 2014, 15:104 Page 8 of 11http://www.biomedcentral.com/1471-2164/15/104
BLASTN program [30] from NCBI (version 2.2.26+). Asingle hit was obtained per query, and from this we ex-tracted those hits with alignments along the full lengthof the query sequence, an identity value of less than100%, and a mismatch number of at least 2. These hitswere added to the full set of Morex flanking sequences,thereby providing a global set of reference sequencesfrom the three barley genome assemblies. To furtherrefine the reference sequences, we screened them forchloroplast DNA, which can be a common feature in wholegenome shotgun sequencing. This was done by BLASTN,with the combined set of sequences as query against the fullbarley chloroplast genome sequence (http://www.ncbi.nlm.nih.gov/nuccore/118430366?report=fasta). Hits were fil-tered to require sequence identity > = 90%, and an align-ment length > = 64. We detected 568 chloroplast DNAsequences that were subsequently removed from thereference set.
Read mappingPrior to mapping, the raw Illumina reads were assignedto their respective samples (‘deconvoluted’) based on thesample-specific barcodes included in the sequence. Bar-code lengths varied between 4 and 8 bases therefore cus-tom written Java code was used for deconvolution, andthis also removed the barcodes after assigning the readto a sample, which is a requirement for the successfulmapping of the read to a reference sequence. Reads thatstarted with the PstI overhang sequence (TGCAG) afterbarcode removal were accepted, quality trimmed to re-move bases of quality Phred < 20 from the 3’-end (distalto the PstI site), and then shortened from the 3’-end to astandard length of 64 bases. Reads that were shorterthan this after quality trimming were discarded.Reads were then mapped to the 64 bp reference se-
quences using the Bowtie mapping tool (version 0.12.7,[24]). To avoid cross-mapping of reads between similarsequences, the “ –best –strata” switch was used, whichensures that multi-mapped reads are only mapped tothe location with the fewest mismatches. In order toreduce the number of false positive SNPs during down-stream analysis, only a single mismatch per read wasallowed (“-v 1”), and only uniquely mapped reads wereretained (“-m 1”).
SNP discovery and genotype callingWe used the FreeBayes software [31] to discover singlenucleotide polymorphisms (SNPs), as well as customJava code for converting the resulting VCF file into ahuman-readable text file. Within FreeBayes, the SNPswere filtered to retain those where the minimum num-ber of reads with the alternative allele was greater than3, which provided a total of 57,328 SNPs. We then ap-plied the following filters: the minimum fraction of reads
with the alternative allele for a SNP should be greaterthan or equal to 0.1; the percentage difference betweenthe base qualities for the reference and alternative allelesshould be less than or equal to 5; the SNP quality scorecut-off should be greater than or equal to 20. This pro-cedure yielded 18,251 SNPs. Then, within Excel, furtherfilters were applied: we required a total read coverageof greater than or equal to 700 (ie. a mean of at least 5reads for each sample in the population), which left3,246 SNPs; the percentage of heterozygous samples wasless than or equal to 2%, which left 1,985 SNPs; the ratioof alternative allele/reference allele was greater than orequal to 0.5, which left 1,968 SNPs.Genotypes were then called based on the proportion
of the reference allele. We identified this as homozygousfor the reference allele if the proportion was greater than0.8, as homozygous for the alternative allele if the pro-portion was less than 0.2 and as heterozygous if the pro-portion is between 0.2 and 0.8. Samples with fewer thanthree reads if designated homozygous, or with fewerthan six reads if designated heterozygous, were recodedas missing. Nineteen SNPs had a missing genotype forone of the parents, and these were also excluded to leave1,949 SNPs for linkage mapping. Visual inspection ofboth mappings and SNPs was carried out using the Tabletsoftware [32].
Linkage mappingThe SNP data were sorted by decreasing quality score be-fore analysis with JoinMap [33]. This ensured that whenco-segregating SNPs were excluded, the lower qualitySNPs were preferentially dropped. SNPs with greater than20% missing values were also excluded from the JoinMapanalysis. SNPs were grouped using the independence LODscore, and then ordered within each linkage group usingthe maximum likelihood algorithm. The GBS tags weremapped to reference sequences generated from Morex,Bowman and Barke WGS shotgun assemblies. Those fromMorex contain previously published anchored genetic/physical markers, which we assumed to be correct. We de-fine these as anchoring markers on the genetic linkagegroups. Additional file 4: Table S3 provides a list of 1,332unique co-dominant GBS markers used for map construc-tion and ordered according to their map location on theGPMx population. It highlights 403 genetically redundantmarkers, the correspondence of all GBS tags to expressedgenes (MLOC’s) and their genetic position on the IBSCconsensus map (IBSC, 2012).
QTL mappingQTL interval mapping was used to locate QTLs for the2009 and 2010 height data separately, using MapQTL[34]. A permutation test with 1,000 permutations wasused to establish the LOD threshold. Restricted multiple
Liu et al. BMC Genomics 2014, 15:104 Page 9 of 11http://www.biomedcentral.com/1471-2164/15/104
QTL mapping (rMQM mapping) was used to search forfurther QTLs taking into account the most significantones. A regression analysis, using Genstat 15 for Win-dows [35], was used to test for significant interactionsamong the selected QTLs. Genstat was also used to testwhich of the mapped SNPs showed the greatest asso-ciation with the two-rowed/six-rowed type, using chi-square tests of independence.
Cross-referencing barley genome data setsIn total 4,607 individual sequences from the manifestfiles accompanying barley OPA SNP mapping platforms[36] were used to identify corresponding sequences inthe barley genome represented by ~2.6 million sequencecontigs using the blastN algorithm [9]. The resultingtable cross-referenced SNP markers used to define intro-gressions in the Bowman backcross derived lines [28]and sequence contigs in the barley genome assembly[22]. Tables containing the contig anchoring results fromPOPSEQ [29] are available for download from ftp://ftp.ipk-gatersleben.de/barley-popseq/.
Additional files
Additional file 1: Table S1. Barcode adapters used for GBS.
Competing interestsThe authors declare that they have no competing interests.
Authors’ contributionsHL, PH, AD and RW conceived the study. HL and PH established andconducted the GBS analysis of the GPMx population with guidance from JP.AD developed and phenotyped the GPMx population. HL, JR, AD, LR and CHconducted statistical analysis of the genetic data with all NGS data processingsteps conducted by MB and HL. HL, AD, PH, MB, CH and RW wrote themanuscript, and all authors read and approved the final version. RW and PHsupervised the work and obtained the funding that allowed the study to beconducted.
AcknowledgementsWe would like to acknowledge Jill Alexander, Nicola Bonar, Richard Keith,Pauline Smith and Ilze Druka for excellent technical assistance, in particularduring population development and phenotypic analysis. The majority of thefunding for the described research came from the EU FP7 project‘TriticeaeGenome’ and the Scottish Government’s Rural and EnvironmentScience and Analytical Services Division (RESAS) Strategic ResearchProgramme Workpackage 5.2.
Author details1Cell and Molecular Sciences, The James Hutton Institute, Invergowrie,Dundee, Scotland DD2 5DA, UK. 2Biomathematics and Statistics Scotland(BioSS), Invergowrie, Dundee, Scotland DD2 5DA, UK. 3Hard Winter WheatGenetics Research Unit, USDA-ARS and Department of Agronomy, KansasState University, 4011 Throckmorton, Manhattan, KS 66506, USA. 4BiomedicalSciences Research Complex, University of St Andrews, North Haugh, StAndrews, Scotland KY16 9ST, UK. 5Division of Plant Sciences, James HuttonInstitute, Invergowrie, The University of Dundee. College of Life Sciences,Dundee, Scotland DD2 5DA, UK.
Received: 31 October 2013 Accepted: 3 February 2014Published: 6 February 2014
References1. Ellis RP, Forster BP, Gordon DC, Handley LL, Keith RP, Lawrence P, Meyer R,
Powell W, Robinson D, Scrimgeour CM, et al: Phenotype/genotypeassociations for yield and salt tolerance in a barley mapping populationsegregating for two dwarfing genes. J Exp Bot 2002, 53(371):1163–1176.
2. Forster BP: Mutation genetics of salt tolerance in barley: an assessmentof Golden Promise and other semi-dwarf mutants. Euphytica 1994,120(3):317–328.
3. Malosetti M, van Eeuwijk FA, Boer MP, Casas AM, Elia M, Moralejo M, BhatPR, Ramsay L, Molina-Cano JL: Gene and QTL detection in a three-waybarley cross under selection by a mixed model with kinship informationusing SNPs. Theor Appl Genet 2011, 122(8):1605–1616.
4. Siedler H, Graner A: Construction of physical maps of the Hor1 locus oftwo barley cultivars by pulsed field gel electrophoresis. Mol Gen Genet1991, 226(1–2):177–181.
5. Waugh R, Bonar N, Baird E, Thomas B, Graner A, Hayes PM, Powell W:Homology of AFLP products in three mapping populations of barley.Mol Gen Genet 1997, 255(3):311–321.
6. Ramsay L, Macaulay M, Ivanissevich SD, MacLean K, Cardle L, Fuller JD,Edwards KJ, Tuvesson S, Morgante M, Massari A, Maestri E, Marmiroli N,Sjakste T, Ganal M, Powell W, Waugh R: A simple sequence repeat-basedlinkage map of barley. Genetics 2000, 156:1997–2005.
7. Wenzl P, Carling J, Kudrna D, Jaccoud D, Huttner E, Kleinhofs A, Kilian A:Diversity Arrays Technology (DArT) for whole-genome profiling of barley.Proc Natl Acad Sci USA 2004, 101(26):9915–9920.
8. Rostoks N, Mudie S, Cardle L, Russell J, Ramsay L, Booth A, Svensson JT,Wanamaker SI, Walia H, Rodriguez EM, et al: Genome-wide SNP discoveryand linkage analysis in barley based on genes responsive to abioticstress. Mol Genet Genomics 2005, 274(5):515–527.
9. Comadran J, Kilian B, Russell J, Ramsay L, Stein N, Ganal M, Shaw P, Bayer M,Thomas W, Marshall D, et al: Natural variation in a homolog of AntirrhinumCENTRORADIALIS contributed to spring growth habit and environmentaladaptation in cultivated barley. Nat Genet 2012, 44(12):1388–1392.
10. Moragues M, Comadran J, Waugh R, Milne I, Flavell AJ, Russell JR: Effects ofascertainment bias and marker number on estimations of barleydiversity from high-throughput SNP genotype data. Theor Appl Genet2010, 120(8):1525–1534.
11. Baird NA, Etter PD, Atwood TS, Currey MC, Shiver AL, Lewis ZA, Selker EU,Cresko WA, Johnson EA: Rapid SNP discovery and genetic mapping usingsequenced RAD markers. PLoS One 2008, 3(10):e3376.
12. Chutimanitsakun Y, Nipper RW, Cuesta-Marcos A, Cistue L, Corey A,Filichkina T, Johnson EA, Hayes PM: Construction and application for QTLanalysis of a Restriction Site Associated DNA (RAD) linkage map inbarley. BMC Genomics 2011, 12:4.
13. Elshire RJ, Glaubitz JC, Sun Q, Poland JA, Kawamoto K, Buckler ES, MitchellSE: A robust, simple genotyping-by-sequencing (GBS) approach for highdiversity species. PLoS One 2011, 6(5):e19379.
14. McMullen MD, Kresovich S, Villeda HS, Bradbury P, Li H, Sun Q, Flint-Garcia S,Thornsberry J, Acharya C, Bottoms C, et al: Genetic properties of the maizenested association mapping population. Science 2009, 325(5941):737–740.
15. Poland JA, Brown PJ, Sorrells ME, Jannink JL: Development of high-densitygenetic maps for barley and wheat using a novel two-enzymegenotyping-by-sequencing approach. PLoS One 2012, 7(2):e32253.
16. Bus A, Hecht J, Huettel B, Reinhardt R, Stich B: High-throughputpolymorphism detection and genotyping in Brassica napus usingnext-generation RAD sequencing. BMC Genomics 2012, 13:281.
17. Yang H, Tao Y, Zheng Z, Li C, Sweetingham MW, Howieson JG: Applicationof next-generation sequencing for rapid marker development in molecularplant breeding: a case study on anthracnose disease resistance in Lupinusangustifolius L. BMC Genomics 2012, 13:318.
18. Truong HT, Ramos AM, Yalcin F, de Ruiter M, van der Poel HJ, HuvenaarsKH, Hogers RC, van Enckevort LJ, Janssen A, van Orsouw NJ, et al:Sequence-based genotyping for marker discovery and co-dominantscoring in germplasm and populations. PLoS One 2012, 7(5):e37565.
19. Lu F, Lipka AE, Glaubitz J, Elshire R, Cherney JH, et al: Switchgrass genomicdiversity, ploidy, and evolution: novel insights from a network-basedSNP discovery protocol. PLoS genetics 2013, 9:e1003215.
Liu et al. BMC Genomics 2014, 15:104 Page 10 of 11http://www.biomedcentral.com/1471-2164/15/104
20. Sonah H, Bastien M, Iquira E, Tardivel A, Légaré G, et al: An improvedgenotyping by sequencing (GBS) approach offering increased versatilityand efficiency of SNP discovery and genotyping. PloS One 2013, 8:e54603.
21. Mayer KF, Martis M, Hedley PE, Simkova H, Liu H, Morris JA, Steuernagel B,Taudien S, Roessner S, Gundlach H, et al: Unlocking the barley genome bychromosomal and comparative genomics. Plant Cell 2011, 23(4):1249–1263.
22. Mayer KF, Waugh R, Brown JW, Schulman A, Langridge P, Platzer M, FincherGB, Muehlbauer GJ, Sato K, Close TJ, et al: A physical, genetic and functionalsequence assembly of the barley genome. Nature 2012, 491(7426):711–716.
23. Mayer KF, Taudien S, Martis M, Simková H, Suchánková P, Gundlach H,Wicker T, Petzold A, Felder M, Steuernagel B, Scholz U, Graner A, Platzer M,Dolezel J, Stein N: Gene content and virtual gene order of barleychromosome 1H. Plant Physiol 2009, 151(2):496–505.
24. Langmead B, Schatz MC, Lin J, Pop M, Salzberg SL: Searching for SNPs withcloud computing. Genome Biol 2009, 10(11):R134.
25. Komatsuda T, Pourkheirandish M, He C, Azhaguvel P, Kanamori H, Perovic D,Stein N, Graner A, Wicker T, Tagiri A, et al: Six-rowed barley originatedfrom a mutation in a homeodomain-leucine zipper I-class homeoboxgene. Proc Natl Acad Sci USA 2007, 104(4):1424–1429.
26. Kucera J, Lundqvist U, Gustafsson A: Induction of breviaristatum mutantsin barley. Hereditas 1975, 80(2):263–278.
27. Thomas WTB, Powell W, Wood W: The chromosomal location of thedwarfing gene present in the spring barley variety golden promise.Heredity 1984, 53:177–183.
28. Druka A, Franckowiak J, Lundqvist U, Bonar N, Alexander J, Houston K,Radovic S, Shahinnia F, Vendramin V, Morgante M, et al: Genetic dissectionof barley morphology and development. Plant Physiol 2011, 155(2):617–627.
29. Mascher M, Munoz-Amatriain M, Barry K, Close TJ, Himmelback A, Poland J,Mayer KFX, Rokhsar D, Schmutz J, Scholz U, Schulman AH, Wise RP,Muehlbauer GJ, Stein N, Waugh R: Anchoring and ordering NGS contigassemblies by population sequencing (POPSEQ). Plant J 2013.doi: 10.1111/tpj.12319.
30. Altschul SF, Gish W, Miller W, Myers EW, Lipman DJ: Basic local alignmentsearch tool. J Mol Biol 1990, 215(3):403–410.
31. Garrison E: FreeBayes. In Marth Lab. Boston, US: Boston College; 2012.http://bioinformatics.bc.edu/marthlab.
32. Milne I, Stephen G, Bayer M, Cock PJA, Pritchard L, Cardle L, Shaw PD,Marshall D: Using tablet for visual exploration of second-generationsequencing data. Brief Bioinform 2013, 14(2):193–202.
33. Van Ooijen JW: JoinMap® 4, Software for the Calculation of Genetic LinkageMaps in Experimental Populations. Wageningen: Kyazma BV; 2006.
34. Van Ooijen JW: MapQTL® 5, Software for the Mapping of Quantitative TraitLoci in Experimental Populations. Wageningen, the Netherlands: Kyazma BV;2004.
36. Close TJ, Bhat PR, Lonardi S, Wu Y, Rostoks N, Ramsay L, Druka A, Stein N,Svensson JT, Wanamaker S, et al: Development and implementation ofhigh-throughput SNP genotyping in barley. BMC Genomics 2009, 10:582.
doi:10.1186/1471-2164-15-104Cite this article as: Liu et al.: An evaluation of genotyping by sequencing(GBS) to map the Breviaristatum-e (ari-e) locus in cultivated barley. BMCGenomics 2014 15:104.
Submit your next manuscript to BioMed Centraland take full advantage of:
• Convenient online submission
• Thorough peer review
• No space constraints or color figure charges
• Immediate publication on acceptance
• Inclusion in PubMed, CAS, Scopus and Google Scholar
• Research which is freely available for redistribution
Submit your manuscript at www.biomedcentral.com/submit
Liu et al. BMC Genomics 2014, 15:104 Page 11 of 11http://www.biomedcentral.com/1471-2164/15/104