Page 1
International Journal of Social Sciences & Educational Studies
ISSN 2520-0968 (Online), ISSN 2409-1294 (Print), June 2017, Vol.3, No.4
20 IJSSES
An Evaluation of Mobile Instant Messaging Applications’ Preferences:
Case of Kurdistan Region of Iraq
Chnar Abdullah Rashid1
1Sulaimani Polytechnic University, Sulaimani, Iraq
Correspondence: Chnar Abdullah Rashid, Sulaimani, Iraq. Email: [email protected]
Received: April 12, 2017 Accepted: May 23, 2017 Online Published: June 1, 2017
doi:10.23918/ijsses.v3i4p20
Abstract: This study aims to understand the satisfaction parameters of the mobile instant messaging
application users in Kurdistan Region of Iraq. To do that, MIMQual survey of Demir and Aydinli (2016)
have been conducted as survey questionnaire to the users in the region. Initially exploratory factor analysis
and reliability analysis have been proposed to validate the questionnaire in the region. Secondly, regression
analysis has been proposed to test the impact of each dimension on the user satisfaction. After that, again
regression model have been proposed to understand the determinants of the willingness to pay for an
application. Due to this model have been proposed in Turkey first, it has been learned in this study that
there are some similarities and some differentiations of Kurdistan Region regarding to Turkey. More
details about the research have been evaluated and concluded in the paper.
Keywords: Satisfaction of Users, MIMQual, Mobile Instant Messaging Applications, Customer Satisfaction.
1. Introduction
Since smart mobile phones production have increased the utilization of mobile instant messaging
application have been improved. Using these applications is necessary and important for people in order
to communicate with their relatives and friends. Thus, people are downloading these applications via
internet, because most of them are free of charge. Communication in society makes mobile instant
messages application to be used massively. Customer satisfaction has a great role in choosing one or
more of these applications by users. They may install more than one application in their mobile phone
but they are using only one of them because of the service quality. Anderson and Sullivan, 1993; Chang
and Chang, 2010; Orel and Kara, 2014; Zeithaml, Berry and Parasuraman, 1996 have demonstrated that
satisfaction is driving customer to repurchase a specific product or service. Hence, there are some factors
which affect customers to prefer one application to be chosen from them than the others.
2. Literature Review
Service quality can be seen as the customers’ perception about meeting their expectations. In order to
understand customers’ needs and expectations, companies must make market research to provide
customer satisfactions, if service quality considered being a customers’ perception (Grönroos, 1998).
One of the basic objectives of companies is customer satisfaction and this can be considered as a service
provision exceeding over customers’ expectations (Drucker, 1954). Service quality is the main factor of
customer satisfaction. On the other side, the term of service quality includes a number of factors which
Page 2
International Journal of Social Sciences & Educational Studies
ISSN 2520-0968 (Online), ISSN 2409-1294 (Print), June 2017, Vol.3, No.4
21 IJSSES
can be changed from one culture to another. Some of these factors may influence the customer
satisfaction in one culture, may not in another culture. Hence, the importance of these factors has to be
analyzed in every culture. A market research should be made by the company initially about the
customer expectations in order to increase the service provision. For instance, what they are doing for
fulfilling customers’ demand. In this way, a company can achieve customers’ loyalty (Oliver, 1999). A
consequence feeling of customers about satisfaction can be concerned as a loyalty. Feeling loyal to a
company from a customer means they may pay more for this good quality of service or product that the
company purchased to them rather than the other companies (Demir, Talaat & Aydinli, 2015).
The main field for e-business investors is MIM which is becoming an important sector of this field.
What’s up is using by 700 million people in the world. Facebook messenger is utilizing by 600 million,
using WeChat by 500 million, utilization of Skype by 300 million, there are 236 million users of Viber
in the world, Line is using by 181 million, Kakaotalk has 48 million users in the world (Woods, 2015;
Aydinli & Demir, 2015). On the other side, in Turkey 25% of internet users’ time is allocated for MIM,
spending 9.9% of their time is for social networking, and the rest time is for playing, reading, e-
mails…etc. (Mohamud, 2009). Obviously, these figures show that the most spending internet time of
internet users in Turkey is for MIM. For this purpose, this field might be an enormous sector for the e-
business investors. Another investigation has been implemented by Shim and Shin in Korea (2016)
about the moderator impact on group pressure in context of group chat by utilizing MIM through
conducting questionnaire among students.
Another research performed by Ogara, Koh, and Prybutok (2014), to investigate whether mobile instant
messages are satisfying the users or not by utilizing the models of channel expansion, social influence,
social presence and media richness theories. In order to know the elder users’ necessities Kiat and Chen
(2015) have examined the MIM. Deng, Lu, Wei, and Zhang (2010) have investigated the loyalty and
satisfaction of users of MIM in China. They have tested Trust, Service Quality, Perceived, Functional,
Emotional, Social, and Monetary Value to be a dynamic of the users’ satisfaction. As a result, 54% of
the variance is to satisfaction and 64% is for loyalty by using only 3 items to measure perceived service
quality of an application. However, utilizing only 3 items for measuring this application will not be
enough.
Some other researches have been published in this field for instance, Oghuma, Libaque-Saenz, Wong,
and Chang (2016) studied comprehension of the continuing desire to utilize MIM in Korea through
utilizing the model of expectation-confirmation. For the measurement purpose, they include these items
such as confirmation, perceived enjoyment, continuance intention, perceived service quality,
satisfaction, Perceived Security, User Interface, and Perceived Usefulness.
Customer satisfactions can be considered as a main factor of evaluating mobile instant messaging
applications from quality of view, if a MIM application seen as service which means it has both provider
and customer (Aydinli & Demir, 2015, Wang & Lo, 2002). Within this framework some of the aspects
of some factors should be included in the strategic plan in order quality dimension of this service to be
explored. However, some of the factors might be more important than the others in influencing
customers’ satisfaction. For this reason, service providers can be controlled by customers’ satisfaction
(Demir, Eray & Erguvan, 2015; Drucker, 1954). A positive decision by the customer about a utilized
product is customer satisfaction (Kotler, 1991). In a case this decision occurs, the customer will probably
Page 3
International Journal of Social Sciences & Educational Studies
ISSN 2520-0968 (Online), ISSN 2409-1294 (Print), June 2017, Vol.3, No.4
22 IJSSES
use the same service again because, it is noted that a key factor of repurchase and reutilize of any service
is the satisfaction (Demir, Talaat & Aydinli, 2015; Demir & Eray, 2015).
Since Smart phone has been utilized in Kurdistan, the majority of people are using MIM such: Viber,
what’s up, Skype, Messenger, Telegram, for communication with their families and relatives. Thus,
MIM became an enormous sector of e-business investment. However, a minority of people in Kurdistan
are using Telegram because utilization of this application is more popular in Iran and only those people
are using it that they have relatives in Iran. There is no research performed in Kurdistan before on this
issue to provide any figures to announce us about how much people exactly use Viber for instance. The
only research has conducted by (Demir & Aydinli, 2016) and he found that the majority of people are
using Viber in Kurdistan.
Customers’ anticipating might be changing from a service to another if, service quality is the customers’
expectations conforming. Dimensions of service quality of internet retailing can be explored to 14
dimensions such as: Reaction, integrity, ease of use, reliability, suitability, communication, entrance,
capability, politeness, personalization, continues improvement, cooperation, security/privacy, and
aesthetics (Yang, Peterson & Cai, 2003). Nevertheless, these dimensions are somehow similar to those
which have explored by Parasuraman et al. (1985), such: (sympathy, reaction, assurance, reliability, and
tangibles), still some technical dimensions are unique. In this study, some dimensions will be explored
which are totally unique form the previous studies. However, they are more or less similar to each other
as the dimensions of customer satisfaction of the mobile instant messaging applications (Demir &
Aydinli, 2016). Lots of users of these applications are interviewed in Turkey (Demir & Aydinli, 2016).
They asked to express their expectations about those applications through voice recorded. Some factors
are designed depending on the answers. Marketing, production management, and statistics experts from
a number of companies and Universities in Turkey are argued to discuss about these factors. As
consequence, 7 factors are determined as the application quality dimensions. These factors are as follows
Demir and Aydinli (2016):
1. Communication: one of the most important parameter of communications is speed and quality. Such
application that does not provide a quick and good quality signal of communication will not be accepted
by consumers. This communication might be voice or video. Related Questions:
• Voice Signals are delivered fast • Voice signals are quality
• Video call quality is high • Video call signals are delivered fast.
2. Data transfer: significant parameter of the data transfer for consumers is speed and quality. The
quality and the quickness of a message, picture, video, and so on are important from the consumers’
point of view. Related Questions:
• Text messages are delivered fast • Pictures are delivered fast
• Video records are delivered fast • Any document is delivered fast.
3. Features: applications are similar more or less with each other; however, they are different in some
points. Some of the applications might have better features than the others. For instance, video call might
Page 4
International Journal of Social Sciences & Educational Studies
ISSN 2520-0968 (Online), ISSN 2409-1294 (Print), June 2017, Vol.3, No.4
23 IJSSES
be provided by an application which cannot be found in another application. This could have influence
on the quality of service using.
Related Questions:
• Number of stickers of this application is enough.
• There is location delivery option in this application.
• Location delivery option is nice.
• When you send a message, you can see that the other party has seen the message or not.
• I like it when I see that other party has seen the message or not.
• By the time other party connects to the internet, I can see that s/he is online.
• I like to see if the other party is online by the time s/he connects to the internet.
4. Aesthetics: it is significant for a customer to have further aesthetic application in terms of good
looking, color and so on. Related Questions:
• There is a very nice background style of this application.
• Colors of the background of this application are very nice.
• Visually messages are seen very nice.
5. Security: communication through an application may look as risky issue. Likewise, a consumer may
prefer an application that can be more secured from the confidentiality of information point of view such
as: video, messages, voice and contact information. Related Questions:
• It is hard to hack my account in this application.
• I feel confident about my privacy while using this application.
• I know that my private information will not be shared with other parties.
• I know my messages will not be shared with other parties.
• I know my speeches will not be listened by other parties.
6. Feedback: the owners’ application for feedback evaluations could be preferred from the consumers.
The improvement and development of the application is significant on the bases of the feedback from the
customers. Related Questions:
• There is a strong feedback system in this application.
• Feedbacks of the customers are carefully considered.
• I think that owners of this application are developing the software based on the feedbacks.
Page 5
International Journal of Social Sciences & Educational Studies
ISSN 2520-0968 (Online), ISSN 2409-1294 (Print), June 2017, Vol.3, No.4
24 IJSSES
7. Marketing: almost customers want to utilize an application which is utilized by their friends broadly.
When they want to communicate with each other they can easily be connecting in a group. This can be
achieved when the owners of the application develop a strong marketing strategy. Related Questions:
• This application is widely used among my friends.
• Owners of this application are making very good marketing of this product.
• When I would like to create a group of my friends, I can include almost all of my friends
• I think this is one of the most widely used applications.
3. Methodology
3.1. Purpose of the Study
This study was conducted to study satisfaction of customers who are utilizing the mobile instant
messaging applications in Kurdistan Region of Iraq. Secondly, by testing the concerning hypothesis, it
was aimed to see the determinants of satisfaction in this field.
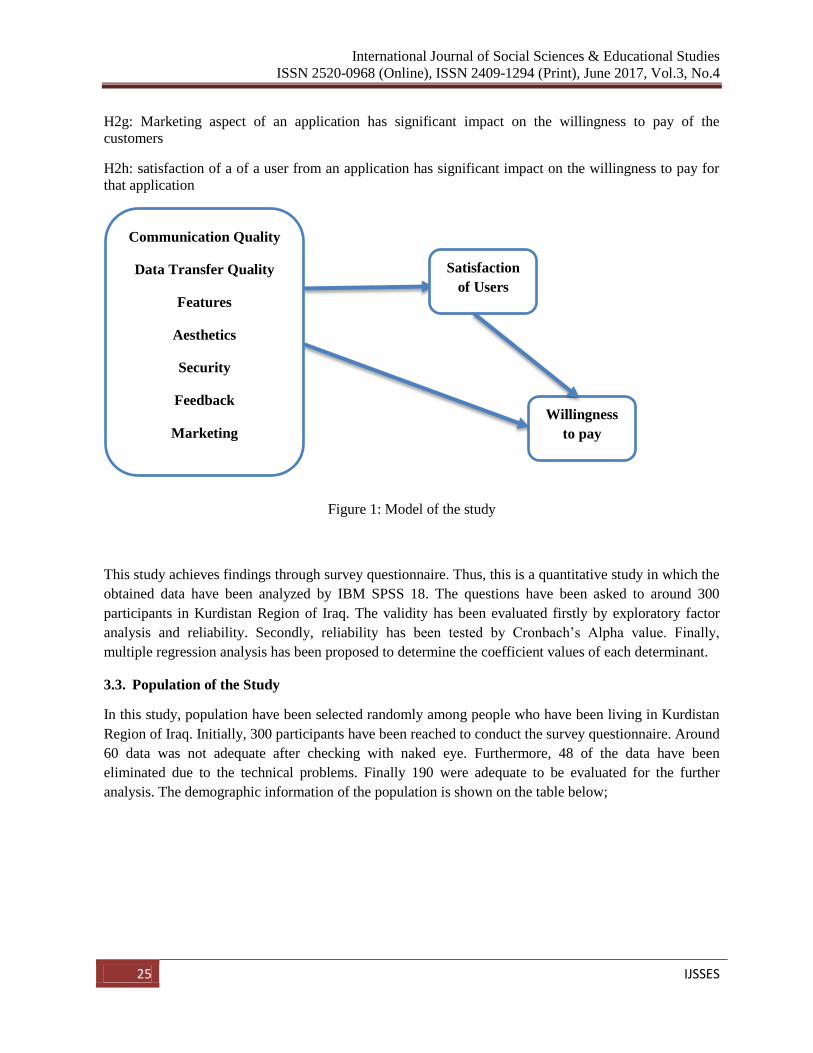
3.2. Model of the Study
In this study, influence of the mobile instant messaging application quality dimensions on the user
satisfaction has been elaborated by regression models. The hypothesis and the theoretical model of the
study can be shown as;
H1a: Communication quality of an application has significant impact on the satisfaction of the customers
H1b: Data Transfer quality of an application has significant impact on the satisfaction of the customers
H1c: Security aspect of an application has significant impact on the satisfaction of the customers
H1d: Features of an application has significant impact on the satisfaction of the customers
H1e: Aesthetics view of an application has significant impact on the satisfaction of the customers
H1f: Feedback quality of an application has significant impact on the satisfaction of the customers
H1g: Marketing aspect of an application has significant impact on the satisfaction of the customers
H2a: Communication quality of an application has significant impact on the willingness to pay of the
customers
H2b: Data Transfer quality of an application has significant impact on the willingness to pay of the
customers
H2c: Security aspect of an application has significant impact on the willingness to pay of the customers
H2d: Features of an application has significant impact on the willingness to pay of the customers
H2e: Aesthetics view of an application has significant impact on the willingness to pay of the customers
H2f: Feedback quality of an application has significant impact on the willingness to pay of the customers
Page 6
International Journal of Social Sciences & Educational Studies
ISSN 2520-0968 (Online), ISSN 2409-1294 (Print), June 2017, Vol.3, No.4
25 IJSSES
H2g: Marketing aspect of an application has significant impact on the willingness to pay of the
customers
H2h: satisfaction of a of a user from an application has significant impact on the willingness to pay for
that application
Figure 1: Model of the study
This study achieves findings through survey questionnaire. Thus, this is a quantitative study in which the
obtained data have been analyzed by IBM SPSS 18. The questions have been asked to around 300
participants in Kurdistan Region of Iraq. The validity has been evaluated firstly by exploratory factor
analysis and reliability. Secondly, reliability has been tested by Cronbach’s Alpha value. Finally,
multiple regression analysis has been proposed to determine the coefficient values of each determinant.
3.3. Population of the Study
In this study, population have been selected randomly among people who have been living in Kurdistan
Region of Iraq. Initially, 300 participants have been reached to conduct the survey questionnaire. Around
60 data was not adequate after checking with naked eye. Furthermore, 48 of the data have been
eliminated due to the technical problems. Finally 190 were adequate to be evaluated for the further
analysis. The demographic information of the population is shown on the table below;
Willingness
to pay
Communication Quality
Data Transfer Quality
Features
Aesthetics
Security
Feedback
Marketing
Satisfaction
of Users
Page 7
International Journal of Social Sciences & Educational Studies
ISSN 2520-0968 (Online), ISSN 2409-1294 (Print), June 2017, Vol.3, No.4
26 IJSSES
Table 1: Demographic information of the population
Age
Frequency Percent Valid
Percent
Cumulative
Percent
Valid 18-25 136 71.6 71.6 71.6
16-35 45 23.7 23.7 95.3
36-45 7 3.7 3.7 98.9
46-55 2 1.1 1.1 100.0
Total 190 100.0 100.0
Years of Utilization
Frequency Percent Valid
Percent
Cumulative
Percent
Valid 1-3 years 28 14.7 14.7 14.7
4-6 years 63 33.2 33.2 47.9
7-10 years 86 45.3 45.3 93.2
11-13 years 10 5.3 5.3 98.4
14-16 years 3 1.6 1.6 100.0
Total 190 100.0 100.0
Type of Application Utilized
Frequency Percent Valid
Percent
Cumulative
Percent
Valid Whatsapp 33 17.4 17.4 17.4
Viber 44 23.2 23.2 40.5
Facebook 70 36.8 36.8 77.4
Skype 5 2.6 2.6 80.0
Line 27 14.2 14.2 94.2
Kakao Talk 5 2.6 2.6 96.8
Tango 5 2.6 2.6 99.5
Wechat 1 .5 .5 100.0
Total 190 100.0 100.0
It was seen that 72 percent of the population was between 18 and 25 years old. As number, this value
was 136. Within the population, 24 percent was between 26 and 35 years old while 3.7 percent was
between 36 and 45 years old. Finally, 1.1 percent of the population was above 45 years old. 14.7 percent
of the population have been utilizing the mobile instant messaging applications for 1-3 years. Further, 33
percent of the population have been utilizing for 4-6 years, 45 percent was utilizing for 7-10 years, and
only 7 percent of the population have been utilizing the mobile instant messaging applications for more
than 10 years.
Page 8
International Journal of Social Sciences & Educational Studies
ISSN 2520-0968 (Online), ISSN 2409-1294 (Print), June 2017, Vol.3, No.4
27 IJSSES
4. Findings
4.1. Exploratory Factor Analysis
It is known that before proposing any further analysis, the validity and the reliability must be tested. In
this research, exploratory factor analysis has been used to test the validity. Initially, Kaiser Meyer Olkin
test result shows about the adequacy of the population of a study. It is known that this value must be
over .50 in order to determine that the sample is adequate. Beside this, Bartlett's Test of Sphericity must
be significant. The sample of this study shows that KMO level of the test result is 0.907. This result is
quite above the sufficient level. Furthermore, the Bartlett's Test of Sphericity is significant and this
results show that we can perform further analysis with this sample population.
Table 2: Results of Exploratory Factor Analysis
Question
No
Standard
Deviation
Mean Dimension Extraction Anti-
Image
Factor
Loading
1. 3.36 1.280
Communication
Quality
.703 .893 .775
2. 3.36 1.268 .730 .875 .803
3. 3.30 1.247 .691 .911 .804
4. 3.53 1.224 .547 .899 .626
5. 3.56 1.274
Data Transfer
Quality
.705 .930 .736
6. 3.44 1.287 .703 .907 .699
7. 3.41 1.230 .699 .918 .697
8. 3.42 1.252 .697 .923 .652
9. 3.15 1.370
Features
.742 .906 .798
10. 3.19 1.241 .785 .853 .851
11. 3.27 1.258 .837 .913 .865
12. 3.24 1.298 .822 .892 .853
13. 3.18 1.342 .751 .900 .788
14. 3.28 1.252
Aesthetics
.835 .849 .806
15. 3.26 1.350 .793 .845 .804
16. 3.98 1.567 .553 .871 .702
17. 2.76 1.319 .637 .959 .593
18. 2.95 1.424 .824 .896 .811
19. 3.05 1.415 .844 .892 .827
20. 3.02 1.416 .758 .914 .745
21. 3.11 1.397 .657 .960 .664
22. 3.95 1.563 .536 .883 .655
23. 2.94 1.296 .458 .948 .457
24. 2.97 1.327
Security
.774 .881 .783
25. 2.94 1.355 .847 .892 .791
26. 3.12 1.368 .757 .912 .760
27. 3.07 1.295 Feedback
.785 .916 .754
28. 2.98 1.276 .799 .911 .716
Page 9
International Journal of Social Sciences & Educational Studies
ISSN 2520-0968 (Online), ISSN 2409-1294 (Print), June 2017, Vol.3, No.4
28 IJSSES
29. 3.07 1.310 .663 .899 .692
30. 3.25 1.468
Marketing
.760 .951 .641
31. 3.34 1.346 .738 .927 .631
32. 3.47 1.413 .726 .920 .623
33. 3.45 1.475 .793 .914 .709
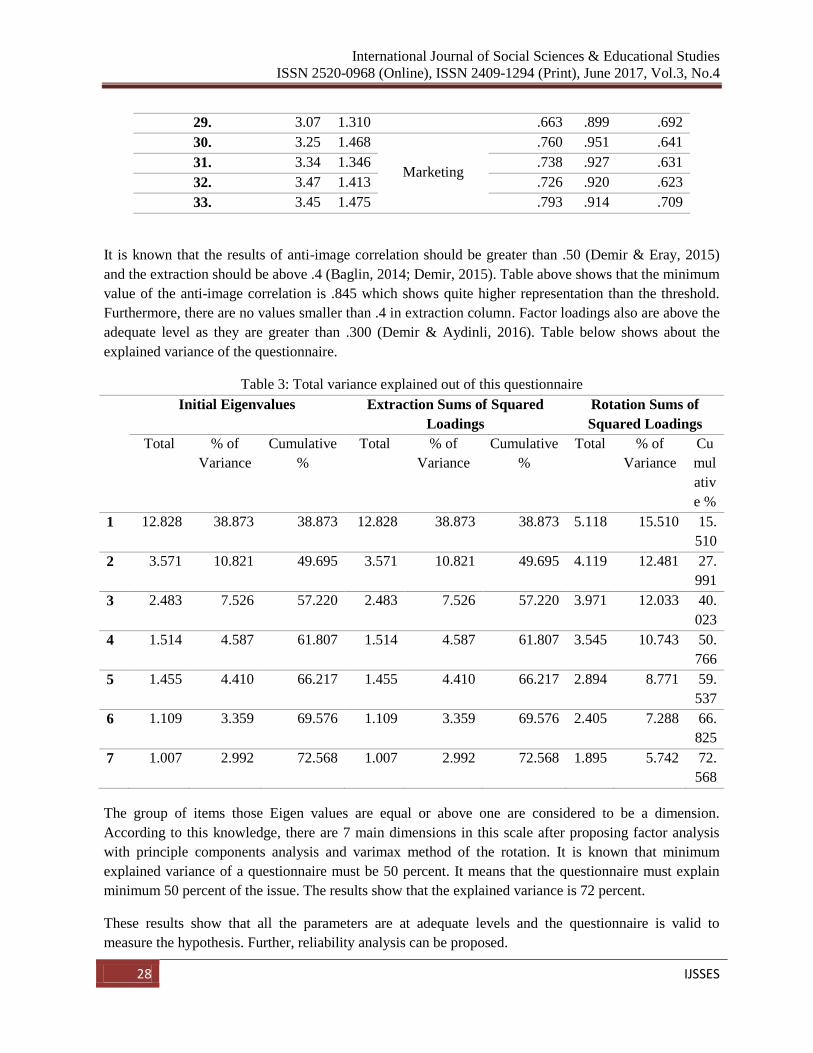
It is known that the results of anti-image correlation should be greater than .50 (Demir & Eray, 2015)
and the extraction should be above .4 (Baglin, 2014; Demir, 2015). Table above shows that the minimum
value of the anti-image correlation is .845 which shows quite higher representation than the threshold.
Furthermore, there are no values smaller than .4 in extraction column. Factor loadings also are above the
adequate level as they are greater than .300 (Demir & Aydinli, 2016). Table below shows about the
explained variance of the questionnaire.
Table 3: Total variance explained out of this questionnaire
Initial Eigenvalues Extraction Sums of Squared
Loadings
Rotation Sums of
Squared Loadings
Total % of
Variance
Cumulative
%
Total % of
Variance
Cumulative
%
Total % of
Variance
Cu
mul
ativ
e %
1 12.828 38.873 38.873 12.828 38.873 38.873 5.118 15.510 15.
510
2 3.571 10.821 49.695 3.571 10.821 49.695 4.119 12.481 27.
991
3 2.483 7.526 57.220 2.483 7.526 57.220 3.971 12.033 40.
023
4 1.514 4.587 61.807 1.514 4.587 61.807 3.545 10.743 50.
766
5 1.455 4.410 66.217 1.455 4.410 66.217 2.894 8.771 59.
537
6 1.109 3.359 69.576 1.109 3.359 69.576 2.405 7.288 66.
825
7 1.007 2.992 72.568 1.007 2.992 72.568 1.895 5.742 72.
568
The group of items those Eigen values are equal or above one are considered to be a dimension.
According to this knowledge, there are 7 main dimensions in this scale after proposing factor analysis
with principle components analysis and varimax method of the rotation. It is known that minimum
explained variance of a questionnaire must be 50 percent. It means that the questionnaire must explain
minimum 50 percent of the issue. The results show that the explained variance is 72 percent.
These results show that all the parameters are at adequate levels and the questionnaire is valid to
measure the hypothesis. Further, reliability analysis can be proposed.
Page 10
International Journal of Social Sciences & Educational Studies
ISSN 2520-0968 (Online), ISSN 2409-1294 (Print), June 2017, Vol.3, No.4
29 IJSSES
4.2. Reliability Analysis
Cronbach’s Alpha value analysis was proposed in order to test the reliability of the questionnaire.
Cronbach’s Alpha value is one of the ways to determine how reliably the same results might be obtained.
According to the rule of Cronbach’s Alpha in literature, the reliability level of each dimension and whole
questionnaire should be .70 and above. The table below shows about the results of reliability analysis.
Table 4: Reliability analysis
Communication Quality
Reliability Statistics
Cronbach's
Alpha
N of Items
.865 4
Item-Total Statistics
Scale Mean if
Item Deleted
Scale
Variance if
Item Deleted
Corrected
Item-Total
Correlation
Cronbach's
Alpha if Item
Deleted
Q1 10.19 9.953 .784 .797
Q2 10.18 10.183 .757 .809
Q3 10.25 10.388 .744 .815
Q4 10.02 11.619 .575 .880
Data Transfer Quality
Reliability Statistics
Cronbach's
Alpha
N of Items
.888 4
Item-Total Statistics
Scale Mean if
Item Deleted
Scale
Variance if
Item Deleted
Corrected
Item-Total
Correlation
Cronbach's
Alpha if Item
Deleted
Q5 10.27 11.332 .710 .873
Q6 10.39 10.567 .816 .832
Q7 10.42 11.261 .760 .854
Q8 10.41 11.301 .734 .864
Features
Reliability Statistics
Cronbach's
Alpha
N of Items
.926 5
Item-Total Statistics
Page 11
International Journal of Social Sciences & Educational Studies
ISSN 2520-0968 (Online), ISSN 2409-1294 (Print), June 2017, Vol.3, No.4
30 IJSSES
Scale Mean if
Item Deleted
Scale
Variance if
Item Deleted
Corrected
Item-Total
Correlation
Cronbach's
Alpha if Item
Deleted
Q9 12.88 21.133 .771 .916
Q10 12.84 21.795 .810 .908
Q11 12.76 21.314 .845 .902
Q12 12.79 21.053 .838 .903
Q13 12.85 21.347 .772 .916
Aesthetics
Reliability Statistics
Cronbach's
Alpha
N of Items
.860 10
Item-Total Statistics
Scale Mean if
Item Deleted
Scale
Variance if
Item Deleted
Corrected
Item-Total
Correlation
Cronbach's
Alpha if Item
Deleted
Q14 29.00 75.323 .466 .854
Q15 29.02 75.238 .425 .858
Q16 28.30 74.497 .372 .865
Q17 29.52 69.806 .701 .836
Q18 29.33 68.223 .712 .834
Q19 29.23 67.417 .757 .830
Q20 29.26 68.280 .715 .834
Q21 29.17 69.072 .689 .836
Q22 28.33 73.969 .394 .863
Q23 29.34 73.919 .512 .851
Security
Reliability Statistics
Cronbach's
Alpha
N of Items
.901 3
Item-Total Statistics
Scale Mean if
Item Deleted
Scale
Variance if
Item Deleted
Corrected
Item-Total
Correlation
Cronbach's
Alpha if Item
Deleted
Q24 6.05 6.463 .810 .853
Q25 6.09 6.135 .851 .816
Q26 5.91 6.558 .751 .903
Feedback
Page 12
International Journal of Social Sciences & Educational Studies
ISSN 2520-0968 (Online), ISSN 2409-1294 (Print), June 2017, Vol.3, No.4
31 IJSSES
Reliability Statistics
Cronbach's
Alpha
N of Items
.863 3
Item-Total Statistics
Scale Mean if
Item Deleted
Scale
Variance if
Item Deleted
Corrected
Item-Total
Correlation
Cronbach's
Alpha if Item
Deleted
Q27 6.05 5.622 .738 .810
Q28 6.14 5.466 .794 .759
Q29 6.05 5.764 .692 .853
Marketing
Reliability Statistics
Cronbach's
Alpha
N of Items
.934 4
Item-Total Statistics
Scale Mean if
Item Deleted
Scale
Variance if
Item Deleted
Corrected
Item-Total
Correlation
Cronbach's
Alpha if Item
Deleted
Q30 10.26 15.378 .838 .916
Q31 10.17 16.257 .840 .916
Q32 10.04 15.697 .848 .913
Q33 10.05 15.172 .856 .910
The table above shows that the Cronbach’s Alpha level of each dimension is .700. The minimum value
of the test was obtained as .860 and the maximum value was 934. However, the Cronbach’s Alpha levels
if any item of the dimensions deleted also have been determined. Furthermore, the value of the whole
questionnaire was obtained as .950 and this value is quite adequate.
After these results, it can be said that the questionnaire which have been used in this research is both
valid and reliable. In the next chapter, further analysis can be proposed.
4.3. Regression Analysis Results
Regression analysis is to determine the impact of each independent variable on the satisfaction and
willingness to pay for the concerning mobile instant messaging application. In this study, initially the
impact of 7 dimensions on the satisfaction of the customers has been tested. The results are on the table
below.
Page 13
International Journal of Social Sciences & Educational Studies
ISSN 2520-0968 (Online), ISSN 2409-1294 (Print), June 2017, Vol.3, No.4
32 IJSSES
Table 5: Influence of Mobile Instant Messaging Applications on Satisfaction of User
Model Unstandardized
Coefficients
Standardized
Coefficients
t Sig.
B Std. Error Beta
1 (Constant) .335 .217 1.546 .124
Communication Quality -.013 .075 -.011 -.171 .864
Data Transfer Quality .131 .074 .119 1.965 .049
Features -.044 .055 -.042 -.797 .427
Aesthetics -.064 .096 -.050 -.664 .507
Security .041 .058 .042 .703 .483
Feedback .318 .062 .305 5.149 .000
Marketing .509 .065 .554 7.819 .000
a. Dependent Variable: Satisfaction
Initially, it was seen that the adjusted R square was 64%. This shows that the satisfaction of the
customers in Kurdistan Region of Iraq are explained by those dimensions. Further, the coefficients of the
dimensions show that the most significant impact on the satisfaction is belonging to the marketing of the
concerning mobile instant messaging application. Marketing has standardized regression coefficient of
.554 and this value is the highest of all. However, Marketing, Feedback, and Data Transfer Quality are
the dimensions which influence the user satisfaction significantly while the remaining dimensions not.
Moreover, to test the impact of 7 dimensions and the satisfaction independent variables on the
willingness to pay of the user, another regression model have been proposed. The results are on the table
below.
Page 14
International Journal of Social Sciences & Educational Studies
ISSN 2520-0968 (Online), ISSN 2409-1294 (Print), June 2017, Vol.3, No.4
33 IJSSES
Table 6: Impact of Satisfaction and other 7 dimensions on the user willingness to pay
Model Unstandardized
Coefficients
Standardized
Coefficients
t Sig.
B Std. Error Beta
1 (Constant) .730 .287 2.547 .012
Communication Quality .060 .099 .055 .604 .547
Data Transfer Quality -.019 .098 -.018 -.189 .850
Features .005 .072 .005 .065 .948
Aesthetics .007 .127 .005 .053 .958
Security -.022 .077 -.023 -.286 .776
Feedback .170 .087 .169 1.966 .051
Marketing -.129 .103 -.146 -1.257 .210
Satisfaction .548 .102 .578 5.358 .000
a. Dependent Variable: Willingness to pay
The table above shows the dimensions which impact on the willingness to pay of the user. Is seems that
the satisfaction has the most influence on the willingness to pay. It was observed that the adjusted r
square of the model is 33%. It means that if a customer is satisfied of the concerning mobile instant
messaging application, 33% of chance that s/he will intend to pay for that application. Furthermore,
satisfaction and feedback are only the dimensions which impact on the willingness of pay for an
application. Remaining dimensions don’t have significant impact on the willingness to pay.
5. Conclusions and Discussions
The results show that these dimensions explained 64% of the customer satisfaction on mobile instant
messaging application field. Further, the most important factor for satisfaction of users was marketing.
The reason might be that the users install the most used application among each other and this depends
on the marketing of the concerning application. Demir and Aydinli (2016) found the variance close to
this study as 60%.
Feedback was the second important dimension that influence the satisfaction of the mobile instant
messaging applications’ users. The reason might be that the customers feel important when their
feedbacks are evaluated by the producers to improve the quality of the application. According to Demir
and Aydinli (2016) also found that the feedback was the second important dimension which impact the
user satisfaction.
Page 15
International Journal of Social Sciences & Educational Studies
ISSN 2520-0968 (Online), ISSN 2409-1294 (Print), June 2017, Vol.3, No.4
34 IJSSES
Very interestingly security was the least influencing dimension. This result also seems parallel with
Demir and Aydinli (2016). The reason might be the users are not thinking or paying attention to the
security because;
a) They are not recording the correct information about them and keep the confidentiality by that
way.
b) The users are not aware of the consequences of security problems on virtual world.
On the other hand, communication quality, features, aesthetics and security didn’t significantly influence
satisfaction of the users. Du to this was not the case for authors Demir and Aydinli (2016). This might be
considered as a contradiction between two researches. The reason might be cultural and market
differentiation. Tastes, perceptions and reasons of satisfaction might change from one society to another.
In this research, willingness to pay also have been tested to understand the dimensions which influence
the willingness to pay for the concerning application. It was seen that satisfaction has significant and the
greatest impact on the willingness to pay for an application. However, 7 dimensions and the satisfaction
explained the 33% of the overall variance in this field. On the other hand, only satisfaction and feedback
influenced the willingness to pay but remaining not.
In the further researches, the authors might take internet quality also into consideration as mediating
effect. Furthermore, to increase variance for willingness to pay, extra dimensions and parameters might
be included such as repurchase intention. To extend this study, another research can be conducted to
compare the customers who pays for the concerning application with who don’t. By this way, reasons
those increase willingness to pay might be seen well.
To mention about the limitations of this study, sampling could be increased and homogeneously
gathered from all over Kurdistan Region of Iraq. In this study only from Erbil and Sulaimani the data
could be gathered due to lack of support.
This study might be useful for the e-business investors and good source of information about this region.
The information which have been provided in this study shows some differences from other studies as
well as similarities. By this way it can be understood that Kurdistan Region of Iraq has some similar
tastes of satisfaction in this field and some unique evaluation criteria.
References
Anderson, E. W., & Sullivan, M. W. (1993). The antecedents and consequences of customer satisfaction
for firms. Marketing science, 12(2), 125-143.
Aydinli, C., & Demir, A. (2015). Impact of non-technical dimensions of service quality on the
satisfaction, loyalty, and the willingness to pay more: A cross-national research on GSM
operators. International Journal of Economics, Commerce and Management, 3(11), 1-16.
Baglin, J. (2014). Improving your exploratory factor analysis for ordinal data: a demonstration using
factor. Practical Assessment, Research & Evaluation, 19(5), 2.
Chang. Y. W., & Chang. Y. H. (2010). Does service recovery affect satisfaction and customer loyalty?
an empirical study of airline services. Journal of Air Transport Management. 16(6), 340-342.
Demir, A., Talaat, K., & Aydinli, C. (2015). The Relations among Dimensions of Service Quality,
Satisfaction, Loyalty, and Willingness to pay more: Case of GSM Operators Service at
Page 16
International Journal of Social Sciences & Educational Studies
ISSN 2520-0968 (Online), ISSN 2409-1294 (Print), June 2017, Vol.3, No.4
35 IJSSES
Northern-Iraq. International Journal of Academic Research in Accounting, Finance and
Management Sciences, 5(4), 146-154.
Demir, A., & Aydinli, C. (2016), Exploring the Quality Dimensions of Mobile Instant Messaging
Applications and Effects of Them on Customer Satisfaction. International Journal of Control
Theory and Applications, 9(22), 1-15.
Demir, A., Eray, O., & Erguvan, M. M. (2015). How Non-Technical Dimensions of Service Quality
Effects Satisfaction and Loyalty of Costomers at Gsm Service Sector in Georgia? International
Journal of Engineering Technology and Scientific Innovation, 1(02), 150-162.
Demir, A., & Eray, O. (2015). Effect of Non-Technical Dimensions of Service Quality on
“Satisfaction”,“Loyalty”, and “Willingness to Pay More” of the Customers: the Case of
Georgian Internet Service Providing Companies. Journal of Research in Business, Economics
and Management, 5(1), 500-508.
Deng. Z.. Lu. Y.. Wei. K. K.. & Zhang. J. (2010). Understanding customer satisfaction and loyalty: An
empirical study of mobile instant messages in China. International Journal of Information
Management, 30(4), 289-300.
Drucker. P.F. (1954). The Practice of Management. New York: Harper & Row.
Grönroos. C. (1984). A service quality model and its marketing implications. European Journal of
Marketing. 18(4), 36-44.
Kotler. P. (1991). Marketing Management – Analysis. Planning. Implementation and Control. 7th ed..
NJ: Prentice-Hall. Englewood Cliffs.
Kiat, B. W., & Chen, W. (2015). Mobile Instant Messaging for the Elderly. Procedia, Computer Science,
67, 28-37.
Lance, C. E., Butts, M. M., & Michels, L. C. (2006). The sources of four commonly reported cutoff
criteria what did they really say? Organizational Research Methods, 9(2), 202-220.
Mohamud. A. (2009). http://www.comscore.com/Insights/Press-Releases/2009/7/Turkey-Instant-
Messagingand-Social-Networking/(language)/eng-US. Retrieved March 09. 2016. from
www.comscore.com: http:// www.comscore.com/Insights/Press-Releases/2009/7/Turkey-
Instant-Messaging-and-Social-Networking/(language)/ eng-US
Orel. F. D.. & Kara. A. (2014). Supermarket self-checkout service quality. customer satisfaction. and
loyalty: empirical evidence from an emerging market. Journal of Retailing and Consumer
Services, 21(2), 118-129.
Oliver, R.L. (1999). Whence consumer loyalty. Journal of Marketing, 63 (special issue), 33–44
Ogara, S. O., Koh, C. E., & Prybutok, V. R. (2014). Investigating factors affecting social presence and
user satisfaction with mobile instant messaging. Computers in Human Behavior, 36, 453-459.
Oghuma, A. P., Libaque-Saenz, C. F., Wong, S. F., & Chang, Y. (2016). An expectation-confirmation
model of continuance intention to use mobile instant messaging. Telematics and Informatics,
33(1), 34-47.
Wang. Y.. & Lo. H. P. (2002). Service quality. customer satisfaction and behavior intentions: Evidence
from China’s telecommunication industry. Info, 4(6), 50-60.
Yang. Z.. Peterson. R. T.. & Cai. S. (2003). Services quality dimensions of Internet retailing: an
exploratory analysis. Journal of Services Marketing. 17(7), 685-700.
Zeithaml. V. A.. Berry. L. L.. & Parasuraman. A. (1996). The behavioral consequence of service quality.
Journal of Marketing, 60(2), 31-46.