An evaluation of the financial transaction tax CPB Achtergronddocument, behorend bij CPB Notitie , 21 december 2011, ‘Evaluatie van de financiële transactiebelasting’ Michiel Bijlsma Marcel Lever Jürgen Anthony Gijsbert Zwart 21 december 2011
Transcript
An evaluation of the financial transaction tax
CPB Achtergronddocument,
behorend bij CPB Notitie , 21 december 2011, ‘Evaluatie van de financiële transactiebelasting’
Michiel Bijlsma
Marcel Lever
Jürgen Anthony
Gijsbert Zwart
21 december 2011
2
3
Summary
The European Commission has proposed a Financial Transactions Tax (FTT). This tax is to make sure that the
financial sector bears a fair share of the burden of the financial crisis, and to discourage excessive risk-taking
in the financial sector. The tax will apply to almost all financial transactions carried out by financial
institutions established in the Member States.
In this note we explore whether the FTT is likely to correct the market failures that have contributed to the
financial crisis, how well the FTT is likely to succeed in raising revenues, and how the FTT compares to
alternative taxes in terms of efficiency. We find little evidence that the FTT will be effective in correcting
market failures. Taxing of transactions is not well targeted at behaviour that leads to excessive risk and
systemic risk creation. The empirical evidence does not suggest that the introduction of an FTT reduces
volatility or asset price bubbles. Transaction taxes will likely reduce investment in trading activity and
information acquisition, but also raise the costs of insurance against currency and interest risks by
companies, insurers and pension funds. The welfare effect of that is unclear.
The FTT will likely raise significant revenues, in spite of the fact that the tax base is highly elastic. In the short
term, the incidence of the tax will be chiefly on the current holders of securities. Ultimately, the tax will be
borne in part by end users, and we estimate the likely effects on economic growth. When compared to
alternative forms of taxation of the financial sector, the FTT is likely less efficient given the amount of
revenues. In particular, taxes that more directly address existing distortions (such as the current VAT
exemption for banks, and the bias towards debt financing) provide more efficient alternatives.
4
1 The financial transaction tax
Recently, the European Commission has launched the idea of a financial transaction tax (FTT). The proposed
tax is to have a broad base, including most financial transactions (equities, bonds, derivatives), both market
traded and over-the-counter. In addition, the Commission has performed an impact assessment of such a
tax. The textbox below describes key features of the proposal and the Commission’s impact assessment in
more detail. In this document we discuss the economic arguments in favour and against such a tax and
provide an assessment of its impact for the Netherlands.
The idea of taxing financial transactions has a long history. In 1972 Tobin proposed to introduce a tax on
currency transactions to reduce volatility.1 Before that, John Maynard Keynes proposed a transaction tax on
equity trades to discourage speculation. Both argued that short-term trades were more likely to destabilize
financial markets than long-term trades. Milton Friedman challenged this view by arguing that speculation
cannot be destabilizing in general, because in that case speculators would be losing money.
The debate between proponents and opponents has continued since then and gravitates around a number of
arguments in favour and against a financial transaction tax. Proponents claim that excessive trading
facilitates long-term deviations of prices from fundamentals (‘bubbles’) as well as short-term deviations from
fundamentals (‘excessive volatility’). Bubbles are costly because they lead to a misallocation of capital and
increase the probability of a financial crisis as they collapse at some point in time. Excess volatility is costly to
society, because it raises firms’ cost of investment and increases the probability of a financial crisis. A
financial transaction tax has been claimed to reduce excess volatility and the probability of bubbles.2 An
additional point is that the financial sector is under-taxed and that a financial transaction tax is simply an
efficient way to raise taxes.
Opponents of an FTT usually resort to the following arguments. As an FTT raises transaction costs, it will
decrease market efficiency: prices will be less informative, trading volumes will drop, and liquidity will
decrease. As a result, it will increase the funding costs for firms and reduce the returns to investment for, e.g.,
consumers and pension funds. Also, the tax will differentially affect instruments with long and short
maturities or financial instruments that comprise various securities. This will distort investment portfolios.
Another point made by opponents is that in the absence of internationally coordinated action significant
effort would be spent on evading the tax. Finally, an argument against an FTT tax is that superior instruments
are available to attain the stated goals of such a tax.
1 A second goal was to enhance the effectiveness of macroeconomic policy. 2 A host of related arguments exist. An FTT will lead to a smaller banking sector, less destabilizing speculative trading, reduce wasteful arbitrage, and result in prices better reflecting underlying value.
The Commission considers various scenarios differing in the rate of relocation and evasion, the
elasticity, and the tax rate. For shares and bonds, the reduction in turnover is set at 10% or 15%, for
derivatives trading at 70% to 90% depending on the scenario considered. Tax rates (round trip)
considered are 0.o1% to 0.2%. According to the Commission, a tax on currency transactions creates
legal issues. Levying a tax on stock and bond transactions in regulated exchanges at a rate of 0.2%
(round trip) and a reduction of turnover of 15% would lead to revenues of around EUR 19 billion. For
derivatives, with a reduction in turnover of 75% and a rate of 0.02% (round trip) would raise about
EUR 38 billion. In general, revenue is subject to considerable uncertainty, and estimates range from
16 billion to 400 billion Euro per year depending on the assumptions.
In addition, the Commission tries to assess the macroeconomic costs of an FTT. It analyses a stylized
transaction tax on securities at 0.1%, where it is assumed that all investment in the economy is
financed with shares and bonds, in a DSGE model with a banking sector. The tax causes long-run
output losses of 0.5 to 1.8% according to the impact analysis. In December 2011 the commission
revised these estimates downwards to 0.2% to 0.3%.
6
Many of these pros and cons are related. From a more fundamental economic point of view, two different
motivations for introducing a financial transaction tax exist. First, it may constitute a Pigouvian tax that
corrects for market failures. Second, it may be an efficient way for the government of raising tax revenue. Of
course, introducing a tax may also be distortive. The question then becomes who will ultimately pay for these
taxes, and what are the social costs. From a more practical point of view, the relevant question is what
revenue an FTT will generate for the Dutch Government. We therefore ask the following questions
1. Will an FTT reduce market failures, and reduce systemic risk? 2. What revenue will an FTT generate for the Dutch government, and what are the costs associated with an
FTT?
We will finally briefly discuss some alternatives to an FTT and compare these with the FTT on these two dimensions.
2 Correcting market failures
A first potential motivation for taxation is that it corrects market failures, by effectively putting a price on
negative externalities. Such a tax would be designed to change market participants’ behaviour to bring
market outcomes more in line with the social optimum. A principal externality brought to the fore by the
financial crisis is that market participants do not fully take into account their contribution to systemic risk.
We first explore whether a tax on transactions may have the positive effect of reducing systemic risk, in
particular by reducing volatility or bubbles in the market. Then we turn our attention to a different market
failure, excessive investment in speculation.
2.1 Systemic Risk
An important argument of proponents of an FTT is that it will reduce systemic risk. Systemic risk refers to the
probability that a shock will hit the financial system as a whole. This may occur because all banks are exposed
to the same risk (a correlated shock), or because a shock hits a subset of banks and then propagates through
the financial system (contagion). Banks have incentives to expose themselves excessively to such risks
because of government guarantees (in the form of implicit bailout guarantees, incorrectly priced deposit
insurance, or subsidization of debt because of tax treatment) or because of the existence of interbank
externalities from risk taking arising through fire sales or information spillovers (Wagner, 2010).
An FTT does not directly focus on these core sources of instability. An FTT does not reduce implicit bailout
guarantees or correct the tax treatment of debt. It does not prevent fire sales or information spillovers.3
Nevertheless, an FTT might reduce the probability of shocks hitting the financial sector, by reducing volatility
or the incidence of asset price bubbles. The effect on volatility has been extensively studied, both empirically
and experimentally. The majority of studies conclude that transaction taxes either increase volatility or have
no effect. Bubbles are therefore potentially the most important aspect of systemic risk an FTT may have
impact on.
3 In the context of Basel III regulators are developing regulation directly aimed at curbing incentives to take excessive risk by increasing regulatory capital, limiting leverage, and reducing maturity mismatch. Also taxes have been proposed that directly target these risks, see section 4.
7
Scheinkman and Xiong (2003) build one of the few models with asset price bubbles. In their model,
overconfident agents pay prices that exceed their own valuation of future dividends because they believe that
in the future another buyer is willing to pay even more. They explicitly study a policy measure raising
transaction costs and conclude: ‘Theoretical results and numerical exercises suggest that a small trading tax may be
effective in reducing speculative trading, but it may not be very effective in reducing price volatility or the size of the bubble.’ On
the other hand, in a review of 72 laboratory experiments on experimental treatments to dampen bubbles in
asset markets, Porter and Smit (2003) conclude: ‘(...) brokerage fees designed to raise transactions costs significantly
reduce the amplitude of bubbles’.
Even though some theoretical and experimental evidence exists that a transaction tax may reduce the size of
bubbles, we should not conclude that this reduces systemic risk. Historically, financial crises are often
associated with collapsing real estate bubbles (Reinhart and Rogoff, 2009). Real estate investment such as
mortgages is illiquid assets with extremely high transaction costs if compared with shares, bonds,
derivatives, or currency instruments. Consequently, real estate is not widely traded and any mispricing in this
market will therefore not likely respond to a transaction tax. Other tools may do better at preventing real
estate bubbles. Banking regulators may for example use capital buffers to reduce excessive lending or set
minimum collateral requirements for mortgages.
Finally, it is likely that an FTT will significantly reduce activities of High-Frequency Traders -- at least those
residing within the geographical scope of the proposed tax. It is, however, not clear that the activities of
these agents have contributed to systemic risk or excessive leverage.
2.2 Speculation
Market transactions are valuable: an actively traded market allows market participants to take or liquidate
positions at low price uncertainty. Moreover, trading allows prices to reflect information on the asset. This
information in turn can guide efficient decision making. However, there may be too much trading. Market
failures may lead firms to invest excessive resources into trading and information acquisition. We consider
two such potential market failures.
First, competition may induce firms to invest in activities that are privately beneficial, but socially wasteful.
Market participants gain by investing in being able to react to market developments more quickly than
competitors. Society, however, gains little when market prices adapt to new information in milliseconds
instead of seconds. Of course, this does not mean such trading is not beneficial at all. It may, however, imply
that there is too much of a good thing.
The argument as made for instance by Stiglitz (1989) and Summers and Summers (1989) is that the short-term
gain of information acquisition and trading comes, mostly, at the expense of other traders. Short-term
trading therefore reduces the value of research by others, or imposes a negative externality on them. This in
turn implies that there is too much investment in short-term information acquisition that is of little social
value.
This argument is most forceful if the social value of information is zero. Information acquisition then only
has a cost and no social benefit. An example is when the acquisition concerns information that will anyway
be publicly revealed soon, but speculators can earn a profit by getting their hands on the information early.
8
Information acquisition is then pure rent seeking. As Summers and Summers note, “It is hard to believe that
investments made with a horizon of hours reveal much socially beneficial information to the market place.”
Imposing a transaction tax may efficiently reduce such efforts.4
But even when such information acquisition is in itself socially beneficial (e.g., long-term fundamental
information on the security), duplication of collection efforts need not be efficient. A tax on transactions can
then efficiently reduce the incentives to invest in those efforts.
A second potential market failure might be that financial markets may facilitate free riding on costly
information producing activities by others. If markets quickly disseminate information that financial
intermediaries have obtained at a cost, the potential benefits from such efforts are reduced. A well-known
result by Grossman and Stiglitz (1980) is that in fully efficient markets, prices fully reveal all available
information. In such markets, agents cannot benefit from private information, and therefore have no
incentives to spend any effort on its acquisition. The reason is that the willingness of one agent to buy at a
price p reveals to other traders that this agent has information that the actual value of the good is higher than
p. Other traders then prefer to hold on to the good themselves, and the informed agent cannot benefit from
his information advantage. Hence, there will be too little investment in information acquisition.
Clearly, the combined effect of both failures is ambiguous. How does a transaction tax affect incentives to
invest in information acquisition and the possibilities to react quickly to such information? To address these
questions, it is essential to understand how gains from information advantages arise. Indeed, in a world
without frictions there will be no trade. A trader with superior information cannot benefit from this
information because his willingness to trade signals his superior knowledge. Other traders will anticipate
this and refuse to trade. This is the well-know no trade theorem (see e.g. Fudenberg and Tirole, 1991, section
14.3.3). To theoretically explain how gains from information, and incentives to acquire information, arise,
Kyle (1985) posited that some uninformed traders buy and sell for exogenous reasons, such as liquidity needs;
these are called liquidity traders.5 The noise that these traders introduce into the price formation process
allows informed traders to make a trading profit under the cover of the liquidity trades. In addition, models
may also explicitly describe the price formation process, for example by including market makers or
arbitrageurs who do not possess any information themselves, but who try to disentangle the informed trades
from the noise and try to capture some of the profits from that information.6
In order to understand the effects of a transaction tax one has to analyse how such a tax alters behaviour of
traders that invest in information acquisition (often termed the speculators), the liquidity traders who
provide the cover under which speculators can earn a return to their investment, and the market makers that
try to capture some of the informed traders’ profits. For example, if liquidity traders are driven out of the
market, the incentives to invest in information would decrease. Dow and Rahi (2000) study a model in which
speculators are taxed. This reduces the amount of trade on information, making prices less informative. The
latter effect is beneficial for speculators: they get higher revenue on their informed trades. Subrahmanyam
(1998) analyses a (two-period) model of information acquisition and trading that includes both long-term
4 See Subrahmanyam (1998) for a theoretical model of such a race to acquire the information early.
5 His model has three types of traders: noise traders, informed traders, and market makers. Private information is gradually incorporated into prices. In the long run prices reflect all private information.
6 Introducing such exogenous motives to trade is essential. The resulting market-microstructure models are known as heterogeneous agent models. Hommes (2006) presents an overview of the literature on such models. The two market failures will of course interact in such a model that describes competition between agents investing in information acquisition while being subject to free riding.
9
and short-term traders. He finds that taxes indeed increase the incentives of agents to acquire long-term
information over short-term information.
Bloomfield, O’Hara and Saar (2009) study the effect of a tax on uninformed arbitrageurs in a laboratory
experiment. These uninformed actors trade with informed traders (speculators) and with liquidity traders
(who need to trade for exogenous reasons). They find that when only the arbitrageurs’ trades are taxed, they
trade less, and lose less money on their trades. The information content of prices remains unchanged.
However, their experiment does not shed light on the incentives of speculators to acquire information, nor
does it take into account the effect of taxes on liquidity traders’ presence in the market.
In conclusion, theoretically there is no unambiguous effect of a financial transaction tax. The tax hits
liquidity traders, arbitrageurs and informed traders. Whether a tax will attenuate market failures in a
particular model depends on the underlying assumptions.
3 Raising revenues
A second motivation for introducing a tax is raising revenues efficiently. In the absence of a corrective
motivation for the taxation, efficiency requires that economic distortions (deadweight loss) are as low as
possible for any given level of revenue collection. In this section we explore the revenues and the evidence on
the elasticity of the tax base for the FTT. Then we analyse who will ultimately bear those taxes, and what effect
the tax will have on economic activity. In section 4 we discuss how the FTT compares to other taxes on
efficiency.
3.1 Revenues
The European Commission proposes to tax financial transactions of parties established in a member state of
the European Union. The proposed tax rates are: 0.01% for derivatives and 0.1% for other transactions
(for each taxable party to the transaction). The effective rate of the FTT on securities can be higher than the
headline rate of 0.1%, due to the cascade effect. The cascade effect arises if a single exchange of a security
requires multiple payments of the tax. For example, if a bank sells a security to a broker or a market maker,
who sells it to a clearing member, who then sells it to a central clearing party, who sells it to a different
clearing member, who sells it to broker, and finally to another bank. The effective rate in such a chain of
transactions may rise up to 1% (0.5% for the vendor, 0.5% for the buyer). However, parties that act on behalf
of another party are exempt from paying the tax in the commission’s proposal.
The introduction of an FTT may result in substitution, migration, reduction of the number of intermediate
parties and a reduction of the number of (final) transactions. Substitution occurs if market actors shift away
from taxed instruments to untaxed instruments and from high taxed to low taxed instruments (for example,
by introducing derivatives that have similar payoffs as equities). Migration occurs if market actors shift their
activities to untaxed locations. A reduction of the number of taxable intermediate parties may lower the
effective tariff. The number of taxable intermediate parties can be reduced by switching towards over the
counter trade, by relocating financial institutions outside the EU and by creating integrated financial
institutions. The number of transactions will decrease, as the tax reduces the (expected) profitability of
10
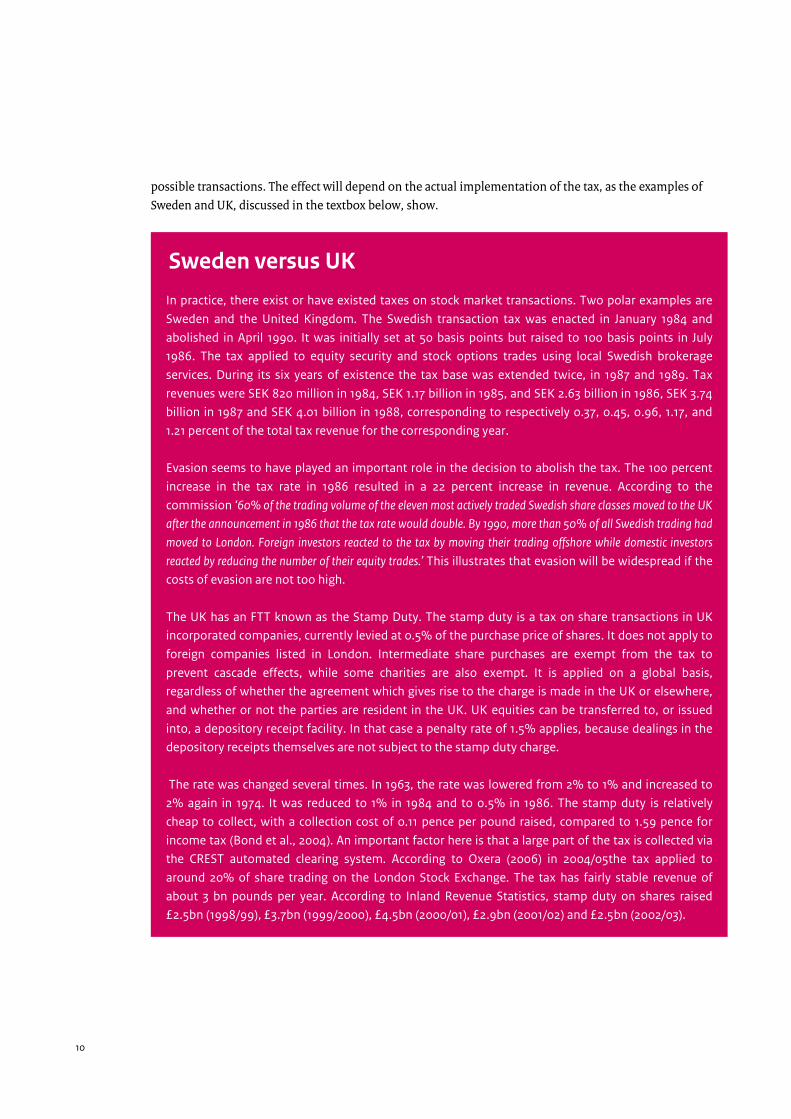
possible transactions. The effect will depend on the actual implementation of the tax, as the examples of
Sweden and UK, discussed in the textbox below, show.
Sweden versus UK
In practice, there exist or have existed taxes on stock market transactions. Two polar examples are
Sweden and the United Kingdom. The Swedish transaction tax was enacted in January 1984 and
abolished in April 1990. It was initially set at 50 basis points but raised to 100 basis points in July
1986. The tax applied to equity security and stock options trades using local Swedish brokerage
services. During its six years of existence the tax base was extended twice, in 1987 and 1989. Tax
revenues were SEK 820 million in 1984, SEK 1.17 billion in 1985, and SEK 2.63 billion in 1986, SEK 3.74
billion in 1987 and SEK 4.01 billion in 1988, corresponding to respectively 0.37, 0.45, 0.96, 1.17, and
1.21 percent of the total tax revenue for the corresponding year.
Evasion seems to have played an important role in the decision to abolish the tax. The 100 percent
increase in the tax rate in 1986 resulted in a 22 percent increase in revenue. According to the
commission ‘60% of the trading volume of the eleven most actively traded Swedish share classes moved to the UK
after the announcement in 1986 that the tax rate would double. By 1990, more than 50% of all Swedish trading had
moved to London. Foreign investors reacted to the tax by moving their trading offshore while domestic investors
reacted by reducing the number of their equity trades.’ This illustrates that evasion will be widespread if the
costs of evasion are not too high.
The UK has an FTT known as the Stamp Duty. The stamp duty is a tax on share transactions in UK
incorporated companies, currently levied at 0.5% of the purchase price of shares. It does not apply to
foreign companies listed in London. Intermediate share purchases are exempt from the tax to
prevent cascade effects, while some charities are also exempt. It is applied on a global basis,
regardless of whether the agreement which gives rise to the charge is made in the UK or elsewhere,
and whether or not the parties are resident in the UK. UK equities can be transferred to, or issued
into, a depository receipt facility. In that case a penalty rate of 1.5% applies, because dealings in the
depository receipts themselves are not subject to the stamp duty charge.
The rate was changed several times. In 1963, the rate was lowered from 2% to 1% and increased to
2% again in 1974. It was reduced to 1% in 1984 and to 0.5% in 1986. The stamp duty is relatively
cheap to collect, with a collection cost of 0.11 pence per pound raised, compared to 1.59 pence for
income tax (Bond et al., 2004). An important factor here is that a large part of the tax is collected via
the CREST automated clearing system. According to Oxera (2006) in 2004/05the tax applied to
around 20% of share trading on the London Stock Exchange. The tax has fairly stable revenue of
about 3 bn pounds per year. According to Inland Revenue Statistics, stamp duty on shares raised
The impact of the proposed FTT on transaction costs
The elasticity of trading volumes to transaction costs ranges broadly between -0.4 and -2.6, depending on the
market studied (Matheson, 2011). In their survey McCulloch and Pacillo (2011) find a median estimate for the
elasticity of equity volume with respect to transaction costs of -0.8. The average transaction costs for trades in
corporate equities are around 0.25% (Matheson, 2011), although a bid-ask spread may result in higher total
costs. The proposed tariff of 0.1% (on vendor and buyer) increases transaction costs for equities by around
40%. The transaction costs for futures on the Dutch AEX index are 0.025% (15 euro at an underlying notional
value of around 60,000 euro). The proposed tariff of 0.1% increases transaction costs for futures by around
40% as well. The European Commission assumes that due to a decline in the number of transactions and to
evasion turnover in securities and bonds declines by 15% and in derivatives by 75%. These estimates
correspond to an elasticity of transaction volume to transaction costs of -0.4 for equities and -2 for
derivatives.
Revenues from FTT in the Netherlands
The uncertainty with respect to the revenues of an FTT is relatively large, as the estimates of the price
elasticity of transactions in the literature differ widely. The European Commission presents different
estimates for the revenues, varying from 10 to 400 bn Euro. The most recent estimate of the revenues is 57 bn
Euro, which corresponds to roughly 0.45% of GDP of the EU.
Transactions on exchanges in Europe are extremely concentrated in the UK and Germany. Around 90% of all
spot and derivatives transactions on exchanges in the EU are carried out in these two countries. The
transactions in these two countries are partially done by residents of other countries.
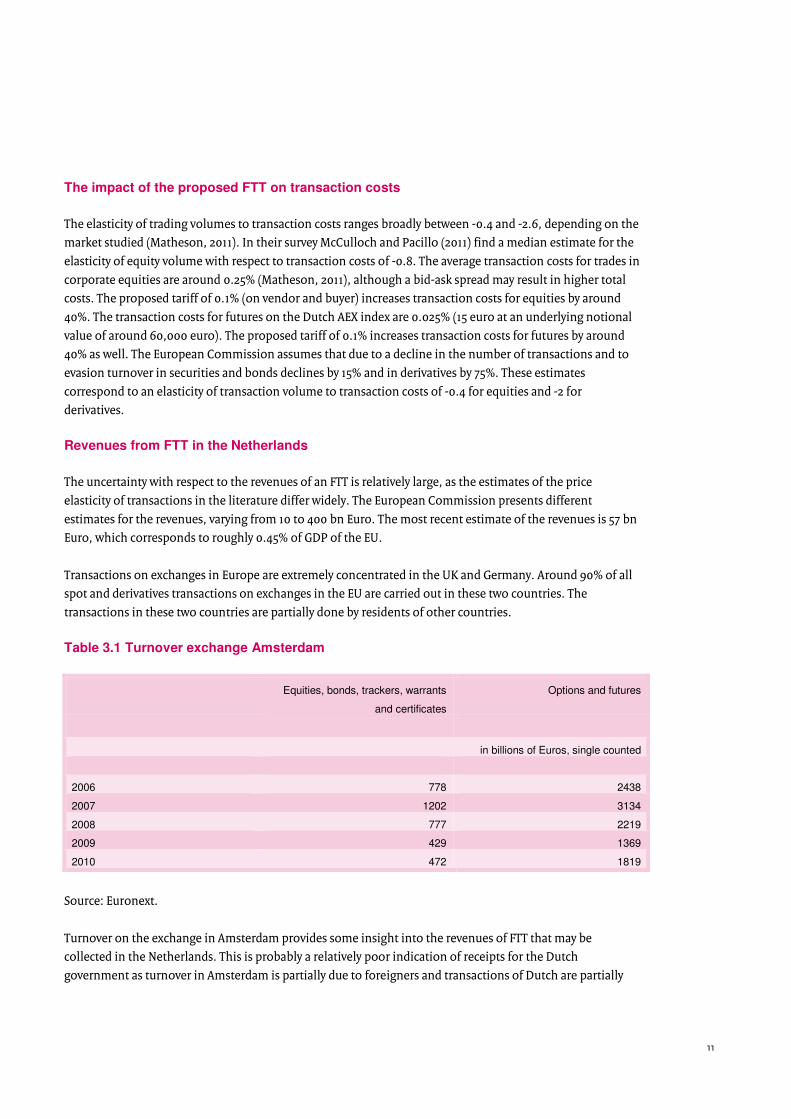
Table 3.1 Turnover exchange Amsterdam
Equities, bonds, trackers, warrants
and certificates
Options and futures
in billions of Euros, single counted
2006 778 2438
2007 1202 3134
2008 777 2219
2009 429 1369
2010 472 1819
Source: Euronext.
Turnover on the exchange in Amsterdam provides some insight into the revenues of FTT that may be
collected in the Netherlands. This is probably a relatively poor indication of receipts for the Dutch
government as turnover in Amsterdam is partially due to foreigners and transactions of Dutch are partially
12
done abroad.7 Turnover in the secondary market for equities, bonds, trackers, warrants and certificates at
Euronext in Amsterdam increased from around 800 bn Euro in 2006 to 1200 bn Euro in 2007 and decreased to
below 500 bn Euro in 2009 and 2010 (table 3.1). In these figures all transactions between sellers and buyers
are single counted. The underlying notional value of futures and options traded at NYSE Liffe Amsterdam
increased from around 2400 bn Euro in 2006 to 3100 Euro in 2007 and decreased to around 1800 bn Euro in
2010.
Figures for OTC trade of derivatives and of foreign exchange swaps and outright forward for the Netherlands
are difficult to obtain. One might assume that the turnover in OTC and foreign exchange is around 5/4 times
the turnover in exchange traded derivatives, as in the EU. Then the turnover in OTC and foreign exchange
would be around 2250 bn Euro. The revenues are computed using the assumptions above (table 3.2).
Including behavioural effects the revenues of the proposed FTT in Amsterdam are around 1.1 up to 2.2 bn
Euro or 0.2 up to 0.4% of GDP. 8
Table 3.2 Revenues of FTT collected in the Netherlands
Pre tax volume Effective tax rate
(vendor + buyer)
Change in turnover Revenues
billions of Euros In % In % billions of Euros
Equities, bonds 500 0.2 to 0.4 -15 0.9 to 1.8
Exchange traded derivatives 1800 0.02 to 0.04 -75 0.1 to 0.2
OTC, foreign exchange 2250 0.02 to 0.04 -75 0.1 to 0.2
Total 1.1 to 2.2
Source: Computations CPB.
An alternative approach is to assume that the Dutch part in the total of the EU is around 6.5%, in line with the
share of the financial sector (table 3.3). Under these assumptions the receipts for the Dutch government are
somewhat higher, around 0.6% of GDP. If the effective tariff (vendor + buyer) is not 0.2%, but 0.4% due to
cascade effects, the receipts double to 1.2% of GDP. Note that these estimates do not include negative side
effects, such as lower corporate taxes and lower income taxes due to lower GDP, lower pensions and lower
profitability of the financial sector. If not all EU-countries implement the FTT, the number of available
alternatives will be higher and the receipts for the Dutch government will be lower.
7 Investments of the large Dutch pension funds are largely done abroad. 8 For comparison, profits in the financial sector in the Netherlands in 2010 equaled roughly 18.7 billion euro for the banks and minus 41 million losses incurred by insurers (source: DNB Statistics). Large pension funds in the Netherlands estimate that they will pay around 3 bn euro per year, largely abroad. We cannot verify this number.
13
Table 3.3 Relative size of financial sector assets in EU
Banks Insurers Pension funds Percentage of
total EU
financial
sector assets9
Percentage of
GDP10
Belgium 2.20% 0.46% 0.03% 2.69% 3.01%
Denmark 1.09% 0.36% 0.13% 1.57% 1.98%
Germany 16.13% 2.26% 0.00% 18.39% 20.97%
Estonia 0.04% 0.00% 0.00% 0.04% 0.12%
Ireland 2.97% 0.36% 0.15% 3.48% 1.42%
Greece 1.00% 0.03% 0.00% 1.03% 2.05%
Spain 6.74% 0.51% 0.17% 7.42% 9.26%
France 15.21% 3.16% 0.00% 18.37% 16.69%
Italy 7.36% 1.11% 0.05% 8.51% 13.49%
Cyprus 0.26% 0.02% 0.00% 0.28% 0.15%
Luxemburg 2.05% 0.24% 0.00% 2.29% 0.33%
Malta 0.10% 0.00% 0.00% 0.10% 0.05%
Netherlands 4.39% 0.72% 1.44% 6.55% 5.04%
Austria 1.90% 0.19% 0.03% 2.12% 2.43%
Poland 0.49% 0.06% 0.08% 0.63% 2.74%
Portugal 1.09% 0.11% 0.04% 1.24% 1.49%
Slovenia 0.10% 0.01% 0.00% 0.12% 0.31%
Slovakia 0.11% 0.01% 0.01% 0.13% 0.56%
Finland 0.93% 0.09% 0.01% 1.04% 1.53%
Sweden 1.48% 0.49% 0.05% 2.02% 2.57%
United Kingdom 16.36% 3.17% 2.46% 21.99% 13.82%
Source: ECB, OECD, Bank of England, Eurostat.
3.2 Incidence and macro-economic cost
In the previous paragraph, we argued that the contribution of the Dutch financial sector to the revenues
generated by the FTT would correspond roughly from 0.2% to 1.2% of Dutch GDP. These costs will have to be
borne by someone. Although an FTT is levied at parties performing financial transactions, the incidence of
the tax may lie on other parties. In the short term, an FTT will have an immediate effect on the wealth of
those holding financial titles, such as stocks and bonds. The market price of a particular stock will adjust as
potential buyers of the stock will take into account the higher transaction price when buying or selling. Thus,
prices will drop. We discuss the empirical evidence in the textbox below. The burden of this drop will of
9 Total assets of banks, insurers and pension funds in countries included equal 51,488 million euro.
10 Total GDP of countries included equals 11,321 million euro.
14
course fall most heavily on those holding the largest fraction of such investments, pension funds and
wealthy individuals.
In the longer term, prices and wages will adjust to the new tax. As a result, costs will be borne by the financial
sector itself (in the form of lower rents), the consumer (in the form of higher prices for financial services), or
firms (in the form of higher costs of capital) and governments (higher interest rate on government bonds).
For example, companies may pass on transaction taxes (partially) into higher output prices or lower wages
and pension funds into lower pensions.
The incidence of FTT may be affected by the scale of the tax: whether it is levied worldwide or only in a small
open economy. Capital taxes introduced in a small open encourage capital to flee abroad. The outflow of
capital reduces the marginal product of labour and hence wages. Therefore, Diamond and Mirrlees (1971)
conclude that in a small open economy labour bears the entire burden of capital taxes. Of course, Europe
does not constitute a small, open economy. This implies that capital will bear some of the burden as well.
To assess the macro-economic costs of a financial transaction tax, one would ideally draw on studies that
estimate these effects directly. Such studies do not exist. We therefore discuss two approaches. First, we can
get some estimate of the effect of an FTT on firms’ cost of capital. Based on this, we can then translate this
into an effect on GDP. Second, we discuss the empirical literature that deals with the effects on financial
market characteristics such as trading volume, prices, and volatility. We then study how changes in these
variables impact macroeconomic variables such as GDP, investments or industrial production.
To the extent that the tax raises firms’ cost of capital, it will reduce investment levels. To our knowledge, no
studies exist that empirically estimate the effect of a tax on firms’ cost of capital. Theoretically, this would
require a general equilibrium model that endogenizes the effect of a tax on financial markets, financial
intermediaries, firms, and consumers.
To estimate the effect of a transaction tax on firms’ cost of capital, Matheson (2011) treats an FTT as a tax on
dividends and assumes that firms decide to allocate investment to optimize after tax dividend payments. As a
result, the discount rate increases proportional to the tax and inversely proportional to the average holding
period. In 2009, the average holding period for stocks in the Standard and Poor’s 500 stock index was 0.4
years, or about 3.5 months. According to Matheson, a 10 basis point STT would increase the cost of capital for
a firm fully funded by equity by about 25 basis points. The increase will be lower for debt funding, because
the holding period is longer. In addition, a substantial fraction of the equity and debt that funds firms is not
traded.11 We estimate the effect on the cost of capital to be between 0.15 and 0.30 percentage points.
12
11 To obtain an estimate of how abolishment of the UK stamp duty will affect firms’ investment costs, Oxera (2007) refers to a study by Domowitz and Steil that estimates the elasticity of the post-tax cost of equity to transaction costs to be 0.14-0.17. Based on this, they estimate that abolition of the stamp duty would reduce the cost of capital for listed firms by 50 to 60 basis points. This is an overestimate as it ignores substitution effects. Also, the effect for non-listed firms is much smaller as their equity is generally not traded.
12 We assumed that Turnover time debt (Vd) equals 1 year, turnover time for equity (Ve) equals three months, Debt / total assets (L) equals 0.5, and the Percentage financed through markets (M) equals 0.3. The effect on total cost of capital is given by M*FTT*N*[(1-L)/Vd+L/Ve].
15
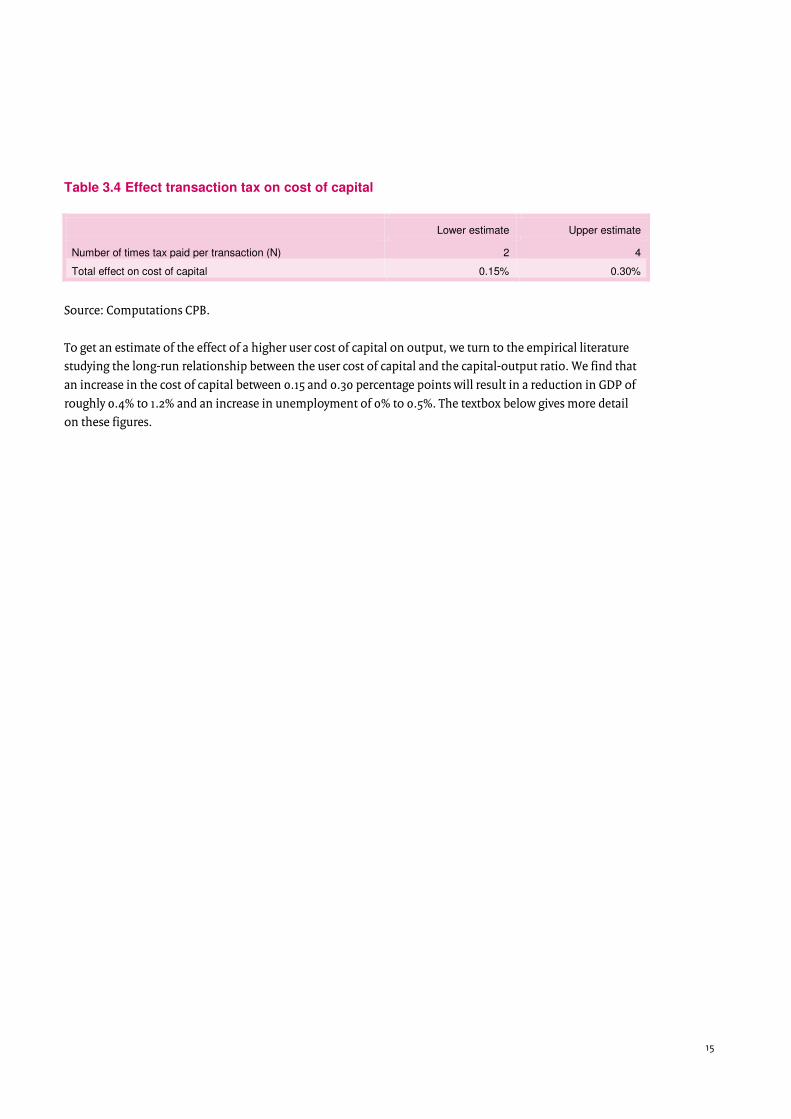
Table 3.4 Effect transaction tax on cost of capital
Lower estimate Upper estimate
Number of times tax paid per transaction (N) 2 4
Total effect on cost of capital 0.15% 0.30%
Source: Computations CPB.
To get an estimate of the effect of a higher user cost of capital on output, we turn to the empirical literature
studying the long-run relationship between the user cost of capital and the capital-output ratio. We find that
an increase in the cost of capital between 0.15 and 0.30 percentage points will result in a reduction in GDP of
roughly 0.4% to 1.2% and an increase in unemployment of 0% to 0.5%. The textbox below gives more detail
on these figures.
16
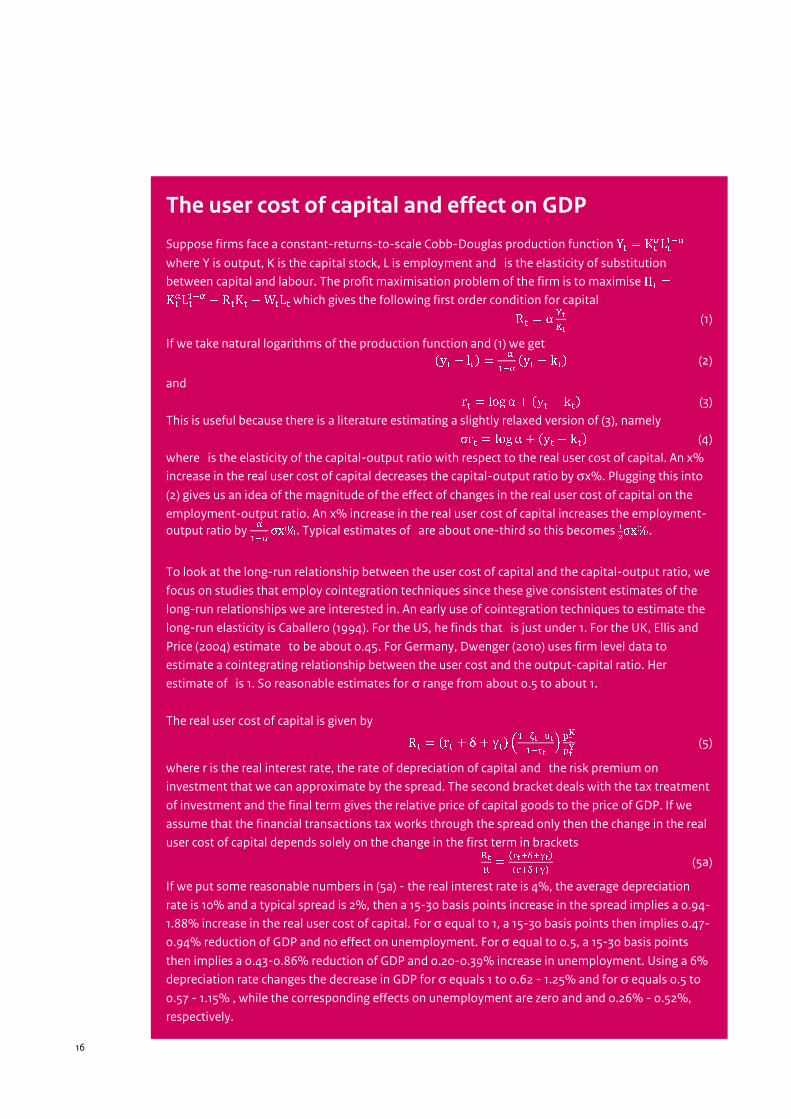
The user cost of capital and effect on GDP
Suppose firms face a constant-returns-to-scale Cobb-Douglas production function Y � KL�� where Y is output, K is the capital stock, L is employment and M is the elasticity of substitution
between capital and labour. The profit maximisation problem of the firm is to maximise Π �KL�� � RK �WL which gives the following first order condition for capital R � α ��� (1)
If we take natural logarithms of the production function and (1) we get #y � l& � ��� #y � k& (2)
and r � logα � #y � k& (3)
This is useful because there is a literature estimating a slightly relaxed version of (3), namely σr � logα� #y � k& (4)
where M is the elasticity of the capital-output ratio with respect to the real user cost of capital. An x%
increase in the real user cost of capital decreases the capital-output ratio by σx%. Plugging this into
(2) gives us an idea of the magnitude of the effect of changes in the real user cost of capital on the
employment-output ratio. An x% increase in the real user cost of capital increases the employment-
output ratio by �� σx%. Typical estimates of M are about one-third so this becomes ��σx%.
To look at the long-run relationship between the user cost of capital and the capital-output ratio, we
focus on studies that employ cointegration techniques since these give consistent estimates of the
long-run relationships we are interested in. An early use of cointegration techniques to estimate the
long-run elasticity is Caballero (1994). For the US, he finds that M is just under 1. For the UK, Ellis and
Price (2004) estimate M to be about 0.45. For Germany, Dwenger (2010) uses firm level data to
estimate a cointegrating relationship between the user cost and the output-capital ratio. Her
estimate of M is 1. So reasonable estimates for σ range from about 0.5 to about 1.
The real user cost of capital is given by R � #r � δ � γ& 0����������� 1 ������ (5)
where r is the real interest rate, the rate of depreciation of capital and M the risk premium on
investment that we can approximate by the spread. The second bracket deals with the tax treatment
of investment and the final term gives the relative price of capital goods to the price of GDP. If we
assume that the financial transactions tax works through the spread only then the change in the real
user cost of capital depends solely on the change in the first term in brackets ��� � ���������������� (5a)
If we put some reasonable numbers in (5a) - the real interest rate is 4%, the average depreciation
rate is 10% and a typical spread is 2%, then a 15-30 basis points increase in the spread implies a 0.94-
1.88% increase in the real user cost of capital. For σ equal to 1, a 15-30 basis points then implies 0.47-
0.94% reduction of GDP and no effect on unemployment. For σ equal to 0.5, a 15-30 basis points
then implies a 0.43-0.86% reduction of GDP and 0.20-0.39% increase in unemployment. Using a 6%
depreciation rate changes the decrease in GDP for σ equals 1 to 0.62 - 1.25% and for σ equals 0.5 to
0.57 - 1.15% , while the corresponding effects on unemployment are zero and and 0.26% - 0.52%,
respectively.
17
An alternative approach would be to study the effect of interest spreads of corporate bond yields, which
measure the difference between the interest rates paid by firms and government bonds, on economic
growth. Introducing a financial transactions tax will raise this spread. The results stem from time series
models either of the distributed lag type or from vector auto regressions. Gilchrist, Sim and Zakrajsek (2010)
find that of a 0.25% higher spread decreases GDP after 20 years with roughly 0.2%, implying that a 0.15%-0.3%
increase in the cost of capital results in a 0.1% - 0.25% decrease of GDP.13 This is considerably below the
results from the literature on the user cost of capital and the capital-output ratio.14
A third approach would be to study how changes in trading volume, prices, and volatility impact
macroeconomic variables such as GDP, investments or industrial production. The empirical literature
discussed in the textbox below clearly shows that trading volumes will drop due to the introduction of an
FTT. In their survey of the literature, McCulloch and Pacillo (2011) conclude that they are unaware of evidence
that shows a causal link between the volume of trade and overall economic performance. Nevertheless,
trading volume might influence market liquidity. Næs, Skjeltorp and Ødegaard (2011) investigate the
relationship between trading costs, market liquidity and business cycles. In particular, they focus on the
impact of transaction costs and trading volume on macro-economic variables such as GDP growth. However,
they use specific indices to measure trading costs and volumes what prevents to directly use their results to
calculate an effect of a financial transaction tax. Using stock market data for Norway and the U.S., their
findings do indicate that transaction costs on stock markets do affect GDP growth significantly negative. A
reduction in trading volume has the same qualitative effect. Acharya and Pedersen (2005) are concerned with
the impact of market liquidity on portfolio asset returns. They use a comparable indicator based on trading
volume as Næs, Skjeltorp and Ødegaard (2011). Their finding is that illiquidity causes contemporaneous
portfolio returns to decline, while increasing expected future returns.
13 Gilchrist, Yankov and Zakrajsek (2010) report an accumulated effect of -2.4 percentage points for industrial production growth.
14 Based on table 5.2 in CPB (2010), a 1% increase in long-term interest rate results in 3.3% lower GDP and 1.5% higher unemployment. A 0.15% to 0.30% rise in costs of capital then results in a 0.5% to 1% lower GDP and 0.2% to 0.5% higher unemployment.
18
Transaction taxes might also influence volatility on financial markets. Both from a theoretical and an
empirical point of view, there is ambiguity on the direction of effects. Volatility can in principle increase or
decline due to the introduction of a financial transaction tax. Assuming that the introduction of a financial
transaction tax leads to an increase in the market’s volatility, we can ask about the consequences of this for
the macro economy. To answer this question, we have to look at the empirical literature focusing on the
relationship between financial markets and real economic activity. Gilchrist, Sim and Zakrajsek (2010) are the
only ones to elaborate on this issue in a model that allows for such a question. In particular, their finding is
that a one standard deviation increase in volatility costs about 0.2 percentage points of GDP growth after
about 3 quarters. Volatility also negatively affects credit conditions in the economy. Credit conditions are
approximated in their analysis by corporate bond spreads, i.e. the premium over a government bond that an
issuing corporation has to pay on the bond market. Recently this measure has gained increasing attention by
economists as a good predictor for economic activity due to its influence on firms’ investment. Investments
in turn shape economic activity in the future. Gilchrist, Sim and Zakrajsek (2010) find that corporate bond
spreads react with an increase of up to 8 basis points to a one standard deviation shock in volatility and
decrease investment growth by about 0.8 %-points. However, the latter is measured with great uncertainty.
Also concerned with real economic effects of volatility on stock markets is Guo (2002). He estimates the effect
Effect on prices, trading volume and volatility
Empirical studies show that an FTT will decrease share prices. Umlauf (1993) finds that a one percent
tax on equity trades reduced prices on the Stockholm exchange by about 5.3 percent. Based on
changes in an FTT in Hong Kong, Japan, Korea and Taiwan, Hu (1998) finds that a 23 percent rise in
transaction costs leads to a one percent decline in daily market returns. Bond et al. (2004) find that
the 50 percent cut in UK stamp duty in 1986 increased share prices.
Empirical evidence also shows that an FTT will negatively affect trading volume. Using stock market
data, Baltagi et al. (2006) finds an elasticity of –0.5 while Hu (1998) finds no effect. For futures
markets, Chou and Wang (2006) find an elasticity of –1. Some evidence can be found on the effects of
transaction costs measured by the bid-ask spread on trading volume. Wang et al. (1997), Wang and
Yau (2000) and Chou and Wang (2006) analyze futures markets and find elasticities in the range of –
2.6 to –0.6. Schmidt (2007) estimates an elasticity of –0.4 on foreign exchange markets. Baltagi et al.
(2006), Ericsson and Lindgreen (1992), Jackson and O'Donnell (1985) and Lindgren and Westland
(1990) look at total transaction costs and find short run elasticities in the range of –1.5 to –0.5.
A substantive empirical literature studies whether increasing transaction costs reduce volatility.
Although some studies find a negative effect, a majority of studies finds that a tax either increases
volatility or has no effect. While Baltagi et al. (2006) do not find any effects, Green et al. (2000) find
evidence for increasing volatility in the UK stock market. Hau (2006) comes to the same conclusion
for France. McCulloch and Pacillo (2011) present an overview of several theoretical papers that study
the relation between transaction costs and volatility. They conclude that ‘Most, but not all, studies
conclude that a small Tobin tax would reduce volatility, but many models also suggest that great care should be
taken in choosing the size of the tax since, if it is too large, the reductions in market trading and liquidity could result
in an increase rather than a reduction in volatility.’ As the effect of an FTT on volatility is ambiguous, both
empirically as well as theoretically, we should not expect a transaction tax to reduce volatility.
19
of the stock excess return variance on GDP growth. For the U.S., he finds an estimate for the coefficient of
this variance of -.95 using quarterly data from 1947 to 2000.
4 Alternatives for an FTT
The two principal motivations for taxing the financial sector are i) correcting market failures, and ii) raising a
fair share of tax revenues from the financial sector. As to the first point, taxes can be used to put a price on
externalities, so that banks internalize those harmful effects on others (or on the financial system). We
argued that it is doubtful whether the FTT will be very effective in correcting externalities. Taxes will be more
effective at correcting market failures if they are better aimed at reducing the creation of systemic risks. One
example of such a targeted tax is the proposal of taxing maturity mismatches in the funding structure of
banks, which expose banks to liquidity risks (Perotti and Suarez, 2009).
The second motivation is raising tax revenues from banking activities. Taxation usually distorts economic
decisions, which in the absence of externalities is not desirable. The challenge is then to design taxes that
raise revenues in the least distortive way. Here, FTT seems to compare unfavourably to other taxes as it is
levied on a part of the inputs in the financial production process. As such it distorts prices and hence decision
making within the financial sector. One other motivation for introducing a distortive taxation is if the new
taxes actually correct existing distortions arising from existing taxation. Two such existing distortions with
regard to the current taxation of financial system come to mind (Keen, 2011).
The first existing distortion is the banks’ exemption from Value Added Tax. No VAT is levied on services from
banks. This makes VAT non-neutral with regard to the various inputs (financial and non-financial) in other
firms’ production processes, and this non-neutrality distorts efficiency. As banks will include VAT paid on the
inputs they use in the prices (fees or interest margins) they charge to their customers, business customers
(who can deduct VAT paid, but receive no tax credits for their purchases of financial services) are overcharged
for financial services compared to other inputs (and therefore tend to underuse them), while end-users will
be undercharged (not paying the taxes on the value added by the financial sector itself). Keen (2011) suggests
that the second effect dominates the first, so that the non-neutrality of VAT might cause the financial services
sector to become too large.
To remedy this distortion, one option may be to abolish the current VAT-exemption at least on fee-based
financial services. Another option that has been considered is the so-called Financial Activities Tax, which is
aimed at taxing rents from financial sector activities (IMF, 2010). The least distortive tax would only tax the
rents that flow to the owners and managers of financial institutions (i.e. those payments over and above the
‘normal’ remuneration for capital and labour). A more comprehensive FAT would tax the entire value
added.15
Huizinga et al. (2011) show that in practice, taxes on corporate income in the financial sector are not that
ideal, as they distort prices (i.e. interest margins). Using country differences on double taxation in
multinational banks, they show that i) a large fraction (85%) of such taxes are reflected in prices, and ii) banks
15 In the Netherlands, a banking ley is going to be introduced. This is a tax on assets, minus deposits and regulatory capital. Short-term debt will be subject to a higher tax (0.022 percent) than long-term debt (0.011 percent). The tax will also increase if one or more of the CEOs exceed certain limits on bonus payments.
20
adjust their behaviour (activities in different countries) to a large extent in response to such tax differences.
Huizinga et al. claim that also FAT may suffer from such pass-through rates, and recommend that any such
taxes are harmonized across the EU, and across different parts of the financial sector.
The second existing distortion arises from the different tax treatment of corporate sources of finance, where
debt financing is favoured over equity. As has been emphasized in e.g. de Mooij (2011) and de Mooij and Keen
(2011), if the severity of the crisis in part is the result of excessive reliance on debt (leverage), reconsideration
of the tax deductibility of interest payments may be called for. De Mooij (2011) reviews existing studies on the
effect of taxation on debt financing of corporations, and finds that this effect is sizable and has increased
over time. While most empirical studies focus on non-financial corporations, de Mooij and Keen (2011)
analyse the effects of taxation on banks’ balance sheets. They find that, in spite of regulatory restrictions on
bank leverage, taxation has roughly the same impact on banks’ debt to asset ratios as it has on those of non-
financials. They conclude that tackling corporate income taxation’s bias towards debt may matter for
decreasing bank leverage.
5 Conclusions
Introduction of a financial transaction tax might be motivated on the grounds that it corrects a market
failure, and that it succeeds in raising significant revenues from the financial sector in an efficient way. We
find little evidence for corrective properties of the FTT. There are undoubtedly important market failures in
the financial sector, such as those relating to systemic risks and to excessive leverage in the financial industry.
The FTT however is not targeted on these market failures, and other tax or regulatory measures appear to
provide better alternatives in dealing with these externalities. Raising transaction costs (by taxing
transactions) does not appear to reduce market volatility, and its impact on the incidence of asset price
bubbles is unclear. The FTT reduces short-term trading, but also insurance against currency and interest risks.
The welfare effects of that are ambiguous.
The FTT introduced in the EU will likely raise significant revenues, even though trade in some products will
markedly decline under the FTT, either moving to other markets outside of the geographic scope of the FTT,
or disappearing altogether. In the short term, the incidence of the tax will fall in particular on those holding
securities. In the longer run, the tax will be borne partly by customers’ of the financial sector, and this will
impact negatively on economic growth.
Alternative taxes on the financial sector may be more efficient in raising revenues, involving lower
deadweight losses, in particular those alternatives that correct existing distortions in financial sector taxation
(such as the current VAT exemption for the financial industry, and the bias towards debt financing in the
corporate income tax).
21
References
Acharya, V.V. and L.H. Pedersen, 2005, Asset Pricing with Liquidity Risk, Journal of Financial Economics, Vol. 77,
pp. 375-410.
Baltagi, B, D. Li, and Q. Li, 2006, Transaction Tax and Stock Market Behavior: Evidence from an Emerging
Market, Empirical Economics, Vol. 31, pp. 393–408.
Bloomfield, R., M. O'Hara, M. and G. Saar, 2009, How noise trading affects markets: an experimental
analysis, Review of Financial Studies, Vol. 22, pp. 2275-2302.
Bond, S., M. Hawkins and A. Klemm, 2005, Stamp Duty on Shares and Its Effect on Share Prices, IFS Working
Paper WP04/11, London: Institute for Fiscal Studies.
Caballero, R.J. (1994), Small Sample Bias and Adjustment Costs, Review of Economics and Statistics, 76(1), 52-
58.
Chou, R., and G. Wang, 2006, Transaction Tax and Market Quality of the Taiwan Stock Index Futures, Journal of
Futures Markets, Vol. 26 (12), pp. 1195–1216.
CPB, 2010, SAFFIER II: 1 model voor de Nederlandse economie, in 2 hoedanigheden, voor 3 toepassingen,
CPB Document 217.
De Mooij, R.A., 2011, The tax elasticity of corporate debt: A synthesis of size and variations, IMF Working
paper WP/11/95.
De Mooij, R.A. and M. Keen, 2011, Debt, taxes and banks, mimeo.
Diamond, P. and J. Mirrlees, 1971, Optimal Taxation and Public Production 1: Production Efficiency, American
Economic Review, Vol. 61 (3), pp. 8–27.
Dow, J. and R. Rahi, 2000, Should Speculators Be Taxed?, Journal of Business, Vol. 73 (1), pp. 89-107.
Dwenger, N. (2010), User cost elasticity of capital revisited, Working paper.
Ellis, C. and S. Price (2004), UK Business Investment and the User Cost of Capital, The Manchester School,
vol. 72, 72-93.
Fudenberg, D. and J. Tirole, 1991, Game Theory, MIT Press, Cambridge.
Gilchrist, S., J. Sim and E. Zakrajsek, 2010, Uncertainty, Financial Frictions and Investment, Boston University
and Federal Reserve Board, mimeo.
Gilchrist, S. and E. Zakrajsek, 2008, Linkages between the Financial and the Real Sectors. Federal Reserve
Board, mimeo.
22
Gilchrist, S., V. Yankov and E. Zakrajsek, 2009, Credit Market Shocks and Economic Fluctuations: Evidence
from Corporate Bond and Stock Markets, Journal of Monetary Economics, Vol. 56, pp. 471-493.
Grossman, S.J., and J.E. Stiglitz, 1980, On the Impossibility of Informationally Efficient Markets, American
Economic Review, Vol. 70 (3), pp. 393-408.
Guo, H., 2002, Stock Market Returns, Volatility, and Future Output, The Federal Reserve Bank of St. Louis Review,
Sept/Oct., pp. 75-86.
Hau, H, 2006, The Role of Transaction Costs for Financial Volatility: Evidence from the Paris Bourse, Journal
of the European Economic Association, Vol. 4 (4), pp. 862–890.
Hommes, C., 2006, Heterogeneous Agent Models in Economics and Finance, mimeo, Amsterdam: University
of Amsterdam and Tinbergen Institute.
Hu, S., 1998, The Effects of the Stock Transaction Tax on the Stock Market: Experience from Asian Markets,
Pacific Basin Finance Journal, Vol. 6, pp. 347–364.
Huizinga, H., J. Voget and W. Wagner, 2011, International taxation and cross-border banking, European
Banking Center, Discussion paper, No. 2011-015.
IMF, 2010, Financial Sector Taxation, the IMF’s report to the G-20 and Background Material, Chapter 7.
Jackson, P. and A. O’Donnell, 1985, The Effects of Stamp Duty on Equity Transactions and Prices in the UK
Stock Exchange, Discussion Paper, No. 25, Bank of England.
Keen, M., 2011, Rethinking the taxation of the financial sector, CESifo Economic Studies, 57, 1, 2011.
Kyle, A., 1985, Continuous Auctions and Insider Trading, Econometrica, Vol. 53 (6), pp. 1315–1335.
Lindgren, R. and A. Westland, 1990, Transaction Costs, Trading Volume and Price Volatility on the Stockholm