1 An evaluation of the historical issues associated with achieving non-helicopter V/STOL capability and the search for the flying car B Saeed a and G. B. Gratton Brunel Flight Safety Laboratory School of Engineering and Design Brunel University, Uxbridge, UK This document is produced from the final Microsoft Word file submitted to Aeronautical Journal of the Royal Aeronautical Society, which led to publication of the final paper – the words and pictures are correct therefore, but the formatting is not identical to that in the Journal. The full citation for this paper (no.3470) is: B Saeed & GB Gratton, An evaluation of the historical issues associated with achieving non-helicopter V-STOL capability and the search for the flying car, AeroJ Vol.114 No.1152 pp91-102 (Feb 2010) a Corresponding author
Transcript
1
An evaluation of the historical issues associated
with achieving non-helicopter V/STOL capability and the search for the flying car
B Saeeda and G. B. Gratton Brunel Flight Safety Laboratory School of Engineering and Design Brunel University, Uxbridge, UK This document is produced from the final Microsoft Word file submitted to Aeronautical Journal of the Royal
Aeronautical Society, which led to publication of the final paper – the words and pictures are correct therefore, but
the formatting is not identical to that in the Journal. The full citation for this paper (no.3470) is:
B Saeed & GB Gratton, An evaluation of the historical issues associated with achieving non-helicopter V-STOL
capability and the search for the flying car, AeroJ Vol.114 No.1152 pp91-102 (Feb 2010)
a Corresponding author
2
ABSTRACT Combined Vertical and Short Take-Off and Landing, or ‘V/STOL’ capability has been of great demand and interest in the field of aeronautics since the creation of the aircraft. V/STOL capability is a targeted capability for many projected or prototype future aircraft. Past V/STOL aircraft are reviewed and analysed with regard to their performance parameters. This research has found two embedded categories in this class of aircraft based on their propulsion systems, i.e. jet and non-jet propulsion, and highlights the significant performance differences between them. In light of historical experience the performance of a relatively new class of aircraft, the flying cars, has been evaluated. NOMENCLATURE a Acceleration 2/m s CD drag coefficient CG centre of gravity CL Lift coefficient CLmax maximum lift coefficient CTOL Conventional take-off and landing d Fan diameter (m) g Gravitational acceleration 2/m s
sk Suckdown factor
L Lift (N)
OGEL Lift generated by out of ground effect
fL Jet fountain lift
sL Suckdown lift
m
Mass flow rate AU (kg/s)
NTSB National Transport Safety Board P Engine power (watts) S wing surface area ( 2m )
dS Propeller disk area 2( )m S0 Take-off ground roll (m) STOL short take-off and landing T Total Thrust (N)
dpT Thrust generated by a ducted propellor
reqT
Thrust required for VTOL
TR reversed engine thrust UAV unmanned aerial vehicle V/STOL vertical/short take-off and landing V Cruise velocity (m/s) Vmax maximum cruise velocity Vref approach speed
cv Rate of climb or climb velocity
VTO vertical take-off VTOL vertical take-off and landing W gross weight (kN) ρ air density at sea level 3( 1.225 / )kg m Area ratio between fan and duct exhaust µ dry friction coefficient
p Propulsive efficiency
1 INTRODUCTION
V/STOL refers to Vertical or Short Take-Off and Landing capability, an aircraft that can perform either vertical or short take-off or landing is said to inherit V/STOL capability e.g. BAE Harrier. The term V/STOL is composed of two other VTOL, vertical take-off and landing, and STOL, short take-off and landing. An aircraft with insufficient vertical thrust may attempt a short take-off and vertical landing upon reducing weight from fuel consumption, this class of aircraft is specifically designated by STOVL. V/STOL capability cuts the need for long runways and reduces the time to achieve horizontal flight: conventional jet aircraft land and take-off with speeds of, around, 80 to 120 m/s and may require runways up to 3,500m in length in some cases – this is an expensive infrastructure problem that V/STOL has potential to solve. Interest in V/STOL flight probably arose when early attempts at powered flight tried emulate the behaviour of birds; however, no early man made machine, based heavily on birds ever achieved controlled flight. It was not then recognised that the short and vertical take-off capability of birds is in large measure made possible by their low wing-loading, which is a natural result of their small size. Figure 1 depicts a chart of wing loading and flight speed for a variety of birds and it can be seen that the birds with relatively low wing-loading and forward velocity are actually VTOL capable, such as the hummingbird, blackbird and barn swallow, other birds being either V/STOL or conventional take-off and landing (CTOL) capable. Sir George Cayley, who was the first to recognise the importance of distinguishing lift from thrust and in particular to recognise the fact that for level flight, the required thrust is one or two orders of magnitude less than the required lift(1).
3
Figure 1, Take-off and landing characteristics of birds [data adapted from2,3,4,5].
In order to understand this phenomenon further, consider lift and drag curves for a typical wing section as shown in Figure 2. The lift is always larger in magnitude than the drag at typical flight conditions,
which typically correspond to10 / 15L DC C , and
hence the thrust required to overcome the drag is less than the lift generated. Early vertical flight – in helicopters - was achieved by an aerodynamic, or rotary wing, solution, rather than a pure propulsive solution. The following equation best describes the relationship between the forces acting on an aircraft in level flight.
Thrust Drag Lift Weight
Jet propulsion achieves Vertical Take Off, or VTO by working against an aircraft’s weight due to gravity directly, whereas the rotary wing solution does work initially against drag (profile and induced) and hence benefits from the phenomenon of lift being much larger than drag.
4
Figure 2, Typical NACA wing-section characteristics [taken from (6)].
Regardless of mechanism, the development of V/STOL capability has also inevitably been reliant upon the availability of suitable power plants. In particular, the gas turbine engine, with its high thrust : weight ratio, made possible the eventual development of aircraft with static thrust to gross weight ratios greater than one – a prerequisite for VTOL capability. As the speeds of aircraft continue to increase, the power plant requirements for V/STOL operation and forward flight performance become compatible. Furthermore, at the same time, above Mach 1 the thrust required is nearly equal to or exceeds the gross weight of the aircraft at level flight – coinciding some aspects of the design solutions for V/STOL and supersonic aeroplanes.
The most prolific V/STOL capable aircraft, so far, is clearly the helicopter; however in level flight the helicopter is inefficient compared to a typical fixed-wing aeroplane, with speed and range only between a half or one third (approximately) that of the aeroplane. Also, due at-least in part to their greater complexity, helicopters demonstrate poorer safety than conventional aeroplanes(7): with for example light conventional aeroplanes suffering a fatal accident rate of 11.7/million flying hours, versus 33.5/million flying hours for small helicopter. The same complexity also contributes to a greater cost: for example at time of writing the typical hire cost of a Robinson R44 helicopter in the UK is £400/hr or to purchase the aircraft would cost £100,000-£200,000, whilst a Cessna C172 aeroplane, which has similar payload and cruise performance capability, can be rented for about £150/hr or purchased for about £30,000-£100,000 – costs around 30-40% of the cost of the helicopter.
The search for V/STOL capability has provoked research into embedding VTOL capability of a helicopter into a conventional fixed-wing aeroplane. However, this has rarely been achieved. The authors have identified 45 fixed-wing aircraft which have attempted to combine V/STOL capability of the helicopter with high forward flight speed of a conventional aircraft. Of these 45, only four: the BAe Harrier, Yak-38, Bell-Boeing V-22 and Lockheed Martin X35 Joint Strike Fighter have ventured much beyond the prototype stage. Table 1 below presents these 45 aircraft arranged according to their propulsion systems.
VTO Propulsion Strategy Aircraft Model
Transcendental Model 1G
1 Tilt Shaft/Rotor
Bell XV-3 2
Curtiss-Wright X-100
3 Tilt Prop
Curtiss-Wright X-19
4
Doak 16 VZ-4 5
Bell-X22A 6 Tilt Duct
Nord 500 Cadet 7
Vertol 76 VZ-2 8
Hiller X-18 9
LTV-Hiller Ryan XC-142
10 Tilt Wing
Canadair CL-84 Dynavert
11
Bell XV-15 12 Tilt Rotor Bell Boeing V-22
Osprey 13
Tilt Jet Bell 65 14
Robertson VTOL 15
Ryan 92 VZ-3 Vertiplane
16 Deflected Slipstream
Fairchild 224 VZ-5 17
Bell X-14 18 Hawker P.1127 Kestrel
19
Yakovlev Yak-36 20
BAe Harrier 21
Vectored Thrust
Boeing X-32 22
Lockheed XFV-1 23
Convair XFV-1 Pogo
24
Ryan X-13 Vertijet 25
Same Propulsion System for Hover
and Forward Flight
Tail Sitters
SNECMA C450 26
Short SC.1 27
Dassault Balzac V 28 Separate Power Plant for Hover
Lift +
Cruise Dassault Mirage III-V
29
EWR VJ101C 30
Dornier Do 31 31
Lockheed XV-4B 32
VFW VAK 191B 33
Yakovlev Yak-38 34
Lift +
Lift/Cruise
Yakovlev Yak-141 35
McDonnell XV-1 36
Combined Power Plant for Hover
Tip Jets Fairey Rotodyne 37
Lockheed XV-4A 38 Ejector
Rockwell XFV-12A 39
Vanguard Omniplane
40
GE-Ryan XV-5A 41 Fan Lockheed Martin X-35
42
Kamov Ka-22 43 Piasecki 16H-1 44
Augmented Power Plant for Hover
Rotor Lockheed AH-56 45
Table 1, V/STOL aircraft arranged according to their propulsion systems.
5
This table is dominated by aircraft whose designs attempt to use the same power system for both VTOL- lift and propulsion: including the BAe Harrier and the Bell Boeing V-22. The Yak-38 and JSF X-35, which have both, also successfully, entered service, utilised combined power plant for hover and augmented power plant for hover respectively. This paper will attempt to compare these aircraft through performance parameters, specifically: maximum velocity, range, thrust to weight ratio and power.
2 DISTINCT AERODYNAMIC FEATURES OF V/STOL AIRCRAFT
The main distinctive feature of V/STOL capability is the high thrust to weight ratio which requires expanding the propulsion performance envelope and makes the powerplant the most significant component of a V/STOL aircraft in terms of weight and body volume. Most jet fighter aeroplanes developed since about 1960 have (at-least in lightweight configurations), the potential to generate a thrust to weight ratio T/W exceeding 1. However, conventionally the engine exhaust is located at the rear of aircraft and diverting the exhaust downward will not be the solution – this is useful for horizontal flight, but not hovering flight where a balance problem exists. To solve this, either the thrust must be co-incided with the centre of gravity, or an additional and controllable thrust device must be located away from the main thrustline, creating a balance – such as in the case of the BAe Harrier (Figure 3 below). Both of these approaches will tend to prise the aircraft away from the traditional and usually optimal layout.
Figure 3, Hawker-Siddeley / BAe Harrier GR Mk.3.
For cruise-dominated VTOL aircraft – such as may be designed for transport purposes, a more severe problem involves thrust matching. If the thrust required for vertical flight is provided by the same engines used for cruise, the engines will be far too large for efficient cruise. The thrust mismatch will produce great fuel consumption and range penalty for a cruise dominated design that uses only the vectored thrust of its cruise engines for vertical flight. For this reason many conceptual VTOL transport designs have incorporated separate “lift engines” used during vertical flight. Figure 4 highlights the mismatch between thrust required for vertical flight and thrust for horizontal flight for a typical jet V/STOL aircraft. Also, the thrust mismatch may further increase with altitude as the thrust required to maintain a steady flight at higher altitudes, (~15,000 metres), decreases significantly. These are known to be the fundamental problems which must be overcome in a VTOL aircraft.
Figure 4, Thrust mismatch for jet V/STOL aircraft at sea level [derived from (8)].
In a V/STOL aircraft it becomes necessary to also consider the factors influencing the performance for the CTOL and level flight cases. The factors can be evaluated by simplified analysis of the ground-roll distance of a landing aircraft and the relationship between them is defined by (9)
max
2
0
( / )
( / )ref
L R
W S VS
gC T W
(1)
6
max
02
0
0
0
/
1/
1/ ( / )
ref
L
R
S W S
S V
S C
S T W
(2)
where S0 is the ground-roll distance, Vref the approach speed and the other symbols are designated to their usual meanings. The relationship clearly indicates that the thrust to weight ratio is the most significant parameter to achieve minimum ground roll distance and it could be further minimised by maximising CLmax and lowering the wing loading W/S. Figure 5 presents the landing performance of typical STOL aircraft unsurprisingly shows that the approach speed should be reduced to minimise the landing distance. To do so,
CLmax and RT (which is a function of forward thrust to
weight ratio) need to be increased.
Figure 5, STOL landing performance [derived from (9,10)].
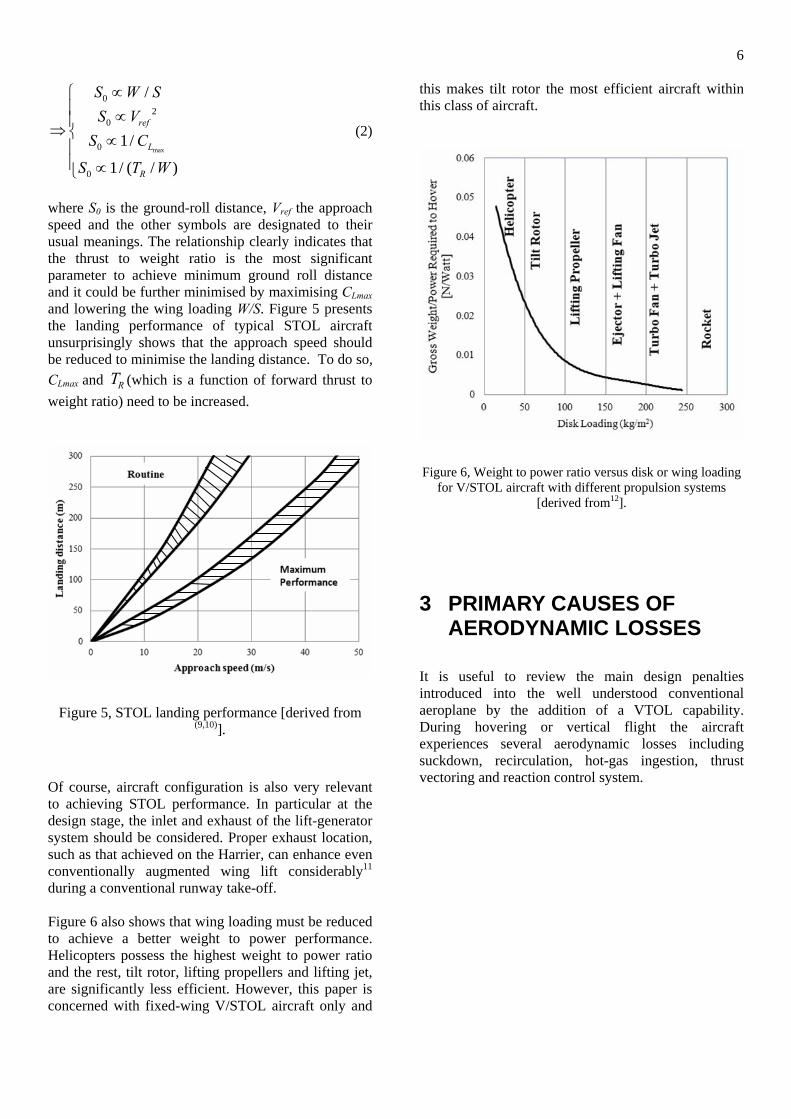
Of course, aircraft configuration is also very relevant to achieving STOL performance. In particular at the design stage, the inlet and exhaust of the lift-generator system should be considered. Proper exhaust location, such as that achieved on the Harrier, can enhance even conventionally augmented wing lift considerably11 during a conventional runway take-off. Figure 6 also shows that wing loading must be reduced to achieve a better weight to power performance. Helicopters possess the highest weight to power ratio and the rest, tilt rotor, lifting propellers and lifting jet, are significantly less efficient. However, this paper is concerned with fixed-wing V/STOL aircraft only and
this makes tilt rotor the most efficient aircraft within this class of aircraft.
Figure 6, Weight to power ratio versus disk or wing loading for V/STOL aircraft with different propulsion systems
[derived from12].
3 PRIMARY CAUSES OF AERODYNAMIC LOSSES
It is useful to review the main design penalties introduced into the well understood conventional aeroplane by the addition of a VTOL capability. During hovering or vertical flight the aircraft experiences several aerodynamic losses including suckdown, recirculation, hot-gas ingestion, thrust vectoring and reaction control system.
7
3.1 Suckdown and Fountain Lift
The downwash that keeps the aircraft in a steady state also accelerates the air flow around it which pushes downward on the aircraft with a vertical drag depending on the whole surface area of the aircraft facing the flow. The critical factors influencing the vertical drag are the relative location of the propeller or jet exhaust and the fixed wing. If the propeller is directly above the main wing, such as in the Lockheed AH-56, or the exhaust nozzles are directly under the wing, such as in the Bell 65 ATV, then a much larger downward force is exerted by the entrained airflow. For a jet aircraft suckdown is a rather severe aerodynamic loss. The jet lift is a product of mass flow
rate m
and jet speed JU , JT mU
. Significantly large amounts of air need to be drawn in from the surroundings which subsequently causes a complex flow field around the aircraft as shown in Figure 7. This complex flow field causes variation in total lift arising mainly from suckdown caused by low pressure at lower surface of the aircraft. This loss is often balanced by deploying vertical fins to divert the engine exhaust inwards and generate favourable fountain effect. The variation in lift may be summed up as
fOGE sLL LL
T T T T
(3)
where OGEL is the loss of lift due to profile drag acting at the plan-form surface of the aircraft depending on the climb rate.
Figure 7, Twin jet V/STOL hover aircraft in ground effect showing potential flow field, suckdown and fountain lift [from(13)].
3.2 Recirculation
A V/STOL aircraft near the ground experiences a potential flow field around it that injects its own downwash/exhaust gases into the inlet which results in a significant loss of lift/thrust. This recirculation also often injects dirt and erosion particles that can damage the engine.
3.3 HotGas Ingestion
Hot-gas ingestion is only applicable to jet VTOL aircraft where hot exhaust gases are injected back into the engine which increases the inlet temperature and causes a significant reduction in thrust. The hot-gas ingestion is very configuration dependent, the nozzle arrangement, inlet position, and wing location being important variables. Relative head winds could also have a large effect on the magnitude of the inlet-air temperatures.
3.4 Thrust Vectoring
Thrust-vectoring is generally achieved by nozzle-vectoring and the nozzle arrangement has a significant effect on the thrust loss. Rectangular nozzle arrangements and the side-inlet single nozzle have the highest inlet-air temperature rises (up to 111º C) (14).
3.5 Reaction Control System (RCS) losses
In hovering flight, an RCS is necessary to aircraft control; this may for example be achieved through use of compressed air bleed at the wing tips, nose or tail (e.g. the Harrier and Yak-38). Such a system is both heavy in itself, and makes significant power demands upon the aircraft. (For a rotary-wing aircraft balanced VTOL is achieved by a combination of pendular stability, for high wing configuration, and dynamic control via disc angle.) The net T/W for VTO must obviously exceed 1 in the normal axis, however thrust losses must be considered in light of the above. Heave Control / 0.05
Suckdown / 0.03
RCS / 0.1
HGI / 0.08
Landing Weight / 1.0
T W
T W
T W
T W
T W
from (15).
8
Thus, to achieve hover for a jet aircraft, normally1.3 / 1.5T W .
4 V/STOL PERFORMANCE ANALYSIS
Conventionally, an aircraft’s performance, a whole, is specified by power and thrust loading,
/W P and /W T . The shorter the take-off distance, the
higher the altitude and hotter the climate, the bigger the engine to provide enough power, or thrust. Specifically, for a V/STOL aircraft the most emphasised parameters, from conceptual design to performance analysis, are static thrust-to-weight ratio and wing loading(16). For a CTOL aircraft the general performance equation(17) defining the relationship between power, thrust and weight is given by
/p t c tP DV Wv W g aV (4)
where p is the propulsive efficiency, tV the forward
target velocity, cv the rate of climb and a the acceleration of aircraft. This equation, in general, will hold for V/STOL aircraft as well by incorporating the different flight modes. Thus the analysis below will be based on the parameters given in the equation above.
Design and performance data has been collected for the aircraft, presented in Table 1, and tabulated in Table 2 and Table 3, categorised by propulsive class.
Figure 8 and Figure 9 present thrust and VTO weight chart for the jet and the non-jet V/STOL aircraft respectively in order to highlight the scale of each aircraft. Using the available technology, jet aircraft tend to be heaviest with weights on average of 80 kN compared to 30 kN for other classes. The aircraft are arranged with time scale and there seems to be no strong evidence of improvement in terms of thrust to weight ratios through the history of V/STOL – presumably because most aircraft are designed to a weight which makes full use of the power available.
Figure 8, Available Jet-Thrust and Weight chart for jet V/STOL aircraft.
9
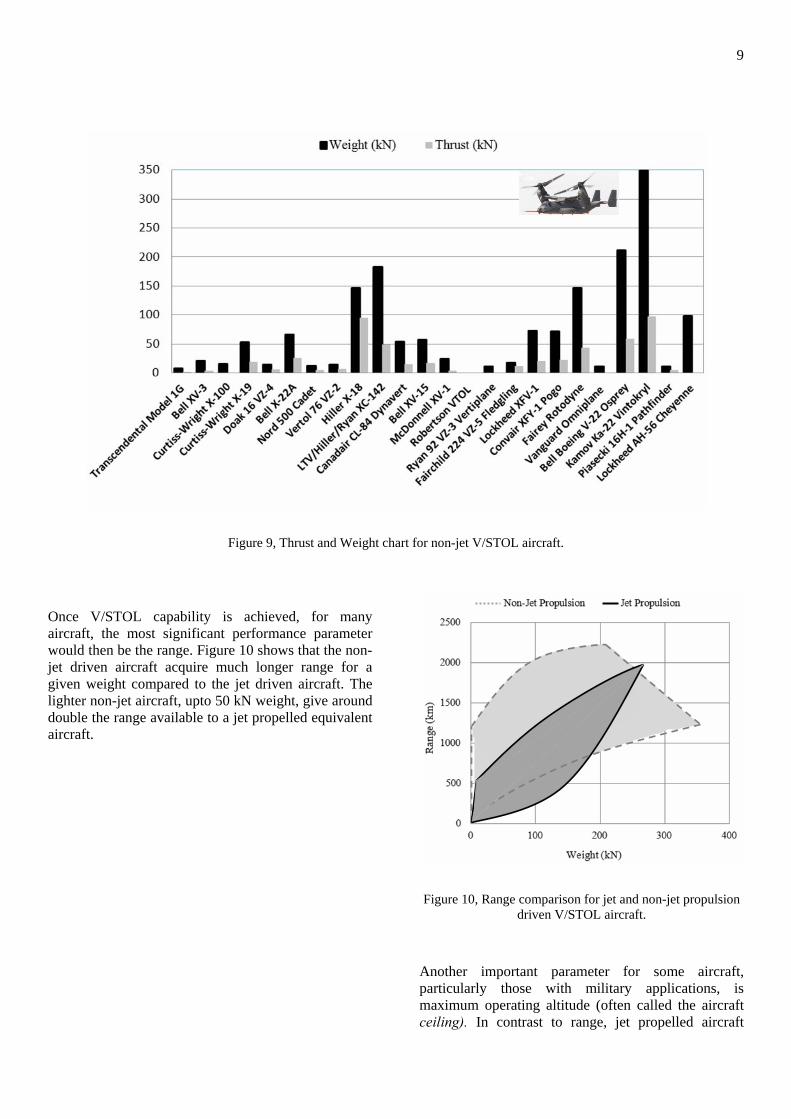
Figure 9, Thrust and Weight chart for non-jet V/STOL aircraft.
Once V/STOL capability is achieved, for many aircraft, the most significant performance parameter would then be the range. Figure 10 shows that the non-jet driven aircraft acquire much longer range for a given weight compared to the jet driven aircraft. The lighter non-jet aircraft, upto 50 kN weight, give around double the range available to a jet propelled equivalent aircraft.
Figure 10, Range comparison for jet and non-jet propulsion driven V/STOL aircraft.
Another important parameter for some aircraft, particularly those with military applications, is maximum operating altitude (often called the aircraft ceiling). In contrast to range, jet propelled aircraft
10
attain much higher maximum cruise velocities compared to the non-jet, see Figure 11. The average cruising speed of heavier jet aircraft is around 300 m/s, which is in the transonic region, and around 100 m/s for the non-jet aircraft. However, for the smaller/lighter class of aircraft, up to 50 kN, the difference is insignificant. Rotary winged aircraft are excluded from the high speed flight regime by well-known limiting factors, particularly tip compressibility and retreating blade stall. The high profile drag met at transonic speeds, inevitably, leads to a requirement for a higher T/W for higher speed (normally jet) aircraft, as may be seen in Figure 12. The average T/W for the jet aircraft is around 1.2 which is a function of Mach number as shown in Figure 4 above. The average T/W value for the non-jet is 0.35 which again highlights the fact that rotary wing benefits from aerodynamic fact that lift generated is much larger than the drag. The rotary wing and jet propulsion efficiencies are given below respectively.
1
1P a
(5)
2
1j a
(6)
where a is the ratio of vehicle velocity to the exhaust (for jet) or the induced (for propeller) velocity. For jet engines the propulsive efficiency is the highest when the engine emits an exhaust jet at a speed that is nearly the same as the vehicle velocity. While for the rotary wing the smaller the induced velocity the more efficient the system. The relationship between performance parameters even for the successful aircraft such as X-35 is nonlinear – this aircraft weighing approximately twice the weights of the Harrier and Yak-38 but displaying triple the range and double the top speed. However, given the small sample and that the X-35 is a much more recent aircraft, this is probably due to improved strength to volume ratio of composite materials used on the X-35 which has direct impact on lift to drag ratio.
Figure 11, maxV -weight envelope comparison for jet and
non-jet propulsion driven aircraft.
Figure 12, T/W comparison for jet and non-jet propulsion aircraft.
Figure 13 highlights the difference in power required to hover for the jet and non-jet aircraft and the non-jet proves to be way more efficient in this regard, it consumes around 4 times less power, in average, to lift a corresponding weight.
Mach 1
11
Figure 13, Power loading comparison for jet and non-jet V/STOL aircraft.
5 FLYING CARS: THE FUTURE V/STOL VEHICLES?
The flying car is a category of aircraft which has been projected for many years, but is only now approaching possible utility. These are low speed, light weight and short-range vehicles for non-traditional roles such as close area surveillance or personal transport(18,19.20) There are several projects currently receiving publicity, but which have so far failed to demonstrate commercial success – or in some cases, the ability to sustain flight. Herein, particularly V/STOL capable cars that might be in service in the near future are described and their specifications are given in Table 4.
5.1 Mule UAV
The flying car displayed in Figure 14 is a UAV developed by Urban Aeronautics, an Israeli company, for a proposed market with the emergency services. It is also related to a projected manned aircraft, the X-Hawk, see Figure 15. The distinct feature of the vehicle is the vane control system: actuating guided vanes are installed around the main lift fan. Forward flight is achieved by ducted fans powered by the main powerplant. A scale prototype of the vehicle is reported to have been tested in August 2008 in hover and low-speed forward flight, and flight of the first Mule prototype is projected for mid-2009. The vehicle is predicted to be capable of obtaining 51 m/s of maximum forward velocity, 2 to 4 hours of
flight endurance and can lift a payload of up to 2.5kN with 480 kW of power.
Figure 14, Mule UAV by Urban Aeronautics [photo courtesy of Urban Aeronautics(21)].
Figure 15, X-Hawk by Urban Aeronautics [photo courtesy of Urban Aeronautics(22)]
5.2 Moller Skycar
The Moller M400, displayed in Figure 16, claims a better performance compared to the Mule, claiming to be capable of 161 m/s top speed, carriage of up to 3.9kN of payload, 1,200 km range, despite a stated maximum weight of 1.7kN (identical to that of the Mule). The vehicle hopes to achieve stable cruise flight but has shown poor stability in hover during the test carried out by the design team(23). Nevertheless, the vehicle seems to be the most advanced in course to a certified operational V/STOL flying car.
12
Figure 16. Moller Skycar M400 [photo courtesy of Moller International(23)].
5.3 Skyrider
Skyrider, depicted in Figure 17, is also based on the ducted fan technology and achieves control by the same means. It is similar to the Moller M400 to a great extent, however, promises better performance with 172m/s top speed, 1,482km range and power consumption of 522kW. The stability is of great concern as the vehicle significantly lacks static-wing area. However, the design is also implemented as a UAV, the Skyrider Scout, which comprises of a much slimmer fuselage, see Figure 18, and tends to generate lift. Nevertheless, the design is at its prototyping stage and may well be modified to tackle its weaknesses(24).
Figure 17, Skyrider [photo courtesy of Macro Industries(24)].
Figure 18, Skyrider Scout [photo courtesy of Macro Industries(24)].
5.4 Dragonfly
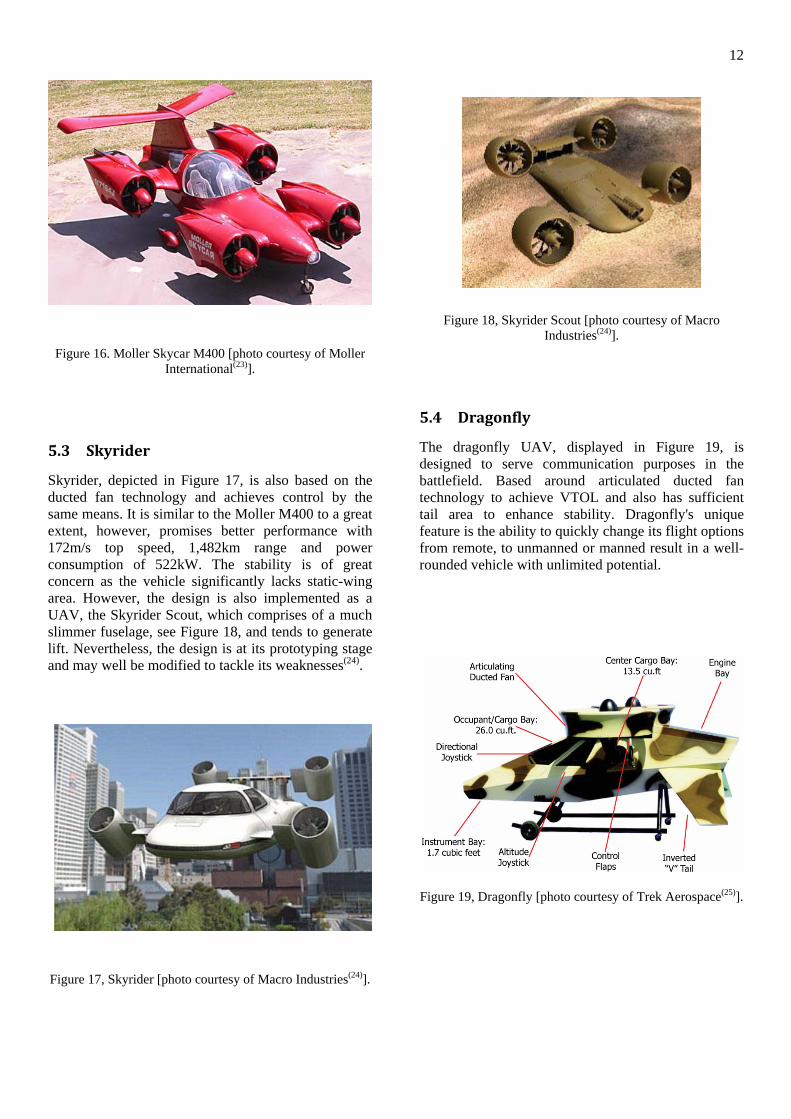
The dragonfly UAV, displayed in Figure 19, is designed to serve communication purposes in the battlefield. Based around articulated ducted fan technology to achieve VTOL and also has sufficient tail area to enhance stability. Dragonfly's unique feature is the ability to quickly change its flight options from remote, to unmanned or manned result in a well-rounded vehicle with unlimited potential.
Figure 19, Dragonfly [photo courtesy of Trek Aerospace(25)].
13
5.5 Flying Cars Performance Analysis
It is visible in the vehicles described above that the most common feature in them is the ducted/shrouded fan/propeller. The concept of ducted propellers as a suitable propulsive device for many V/STOL applications has been explored for more than half a century; the Doak 16 VZ-4 and Bell X-22A are good examples of successful application. Ducted fans, or shrouded propellers, hold promise as devices for high static thrust propulsion systems. When compared to an isolated propeller of the same diameter and power loading, ducted propellers typically produce significantly greater static thrust(26). However, a better efficiency compared to an un-ducted propeller is only achieved at relatively lower airspeeds. Ducted fans also offer lower noise, uniform loading along the blade span and elimination of the propeller induced tip vortices subsequently eliminating induced drag. In addition, the ducted fan system offers a supplementary safety feature attributed to enclosing the rotating fan in the duct, therefore making it an attractive option for various advanced unmanned air vehicle configurations or for small/personal air vehicles as described above. The flying cars claim to be V/STOL capable and recalling that V/STOL is composed of two separate characteristics: VTOL and STOL. Thus the feasibility study may begin by investigating whether these vehicles comply the main condition of VTOL capability that is / 1T W . The thrust required for this flight mode may be evaluated by assuming that the aircraft behaves like a flat plate perpendicular to the flow as shown in Figure 20. Applying Newton’s second law of motion and assuming sum of the forces act through the geometrical centre of the plate/aircraft the following relationship is derived.
F ma (7)
req p
WT D W a
g (8)
It is known that for a VTOL aircraft the minimum vertical acceleration requirement is 0.1g(13) so the thrust required for vertical take-off is given by
211.1
2 Preq s c p DT W k v S C (9)
where sk is a factor to incorporate loss in lift from
suck down (as described above) and PDC is the profile
drag coefficient for a flat plate, a typical value taken to be 1.28(27). Also, the typical range of distance from ground to out of ground effect is 5 10OGEm H m (28,29). Taking 8OGEH m as mean
OGE height; the climb rate cv may be evaluated by using the equation of uniformly accelerated motion (strictly for point mass object) as
2 2 2c i OGEv u aH (10) and taking the initial velocity iu near the ground to be zero.
2c OGEv aH (11)
Hence 4cv m/s. The thrust available for a given engine power, applying the simple momentum theory, for a ducted propeller is defined(30) as
20.8 13 4
4ava
c cava
P Tv v
T A
(12)
where is the area ratio between the fan and the
exhaust and 0.8P is 80% of the engine power transmitted to the fan since ducted propellers are typically 80% efficient(17). Assuming the climb rate of the range 4 10cv has negligible effect the relationship for thrust available may be further simplified as
1
233
0.8avaT P d
. (13)
From the equation above it can clearly be seen that the thrust available from a ducted propeller depends on the overall size of the fan and the ratio between the fan disc area and the duct exhaust area. Figure 21 compares the thrust available to the thrust required to achieve VTOL for the flying cars. From the
Figure 20, Flat plate theory to estimate VTOL performance.
Treq
W
Dp
14
figure it is visible that the Moller M400 and the Mule are just capable of providing enough thrust for VTOL. The Dragonfly and the Skyrider lack sufficient thrust to overcome the weight and the vertical drag. However, Moller and Mule projects are comparably much advanced in reaching their prospective goals. Also, nevertheless, the publishers/designers have clearly mentioned that the performance estimates are preliminary and subject to change. So the analysis above suggests that a higher degree of precision is required for better estimation.
Figure 21, Chart comparing thrust available to thrust required for flying cars.
The specifications and flight performance data for the flying cars depicted above are presented in Table 4 and plotted in Figure 22 to Figure 25. These figures compare the flying cars performance to the past, relatively, lighter/smaller non-jet V/STOL aircraft. Clearly, the flying cars are claiming significantly better range envelops and speeds compared to corresponding past non-jet V/STOL aircraft. It is perhaps curious that, despite a lack of any real track record for any of these projects, they consistently propose significantly better performance: as defined by speed, range and payload, per power and weight, than previous aircraft. It will be interesting, should any of these projects reach fruition, so see the extent to which this claimed performance is ever achieved – the authors venture that they may not, although certainly the extensive use of ducted fan technology may carry some benefits(31).
Figure 22, Flying cars’ specifications.
Figure 23, Range-weight envelope of future flying cars and non-jet V/STOL aircraft.
Figure 24, Maximum cruise velocity comparison of future flying cars and non-jet V/STOL aircraft.
15
Figure 25, Power consumption comparison of flying cars and non-jet V/STOL aircraft.
6 Conclusions
The analytical review of the past V/STOL aircraft based on their performance parameters has resulted in useful findings.
V/STOL optimisation is best achieved with light-weight vehicles, with low wing loading.
The V/STOL aircraft may usefully be divided into two categories, i.e. jet and non-jet, as there exists a significant performance difference between the two.
Non-jet driven V/STOL aircraft acquire better range and consume significantly less power.
Several different propulsive arrangements have been tried on past V/STOL aircraft; however, for jet propelled aircraft a clear best solution has yet to emerge.
An attempt has been made to define relationship between several parameters by plotting the data presented in the database and most of it depicted a nonlinear relationship.
Performance is not linearly related to aircraft weight.
Aerodynamic based propulsion systems best serve low speed V/STOL aircraft – most of the future V/STOL aircraft are being developed based on this fact. The dominant branch of V/STOL “the helicopter” works with aerodynamic solution i.e. Rotary wing.
The thrust to weight requirements of a modern fighter aircraft tend towards also satisfying the same requirement for V/STOL.
Whilst proposed future V/STOL vehicles validate the findings above by adopting non-jet propulsion system and keeping the overall size to the minimum, most current projects claim performance unlikely to be met by comparison with historical data.
1 Roberts, L and Deckert, W. R. Recent Progress in V/STOL Technology. NASA Technical Memorandum 84238.
2 Tennekes, H. The Simple Science of Flight. Cambridge, MA: MIT Press, 1997.
3 Wanless, R. M. Can the Aldabra White-Throated Rail Dryolimnas Cuvieriald Abranus Fly? National Museum Of Natural History, Smithsonian Institution Washington, D.C, U.S.A. August 2003.
4 Alexander, D. E. Nature's Flyers:Birds,Insects, and the Biomechanics of flight. The Johns Hopkins University Press, Baltimore, 2002.
5 Marden, J. H. Maximum Lift Production During Take-off In Animal Flying. Department of Zoology, University of Vermont, Burlington, VT 05405, USA, 1987.
6 Abbott, I. H and Doenhoff, A. V. Theory of Wing Sections. Dover Publications, INC. New York, 1959.
7 UK Civil Aviation Authority, Aviation Safety Review 2008, CAP 780 issued 11 November 2008
8 Lindenbaum, B. V/STOL Concepts and Developed Aircraft Vol I - A Historical Report (1940 – 1986). Air Force Wright Aeronautical Laboratories, ADA175379.
9 McCormick, B. W. Aerodynamics of V/STOL Flight. Academic Press, 1967.
10 Kuhn, R. E. Take-Off and Landing Distance and Power Requirements of Propeller-Driven Airplanes. IAS preprint 690, presented at Twenty-fifth Annual meeting, New York, January 28-31, 1957.
11 Anderson, S. B. Historical Overview of V/STOL Aircraft Technology. NASA Technical Memorandum 81280.
12 Proceedings of V/STOL Aircraft Aerodynamics, Volume II. Naval Air Development Center, California, 1979.
13 Filippone, A. Flight Performance of Fixed and Rotary Wing Aircraft. Butterworth-Heinemann, 2006.
14 McLemore, H. C and Smith, C. C. Generalised Hot-Gas Ingestion Investigation of Large-Scale Jet VTOL Fighter-Type Models. NASA Langley Research Center, NASA TN D-5581.
15 Raymer, D. P. Aircraft Design: A Conceptual Approach, 4th Edition. AIAA Education Series, 2006.
16 Gologan, C., Broichhausen, K and Seifert, J. A Calculation Method for Parametric Design Studies of V/STOL Aircraft. The Aeronautical Journal, Vol. 113 No 1143, 2009.
17 Stinton, D. The Design of the Aeroplane, 2nd Edition. Blackwell Sciences, 2001.