An Evaluation of Three Types of An Evaluation of Three Types of Gas Station Canopy Lighting Gas Station Canopy Lighting Presenter: John Van Derlofske Ph. D. P.R. Boyce, C.M. Hunter, and S.L. Vasconez Lighting Research Center Rensselaer Polytechnic Institute
Transcript
An Evaluation of Three Types of An Evaluation of Three Types of Gas Station Canopy LightingGas Station Canopy Lighting
Presenter: John Van Derlofske Ph. D.
P.R. Boyce, C.M. Hunter, and S.L. VasconezLighting Research Center
Rensselaer Polytechnic Institute
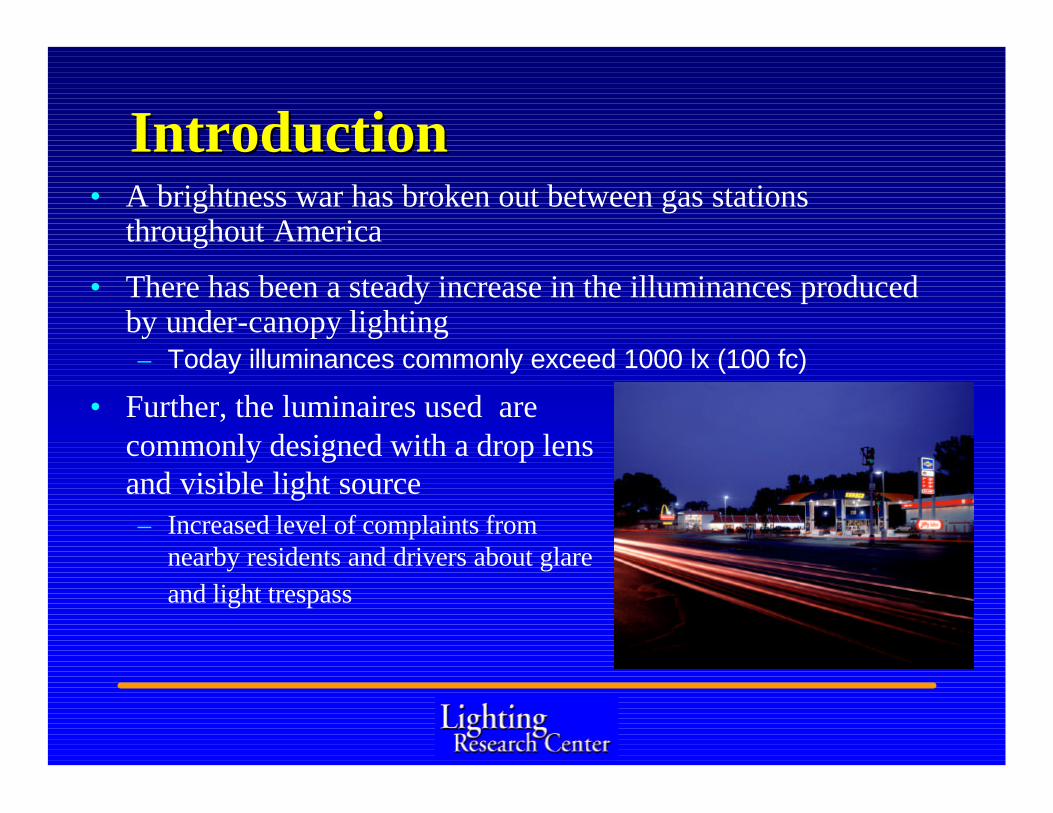
• A brightness war has broken out between gas stations throughout America
• There has been a steady increase in the illuminances produced by under-canopy lighting– Today illuminances commonly exceed 1000 lx (100 fc)
IntroductionIntroduction
• Further, the luminaires used are commonly designed with a drop lens and visible light source– Increased level of complaints from
nearby residents and drivers about glare and light trespass
Study ObjectivesStudy Objectives• The objective of this evaluation was to quantify the effects
of the three types of canopy lighting luminaires on:– Photometric conditions related to visibility, visual discomfort,
and light trespass – Energy efficiency of the installation– Tendency of drivers approaching the gas station to turn into it– Patrons’ opinions regarding task visibility for filling the vehicle
with gas, plus an overall impression of visual comfort– Opinions of a panel of community leaders regarding visual
amenity – Gasoline sales
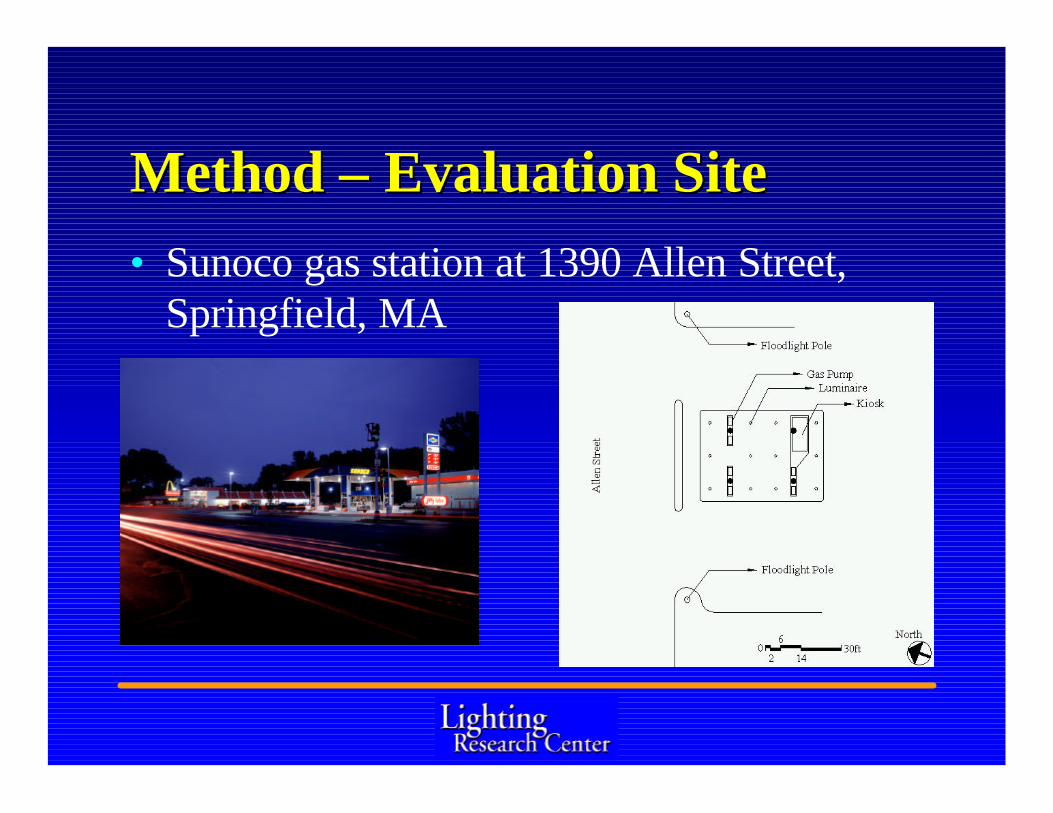
Method Method –– Evaluation SiteEvaluation Site• Sunoco gas station at 1390 Allen Street,
Springfield, MA
Method Method -- LightingLighting
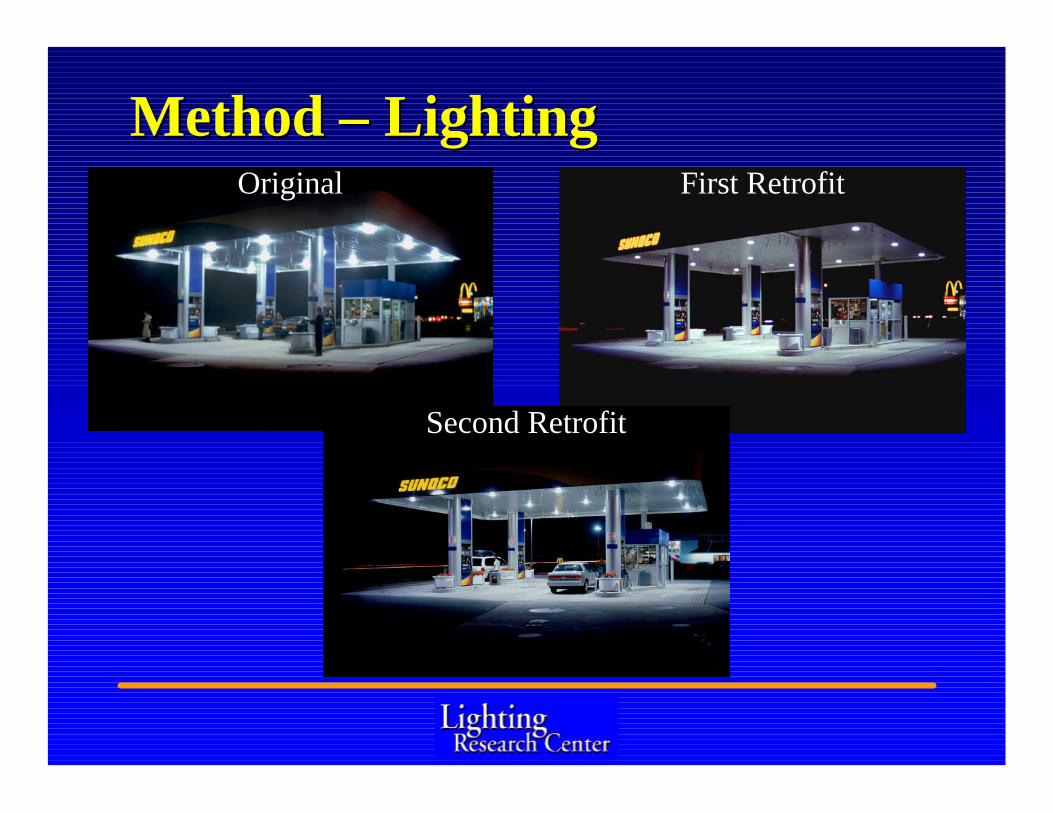
• Three different canopy lighting installations were evaluated– Original (non-cutoff)– First retrofit (full-cutoff)– Second retrofit (cutoff)
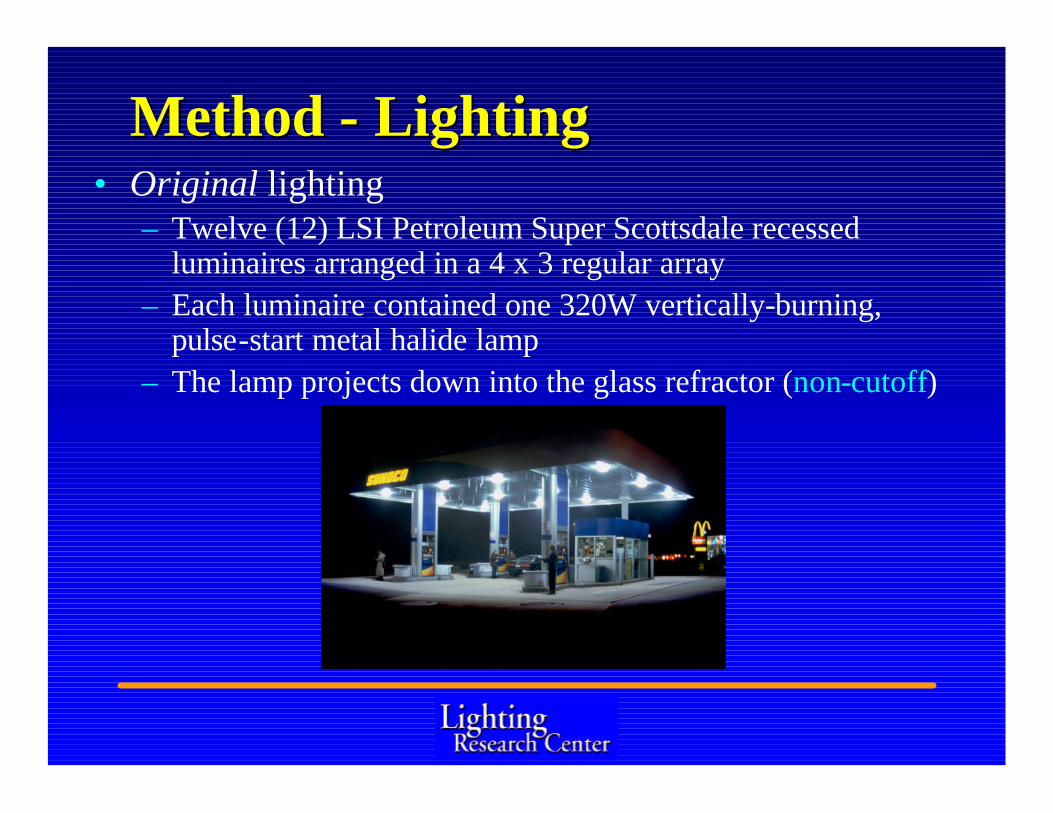
Method Method -- LightingLighting• Original lighting
– Twelve (12) LSI Petroleum Super Scottsdale recessed luminaires arranged in a 4 x 3 regular array
– Each luminaire contained one 320W vertically-burning, pulse-start metal halide lamp
– The lamp projects down into the glass refractor (non-cutoff)
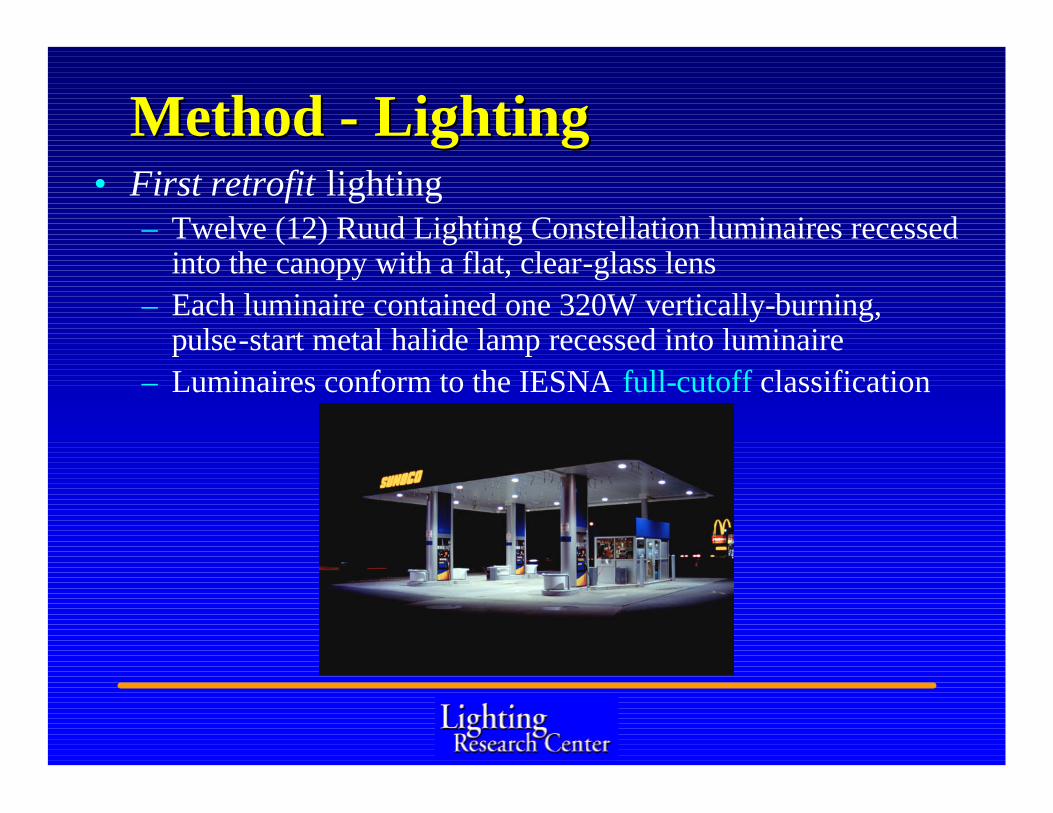
Method Method -- LightingLighting• First retrofit lighting
– Twelve (12) Ruud Lighting Constellation luminaires recessed into the canopy with a flat, clear-glass lens
– Each luminaire contained one 320W vertically-burning, pulse-start metal halide lamp recessed into luminaire
– Luminaires conform to the IESNA full-cutoff classification
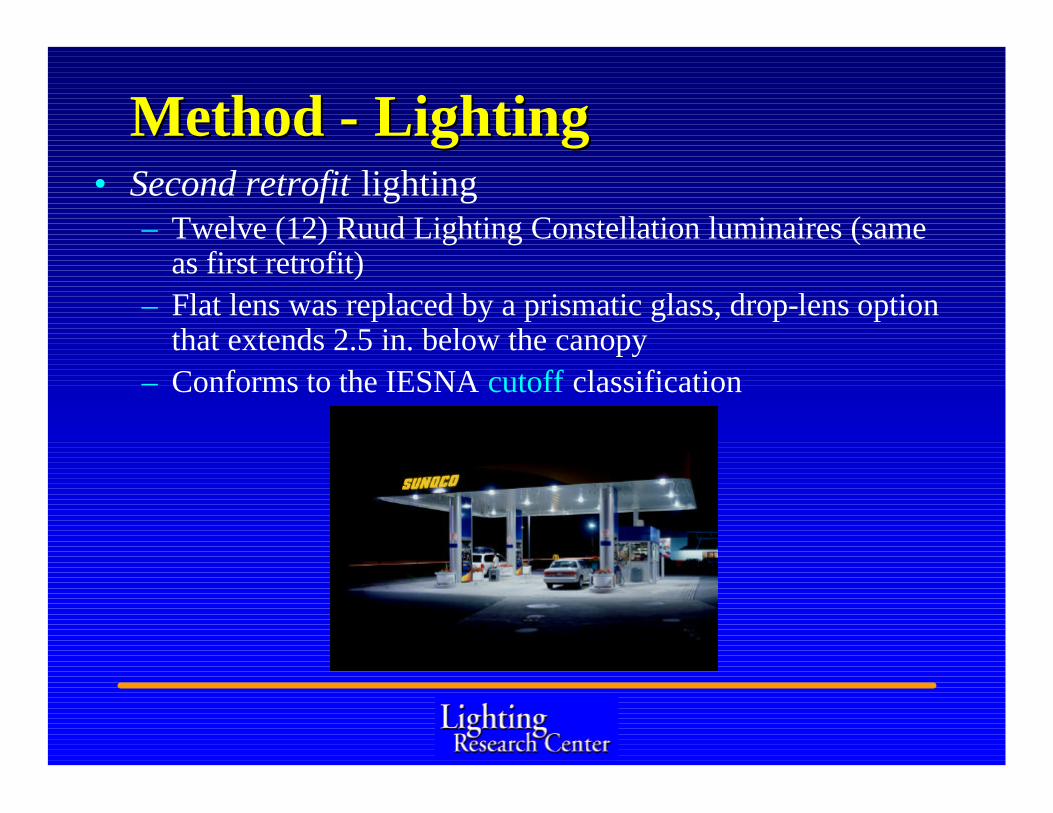
Method Method -- LightingLighting• Second retrofit lighting
– Twelve (12) Ruud Lighting Constellation luminaires (same as first retrofit)
– Flat lens was replaced by a prismatic glass, drop-lens option that extends 2.5 in. below the canopy
– Conforms to the IESNA cutoff classification
Method Method –– LightingLightingOriginal First Retrofit
Second Retrofit
Method Method -- ProceduresProcedures• Evaluation teams visited the gas station twice for each
lighting installation– Recorded photometric measurements, the frequency of drivers
turning in, and patron opinions
– Arrived at the station about 8 p.m., photometric measures were taken after 9 p.m. (well after sunset)
– The number of vehicles passing the front of the station was recorded on a hand-held counter in ten-minute intervals, as was the number of vehicles that turned into the station
– Patrons fueling their vehicles were asked to complete a short questionnaire about the lighting of the gas station
Method Method -- ProceduresProcedures• A panel of six community leaders was formed
– One city planner, one lighting expert, two utility representatives, one senior manager from a major corporation, and one employee of a small business
– The panel looked at six gas stations, including the site evaluated?The panel answered a short questionnaire about the appearance of the
gas station from a distance?The panel also moved into the gas station and assessed the lighting.
• The daily gasoline sales data from May 1, 2000 to May 31, 2001, were supplied
• The lighting power density of the three lighting installations was calculated
ResultsResults• Illuminance
Lighting Installation Axis A (lx) Axis B (lx) Axis C (lx)
Original lighting (measured)
299 (76) 378 (98) 265 (67)
Original lighting(estimated as new) 440 559 390
New Flat-lens lighting 642 (191) 1055 (201) 698 (152)
New Drop-lens lighting
643 (166) 906 (190) 664 (158)
Site Plan with Measurement Axis
The mean illuminance on all three axes under the canopy is lower under the original lighting than under either of the new lighting installations
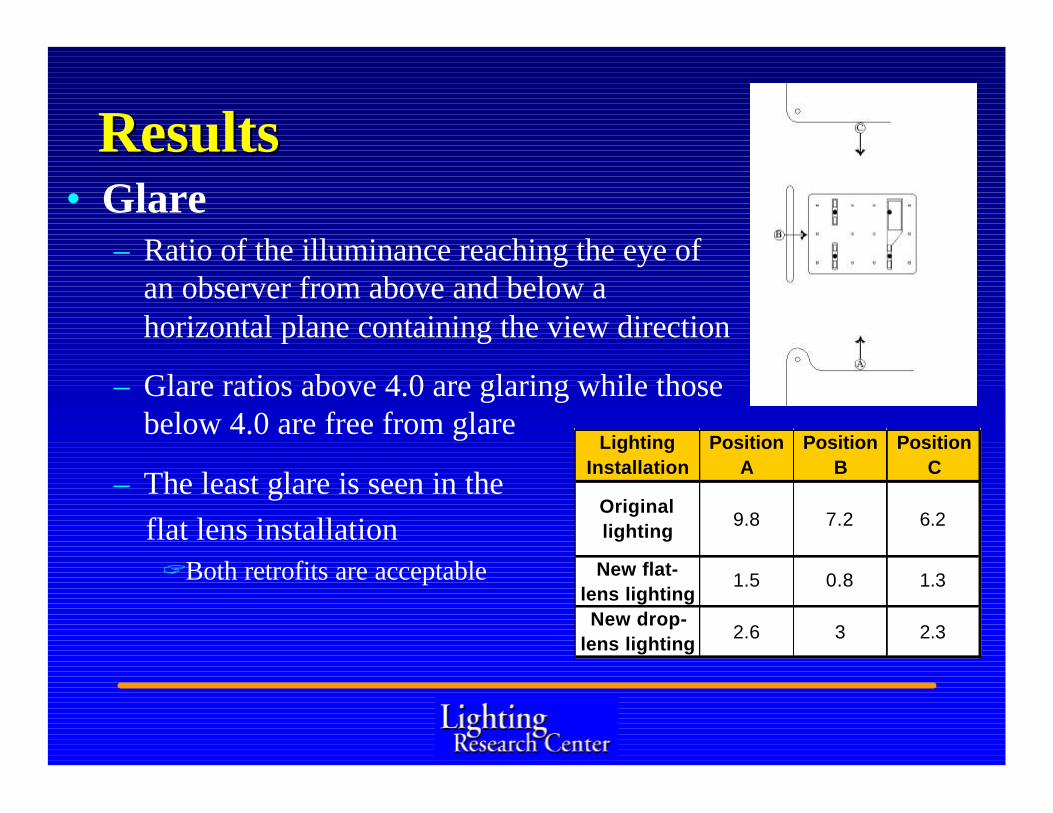
ResultsResults• Glare
– Ratio of the illuminance reaching the eye of an observer from above and below a horizontal plane containing the view direction
– Glare ratios above 4.0 are glaring while those below 4.0 are free from glare
– The least glare is seen in the flat lens installation?Both retrofits are acceptable
Lighting Installation
Position A
Position B
Position C
Original lighting
9.8 7.2 6.2
New flat-lens lighting
1.5 0.8 1.3
New drop-lens lighting
2.6 3 2.3
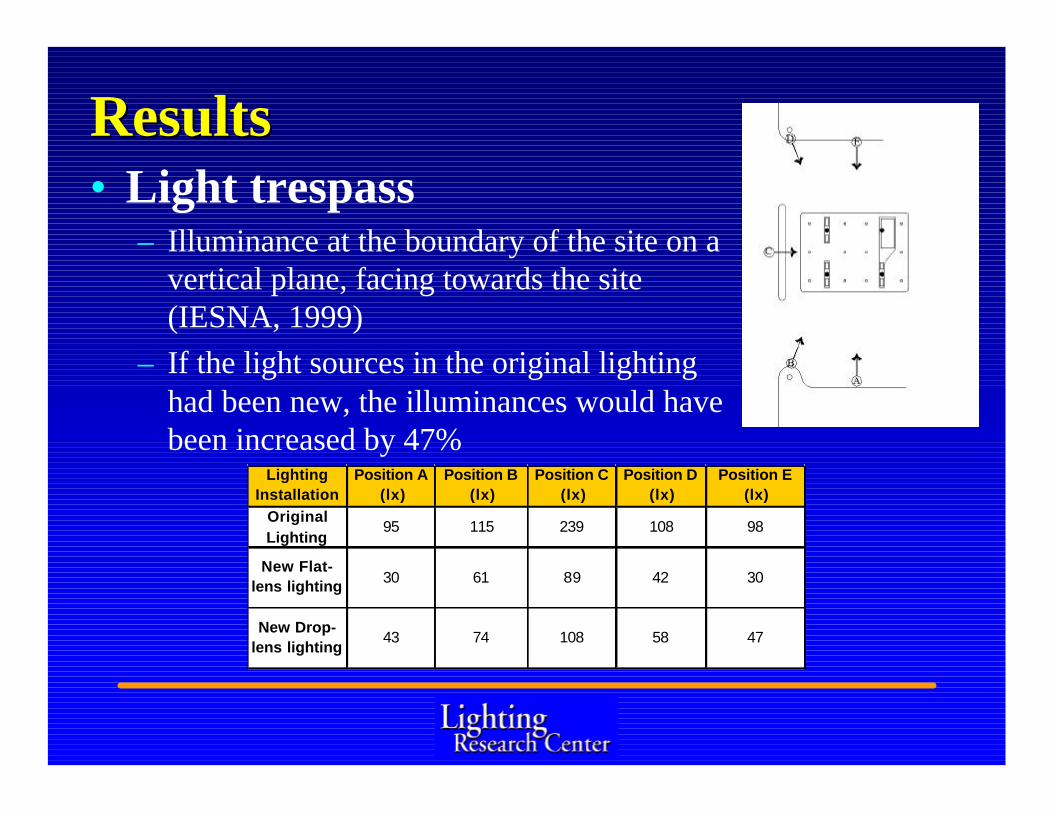
ResultsResults• Light trespass
– Illuminance at the boundary of the site on a vertical plane, facing towards the site (IESNA, 1999)
– If the light sources in the original lighting had been new, the illuminances would have been increased by 47%
Lighting Installation
Position A (lx)
Position B (lx)
Position C (lx)
Position D (lx)
Position E (lx)
Original Lighting
95 115 239 108 98
New Flat-lens lighting 30 61 89 42 30
New Drop-lens lighting
43 74 108 58 47
ResultsResults• Light trespass
– Traditional measurement ignores impact– To overcome this vertical illuminances at
eye level were measured with the normal to the plane of measurement directed towards the installation, and then 180° away
– Measured illuminance ratios shown belowLighting
InstallationPosition
APosition
BPosition
CPosition
DPosition
EOriginal Lighting
9.7 1.3 18.1 2.1 4.1
New Flat-lens lighting 4.3 0.5 9.8 0.8 1.4
New Drop-lens lighting
4.8 0.6 15 1.2 2.5
ResultsResults• Energy efficiency
– All luminaries used same sources?Power demand 4.38 kW and the lighting power density 2.55 W/ft2
(27.4 W/m2) are identical in all cases
– Lighting designs have different application efficiencies (efficiency with which they deliver a fixed illuminance to a defined area under the canopy)?Original lighting -1394 W / 100 lx (948 W / 100 lx)?Flat lens installation - 549 W / 100 lx ?Drop lens installation - 593 W / 100 lx
ResultsResults• Tendency of drivers to turn-in
– Results show an increase in the percentage of vehicles turning in for the new flat-lens and drop-lens lighting over the original lighting
Lighting Installation
Time duration for which traffic
flow was recorded (mins)
Number of vehicles passing
Number of vehicles
turning in
% turning in
Original lighting
210 2150 41 1.87
New Flat-lens lighting
210 1991 49 2.40
New Drop-lens lighting 200 2015 59 2.84
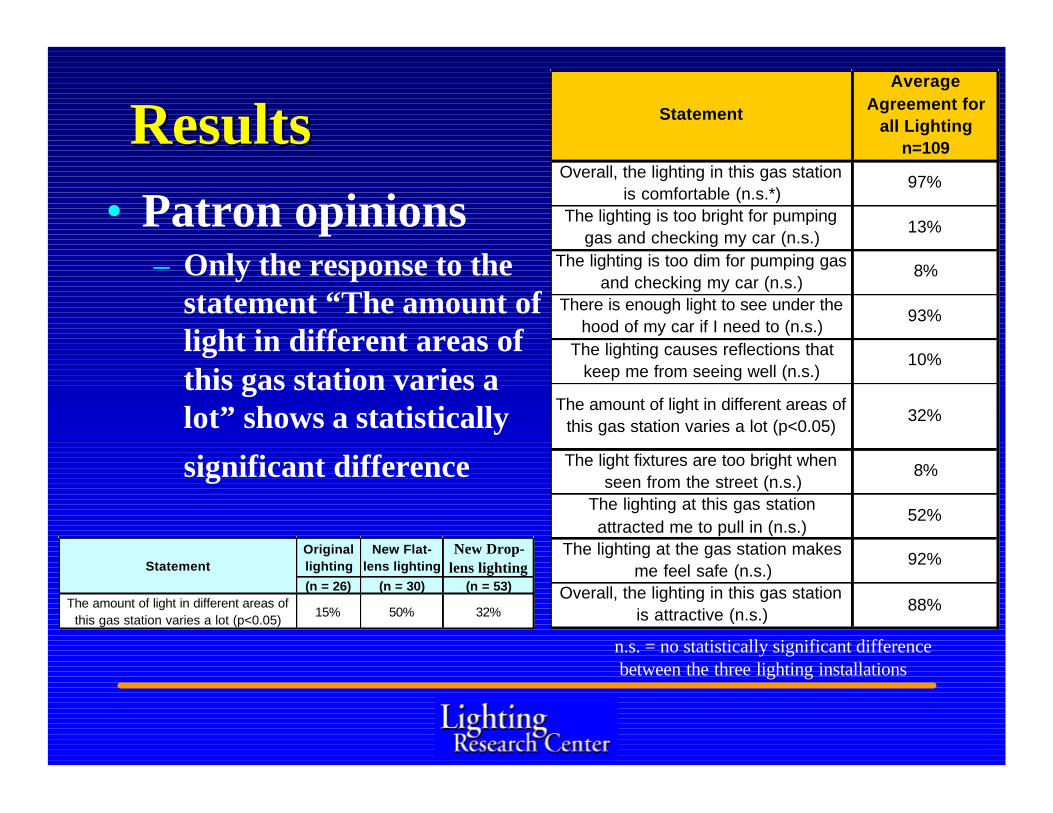
ResultsResults• Patron opinions
– Only the response to the statement “The amount of light in different areas of this gas station varies a lot” shows a statistically
significant difference
n.s. = no statistically significant differencebetween the three lighting installations
Average Agreement for
all Lightingn=109
Overall, the lighting in this gas station is comfortable (n.s.*)
97%
The lighting is too bright for pumping gas and checking my car (n.s.)
13%
The lighting is too dim for pumping gas and checking my car (n.s.)
8%
There is enough light to see under the hood of my car if I need to (n.s.)
93%
The lighting causes reflections that keep me from seeing well (n.s.)
10%
The amount of light in different areas of this gas station varies a lot (p<0.05)
32%
The light fixtures are too bright when seen from the street (n.s.)
8%
The lighting at this gas station attracted me to pull in (n.s.)
52%
The lighting at the gas station makes me feel safe (n.s.)
92%
Overall, the lighting in this gas station is attractive (n.s.) 88%
Statement
Original lighting
New Flat-lens lighting
New Drop-lens lighting
(n = 26) (n = 30) (n = 53)The amount of light in different areas of
this gas station varies a lot (p<0.05)15% 50% 32%
Statement
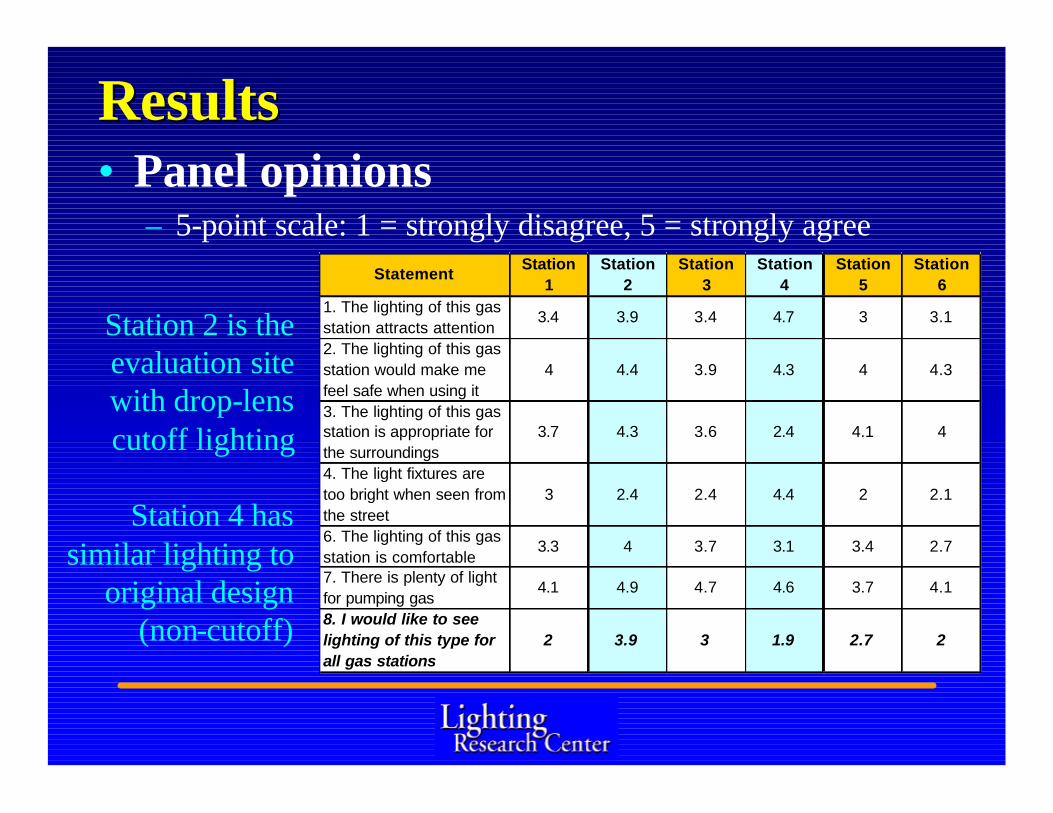
ResultsResults• Panel opinions
– 5-point scale: 1 = strongly disagree, 5 = strongly agreeStation Station Station Station Station Station
1 2 3 4 5 61. The lighting of this gas station attracts attention
3.4 3.9 3.4 4.7 3 3.1
2. The lighting of this gas station would make me feel safe when using it
4 4.4 3.9 4.3 4 4.3
3. The lighting of this gas station is appropriate for the surroundings
3.7 4.3 3.6 2.4 4.1 4
4. The light fixtures are too bright when seen from the street
3 2.4 2.4 4.4 2 2.1
6. The lighting of this gas station is comfortable
3.3 4 3.7 3.1 3.4 2.7
7. There is plenty of light for pumping gas
4.1 4.9 4.7 4.6 3.7 4.1
8. I would like to see lighting of this type for all gas stations
2 3.9 3 1.9 2.7 2
Statement
Station 2 is the evaluation sitewith drop-lens cutoff lighting
Station 4 has similar lighting to
original design (non-cutoff)
ResultsResults• Sales Data
– Given the variability, it would be premature to conclude that the changes in the lighting produce an increase in gas sales
– However, the data do suggest that a more comprehensive investigation of the relationship between gas sales and lightingconditions would be worthwhile
Means of Gallons Sold per Day Rolling Weeks Wed.-Tues.
May 2000 - May 2001
0.00
500.00
1000.00
1500.00
2000.00
2500.00
3000.00
3500.00
4000.00
4500.00
May 1 0
0
Jun 1 0
0
July 1
00
Aug 1
00
Sep 1
00Oct 1
00
Nov 1 0
0
Dec 1
00
Jan 1 0
1
Feb 1
01
Mar 01 0
1
Apr 01
01
May 01
01
Date
Mea
n G
allo
ns S
old
per
Day
(Wed
.-T
ues
.)
Last week before first luminaire change
Week following installation of Ruud flat lens
Week following installation of Ruud drop lens
DiscussionDiscussion• The photometric measurements are consistent with
the luminaire luminous intensity distributions
• The percentage of drivers turning into the gas station and the mean number of gallons of gas sold daily both show an increase for the two new lighting installations – merits further study
• The widespread use of the original lighting in gas stations is considered undesirable, probably because of its brightness and the consequent glare
AcknowledgementsAcknowledgements• The authors gratefully acknowledge:
– The financial support of Ruud Lighting and Northeast Utilities
– The willingness of F. L. Roberts and Company to allow one of the gas stations to be used as a site for this study
– The contributions of Karen Duffy of Ruud Lighting, Andy Dutko of F. L. Roberts and Company, Edgar Alejandro of Western Massachusetts Electric Company, and Ramesh Raghavan, Ujjaini Dasgupta, JananiRamanth, Chao Ling, Insiya Shakir, and Swapna Sundaram of the LRC