Page 1
An Evaporation Correction Approach and Its Characteristics
JIAMIN LI AND CHENGHAI WANG
Key Laboratory of Arid Climate Change and Disaster Reduction of Gansu Province, College of Atmospheric Sciences,
Lanzhou University, Lanzhou, China
(Manuscript received 6 October 2018, in final form 19 September 2019)
ABSTRACT
Evaporation is a principal factor in the hydrological cycle and energy exchange; however, estimations of
evaporation include large uncertainties. In this study, amodified estimation of evaporation based on empirical
linearly simplified Penman evaporation (PES) is proposed, soil moisture and precipitation are used to correct
the land surface evaporation estimation, and the temporal and spatial characteristics of the corrected evap-
oration (CE) are investigated globally. The results show that CE is strong at low latitudes and weak at high
latitudes. CE has obvious seasonal variation, ranging from 0.2 to 4.0mmday21; CE is prominent in summer
but feeble in winter. Compared to PES, CE is generally weaker inmost regions, especially in arid regions, with
differences of more than 9mmday21. CE agrees well with evaporation derived from FLUXNET-Model Tree
Ensemble (FLUXNET-MTE), MERRA, and GLDAS. In general, the root-mean-square error (RMSE)
between annual CE and FLUXNET-MTE is less than 0.2mmday21, and CE is about 5%–10% less than the
evaporation of FLUXNET-MTE. In the arid regions, the maximum CE almost occurs in the month with the
strongest precipitation; in the tropical regions, soil moisture enhances CE only when precipitation is less. In
the context of global temperature rise, PES always shows an apparent increasing trend due to thewater supply
is not considered; however, CE decreases in western Asia, the western United States, the Amazon basin, and
Central Africa, but weakly increases in the other study regions from 1984 to 2013. This study provides a
method for estimating evaporation considering more restrictive factors on evaporation.
1. Introduction
Evaporation acts as an exchange function for soil
moisture and air water vapor at the land–atmosphere
interface (Monteith 1965; Yan and Chen 1990; Ali
et al. 2008), and consumes more than half the solar
energy absorbed by the land (Kiehl and Trenberth
1997). It is a critical component when measuring the
underlying surface water balance and plays an im-
portant role in the global energy balance (Monteith
1965; Qian and Li 1996). There is a ‘‘complementarity’’
between the atmospheric and land moisture. In other
words, evaporation is a balance produced between at-
mospheric vapor and soil moisture (SM). In practice, the
problem of the accuracy of the evaporation estimation
seriously interferes with our understanding of the
hydrological cycle.
Evaporation is influenced by the water supply, dy-
namic and thermodynamic factors, and soil properties.
In general, in arid regions, evaporation is limited by
water, while in wet regions, evaporation is limited by
atmospheric demand. Obviously, estimations of evapo-
ration are affected by various factors in different re-
gions. In addition, some studies suggest that evaporation
cannot be measured directly from space at high resolu-
tion as a water variable; it must be physically derived as
an energy variable such as the latent heat flux (Fisher
et al. 2017). Accordingly, estimating evaporation is an
open issue because it is regulated by multiple factors
such as wind, temperature, specific humidity, soil, and
vegetation.
Due to the difficulties involved in acquiring actual
evaporation data, estimations of evaporation have
received much attention. Traditional methods for single-
point evaporation estimations include the Bowen ratio–
energy balance method (Bowen 1926), the Penman
method (Penman 1948), the aerodynamics method
(Pelton 1960), the eddy covariance method (Swinbank
1955), the Penman–Monteith method (Monteith 1965),
Denotes content that is immediately available upon publica-
tion as open access.
Corresponding author: Chenghai Wang, [email protected]
MARCH 2020 L I AND WANG 519
DOI: 10.1175/JHM-D-18-0211.1
� 2020 American Meteorological Society. For information regarding reuse of this content and general copyright information, consult the AMS CopyrightPolicy (www.ametsoc.org/PUBSReuseLicenses).
Unauthenticated | Downloaded 02/25/22 09:59 AM UTC
Page 2
and many other approaches that have expanded on the
Penman method (Wright 1982). The Penman method,
which is widely used in the estimation of potential evap-
oration, combines energetic and atmospheric drivers
(Fisher et al. 2011), but it does not consider explicit
vegetation and the heat exchange with the ground. At
coarse spatial–temporal scales, evaporation can be es-
timated using the water balance and hydrothermal
method, which integrates the water and heat, and as-
suming that precipitation is the only source of water.
However, while precipitation is the ultimate water
supply source, it is not the only source available for
evaporation; the soil can store antecedent precipitation
(Li et al. 2016a) and provide another possible source
for evaporation. SM can help improve evaporation
estimations (Entekhabi et al. 2010; Purdy et al. 2018)
because it represents the water supply conditions at the
evaporation surface and has a continuous impact on
evaporation. The results estimated by Li et al. (2016b)
indicate that the evapotranspiration values range from
4 to 6mmday21 in the Northern Hemisphere (NH) in
summer and even reach 8mmday21 in some regions.
However, the average annual evaporation calculated
via the water balance method is less than 3mmday21
in many regions of the NH. The large difference in
the calculation results indicates that further studies on
evaporation are necessary. Compared to other climatic
regions at the same latitude, the average temperature in
arid regions is higher and the SM content is lower. A
distinct characteristic of arid regions is a precipita-
tion deficiency. Insufficient precipitation further causes
water budget imbalances, and the water budget has a
significant impact on the hydrology of arid regions
(Thornthwaite 1948). There is abundant precipitation in
the tropical regions, which are important land water
vapor sources globally, and precipitation recycling is
strong there (Su et al. 2014).
This study explores a new global evaporation esti-
mation approach that considers the water supplies of
precipitation and SM based on a simplified Penman
method. Subsequently, the corrected approach is ex-
amined by comparing the results of the new approach to
those of the simplified Penman method and the tradi-
tional hydrothermal method which is calculated using
only the precipitation. The contributions of influential
evaporation factors in arid and humid regions as well as
the trend of evaporation for the period of 1984–2013 are
analyzed to improve our knowledge of the characteris-
tics and the variations in evaporation. These results can
benefit our deep understanding of hydrological cycle
characteristics and their variability.
This paper is organized as follows. Section 2 describes
the data, while section 3 proposes a corrected approach
for estimating evaporation. The characteristics of the
evaporation with the corrected approach are given in
section 4, and the evaluations of the evaporation esti-
mation compared to FLUXNET–Model Tree Ensemble
(FLUXNET-MTE), which is derived by empirical up-
scaling of eddy covariance measurements from a global
network of flux towers (FLUXNET), using a model tree
ensemble (MTE) approach (Jung et al. 2011), and re-
analysis data of Modern-Era Retrospective Analysis for
Research and Applications (MERRA) and the Global
Land Data Assimilation System (GLDAS) are shown.
An analysis of the influence factors is presented in
section 5. Section 6 shows the variations in the cor-
rected evaporation (CE) over the period of 1984–2013.
Discussions and conclusions are presented in section 7.
2. Data description and method
a. Data
Monthly global precipitation data from 1984 to 2013
with a horizontal resolution of 0.58 3 0.58 are obtained
from the Global Precipitation Climatology Centre
(GPCC); these data are based on quality-controlled data
from 67 200 stations worldwide with record duration of
10 years or longer. The surface net radiation flux, 2-m
dewpoint temperature, 2-m temperature, 0–7-cm volu-
metric soil water, specific humidity, and U and V com-
ponents of the wind data are obtained from the data
product of the European Center for Medium-Range
Weather Forecasts (ECMWF; ERA-Interim), which
exhibits good performance for the atmosphere water
budget and is commonly used in climate studies (e.g.,
Kauffeldt et al. 2015; Gao et al. 2014). The data cover
the period of 1984–2013 with a resolution of 1.58 3 1.58.Three main prevalent independent evaporation data-
sets, including FLUXNET,MERRA-Land, and GLDAS,
are used to evaluate CE. The FLUXNET dataset pro-
vides the evaporation through a global network of mi-
crometeorological tower sites based on eddy covariance
methods. The water flux is estimated by a machine-
learning algorithm in FLUXNET-MTE (Jung et al.
2011). The monthly data cover the period 1984–2011
with a spatial resolution of 0.58 3 0.58. The internal
cross-validation results show that the correlation co-
efficient between evaporation product of MTE and
FLUXNET sites data reaches r 5 0.91, and the simula-
tion results of Global Soil Wetness Project 2 (GSWP-2)
have significant correlations with FLUXNET-MTE
(r 5 0.91) (Jung et al. 2010). The evaporation is con-
verted by the FLUXNET-MTE latent heat by multi-
plying the inverse of the latent heat of vaporization. Due
to the spatial distribution of the observation sites of
520 JOURNAL OF HYDROMETEOROLOGY VOLUME 21
Unauthenticated | Downloaded 02/25/22 09:59 AM UTC
Page 3
FLUXNET-MTE is sparse in the deserts of northern
Africa and western Asia. The evaporation data from
the monthly MERRA-Land (horizontal resolution of
0.6678 3 0.58 in the meridional and zonal directions) and
GLDAS (18 3 18 grid) reanalysis datasets are also
used to compare the performance of the new method.
MERRA, assimilating recent satellite data from NASA
and in situ observations with quality control and error
corrections, can be regarded as a supplementary land
surface reanalysis in the estimation of land surface hy-
drology (Rienecker et al. 2011). The GLDAS evapora-
tion in the Community Land Model generates the
optimal fields of the land surface data by integrating
satellite and ground-based observational data prod-
ucts. Studies have reported that the MERRA evapo-
ration can well reflect the temporal and spatial variation
characteristics of global evaporation (Su and Feng
2015). The GLDAS evaporation is considered to be
reliable because the model forcing data, including pre-
cipitation, temperature, and radiation, are observed and
the models are physically based and subject to vigorous
evaluations (Gao et al. 2014; Zhang et al. 2017).
b. Penman estimation methods
The Penman evaporation (PE) proposed by Penman
(1948) considers the effects of heat (radiation) and dy-
namics (wind speed) on evaporation, as shown in Eq. (1):
PE5D
D1 g
(Rn)
l1
g
D1 g
6:43( fu)D
l, (1)
where PE is the potential open-water evaporation
(mmday21); Rn is the net radiation at the surface
(MJmday21); D is the slope of the saturation vapor
pressure curve (kPa 8C21); g is the psychrometric co-
efficient (kPa 8C21); l is the latent heat of vaporization
(MJ kg21); fu is the wind function; and D is the vapor
pressure deficit (kPa).
Valiantzas (2006) simplified the Penman equation
by computing the evaporation from readily available
measured data; this simple algebraic formula is equiv-
alent to the PE in accuracy. The simplified Penman
evaporation (PES) is computed as
PES’ 0:047RS
ffiffiffiffiffiffiffiffiffiffiffiffiffiffiffiffiT1 9:5
p2 2:4
�R
S
RA
�2
1 0:09(T1 20)
�12
RH
100
�, (2)
where Rs is the solar radiation (MJmday21), T is the air
temperature (8C) at 2m, RH is the relative humidity,
and RA is the extraterrestrial radiation. In Eq. (2), the
wind speed is set to be constant (2m s21); therefore,
discrepancies in PES will inevitably increase in regions
where the wind speed varies significantly. However, the
results of Valiantzas (2006) show that the relative error
in the estimation by Eq. (2) is small (only 4%) compared
to Eq. (1), which does not require wind speed data and
has a better calculation efficiency. The PE is a potential
evaporation method assumes the underlying surface is
sufficiently hydrated. In practice, the underlying surface
is complexly limited by the water supply, and the actual
evaporation is less than the PE. The actual evaporation
would be equal to the PE only when the water supply is
particularly sufficient.
3. An approach to estimating the evaporation
Equation (2) can be approximately regarded as the
Penman evaporation due to the small discrepancy
between the traditional Penman method and the PES.
In this study, PES is treated as the evaporation
capacity. Figure 1a shows the precipitation distribu-
tion. According to the general definition, there are
six main arid regions with less than 200mm of annual
precipitation throughout the world (the red boxes in
Fig. 1a). And three typical humid regions where the
annual precipitation is more than 1500mm are also
shown in Fig. 1a (the orange boxes). Figure 1b presents
the distribution of PES, illustrating that PES varies with
latitude and decreases toward high latitudes coinciding
with decreases in the temperature. The high latitudes
and the Tibetan Plateau are weak evaporation regions.
North Africa, western Asia, the western United States,
Australia, and southern Africa are regions with high
PES, more than 8.0mmday21, where there is less rain-
fall. The difference between the annual PES and pre-
cipitation is shown in Fig. 1c, which indicates that PES is
greater than the precipitation in most regions, especially
in China–Mongolia, central Asia, western Asia, North
Africa, the westernUnited States, western Namibia, and
northern Australia, which represent arid and semiarid
regions. These positive differences imply that the
evaporation capacity and the vapor condition are not
in balance and these regions retain their arid charac-
teristics without sufficient precipitation, which is dif-
ferent from the distribution of arid regions. This is
because the calculation of PES assumes that the un-
derlying surface is a water surface and that water vapor
can be provided continuously. The actual evaporation
should be less than PES due to the limited underlying
water supply.
In the hydrothermal balance method, precipitation
reflects the conditions of the land surface water supply.
Fu (1981a) proposed an estimation of the land sur-
face evaporation based on the evaporation capacity that
MARCH 2020 L I AND WANG 521
Unauthenticated | Downloaded 02/25/22 09:59 AM UTC
Page 4
FIG. 1. (a) Distribution of the total annual precipitation P (mm), (b) the open-water un-
derlying surface simplified Penman evaporation (PES; mmday21), and (c) the difference be-
tween the PES and precipitation calculated for the period of 1984–2013 (PES2 P; mmday21).
522 JOURNAL OF HYDROMETEOROLOGY VOLUME 21
Unauthenticated | Downloaded 02/25/22 09:59 AM UTC
Page 5
considers the effect of the moisture supply and the de-
gree of wetness in dry and humid climate regions:
ER’
8>>>><>>>>:
P
�PES
P2
1
m
�PES
P
�m�,
PES
P, 1, m5 2
PES
�P
PES2
1
m
�P
PES
�m�,
PES
P. 1, m5 3
,
(3)
where ER is the land surface evaporation, P is pre-
cipitation, and m is a characteristic parameter of the
underlying surface. Under humid climate conditions
(PES , P), m 5 2, and under dry climate conditions
(PES . P), m 5 3.
Equation (3) shows that, when the evaporation ca-
pacity (PES) is much larger than the precipitation, the
maximum ER is approximately equal to the precipita-
tion. According to the water balance, local simultaneous
precipitation is not the only water source for evapora-
tion; antecedent precipitation stored in the soil is also an
important factor that affects evaporation in a continuous
and slow process. Therefore, SM should be considered
in Eq. (3). Kelliher et al. (1995) and Su et al. (2014)
proposed to use SM to improve evaporation estimations.
The relationship between SM and potential evaporation
is thought to be linear for actual evaporation (Allen
et al. 1998; Walter et al. 2000). However, Fu (1981b)
suggested that evaporation from SM follows a compli-
cated process. The estimation of the actual evaporation
assumes that all the SM can evaporate into the atmo-
sphere (Li 2017); however, the important factor of SM
retention is ignored. According to Jung et al. (2010),
evaporation cannot continue with limited moisture in
the soil; furthermore, the air vapor pressure needs to be
less than the surface vapor pressure of the soil for water
vapor to be transported to the atmosphere via diffusion
or convection. Therefore, the water in the soil cannot be
completely evaporated into the atmosphere.
Studies suggest that the mean SM memory can reach
approximately 30 days in the NH (Dirmeyer et al. 2009;
Li et al. 2016a) and that the global time scale of the SM
evaporation can reach 42 days (Wang-Erlandsson et al.
2014). Therefore, land evaporation is defined as the sum of
ERand themonthly changes in SM,DSMi5 SMi112 SMi,
where DSMi indicates the changes in SM in the ith month.
When the value of SM is negative, the moisture in
the soil is assumed to evaporate into the atmosphere.
Considering the changes in soil moisture cannot be
completely used for evaporation, some of them could
also transfer to runoff or infiltration. To avoid over-
compensating, a coefficient C, which quantifies the sen-
sitivity of soil moisture to precipitation (Wei et al. 2008),
is adopted by using monthly average soil moisture ysmand precipitation yp:
c5ysm
yp
, (4)
where
yx5
1
n�n
i51
�1
xi
ffiffiffiffiffiffiffiffiffiffiffiffiffiffiffiffiffiffiffi(x
i2 x
i)2
q �, (5)
the x denotes soil moisture (sm) or precipitation (p).
The term xi is the monthly average of the variable x in
i month, and n is the number of months of 30 years;
xi is the average for n months.
The corrected evaporation (CE) is shown in Eq. (6):
CE5
�ER1cjDSMj , DSM, 0
ER, DSM$ 0. (6)
4. Characteristics of the evaporation using thecorrected approach
The annual and seasonal evaporation corrected by
the precipitation and the changes in SM are presented
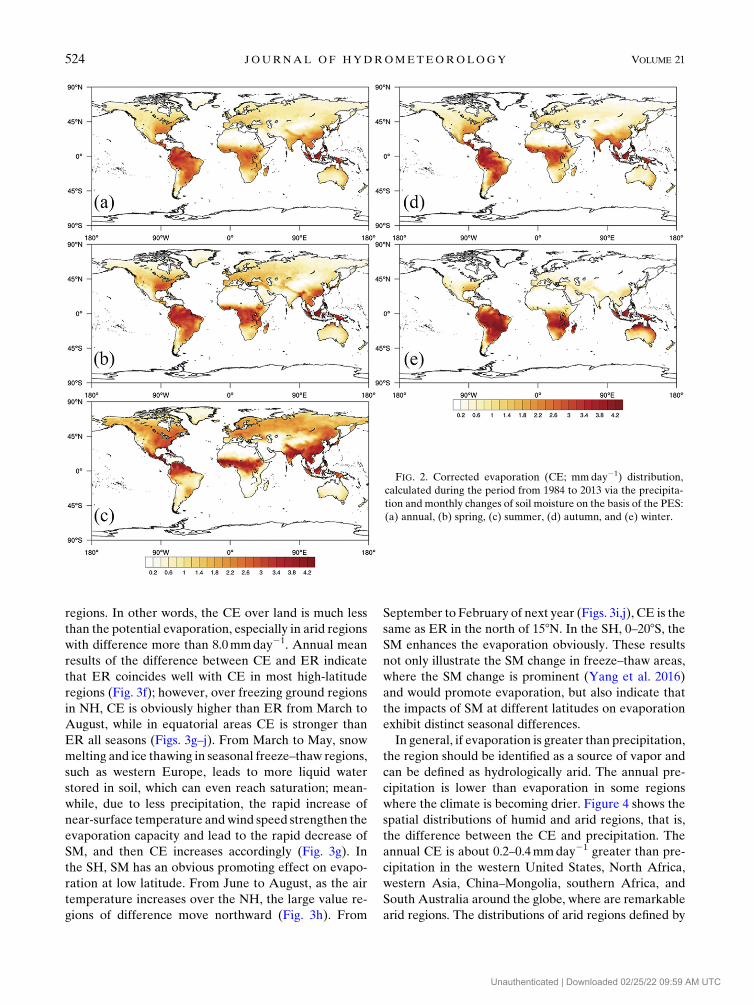
in Fig. 2. On an annual scale, CE is larger than
3.0mmday21 at 158S–158N but less than 1.4mmday21
at high latitudes, that is, 458–908N (Fig. 2a); the CE
has its minimum in arid and cold regions, less than
0.4mmday21, which might be attributed to less precip-
itation and lower temperatures. In terms of seasonal
variations, from March to May (Fig. 2b), the CE is
much stronger, approximately 2.2mmday21 in eastern
America, western Eurasia, and at low latitudes over the
NH, and it is more than 3.2mmday21 over the regions of
0–158S. From June to August (Fig. 2c), CE in most parts
of the NH reaches its maximum. It is larger than
2.6mmday21, except in arid regions. A conspicuous
feature of CE is that it is small in North Africa, western
Asia, and northwestern China, which are prominent arid
regions. In most of the land areas at south of 158S, CE is
less than 0.6mmday21. From September to November
(Fig. 2d), CE decreases in the NH but increases in the
Southern Hemisphere (SH). The largest CE is shown at
208S–108N and on the eastern coasts of China, where
precipitation is abundant, and the temperature is higher
than in the high-latitude zone. Inmost of theNH, theCE
from December to February of next year is less, which
is nearly zero (Fig. 2e). In most regions of SH, CE
is greater than 3.2mmday21 except in arid regions. CE is
stronger in summer and weaker in winter. Compared to
PES, CE obviously differs on annual and seasonal scales
(Figs. 3a–e). In particular, large differences occur in arid
MARCH 2020 L I AND WANG 523
Unauthenticated | Downloaded 02/25/22 09:59 AM UTC
Page 6
regions. In other words, the CE over land is much less
than the potential evaporation, especially in arid regions
with difference more than 8.0mmday21. Annual mean
results of the difference between CE and ER indicate
that ER coincides well with CE in most high-latitude
regions (Fig. 3f); however, over freezing ground regions
in NH, CE is obviously higher than ER from March to
August, while in equatorial areas CE is stronger than
ER all seasons (Figs. 3g–j). From March to May, snow
melting and ice thawing in seasonal freeze–thaw regions,
such as western Europe, leads to more liquid water
stored in soil, which can even reach saturation; mean-
while, due to less precipitation, the rapid increase of
near-surface temperature andwind speed strengthen the
evaporation capacity and lead to the rapid decrease of
SM, and then CE increases accordingly (Fig. 3g). In
the SH, SM has an obvious promoting effect on evapo-
ration at low latitude. From June to August, as the air
temperature increases over the NH, the large value re-
gions of difference move northward (Fig. 3h). From
September to February of next year (Figs. 3i,j), CE is the
same as ER in the north of 158N. In the SH, 0–208S, theSM enhances the evaporation obviously. These results
not only illustrate the SM change in freeze–thaw areas,
where the SM change is prominent (Yang et al. 2016)
and would promote evaporation, but also indicate that
the impacts of SM at different latitudes on evaporation
exhibit distinct seasonal differences.
In general, if evaporation is greater than precipitation,
the region should be identified as a source of vapor and
can be defined as hydrologically arid. The annual pre-
cipitation is lower than evaporation in some regions
where the climate is becoming drier. Figure 4 shows the
spatial distributions of humid and arid regions, that is,
the difference between the CE and precipitation. The
annual CE is about 0.2–0.4mmday21 greater than pre-
cipitation in the western United States, North Africa,
western Asia, China–Mongolia, southern Africa, and
South Australia around the globe, where are remarkable
arid regions. The distributions of arid regions defined by
FIG. 2. Corrected evaporation (CE; mmday21) distribution,
calculated during the period from 1984 to 2013 via the precipita-
tion and monthly changes of soil moisture on the basis of the PES:
(a) annual, (b) spring, (c) summer, (d) autumn, and (e) winter.
524 JOURNAL OF HYDROMETEOROLOGY VOLUME 21
Unauthenticated | Downloaded 02/25/22 09:59 AM UTC
Page 7
FIG. 3. (left) Difference between CE and PES (CE2 PES; mmday21) and (right) difference between CE and ER (CE2ER; mmday21)
for (a),(f) annual, (b),(g) spring, (c),(h) summer, (d),(i) autumn, and (e),(j) winter.
MARCH 2020 L I AND WANG 525
Unauthenticated | Downloaded 02/25/22 09:59 AM UTC
Page 8
the differences between CE and precipitation basically
agree with previous definitions of arid regions (Hulme
1996; Kocurek 1998; Thomas 1997). This agreement
implies that the corrected approach reasonably repre-
sents the land evaporation and can distinguish between
dry and wet regions.
5. Preliminary verification of the correctedevaporation estimation
To evaluate the annual performance of the CE, the
root-mean-square errors (RMSEs) between CE and the
FLUXNET-MTE, MERRA, and GLDAS evaporation
are calculated:
RMSE5
ffiffiffiffiffiffiffiffiffiffiffiffiffiffiffiffiffiffiffiffiffiffiffiffiffiffi�m
j51
(CE2E)2
m
vuuut, (7)
where E is the evaporation in FLUXNET-MTE,
MERRA, or GLDAS and m is the number of mea-
surements (number of years). The RMSE represents
the deviation between CE and the FLUXNET-MTE,
MERRA, or GLDAS evaporation values.
a. Comparison between CE and evaporation in theFLUXNET-MTE, MERRA, and GLDAS
Figure 5 shows the RMSE and bias ratio between
evaporation of FLUXNET-MTE,MERRA, andGLDAS
and CE, PES, respectively. The RMSE between
FLUXNET-MTE and CE is about 0.2mmday21 in most
areas, and is larger at lower latitude at 58S–58N, more
than 0.4mmday21 (Fig. 5a). In most mid- to high lati-
tudes, the RMSE between CE and MERRA is less than
0.3mmday21, indicating that CE is consistent with
evaporation ofMERRA (Fig. 5b). In lower latitudes (58S–58N), where the annual CE is more than 3.4mmday21,
the RMSE is approximately 1.0mmday21. The RMSE
between CE and GLDAS is less than 0.3mmday21 in
most areas but is more than 0.7mmday21 at lower lati-
tudes (Fig. 5c), indicating that there is a slight bias in
CE and evaporation of GLDAS at low latitudes. The
annual CE variation coincides well with FLUXNET-
MTE globally and closes to the evaporation of GLDAS
and MERRA in most regions, the evaporation of
MERRA is greater than GLDAS. Correspondingly,
the RMSE between PES and FLUXNET-MTE is around
2.0–3.0mmday21 over the nonarid regions. In southern
Africa, Australia, western Asia, and the western United
States, RMSE is more than 6.0mmday21 (Fig. 5d). It
notes that the RMSEs between PES and evaporation of
MERRA and GLDAS are greater than 6.0mmday21 in
North Africa, and are about 3.0–4.0mmday21 in the
middle and low latitude (Figs. 5e,f). Compared with
Figs. 5a–c, the RMSEs showed in Figs. 5d–f are one
order of magnitude as large as those RMSEs calculated
by CE. It means that CE is much better coincide with
the evaporation products.
Figure 5g illustrates that, inmost regions of the globe, the
bias between CE and FLUXNET-MTE is about 210%.
The difference between CE and FLUXNET-MTE
is small. However, the bias ratio between PES and
FLUXNET-MTE is more than 100%, even more than
400% in the arid regions (Fig. 5h). The evaporation
calculated by the corrected approach is evidently im-
proved, compared to the PES. It is suggested that the
estimation of CE can show the characteristics of land
evaporation distribution and variation reasonably.
b. The monthly variation in CE and meteorologicalfactors
To further examine how reasonable the CE is, factors
affecting and changing the characteristics of evaporation
in arid and humid regions are investigated. The defini-
tion of arid regions proposed by Hulme (1996) and
Kocurek (1998) applies to regions with the annual pre-
cipitation of less than 200mm. Most arid regions re-
sult from the descending movement of the meridional
Hadley circulation in subtropical areas. Some arid re-
gions can be attributed to areas where it is difficult to
achieve vapor convergence due to their long distance
from an ocean or their large topographic relief (Voice
and Hunt 1984; Qian et al. 2017). On the contrary, the
convection is strong and the moisture in the atmosphere
is sufficient in tropical regions, where the annual rainfall
is more than 1500mm.
To examine the dominant factors in arid and humid
regions, Fig. 6 shows the monthly variation of SM, pre-
cipitation, the vapor pressure deficit (VPD) indicating
the air saturation condition, the difference between the
ground and air temperatures Ts 2 T, and the 2-m air
FIG. 4. Annual difference between CE and precipitation
(mmday21), i.e., CE minus precipitation.
526 JOURNAL OF HYDROMETEOROLOGY VOLUME 21
Unauthenticated | Downloaded 02/25/22 09:59 AM UTC
Page 9
temperature T. In the China–Mongolia arid region
(Fig. 6a), precipitation is more than 25mm from June to
August. In spring, the temperature starts to rise, and the
ice in the soil starts to thaw. The SM peaks in March.
Evaporation causes SM to decrease slightly from April
to September. Figure 6a shows that the VPD, which
dominates evaporation, is always greater than 0hPa; in
particular, it is stronger than 10 hPa from June to
August, which implies that the evaporation capacity is
strong during this period. The greater the VPD, the
greater the evaporation will be while water resources
are sufficient.
In the North Africa arid region (Fig. 6b), precipitation
is low and SM is small. Precipitation is primarily con-
centrated in the period from July to September. SM
changes little over the entire year but decreases slightly
in September. Further, Fig. 6b shows that temperature
and VPD are positive all year in this region. Warming
and drought environmental conditions maintain strong
evaporation capacity; however, due to insufficient
water resources, the actual evaporation is small. In
western Asia (Fig. 6c), where the climate is similar to a
Mediterranean climate, precipitation is primarily con-
centrated in winter and spring, and the minimums
in precipitation occur in June. SM decreases during
March–July, and at its minimum in July. Note that VPD,
temperature, and the difference between the ground and
air temperatures are positive over the entire year, im-
plying that the evaporation capacity is strong; however,
SM and precipitation are insufficient, causing the amount
of actual evaporation to be small. Compared to the other
three arid regions in the NH, there is more precipitation
in the western United States, especially from July to
September, more than 50mm (Fig. 6d). SM starts to de-
crease fromMarch to June, when the surface temperature
is higher than 08C and theVPD is strong, which illustrates
that the evaporation capacity is strong; then, the SM
maintains a low value. Due to the high precipitation from
July to September, the SM correspondingly begins to
increase, and then SM decreases as precipitation de-
creases again. In the arid regions of the SH (Figs. 6e,f),
the temperature is always higher than 08C, and VPD is
stronger than 0hPa in all months. The precipitation in
Australia from November to March in next year is more
than 10mm; SM decreases from March to April and in
August, and the CE is much stronger. In southern Africa,
precipitation is concentrated in the period from January
to March; SM decreases from April to June.
In low-latitude humid regions, such as the Amazon
basin, Central Africa, and southeast China (Figs. 6g–i),
FIG. 5. The RMSE (mmday21) and bias ratio between evaporation of independent datasets and CE and PES, respectively. (a)–(c) The
RMSE between CE and evaporation of FLUXNET-MTE, MERRA, GLDAS, (d)–(f) the RMSE between PES and evaporation of
FLUXNET-MTE, MERRA, GLDAS, and (g),(h) the bias ratio (CE and PES minus FLUXNET-MTE divided by FLUXNET-MTE,
respectively).
MARCH 2020 L I AND WANG 527
Unauthenticated | Downloaded 02/25/22 09:59 AM UTC
Page 10
the annual rainfall exceeds 1500mm and the soil mois-
ture is sufficient. From June to September in the
Amazon basin, precipitation is small and SMdecreases.
In Central Africa, the precipitation is less from both
June to August and from December to February, the
SM decreases in the same period, which implies more
evaporation occurring. Similarly, there is more pre-
cipitation in southeast China in summer. The temper-
ature is always higher than 208C throughout the year in
the Amazon basin and Central Africa, and it is more
than 258C in summer in southeast China, the high
temperature appears to benefit to evaporate. However,
in these humid regions, VPD is always nearly 4 hPa,
which is smaller than arid regions, and surface tem-
peratures are smaller than air temperature, apparently,
the evaporation capacity would be restrained.
Figure 7 shows the monthly evaporation of PES, ER,
and CE. In China–Mongolia (Fig. 7a), PES is much
stronger than CE. The largest difference between CE
and ER appears in April and June. The SM increases
and then reaches its maximum in March, afterward,
because of the increasing evaporation capacity, SM de-
creases rapidly, and CE becomes stronger, especially
in May (Fig. 6a). The precipitation in North Africa
(Fig. 7b) is less than that in other arid regions, and
evaporation is less because of the limited water supply
there. CE is maximal in the month with the most pre-
cipitation, August. From February to June in western
Asia, the transportation of SM into the atmosphere
enhances the evaporation. In April, the SM contribution
to CE is at its maximum for the year. This result is due to
the large amount of precipitation in March (Fig. 6c). In
the western United States (Fig. 7d), CE is strong from
August toOctober, more than 1.5mmday21. InAustralia
and southern Africa, the SM decreases in autumn and
winter, in this period, the loss of SM is conducive to the
evaporation (Figs. 7e,f). Figure 7 also indicates that there
is a large difference between the CE and the PES in the
arid regions. In the humid regions (Figs. 7g–i), the dif-
ference betweenCEand PES,which ismuch smaller than
arid regions, is about 1mmday21. In these humid regions,
the monthly variation of CE is consistent with the varia-
tion of precipitation; it means that CE in humid regions is
also sensitive to the water supply. It is worth noting that
the increasing and decreasing trend of CE is contrary to
PES in the tropical humid regions such as the Amazon
basin andCentralAfrica. This phenomenonmay be similar
to the Budyko hypothesis, namely, if the energy condi-
tion is constant, the potential evaporation will decrease
as the precipitation increases (Su and Feng 2015).
Figures 6 and 7 show that SMpromotes CE onemonth
later than the precipitation increase in arid regions;
FIG. 6. Monthly variation in the factors affecting evaporation, SM (mm; white bar), P (mm; black bar), VPD (hPa; circle line),
T (8C; square line), and Ts 2 T (8C; triangle line) over (a) China–Mongolia, (b) North Africa, (c) western Asia, (d) the western United
States, (e) Australia, (f) southern Africa, (g) the Amazon basin, (h) Central Africa, and (i) southeast China.
528 JOURNAL OF HYDROMETEOROLOGY VOLUME 21
Unauthenticated | Downloaded 02/25/22 09:59 AM UTC
Page 11
somewhat differently, SM enhances the CE when pre-
cipitation in the humid region is less. There is less SM in
arid regions, and only more precipitation would increase
SM; however, due to the strong potential evaporation,
then SM will be quickly evaporated. In the tropics,
abundant precipitation provides sufficient moisture
for evaporation; when the precipitation decreases, soil
moisture can transfer to the atmosphere gradually.
6. Changes in CE and PES over the last 30 years
Global temperature has increased over the last
30 years (Guan et al. 2017). To investigate the changes in
evaporation with temperature increase, Fig. 8 shows
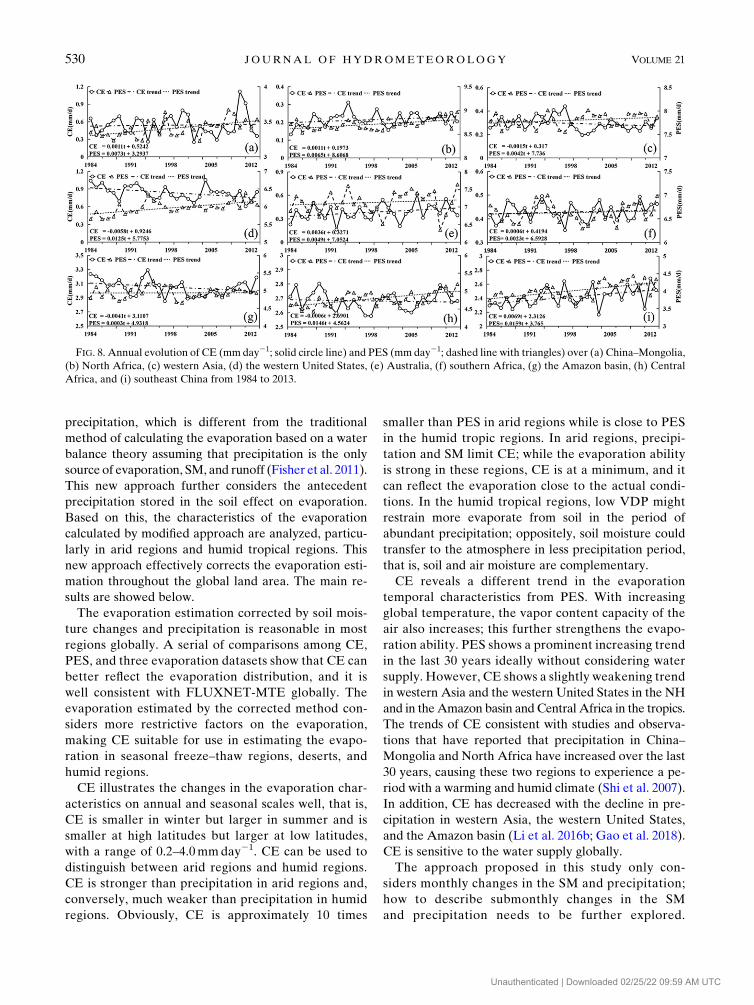
that, in the last 30 years from 1984 to 2013, there
are different changes in CE and PES. CE has a weakly
increasing trend in China–Mongolia (Fig. 8a), North
Africa (Fig. 8b), Australia (Fig. 8e), southern Africa
(Fig. 8f), and southeast China (Fig. 8i) for 4.02, 4.02, 13.1,
2.19, and 25.19mmdecade21, respectively. However, the
increasing trends of CE are much smaller than those of
PES. The CE decreases in western Asia (Fig. 8c), the
western United States (Fig. 8d), the Amazon basin
(Fig. 8g) and Central Africa (Fig. 8h), and the annual
variability rates of CE are 25.48, 221.17, 214.97,
and 22.19mmdecade21, however, PES has an increas-
ing trend. CE in arid regions ranges from 0.1 to
1.2mmday21 and in humid regions CE ranges from
2.2 to 3.5mmday21. PES significantly increases
in these study regions; the maximum trend is
45.63mmdecade21 in western Asia, and the minimum
trend is 1.10mmdecade21 in the Amazon basin.
Previous studies have shown that the annual pre-
cipitation has increased in North Africa and China–
Mongolia but has decreased in western Asia and the
Amazon basin (Li et al. 2016b; Gao et al. 2018), which
implies that the CE trend might be more related to
precipitation. PES primarily depends on the radiation,
temperature, and VPD, which assume that the under-
lying surface is pure water; CE, however, is also af-
fected by the realistic water supply in the underlying
land surface. PES is an indicator of how much solar
energy a region receives, rather than the change in the
water content. The changes in CE are relatively com-
plex processes. The difference between PES and CE
illustrates that the evaporation ability is not the de-
termining factor that affects the land evaporation and
that the wetness degree of the underlying surface needs
to be considered. Further studies on other factors such
as wind and the vapor pressure deficit will be discussed
in future studies.
7. Discussion and conclusions
This study proposed a new modified approach for
an evaporation estimation using SM changes and
FIG. 7. Monthly variation of the three different evaporation models over (a) China–Mongolia, (b) North Africa, (c) western Asia,
(d) the western United States, (e) Australia, (f) southern Africa, (g) the Amazon basin, (h) Central Africa, and (i) southeast China (ER,
mmday21, white bar; CE, mmday21, black bar; PES, mmday21, solid circle line).
MARCH 2020 L I AND WANG 529
Unauthenticated | Downloaded 02/25/22 09:59 AM UTC
Page 12
precipitation, which is different from the traditional
method of calculating the evaporation based on a water
balance theory assuming that precipitation is the only
source of evaporation, SM, and runoff (Fisher et al. 2011).
This new approach further considers the antecedent
precipitation stored in the soil effect on evaporation.
Based on this, the characteristics of the evaporation
calculated by modified approach are analyzed, particu-
larly in arid regions and humid tropical regions. This
new approach effectively corrects the evaporation esti-
mation throughout the global land area. The main re-
sults are showed below.
The evaporation estimation corrected by soil mois-
ture changes and precipitation is reasonable in most
regions globally. A serial of comparisons among CE,
PES, and three evaporation datasets show that CE can
better reflect the evaporation distribution, and it is
well consistent with FLUXNET-MTE globally. The
evaporation estimated by the corrected method con-
siders more restrictive factors on the evaporation,
making CE suitable for use in estimating the evapo-
ration in seasonal freeze–thaw regions, deserts, and
humid regions.
CE illustrates the changes in the evaporation char-
acteristics on annual and seasonal scales well, that is,
CE is smaller in winter but larger in summer and is
smaller at high latitudes but larger at low latitudes,
with a range of 0.2–4.0mmday21. CE can be used to
distinguish between arid regions and humid regions.
CE is stronger than precipitation in arid regions and,
conversely, much weaker than precipitation in humid
regions. Obviously, CE is approximately 10 times
smaller than PES in arid regions while is close to PES
in the humid tropic regions. In arid regions, precipi-
tation and SM limit CE; while the evaporation ability
is strong in these regions, CE is at a minimum, and it
can reflect the evaporation close to the actual condi-
tions. In the humid tropical regions, low VDP might
restrain more evaporate from soil in the period of
abundant precipitation; oppositely, soil moisture could
transfer to the atmosphere in less precipitation period,
that is, soil and air moisture are complementary.
CE reveals a different trend in the evaporation
temporal characteristics from PES. With increasing
global temperature, the vapor content capacity of the
air also increases; this further strengthens the evapo-
ration ability. PES shows a prominent increasing trend
in the last 30 years ideally without considering water
supply. However, CE shows a slightly weakening trend
in western Asia and the western United States in the NH
and in theAmazon basin and Central Africa in the tropics.
The trends of CE consistent with studies and observa-
tions that have reported that precipitation in China–
Mongolia and North Africa have increased over the last
30 years, causing these two regions to experience a pe-
riod with a warming and humid climate (Shi et al. 2007).
In addition, CE has decreased with the decline in pre-
cipitation in western Asia, the western United States,
and the Amazon basin (Li et al. 2016b; Gao et al. 2018).
CE is sensitive to the water supply globally.
The approach proposed in this study only con-
siders monthly changes in the SM and precipitation;
how to describe submonthly changes in the SM
and precipitation needs to be further explored.
FIG. 8. Annual evolution of CE (mmday21; solid circle line) and PES (mmday21; dashed line with triangles) over (a) China–Mongolia,
(b) North Africa, (c) western Asia, (d) the western United States, (e) Australia, (f) southern Africa, (g) the Amazon basin, (h) Central
Africa, and (i) southeast China from 1984 to 2013.
530 JOURNAL OF HYDROMETEOROLOGY VOLUME 21
Unauthenticated | Downloaded 02/25/22 09:59 AM UTC
Page 13
In addition, other paths that water can take to evap-
oration, such as surface runoff and groundwater flow,
remain unexplored.
Acknowledgments. This work is supported by the National
Natural Science Foundation of China (41661144017,
91837205, 41801015, and 41471034) and the Foundation
for Excellent Young Scholars of Northwest Institute
of Eco-Environment and Resources NIEER, Chinese
Academy of Sciences, (51Y851D61).
REFERENCES
Ali, S., N. C. Ghosh, and R. Singh, 2008: Evaluating best evapo-
ration estimate model for water surface evaporation in semi-
arid region, India. Hydrol. Processes, 22, 1093–1106, https://
doi.org/10.1002/hyp.6664.
Allen, R. G., L. S. Pereira, D. Raes, and M. Smith, 1998: Crop
evapotranspiration: Guidelines for computing crop water re-
quirements. FAO Irrigation and Drainage Paper 56, 300 pp.,
http://www.fao.org/3/X0490E/X0490E00.htm.
Bowen, I. S., 1926: The ratio of heat losses by conduction and
evaporation from any water surface. Phys. Rev., 27, 779–787,
https://doi.org/10.1103/PhysRev.27.779.
Dirmeyer, P. A., C. A. Schlosser, and K. L. Brubaker, 2009:
Precipitation, recycling, and land memory: An integrated
analysis. J. Hydrometeor., 10, 278–288, https://doi.org/10.1175/
2008JHM1016.1.
Entekhabi, D., and Coauthors, 2010: The Soil Moisture Active
Passive (SMAP) mission. Proc. IEEE, 98, 704–716, https://
doi.org/10.1109/JPROC.2010.2043918.
Fisher, J. B., R. J. Whittaker, and Y. Malhi, 2011: ET come
home: Potential evapotranspiration in geographical ecol-
ogy. Global Ecol. Biogeogr., 20, 1–18, https://doi.org/
10.1111/j.1466-8238.2010.00578.x.
——, and Coauthors, 2017: The future of evapotranspiration:
Global requirements for ecosystem functioning, carbon and
climate feedbacks, agricultural management, and water re-
sources. Water Resour. Res., 53, 2618–2626, https://doi.org/
10.1002/2016WR020175.
Fu, B. P., 1981a: On the calculation of the evaporation from land
surface. Sci. Atmos. Sin., 5, 25–33, https://doi.org/10.3878/
j.issn.1006-9895.1981.01.03.
——, 1981b: On the calculation of evaporation from soil. Acta
Meteor. Sin., 39, 226–236.
Gao, S., and Coauthors, 2018: Time-spatial distribution of rainfall
and runoff in Amazon Basin. Shuiwen, 38, 90–96.
Gao, Y., C. Lan, andY. Zhang, 2014: Changes in moisture flux over
the Tibetan Plateau during 1979–2011 and possible mecha-
nisms. J. Climate, 27, 1876–1893, https://doi.org/10.1175/JCLI-
D-13-00321.1.
Guan, X., J. Huang, and R. Guo, 2017: Changes in aridity in re-
sponse to the global warming hiatus. J. Meteor. Res., 31, 117–
125, https://doi.org/10.1007/s13351-017-6038-1.
Hulme, M., 1996: Recent climate changes in the world’s dryland.
Geophys. Res. Lett., 23, 61–64, https://doi.org/10.1029/95GL03586.
Jung, M., and Coauthors, 2010: Recent decline in the global
land evapotranspiration trend due to limited moisture supply.
Nature, 467, 951–954, https://doi.org/10.1038/nature09396.
——, and Coauthors, 2011: Global patterns of land-atmosphere
fluxes of carbon dioxide, latent heat, and sensible heat derived
from eddy covariance, satellite, and meteorological observa-
tions. J. Geophys. Res., 116, G00J07, https://doi.org/10.1029/
2010JG001566.
Kauffeldt, A., S. Halldin, F. Pappenberger, F. Wetterhall, C.-Y. Xu,
and H. L. Cloke, 2015: Imbalanced land surface water budgets
in a numerical weather prediction system. Geophys. Res. Lett.,
42, 4411–4417, https://doi.org/10.1002/2015GL064230.
Kelliher, F. M., R. Leuning, M. R. Raupach, and E.-D. Schulze,
1995: Maximum conductances for evaporation from global
vegetation types.Agric. For. Meteor., 73, 1–16, https://doi.org/
10.1016/0168-1923(94)02178-M.
Kiehl, J. T., and K. E. Trenberth, 1997: Earth’s annual global mean
energy budget. Bull. Amer. Meteor. Soc., 78, 197–208, https://
doi.org/10.1175/1520-0477(1997)078,0197:EAGMEB.2.0.CO;2.
Kocurek, G., 1998: Sedimentary geology.Arid Zone Geomorphology:
Process, Form and Change in Drylands, 2nd ed. D. S. G.
Thomas, Ed., John Wiley and Sons, 732 pp.
Li, R. L., 2017: The changing precipitation conversion and recycle
and changes over Northern Hemispheric arid regions under
global warming. Ph.D. dissertation, LanzhouUniversity, 130 pp.
——, H. Bao, L. I. Kechen, and C. Wang, 2016a: The memory and
climate effects of global soil moisture. J. Glaciol. Geocryol.,
38, 1470–1481.——, C. Wang, and D. Wu, 2016b: Changes in precipitation re-
cycling over arid regions in the Northern Hemisphere. Theor.
Appl. Climatol., 131, 489–502, https://doi.org/10.1007/S00704-
016-1978-4.
Monteith, J. L., 1965: Evaporation and environment. Symp. Soc.
Exp. Biol., 19, 205–234.
Pelton, W. L. E. A., 1960: An evaluation of the thornthwaite and
mean temperature methods for determining potential evapo-
transpiration. Agron. J., 52, 387–395, https://doi.org/10.2134/
agronj1960.00021962005200070006x.
Penman, H. L., 1948: Natural evaporation from open water, hare
soil and grass. Proc. Roy. Soc. London,A193, 120–145, https://
doi.org/10.1098/RSPA.1948.0037.
Purdy, A. J., J. B. Fisher, M. L. Goulden, A. Colliander,
G. Halverson, K. Tu, and J. S. Famiglietti, 2018: SMAP soil
moisture improves global evapotranspiration. Remote Sens.
Environ., 219, 1–14, https://doi.org/10.1016/j.rse.2018.09.023.
Qian, X., and X. Li, 1996: The review of calculating methods for
the evaporation from land surface. Hydrology, 6, 24–31.
Qian, Z., M. Song, W. U. Tongwen, and Y. Cai, 2017: Review of
advances in world dryland climate research (II):main investi-
gation progress. Plateau Meteor., 36, 1457–1476.Rienecker, M. M., and Coauthors, 2011: MERRA: NASA’s
Modern-Era Retrospective Analysis for Research and
Applications. J. Climate, 24, 3624–3648, https://doi.org/
10.1175/JCLI-D-11-00015.1.
Shi, Y., Y. Shen, E. Kang, D. Li, Y. Ding, G. Zhang, and R. Hu,
2007: Recent and future climate change in northwest China.
Climatic Change, 80, 379–393, https://doi.org/10.1007/s10584-
006-9121-7.
Su, T., and G. L. Feng, 2015: Spatial-temporal variation charac-
teristics of global evaporation revealed by eight reanalyses.
Sci. China Earth Sci., 58, 255–269, https://doi.org/10.1007/
s11430-014-4947-8.
——, Z. Y. Lu, Z. Jie, H. Wei, L. Yue, and T. Gang, 2014: Spatial
distribution and seasonal variation characteristics of global
atmospheric moisture recycling. Acta Phys. Sin., 63, 099201,
https://doi.org/10.7498/aps.63.099201.
Swinbank, W. C., 1955: An experimental study of eddy trans-
ports in the lower atmosphere. Division of Meteorological
MARCH 2020 L I AND WANG 531
Unauthenticated | Downloaded 02/25/22 09:59 AM UTC
Page 14
Physics Tech. Paper, CSIRO, 30 pp., https://doi.org/10.4225/
08/585972bb34df5.
Thomas, D. S. G., 1997: Arid Zone Geomorphology: Processes,
Form and Change in Drylands. 2nd ed. Wiley, 732 pp.
Thornthwaite, C. W., 1948: An approach toward a rational classi-
fication of climate. Geogr. Rev., 38, 55–94, https://doi.org/
10.2307/210739.
Valiantzas, J. D., 2006: Simplified versions for the penman evap-
oration equation using routine weather data. J. Hydrol., 331,
690–702, https://doi.org/10.1016/j.jhydrol.2006.06.012.
Voice, M. E., and B. G. Hunt, 1984: A study of the dynamics of
drought initiation using a global general circulation model.
J. Geophys. Res., 89, 9504–9520, https://doi.org/10.1029/
JD089iD06p09504.
Walter, I. A., and Coauthors, 2000: ASCE’s standardized reference
evapotranspiration equation. Proc. Fourth National Irrigation
Symp., Phoenix, AZ, ASAE, 209–215.
Wang-Erlandsson, L., R. J. van der Ent, L. J. Gordon, andH. H. G.
Savenije, 2014: Contrasting roles of interception and transpi-
ration in the hydrological cycle–Part 1: Temporal characteristics
over land. Earth Syst. Dyn., 5, 441–469, https://doi.org/10.5194/
esd-5-441-2014.
Wei, J. F., P. A. Dirmeyer, and Z. C. Guo, 2008: Sensitivities of soil
wetness simulation to uncertainties in precipitation and radi-
ation.Geophys. Res. Lett., 35, L15703, https://doi.org/10.1029/
2008GL034494.
Wright, J. L. 1982: New evapotranspiration crop coefficients.
J. Irrig. Drain. Div., 108, 57–74, https://doi.org/10.1023/a:
1026507916353.
Yan, B., and J. Chen, 1990: Two-dimensional numerical analysis
for evaporation process of the bare soil. Acta Ecol. Sin., 10,
291–298, https://doi.org/CNKI:SUN:STXB.0.1990-04-000.
Yang, K., C. Wang, and H. Bao, 2016: Contribution of soil
moisture variability to summer precipitation in the Northern
Hemisphere. J. Geophys. Res. Atmos., 121, 12 108–12 124,https://doi.org/10.1002/2016JD02564.
Zhang, C., Q. Tang, and D. Chen, 2017: Recent changes in the
moisture source of precipitation over the Tibetan Plateau.
J. Climate, 30, 1807–1819, https://doi.org/10.1175/JCLI-D-
15-0842.1.
532 JOURNAL OF HYDROMETEOROLOGY VOLUME 21
Unauthenticated | Downloaded 02/25/22 09:59 AM UTC