John D. Wasserman, Ph.D. February 21, 2013 Distinguished Lecture Series SMU Gifted Students Institute ACS School of Educ. and Human Development Dallas/Plano, Texas An Evidence-based Comparison of Cognitive Ability & Intelligence Tests in Identification of Gifted Learners
Transcript
John D. Wasserman, Ph.D.
February 21, 2013 Distinguished Lecture Series SMU Gifted Students Institute
ACS School of Educ. and Human Development Dallas/Plano, Texas
An Evidence-based Comparison of Cognitive Ability & Intelligence Tests in
Identification of Gifted Learners
Purpose of this Presentation
Introduce the concept of application-centered psychometrics Provide you with evidence-based
information to enable you to make more informed decisions about ability and intelligence test usage with gifted learners Provide an independent, objective
alternative to test authors/publishers test presentations and promotions
Sources of Evidence
Test technical manuals and supplemental test materials from test publishers Both published and unpublished
studies, as noted There are exceptionally few
studies directly comparing tests, as they serve the gifted
Additional Resources
Some of the information in this presentation may also be found in two chapters by Wasserman in Off the Charts: Asynchrony and the Gifted Child (2013) available from Royal Fireworks Press
Available from http://www.rfwp.com
Additional Resources
Relevant fundamental psychometrics are discussed in a Wasserman & Bracken chapter in Handbook of Psychology, 2nd ed. (2013)
Available from http://www.wiley.com/ or http://online library.wiley.com
In descending order of usage (Robertson et al., 2011) Seven Intelligence Tests Considered
1. Wechsler Intelligence Scales for Children (WISC-IV; Wechsler, 2003a, 2003b)
2. Woodcock-Johnson Tests of Cognitive Abilities (WJ III NU Cog; Woodcock, McGrew, & Mather, 2001, 2007)
1. Cognitive Abilities Test (CogAT Form 7; Lohman, 2012)
2. Otis-Lennon School Ability Test (OLSAT 8th edition; Otis and Lennon, 2003)
Mcclain, M.-C., & Pfeiffer, S. (2012). Identification of gifted students in the United States
today: A look at state definitions, policies, and practices. Journal of Applied School Psychology, 28, 59-88.
Robertson, S. G., Pfeiffer, S. I., & Taylor, N. (2011). Serving the gifted: A national survey of school psychologists. Psychology in the Schools, 48(8), 786-799.
Disclosure Statement
The presenter does not have any financial interests in any of the tests or books discussed The presenter was an employee of
Riverside Publishing and The Psychological Corporation (now Pearson) and did research and development work on several associated tests (SB5, WJ III, CAS, NNAT)
State of education in Gifted Program Eligibility Intelligence still leading criterion
Almost all current state definitions of gifted and talented list intellectual giftedness as a constituent element, more than any other examined. IQ or ability scores are the most
frequently required eligibility criterion for gifted and talented programs, even as a majority of states adopt multiple criteria identification models (National Association for Gifted Children, 2011).
Mcclain and Pfeiffer (2012) Survey of 48 State Gifted Policies
In their survey, Mcclain and Pfeiffer (2012) reported
90 percent of state definitions include intelligence as an area or category of giftedness Only 32 percent of states mandate use of
intelligence tests “All 50 states have moved beyond the
policy of permitting a single IQ score to, alone, determine whether a student is gifted” (p. 76).
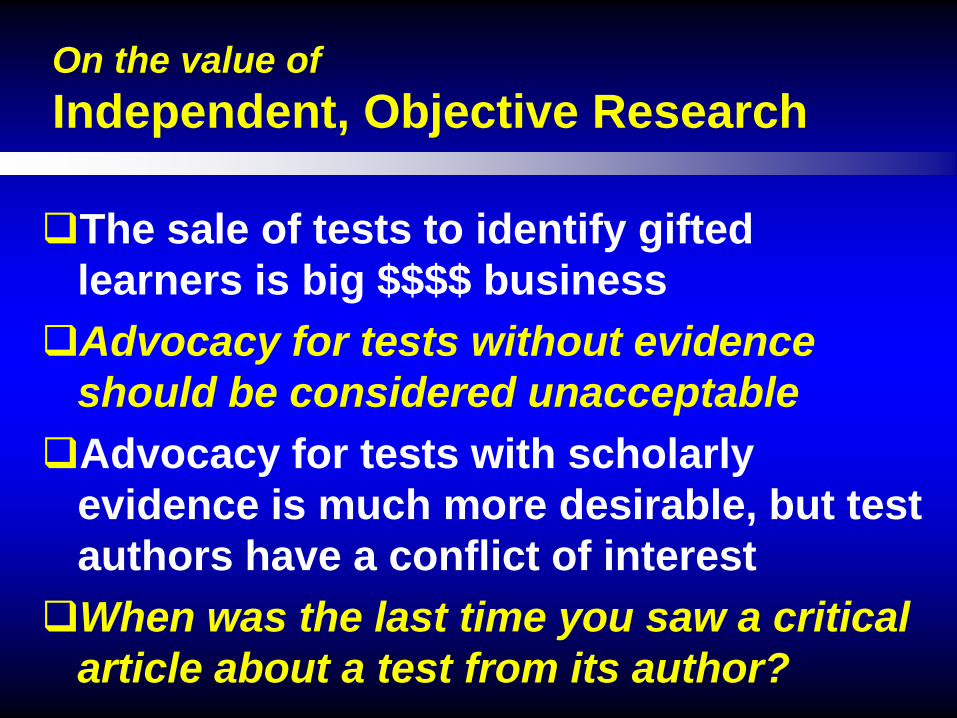
Application-Centered Psychometrics: Definition and Examples
If a test is intended for use with gifted learners, then its psychometric qualities should be demonstrated with samples of gifted learners.
With gifted program identification as the application Application-Centered Psychometrics
Most test psychometrics are based on the vast majority of the normative sample (96% of which earns an IQ between 70 and 130) Application-centered psychometrics
simply asserts that evidence of test score reliability, validity, and fairness should be reported for the special population of interest (i.e., gifted and near-gifted students for our purposes)
Application-centered psychometrics Test Score Reliability as an example
The idea that reliability is a fixed property of a test or scale has been described as the primary myth about reliability still ubiquitous in test manuals. “Reliability is a property of the scores on
a test for a particular population of examinees” (Leland Wilkinson and the APA Task Force on Statistical Inference, 1999, p. 596)
Application-centered psychometrics Test Score Reliability as an example
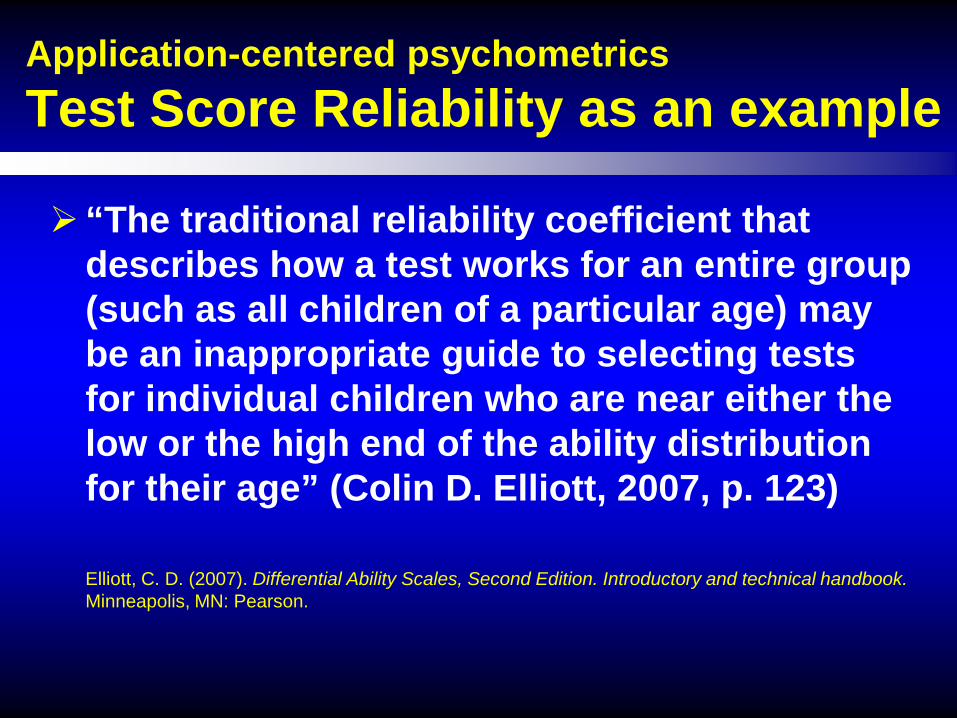
“The traditional reliability coefficient that describes how a test works for an entire group (such as all children of a particular age) may be an inappropriate guide to selecting tests for individual children who are near either the low or the high end of the ability distribution for their age” (Colin D. Elliott, 2007, p. 123)
Elliott, C. D. (2007). Differential Ability Scales, Second Edition. Introductory and technical handbook. Minneapolis, MN: Pearson.
Application-centered psychometrics Test Score Validity as an example
Spearman’s (1927) “law of diminishing returns” states that the “g” saturation of cognitive ability tests decreases as a function of ability or age.
SLODR implies that “g” loadings of test scores will be lower for high ability groups, such as the intellectually gifted.
More than 150 independent scientific investigations have investigated SLODR in the last eight decades, with the majority (but not all) yielding supportive results.
Does more “g” determine intellectual giftedness? Test Score Validity as an example
David Wechsler (1958, p. 110) accepted SLODR and believed that very high intelligence was not due to “g” but to some unspecified special ability: “The lower ceiling of the [Wechsler intelligence scales] is no
accident but represents the author’s deliberate attempt to eschew measuring abilities beyond points at which he feels they no longer serve as a valid measure of a subject’s general intelligence. IQ’s of 150 or more may have some discriminative value in certain fields, such as professional aptitude, but only as measures of unusual intellectual capacity. Intellectual ability, however, is only partially related to general intelligence. Exceptional intellectual ability is itself a kind of special ability.”
Does more “g” determine intellectual giftedness? Test Score Validity as an example
The point is that we cannot assume that the characteristics of test scores in the middle ranges of performance are identical to those in the more extreme gifted ranges. Application-centered psychometrics
simply implies that the only way to know what is happening in the upper extremes is to do the analyses and report the results.
Wasserman (2010) NAGC Aspirations Paper Application-Centered Psychometrics
CogAT 7 Technical Advances for ELL/Gifted Application-Centered Psychometrics
The CogAT 7 offers several important innovations at its lowest levels (5/6 to 8) that may potentially solve the challenge of identifying gifted ELL students All but one of nine picture-based subtests
can be solved without specific item prompts, based on generic instructions in English or Spanish
Recognizes that even verbal items do not require extended instructions
Local reliabilities in gifted ranges through Conditional Standard Errors of Measurement
Consumers need to ask for it Application-Centered Psychometrics
The presenter believes it is very reasonable for test consumers (e.g., school systems and advocacy groups) to ask test authors and test publishers to provide application-centered psychometric data (e.g., reliability, validity, fairness) to support the use of tests with gifted learners. Some additional research will need to
be conducted by test publishers.
Consumers need to ask for it Application-Centered Psychometrics
When test authors or publishers compile and report research on test performance with special populations (e.g., intellectual giftedness), our field is advanced.
Six of the nine ability/intelligence tests report special population studies with gifted children (RIAS, CogAT, and OLSAT do not so report)
These studies generally involve samples of students previously found eligible for GT programs and placed in gifted and talented programs, or sometimes simply IQ ≥ 130
Most of these studies reflect conventional approaches, but tests taking different approaches may identify different types of gifted students.
Basics of cognitive ability tests Gifted Application vs Evidence
WISC-IV
WJ III NU Cog
SB5
DAS-II
Intended for gifted
applications
Yes
Yes
Yes
Yes
Gifted evidential
support presented
n=63
n=39 to 124
n=96
n=68
KABC-II CAS RIAS CogAT7 OLSAT8 Yes Yes Yes Yes Yes
n=95
n=173
none
none in test technical materials
none in test technical materials
The case of RIAS (2006): No evidence Advocacy without evidence
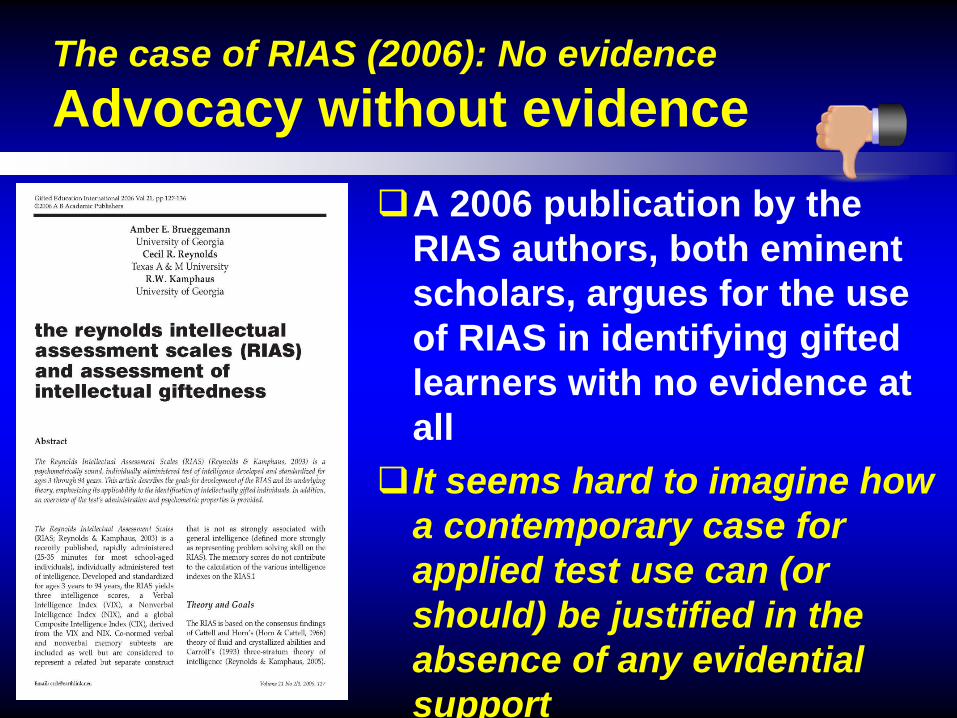
A 2006 publication by the RIAS authors, both eminent scholars, argues for the use of RIAS in identifying gifted learners with no evidence at all
It seems hard to imagine how a contemporary case for applied test use can (or should) be justified in the absence of any evidential support
The case of WJ III Cog: Independent criterion? Advocacy with sloppy evidence
Mean WJ III scores RMM (2001) MF (2009) (n=102) (n=34)
Even more: Jack Naglieri and NNAT Advocacy by Test Developers
From the article: Some experts have raised doubts about the NNAT's ability to create a racially balanced class. Several studies show the test produces significant scoring gaps between wealthier white and Asian children and their poor, minority counterparts.
"The NNAT is advertised as the gold standard ticket that will solve all your problems," said Carol Carman, associate professor in the School of Education at the University of Houston-Clear Lake who has studied the test. "I'm not sure that any test should advertise itself that way." Pearson officials didn't respond to a request for comment. Jack Naglieri, author of the test, said Ms. Carman's study was "fraught with problems." "There have been people who have taken pot shots and used bad research to say I'm wrong," Mr. Naglieri said. "The goal of my test is to give everyone an equal opportunity to do well."
NY SCHOOLS October 7, 2012, 9:39 p.m. ET Big Change in Gifted and Talented Testing
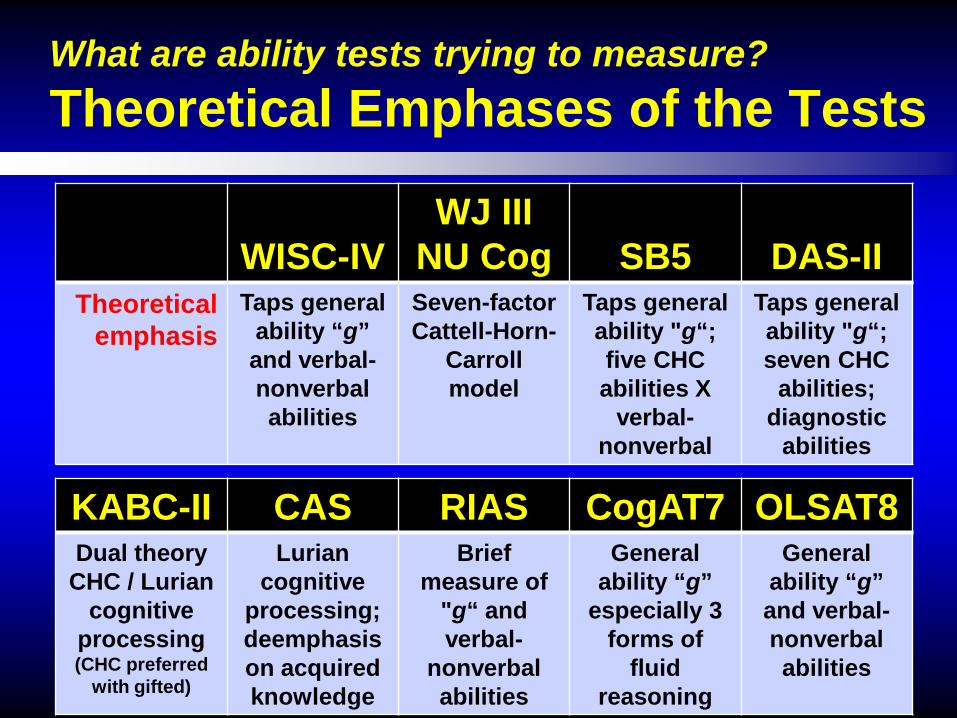
What are ability tests trying to measure? Theoretical Emphases of the Tests
WISC-IV
WJ III NU Cog
SB5
DAS-II
Theoretical emphasis
Taps general ability “g” and verbal-nonverbal abilities
Seven-factor Cattell-Horn-
Carroll model
Taps general ability "g“; five CHC abilities X
verbal-nonverbal
Taps general ability "g“; seven CHC
abilities; diagnostic
abilities
KABC-II CAS RIAS CogAT7 OLSAT8 Dual theory
CHC / Lurian cognitive
processing (CHC preferred
with gifted)
Lurian cognitive
processing; deemphasis on acquired knowledge
Brief measure of
"g“ and verbal-
nonverbal abilities
General ability “g”
especially 3 forms of
fluid reasoning
General ability “g” and verbal-nonverbal abilities
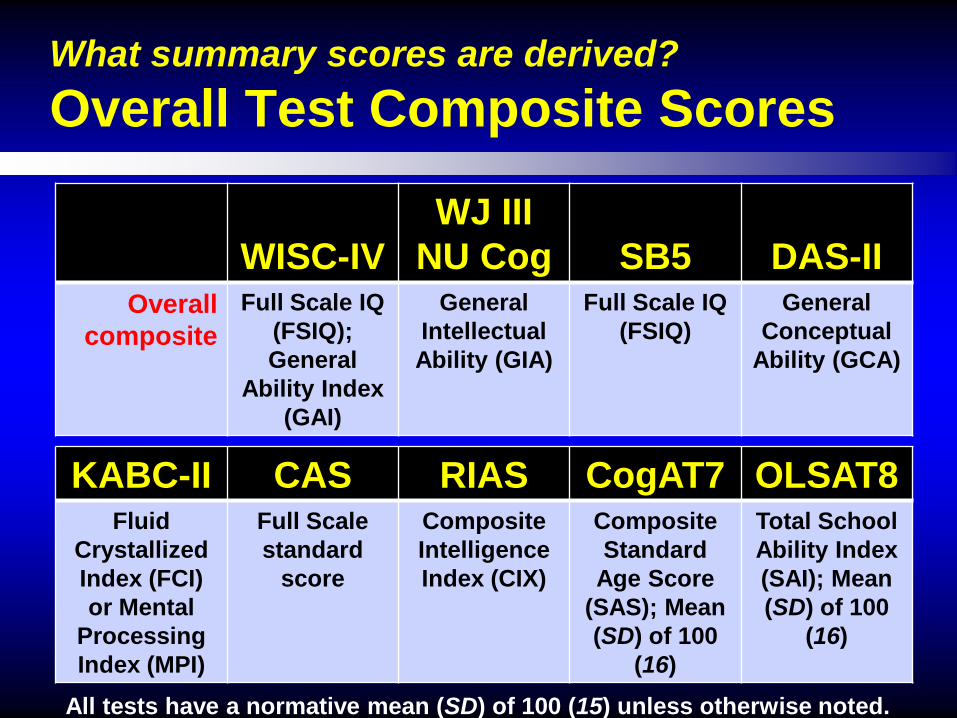
What summary scores are derived? Overall Test Composite Scores
WISC-IV
WJ III NU Cog
SB5
DAS-II
Overall composite
Full Scale IQ (FSIQ); General
Ability Index (GAI)
General Intellectual Ability (GIA)
Full Scale IQ (FSIQ)
General Conceptual
Ability (GCA)
KABC-II CAS RIAS CogAT7 OLSAT8 Fluid
Crystallized Index (FCI) or Mental
Processing Index (MPI)
Full Scale standard
score
Composite Intelligence Index (CIX)
Composite Standard
Age Score (SAS); Mean (SD) of 100
(16)
Total School Ability Index (SAI); Mean (SD) of 100
(16)
All tests have a normative mean (SD) of 100 (15) unless otherwise noted.
With students independently identified as gifted Mean Overall Composite Scores
WISC-IV
WJ III NU Cog
SB5
DAS-II
Mean (SD) score in
gifted sample
FSIQ=123.5
(8.5)
GIA Std=116 (10);
GIA Ext=118 (9)
FSIQ=123.7
(9.0)
GCA=125.4 (10.3);
SNC=121.8 (10.9)
KABC-II CAS RIAS CogAT7 OLSAT8 FCI=120.1
(11.8); MPI=118.7
(11.9)
FS=118.2
(10.0)
--
--
--
Note. Some regression toward the normative mean should always be expected. The reduced SDs probably result from test ceiling effects.
With students independently identified as gifted Mean Overall Composite Scores
Mean gifted group performance is highest on high “g” tests including DAS-II, SB5, and WISC-IV
Mean gifted group performance is lower on cognitive processing tests like the KABC-II and CAS; note even for the KABC-II that the mean performance is higher when acquired knowledge is included (FCI=120.1) compared to processing tests only (MPI=118.7).
Mean gifted group performance is lowest on the WJ III Cog (GIA Std=116), which my research has shown to be an especially poor measure of “g.”
Note on methodology: Most tests only require gifted program placement or IQ≥130 for inclusion in these studies. Differences between the samples can produce large differences in mean scores.
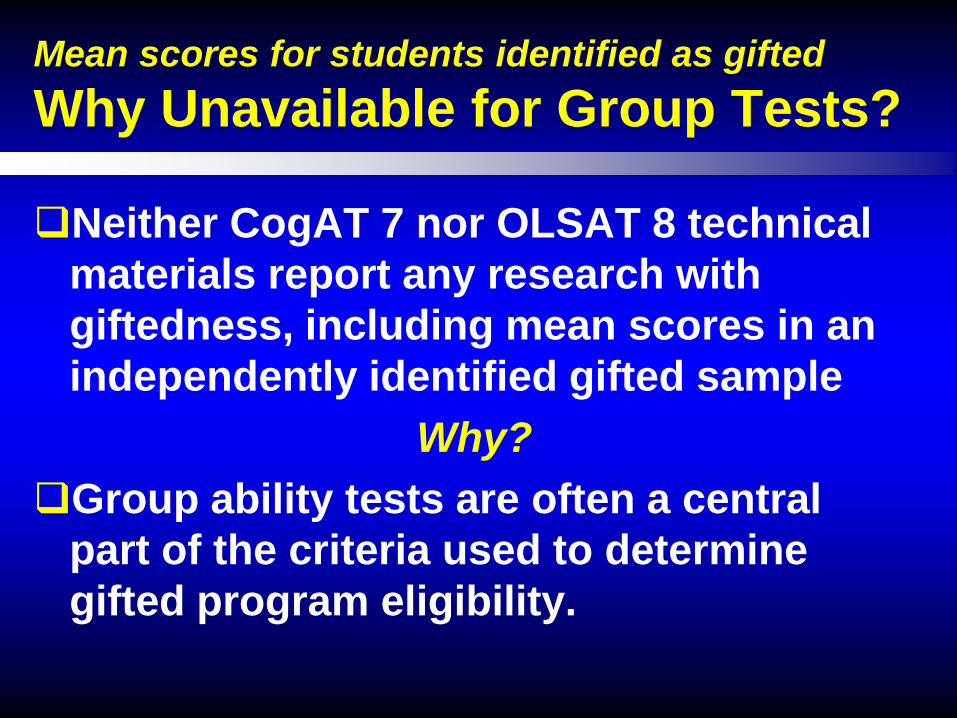
Mean scores for students identified as gifted Why Unavailable for Group Tests?
Neither CogAT 7 nor OLSAT 8 technical materials report any research with giftedness, including mean scores in an independently identified gifted sample
Why? Group ability tests are often a central
part of the criteria used to determine gifted program eligibility.
Beal (1996) OLSAT 6 Gifted Study
For n=155 third grade “gifted” students in Canada earning a WISC-III FSIQ ≥120 (Mean FSIQ=127.1):
OLSAT 6 Total SAI=122.6 Verbal SAI=120.6
Nonverbal SAI=121.7
Beal, A. L. (1996). A comparison of WISC-III and OLSAT-6 for the identification of gifted students. Canadian Journal of School Psychology, 11(2), 120-129.
Wasserman CogAT 6 GMU Sample For n=58 second grade students applying
for gifted program placement in Virginia earning a WISC-IV FSIQ ≥120 (Mean FSIQ=126.9, SD=5.7):
Note. These students were administered the WISC-IV after having been found not eligible for advanced academic programs, possibly on the basis of their CogAT 6 scores. Accordingly, this sample should be considered an atypical “potentially gifted” sample because it excludes students who would have been admitted to a gifted program (without additional WISC-IV testing) on the basis of CogAT scores alone.
What are ability tests trying to measure? Main Constructs in Test Scores
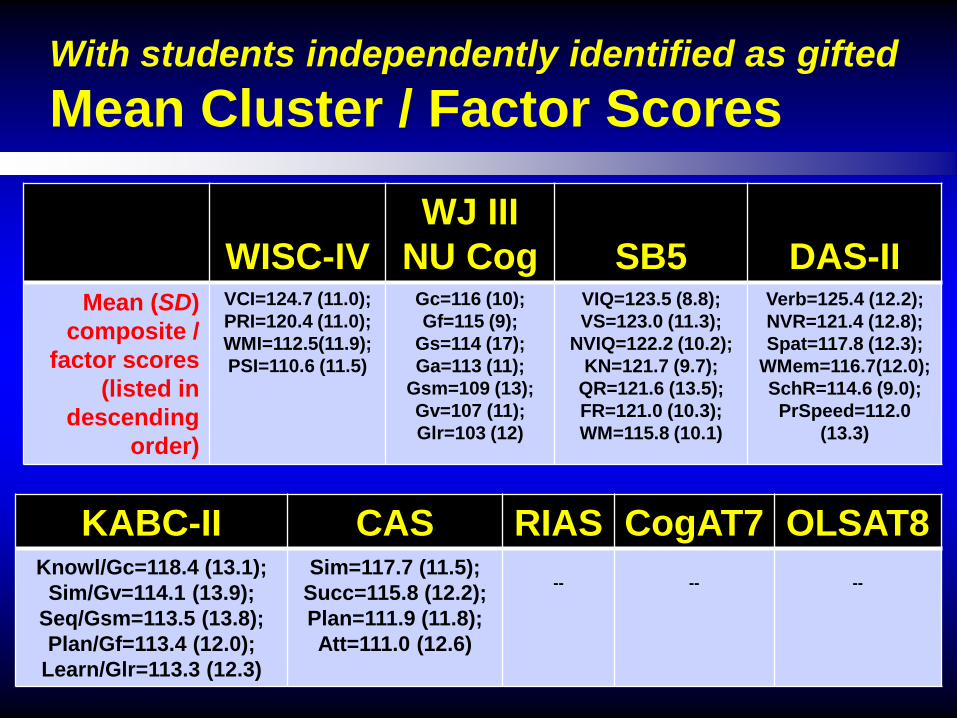
With students independently identified as gifted Mean Cluster / Factor Scores
In multifactor batteries administered to independently-defined gifted samples Highest mean scores tend to be in verbal
acquired knowledge, followed by fluid reasoning (both high “g” abilities) Lowest mean scores tend to be in low “g”
areas such as short-term memory and processing speed. This is even true for CAS, where Planning and Attention tasks are all speed-dependent.
Can the test assess highly gifted? Extended Norms / Test Ceilings
WISC-IV
WJ III NU Cog
SB5
DAS-II
Above range option
No No No Yes
High ability norms
Yes Yes EXIQ only Yes?
Ceiling scores (age 7:6)
FSIQ=160/210 GAI=160/210
(Std/Ext)
GIA (Ext)=200
FSIQ=160; EXIQ=225
GCA=170; SNC=170
KABC-II CAS RIAS CogAT7 OLSAT8 Yes No No Yes Yes No No No No No
FCI=160; MPI=160
FS=160 (Basic & Std. Batteries)
CIX=160 Composite SAS=160
Total SAI=150
A serious research challenge The Ceiling Problem in Tests
Anytime that a subtest discontinue rule has not formally been reached by the end of the test, a ceiling effect has occurred and test results may underestimate the examinee’s true ability level Two tests (WISC-IV and WJ III NU Cog)
have largely overcome the ceiling problem and extended IQ scores up through 200 or more
Identification of highly gifted learners Why do extended norms matter?
Gifted learners above IQ of 130 are no more uniform and homogeneous than intellectually disabled learners with IQ below 70. Without objective measurement,
scientific study of highly gifted students, savants, and prodigies is made near impossible.
Ability and intelligence tests
Practical Matters and Comparisons
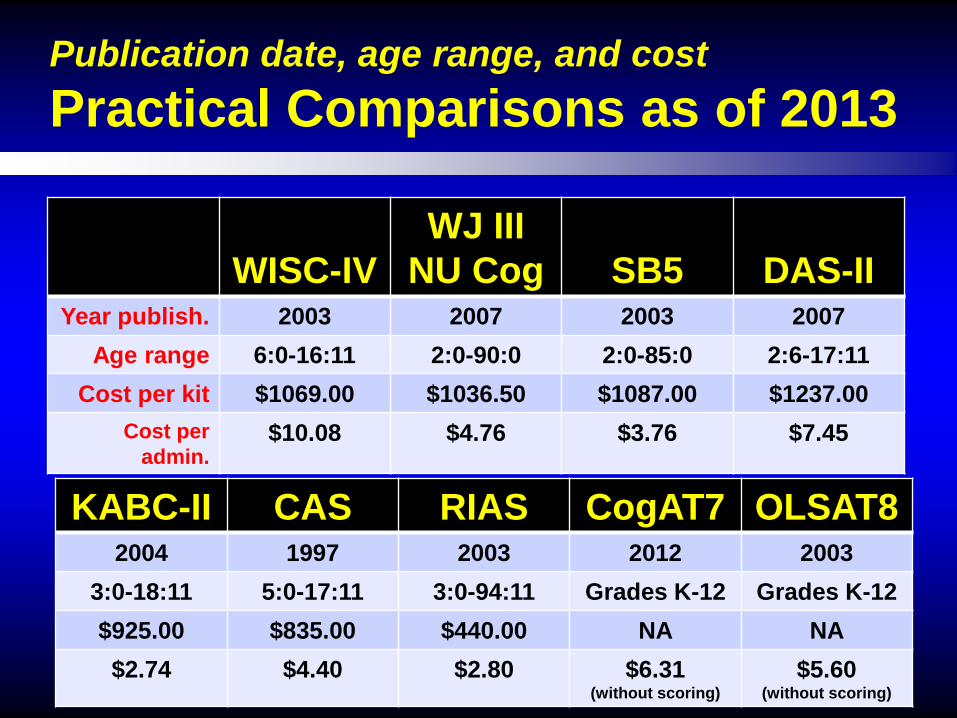
Publication date, age range, and cost Practical Comparisons as of 2013
WISC-IV
WJ III NU Cog
SB5
DAS-II
Year publish. 2003 2007 2003 2007 Age range 6:0-16:11 2:0-90:0 2:0-85:0 2:6-17:11
Cost per kit $1069.00 $1036.50 $1087.00 $1237.00 Cost per
admin. $10.08 $4.76 $3.76 $7.45
KABC-II CAS RIAS CogAT7 OLSAT8 2004 1997 2003 2012 2003
3:0-18:11 5:0-17:11 3:0-94:11 Grades K-12 Grades K-12 $925.00 $835.00 $440.00 NA NA $2.74 $4.40 $2.80 $6.31
(without scoring) $5.60
(without scoring)
Conventional test administration Administrative Comparisons
WISC-IV
WJ III NU Cog
SB5
DAS-II
Admin. time 65 to 80 minutes
(10 core subtests); 95 to 110 minutes (all
15 subtests)
35 to 45 minutes (Standard
Battery); 80 to 100 minutes (Extended Battery)
15 to 20 minutes (Abbreviated
Battery); 45 to 75 minutes
(Standard Battery);
30-40 minutes (Six core); 75 to
95 (Extended Battery)
Admin.
formats
Verbal and visual presentation; timed tasks;
blocks as manipulables
Verbal and visual presentation
timed tasks; no manipulables
Verbal and visual presentation;
liberal response time response limits; several
types of manipulables
Verbal and visual presentation; timed tasks;
several types of manipulables
Conventional test administration Administrative Comparisons
KABC-II CAS RIAS CogAT7
OLSAT8
Admin.
time
25-30 minutes (Core battery at
youngest age) to 50-70 minutes
(Core battery in adolescence); 35-55 minutes (Expanded battery at youngest
age) to 75-100 minutes (Expanded
battery in adolescence)
40 minutes (Basic); 60
minutes (Standard)
20-25 minutes (Core battery);
30 to 50 minutes (Core battery
and CMX)
Primary levels are teacher-
paced; higher levels permit
10 minutes per test to total
about 90 minutes
Levels A and B are teacher-administered and paced, and testing time rarely exceeds 75 minutes. Levels C through H will typically require 60 to 75 minutes.
Admin.
formats
Verbal and visual presentation; timed tasks; several types
of manipulables
Verbal and visual
presentation timed tasks; no manipulables
Verbal and visual presentation;
liberal response time limits; no manipulables
Verbal and visual
presentation; reading required
Verbal and visual
presentation; reading required
Special purpose test administration Administrative Options
WISC-IV
WJ III NU Cog
SB5
DAS-II
Abbreviated
version No, but see
WASI-II Yes, three- subtest BIA
Yes, two- subtest ABIQ No
Nonverbal
version No, but see
WNV
No, but see BCA-LV in diag. supp.
Yes, five subtest NVIQ
Yes, NV, NVR, and SNC in lieu of GCA
Online version No No No No
Special purpose test administration Administrative Options
KABC-II
CAS RIAS CogAT7
OLSAT8
Abbreviated
version No, but see KBIT-2
No
Yes, in two-subtest
RIST
Three-subtest
CogAT Form 7 Screening
Form
No
Nonverbal version Yes, NVI
No
Yes, two-subtest NIX
Nonverbal SAS; also primary subtests only use pictures
Nonverbal SAI
Online
version No
No
No
Yes
Yes
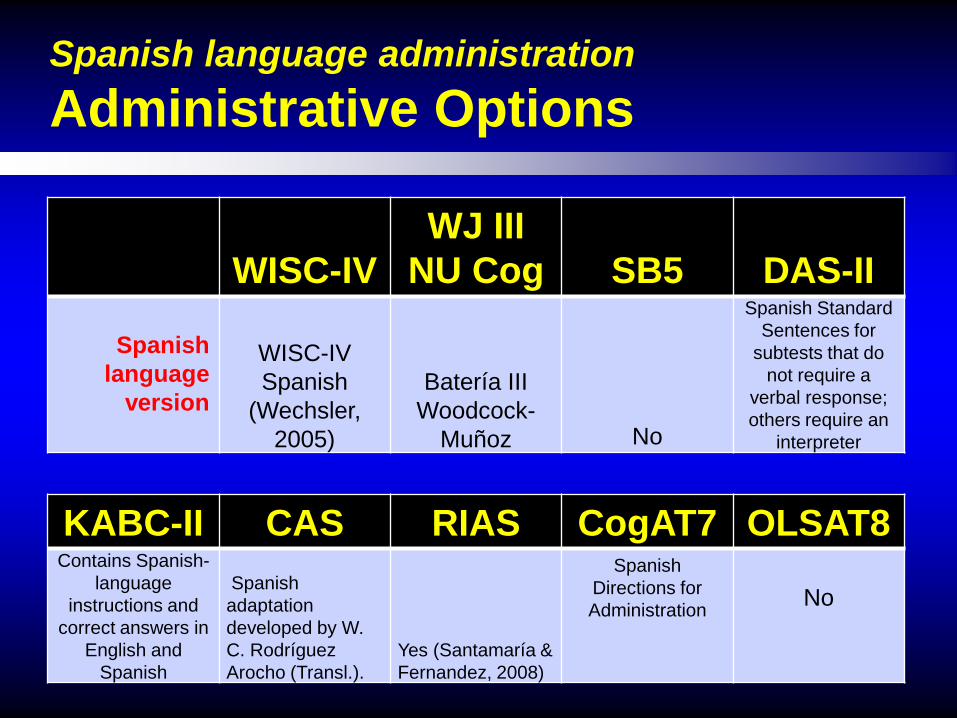
Spanish language administration Administrative Options
WISC-IV
WJ III NU Cog
SB5
DAS-II
Spanish
language version
WISC-IV Spanish
(Wechsler, 2005)
Batería III
Woodcock-Muñoz No
Spanish Standard Sentences for
subtests that do not require a
verbal response; others require an
interpreter
KABC-II CAS RIAS CogAT7 OLSAT8 Contains Spanish-
language instructions and
correct answers in English and
Spanish
Spanish adaptation developed by W. C. Rodríguez Arocho (Transl.).
Yes (Santamaría & Fernandez, 2008)
Spanish Directions for Administration
No
Ability and intelligence tests
Qualities of Standardization and Norms
Psychometric Development Standardization Sample Collection
WISC-IV
WJ III NU Cog
SB5
DAS-II
Year normed 2001-2002 1996-1999 (recalculated normative
update with 2005 census targets)
2001-2002 2000-2006 for pilots, tryout, stdz
Sampling strategy
Stratified Multistage stratified random
Stratified random
Stratified
Stratification variables
Race, Parent Education, and
Geographic region
Sex, Race, Hispanic status, Education of
adults, Type of school/college, Occupation of
adults, Community size, Geographic
region
Race/Ethnicity, Geographic region, and
Educational level
Race/Ethnicity, Parent
education, Geographic
region
Psychometric Development Standardization Sample Collection
KABC-II CAS RIAS CogAT7 OLSAT8 Year normed 2001-2003 1993-
1996 1999-2002
2010-2011 2002
Sampling strategy
Stratified random
Stratified random
Stratified Stratified random
selection of schools
Stratified random
selection of school districts
Stratification variables
Ethnicity, Geographic
region, Parent education level
Race, Hispanic
origin, Region,
Community, Parent
education
Ethnicity, (Parent- or
Self-) Educational attainment,
and Geographic
region
School district Geographic
region, District enrollment,
Socioeconomic status, and
Public/Private status
Community socioeconomic
status, Urbanicity, and
Ethnicity
Psychometric Development Standardization Sample Reporting
WISC-IV
WJ III NU Cog
SB5
DAS-II
Normative sample size
N=2,200 across 11 age levels
(note: 50% of standardization examinees not
administered Arithmetic subtest)
N=8,782 across 25 age levels
(note: as many as 75% of examinees not given all tests [e.g., Planning]
at every age level)
N=4,800 across 30 age levels
N=3,480 across 18 age levels
Weighting Unweighted Weighted Unweighted Unweighted Full reporting of
stratification breakdowns*
Yes
No
Yes
Yes
Sampling adequacy for
minorities
Yes Large undersampling
of Hispanics corrected with
weighting.
Yes Yes
* Demographic breakdowns such as age x ethnicity x parent educational level.
Psychometric Development Standardization Sample Reporting
KABC-II CAS RIAS CogAT7 OLSAT8 Normative
sample size N=3,025
across 18 age levels N=2,200
across 9 age levels N=2,438 across 16 age
levels
N=52,237 N=445,500
Weighting Unweighted Unweighted Weighted Weighted Weighted Full reporting
of stratification breakdowns*
Yes
Yes
Yes
No
No
Sampling adequacy for
minorities
Yes Yes Yes Undersampled African
Americans and densely
populated school districts.
Large urban undersampling
* Demographic breakdowns such as age x ethnicity x parent educational level.
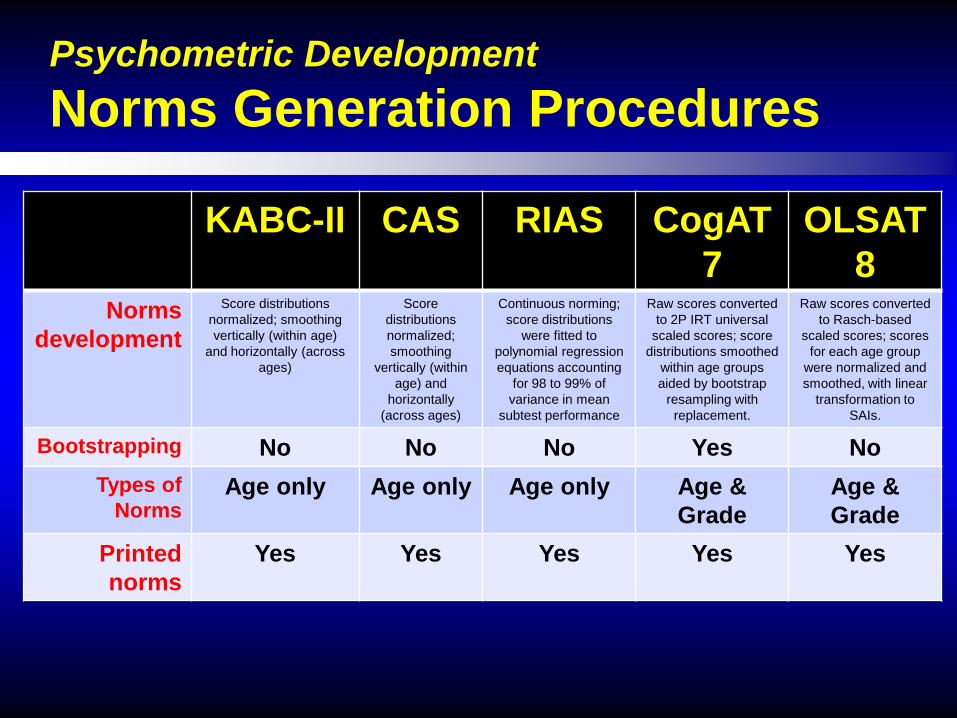
Psychometric Development Norms Generation Procedures
WISC-IV
WJ III NU Cog
SB5
DAS-II
Norms development
Cumulative raw score frequency distributions were normalized and
smoothed
Continuous norming; individual subject
weighting followed by bootstrap resampling
followed by polynomial norm curve-fitting
procedures to derive W-scores
Continuous norming; score distributions fitted
by polynomial regression, followed by hand-
smoothing within and across ages
Inferential norming; score distributions fitted to
polynomial regressions with smoothing of minor
irregularities
Bootstrapping No Yes No No Types of
Norms Age only Age & Grade Age only Age only
Printed norms
Yes No Yes Yes
Psychometric Development Norms Generation Procedures
were fitted to polynomial regression equations accounting
for 98 to 99% of variance in mean
subtest performance
Raw scores converted to 2P IRT universal
scaled scores; score distributions smoothed
within age groups aided by bootstrap
resampling with replacement.
Raw scores converted to Rasch-based
scaled scores; scores for each age group
were normalized and smoothed, with linear
transformation to SAIs.
Bootstrapping No No No Yes No Types of
Norms Age only Age only Age only Age &
Grade Age & Grade
Printed norms
Yes Yes Yes Yes Yes
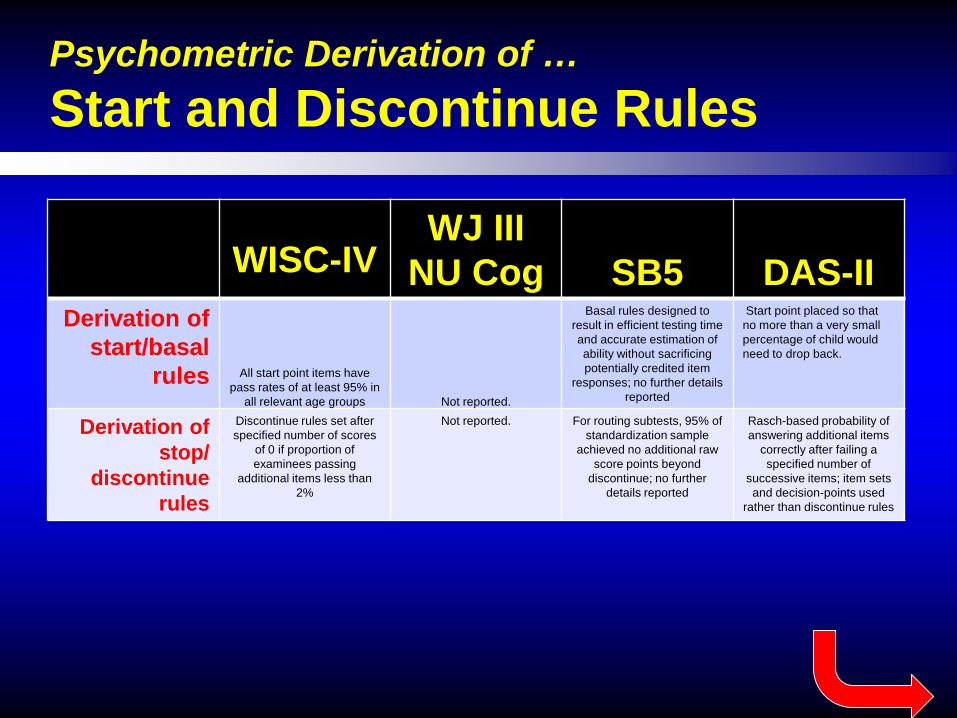
Psychometric Derivation of … Start and Discontinue Rules
WISC-IV
WJ III NU Cog
SB5
DAS-II
Derivation of start/basal
rules All start point items have pass rates of at least 95% in
all relevant age groups Not reported.
Basal rules designed to result in efficient testing time and accurate estimation of ability without sacrificing potentially credited item
responses; no further details reported
Start point placed so that no more than a very small percentage of child would need to drop back.
Derivation of stop/
discontinue rules
Discontinue rules set after specified number of scores
of 0 if proportion of examinees passing
additional items less than 2%
Not reported. For routing subtests, 95% of standardization sample
achieved no additional raw score points beyond
discontinue; no further details reported
Rasch-based probability of answering additional items
correctly after failing a specified number of
successive items; item sets and decision-points used
rather than discontinue rules
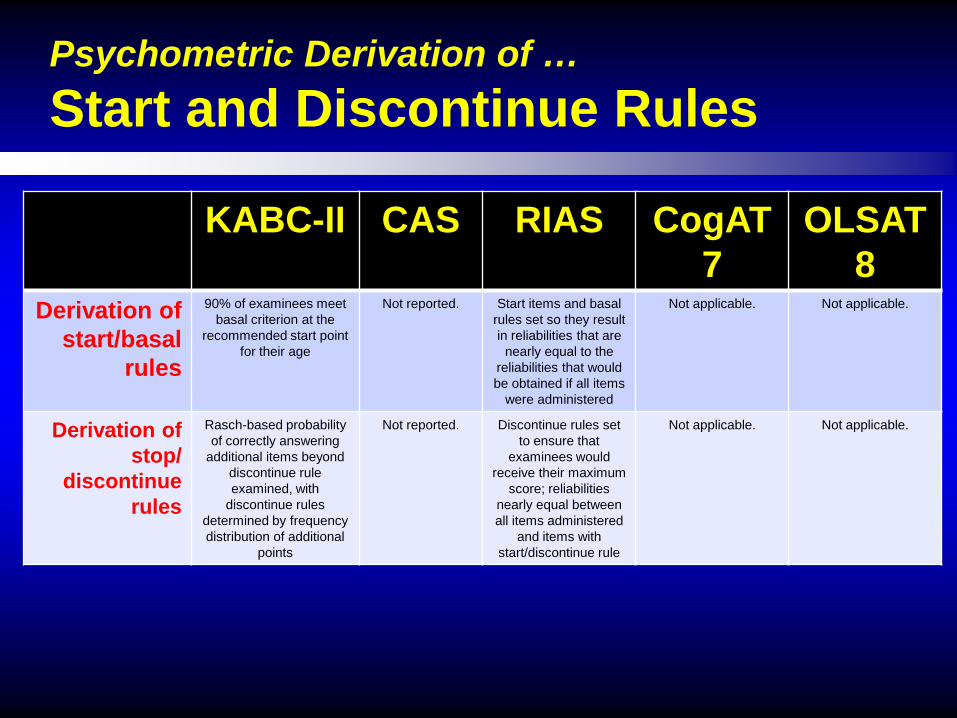
Psychometric Derivation of … Start and Discontinue Rules
KABC-II CAS RIAS CogAT7
OLSAT8
Derivation of start/basal
rules
90% of examinees meet basal criterion at the
recommended start point for their age
Not reported. Start items and basal rules set so they result in reliabilities that are
nearly equal to the reliabilities that would be obtained if all items
were administered
Not applicable. Not applicable.
Derivation of stop/
discontinue rules
Rasch-based probability of correctly answering
additional items beyond discontinue rule examined, with
discontinue rules determined by frequency distribution of additional
points
Not reported. Discontinue rules set to ensure that
examinees would receive their maximum
score; reliabilities nearly equal between all items administered
and items with start/discontinue rule
Not applicable. Not applicable.
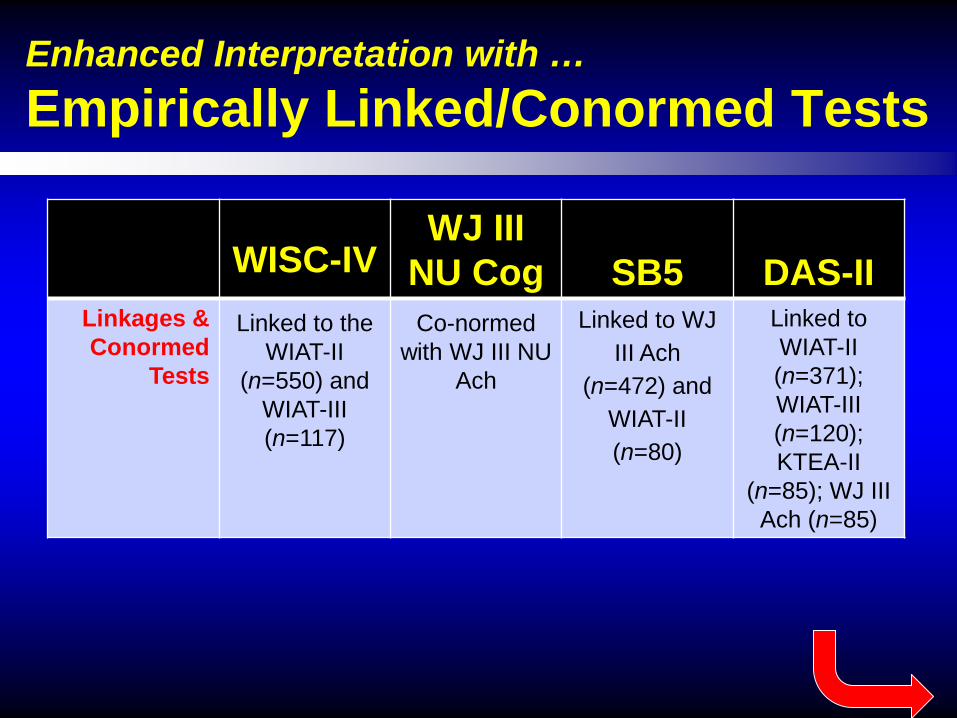
Enhanced Interpretation with … Empirically Linked/Conormed Tests
WISC-IV
WJ III NU Cog
SB5
DAS-II
Linkages & Conormed
Tests
Linked to the WIAT-II
(n=550) and WIAT-III (n=117)
Co-normed with WJ III NU
Ach
Linked to WJ III Ach
(n=472) and WIAT-II (n=80)
Linked to WIAT-II (n=371); WIAT-III (n=120); KTEA-II
(n=85); WJ III Ach (n=85)
Enhanced Interpretation with … Empirically Linked/Conormed Tests
KABC-II CAS RIAS CogAT7
OLSAT8
Linkages & Conormed
Tests
Co-normed with KTEA-II
Linked to WJ-R (n =
1,600)
Co-normed with
Reynolds All Range
Reading Test; linked
to the WRAT4 (n=410)
Co-normed with the
Iowa Assessment
s
Co-normed with the SAT-10
Ability and intelligence tests
Evidence of Test Score Reliability
On Psychometric Reliability
Reliability is the psychometric characteristic that summarizes the consistency, accuracy, and uniformity of test scores across testing occasions, time, and samples.
Reliability is essentially a measure of the trustworthiness of test scores. This issue is particularly critical in school districts in which a score range is part of the gifted placement decision-making process, since all test scores lie within a confidence band determined by measurement error.
Application-centered psychometrics Test Score Reliability as an example
The idea that reliability is a fixed property of a test or scale has been described as the primary myth about reliability still ubiquitous in test manuals. “Reliability is a property of the scores on
a test for a particular population of examinees” (Leland Wilkinson and the APA Task Force on Statistical Inference, 1999, p. 596)
Application-centered psychometrics Test Score Reliability as an example
“The traditional reliability coefficient that describes how a test works for an entire group (such as all children of a particular age) may be an inappropriate guide to selecting tests for individual children who are near either the low or the high end of the ability distribution for their age” (Colin D. Elliott, 2007, p. 123)
Elliott, C. D. (2007). Differential Ability Scales, Second Edition. Introductory and technical handbook. Minneapolis, MN: Pearson.
Application-centered psychometrics Test Score Reliability as an example
“The concerns associated with SEMs [and therefore test score reliability] are actually substantially worse for scores at the extremes of the distribution … Commonly the SEM is two to four times larger for very high scores than for scores near the mean” (Lohman & Foley Nicpon, 2012).
Lohman, D. F., & Foley Nicpon, M. (2012). Ability testing and talent identification. In S. L. Hunsaker (Ed.), Identification: The Theory and Practice of Identifying Students for Gifted and Talented Education Services (pp. 283-335). Mansfield Center, CT: Creative Learning Press.
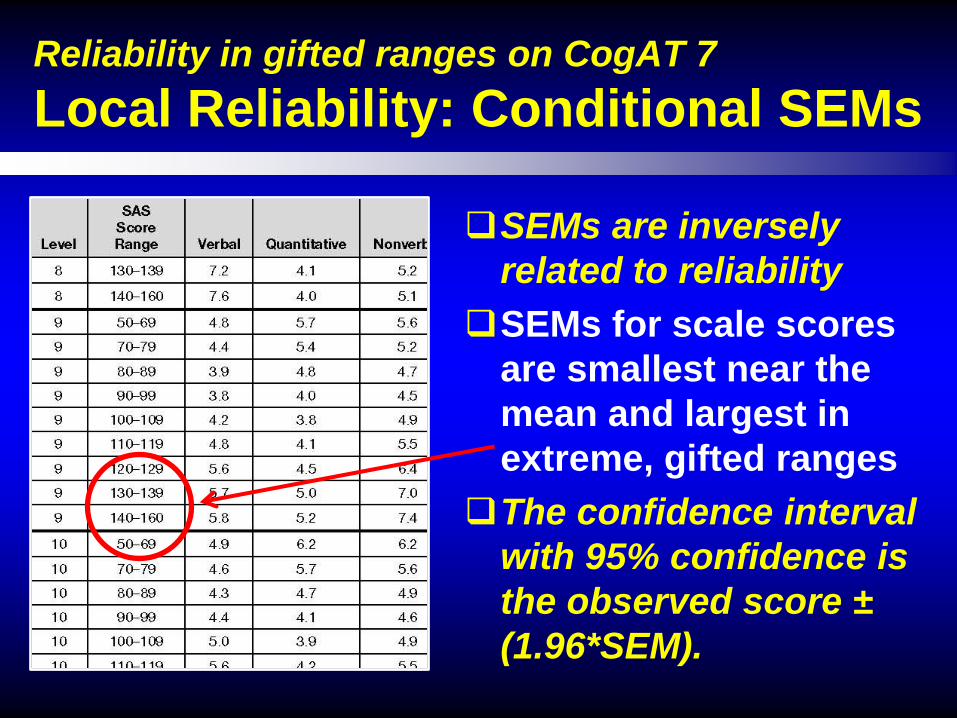
Reliability in gifted ranges on CogAT 7 Local Reliability: Conditional SEMs
SEMs are inversely related to reliability
SEMs for scale scores are smallest near the mean and largest in extreme, gifted ranges
The confidence interval with 95% confidence is the observed score ± (1.96*SEM).
Ongoing identification process? Stability of Gifted Score Elevations
Lohman (2012) writes, “For tests of general intelligence administered to elementary-age children, the drop-off after one year is about 50% of those children who scored in the top 3% on the first year … For every child who drops out of the top group, another moves into it. Changes are particularly great in the early elementary years.”
Lohman, D. F. (2012). Decision strategies. In S. L. Hunsaker (Ed.), Identification: The Theory and Practice of
Identifying Students for Gifted and Talented Education Services (pp. 217-248). Mansfield Center, CT: Creative Learning Press.
Lohman, D. F., & Korb K. (2006). Gifted today but not tomorrow? Longitudinal changes in ITBS and CogAT scores during elementary school. Journal for the Education of the Gifted, 29, 451-484.
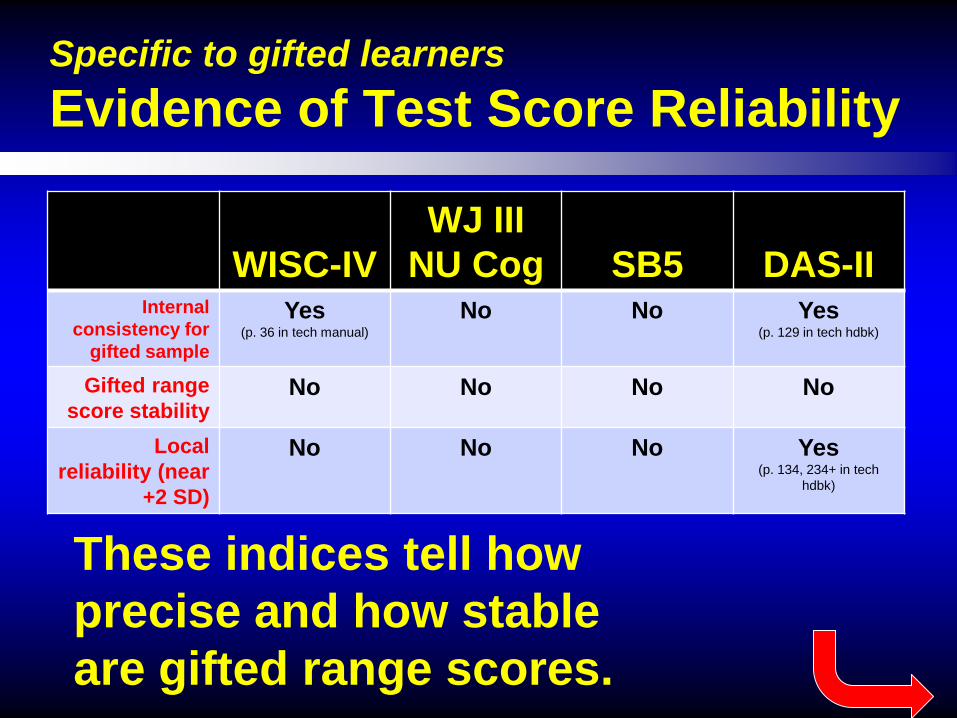
Specific to gifted learners Evidence of Test Score Reliability
WISC-IV
WJ III NU Cog
SB5
DAS-II
Internal consistency for
gifted sample
Yes (p. 36 in tech manual)
No No Yes (p. 129 in tech hdbk)
Gifted range score stability
No No No No
Local reliability (near
+2 SD)
No No No Yes (p. 134, 234+ in tech
hdbk)
These indices tell how precise and how stable are gifted range scores.
Specific to gifted learners Evidence of Test Score Reliability
KABC-II CAS RIAS CogAT7 OLSAT8 Internal
consistency for gifted sample
No No No No No
Gifted range score stability
No No No Yes (pp. 58-60 in Res.
Guide)
No
Local reliability
(near +2 SD)
No No No Yes (Personal SEM &
Conditional std errors)
No
These indices tell how precise and how stable are gifted range scores.
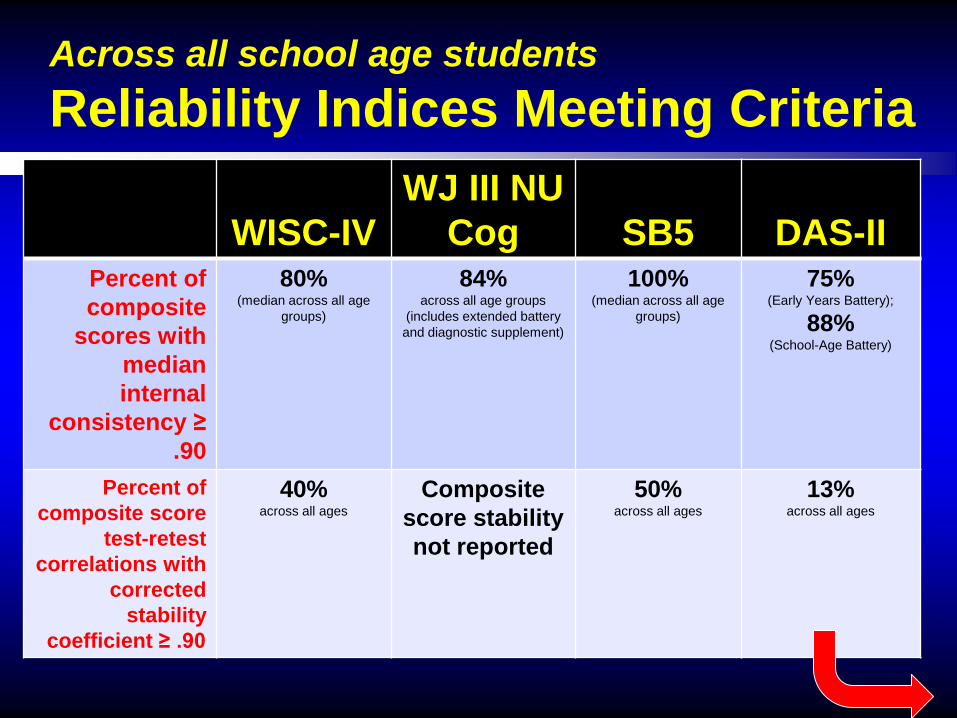
Across all school age students Reliability Indices Meeting Criteria
WISC-IV
WJ III NU Cog
SB5
DAS-II
Percent of composite
scores with median internal
consistency ≥ .90
80% (median across all age
groups)
84% across all age groups
(includes extended battery and diagnostic supplement)
100% (median across all age
groups)
75% (Early Years Battery);
88% (School-Age Battery)
Percent of composite score
test-retest correlations with
corrected stability
coefficient ≥ .90
40% across all ages
Composite score stability not reported
50% across all ages
13% across all ages
Across all school age students Reliability Indices Meeting Criteria
KABC-II CAS RIAS CogAT7 OLSAT8 Percent of
composite scores with median internal
consistency ≥ .90
100% (average across all ages
for ages 3-6);
63% (average across ages for
ages 7-18)
50% (median across all age groups);
40% for the Basic Battery; 60%
for the Standard Battery
100% across all age
groups
80% (Total VQN, Verbal, and
Quantitative but not Nonverbal)
33% (Total SAI but not Verbal SAI or Nonverbal SAI)
Percent of composite
score test-retest correlations
with corrected stability
coefficient ≥ .90
26% across all ages
0% (Basic Battery); 0% (Standard
Battery)
26% across all ages
0% over span of 1 year
None provided
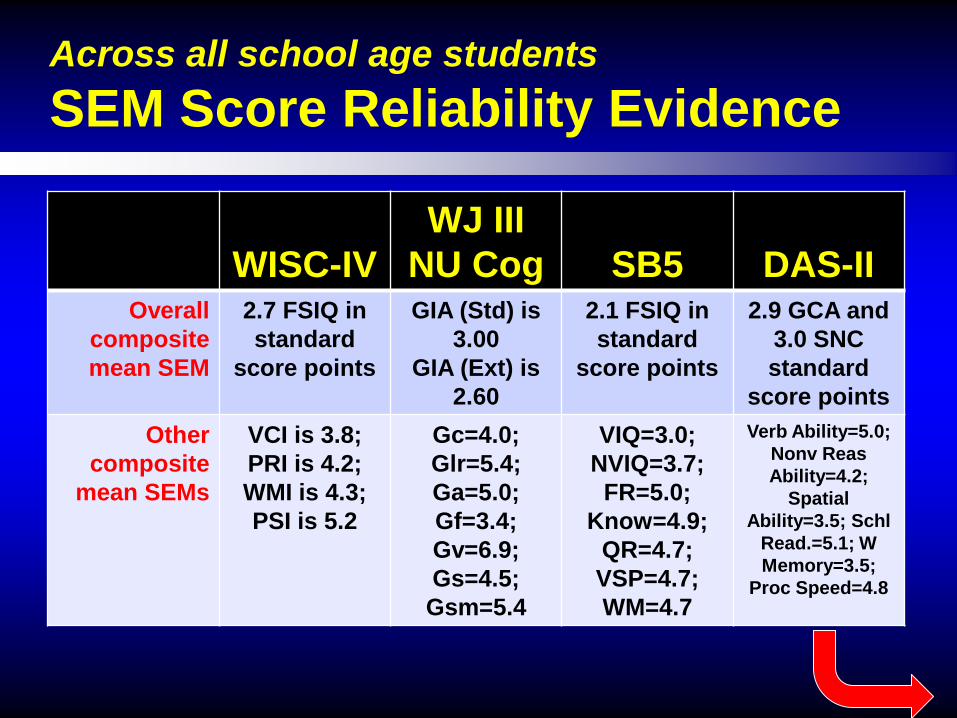
Across all school age students SEM Score Reliability Evidence
Across all school age students SEM Score Reliability Evidence
KABC-II CAS RIAS CogAT7 OLSAT8 Overall
composite median SEM
3.0-2.8 FCI; 3.2-3.5 MPI; 4.2-4.8 NVI
3.1 FS Std; 5.4
FS Basic
3.0 CIX std score
points
3.3 Composite SAS points
5.7 Total SAI points
Other
composite median
SEMs
Seq/Gsm=4.5-5.0;
Sim/Glr=4.3-5.1; Lrn/Glr=4.0-4.3;
Plan/Gf=5.3; Know/Gc=4.1-
4.7
Basic Plan=5.7; Sim=5.0; Att=6.2;
Succ=4.8; Standard Plan=5.1; Sim=4.3; Att=5.3;
Succ=4.2
VIX=3.7; NIX=3.4; CMX=3.4
Verbal=4.8; Quant=4.3; Nonv=5.6; Screen=4.8
in SAS points
Verbal=5.6; Nonv=5.7
in SAI points
Some concluding observations Evidence of Test Score Reliability
Internal consistencies tend to be fairly adequate for most full range intelligence and ability tests (CAS and OLSAT 8 are lowest)
Few tests measure internal consistency in the gifted ranges (but DAS-II and CogAT 7 do), where reliability may fall considerably
Test-retest stability tends to be fairly low for most full range tests
Important questions about the stability of gifted range scores need to be researched
Ability and intelligence tests
Evidence of Test Score Validity
On Test Score Validity
The validity of a test score addresses its meaning and application, specifically the degree to which a test score measures what it purports to measure and not extraneous constructs.
For students who are potentially academically gifted, a test valid for placement decisions should correctly identify students with the potential to succeed in a gifted classroom while rejecting students who are unlikely to succeed.
What abilities determine total composite score? Review of Content: Abilities - 1
WISC-IV
WJ III NU Cog
SB5
DAS-II
Acquired knowledge
30% (based on 3 VCI subtests)
20-24% (based on 2 Gc tests and GIA
Std/Ext weights ages 5-17)
20% (based on 2 Knowledge
subtests)
33% (based on 2 Verbal Ability
subtests)
Fluid reasoning
20% (based on 2 PRI subtests,
PConc & MReas.)
17-20% (based on 2 Gf tests)
20% (based on 2 Fluid Reasoning
subtests)
33% (based on 2 Nonv
Reasoning subtests)
Math reasoning
0% (Arithmetic suppl.)
8-9% (Analysis-Synthesis; Number
Series & Number Matrices suppl.)
20% (based on 2 Quant.
Reasoning subtests)
17% (based on Seq. Quant.
Reasoning subtest)
continue Which tests best capture prior learning? Exceptional reasoning skills? Mathematical precociousness?
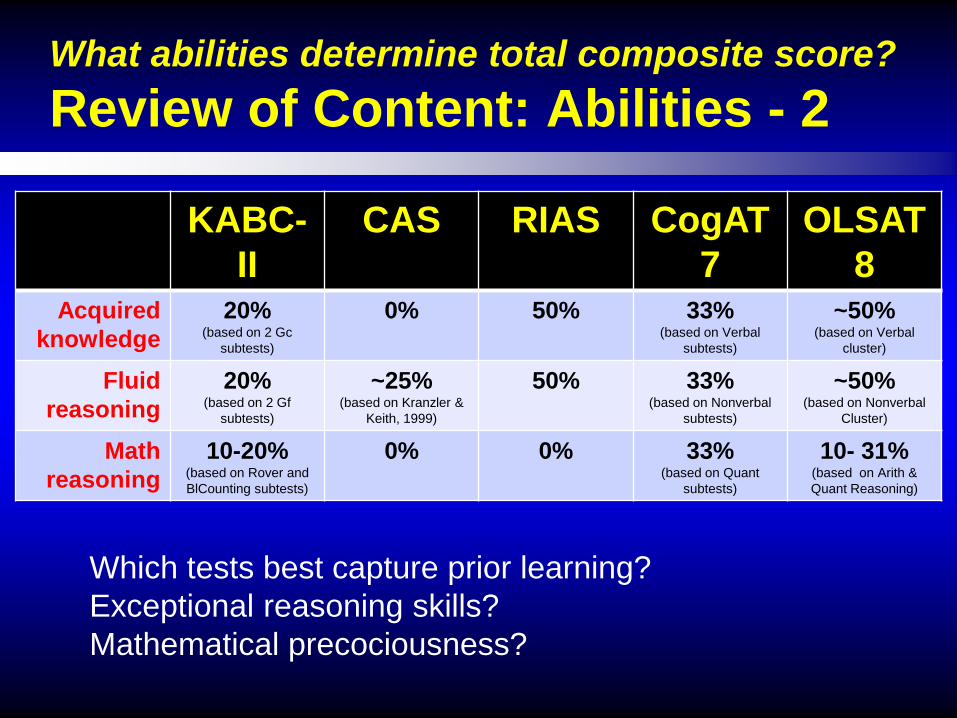
What abilities determine total composite score? Review of Content: Abilities - 2
KABC-II
CAS RIAS CogAT7
OLSAT8
Acquired knowledge
20% (based on 2 Gc
subtests)
0% 50% 33% (based on Verbal
subtests)
~50% (based on Verbal
cluster)
Fluid reasoning
20% (based on 2 Gf
subtests)
~25% (based on Kranzler &
Keith, 1999)
50% 33% (based on Nonverbal
subtests)
~50% (based on Nonverbal
Cluster)
Math reasoning
10-20% (based on Rover and BlCounting subtests)
0% 0% 33% (based on Quant
subtests)
10- 31% (based on Arith & Quant Reasoning)
Which tests best capture prior learning? Exceptional reasoning skills? Mathematical precociousness?
What processes drive the total composite score? Review of Content: Processes - 1
WISC-IV
WJ III NU Cog
SB5
DAS-II
Auditory processing
?? (possibly in Digit Span & LN
Seq. subtests)
9-12% (based on 2 Ga tests and GIA
Std/Ext weights ages 5-17)
0% 0% (Phono Processing subtest
is suppl. diagnostic)
Visual processing
10% (based on Block Design
subtest)
8-10% (based on 2 Gv tests)
20% (based on 2 Gv subtests )
33% (based on 2 Spatial Ability
subtests)
Working memory
20% (based on Digit Span & LN
Seq. subtests)
13-15% (based on 2 Gsm tests)
20% (based on 2 Working Memory
subtests)
0% (Working Memory subtests
are suppl. diagnostic)
Processingspeed
20% (based on Coding & Symbol
Search subtests)
10-13% (based on 2 Gs tests)
0% 0% (Processing Speed subtests
are suppl. diagnostic)
Which tests to avoid for students with central auditory processing disorders? Which tests have the highest speed demands?
What processes drive the total composite score? Review of Content: Processes - 2
KABC-II
CAS RIAS CogAT7
OLSAT8
Auditory processing
0% 0% 0% 0% 0%
Visual processing
20% (based on 2 Gv
subtests)
?? (possibly simultaneous
subtests, based on Kranzler & Keith,
1999)
0% 9-10% (based on Paper
Folding subtest as a measure of Gv)
0%
Working memory
20% (based on 2 Gsm
subtests)
25% (successive subtests, based on Kranzler &
Keith, 1999)
0% (Memory subtests are
optional)
0% 0%
ProcessingSpeed
0% 50% (planning and attention
subtests have high speed demands)
0% (Effects of time limits
on Nonverbal subtests are unknown)
0% (lowest levels untimed;
remaining levels10 minute per subtest time limit based on
75% student attempt of every item)
0%
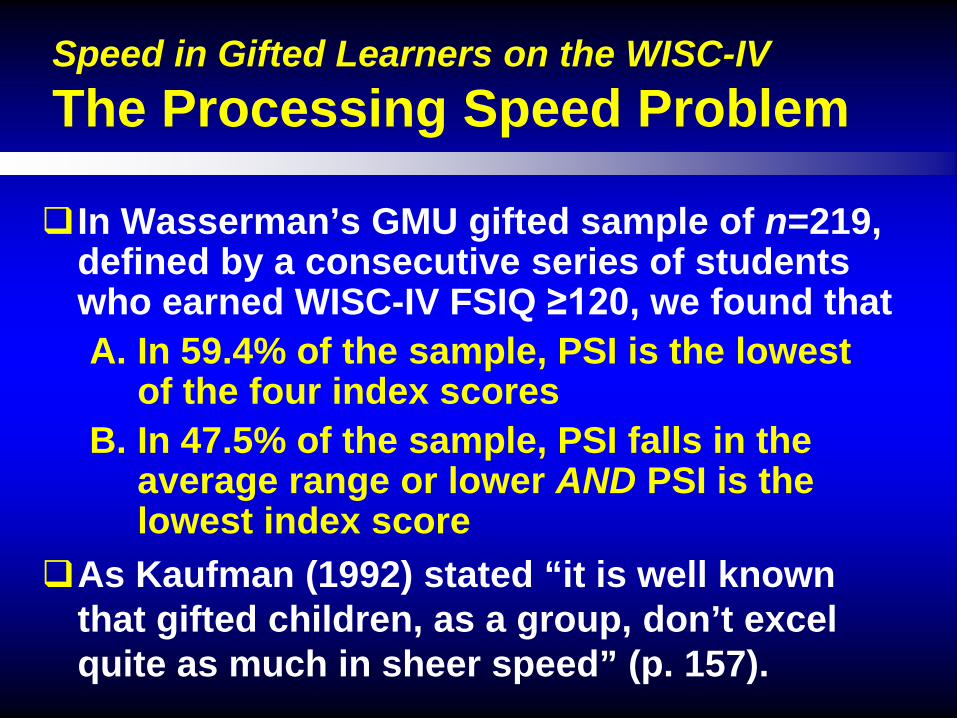
Speed in Gifted Learners on the WISC-IV The Processing Speed Problem
In Wasserman’s GMU gifted sample of n=219, defined by a consecutive series of students who earned WISC-IV FSIQ ≥120, we found that A. In 59.4% of the sample, PSI is the lowest
of the four index scores B. In 47.5% of the sample, PSI falls in the
average range or lower AND PSI is the lowest index score
As Kaufman (1992) stated “it is well known that gifted children, as a group, don’t excel quite as much in sheer speed” (p. 157).
Speed in Gifted Learners on the WISC-IV The Processing Speed Problem
Processing speed contributes 20% to WISC-IV Full Scale IQ and will easily depress the FSIQ
Mean PSI=110.6 (SD=11.5) in both the WISC-IV intellectually gifted research sample and my GMU Gifted Assessment Program sample (n=219, Mean PSI=110.4, SD=12.2) relative to Mean VCI of 124 (TPC) to 127 (GMU)
Based on differences between index scores required for statistical significance (VCI-PSI critical value of 12.6 at p=.05 for all ages), the average intellectually gifted student will show a relative weakness in processing speed
Additional forms of … Evidence of Test Score Validity
WISC-IV
WJ III NU Cog
SB5
DAS-II
Developmental evidence
No Yes Yes No
Exploratory factor
analyses
Yes No No No
Confirmatory factor
analyses
Yes Yes Yes Yes
Effect size std. difference
typical/gifted
1.49 for FSIQ (Large)
Not reported Not reported 1.74 for GCA; 1.44 for SNC
(Large)
Additional forms of … Evidence of Test Score Validity
KABC-II CAS RIAS CogAT7 OLSAT8 Dev’pmental
evidence No No Yes No No
Exploratory factor
analyses
No Yes Yes No No
Confirmatory factor
analyses
Yes Yes Yes Yes No
Effect size std.
difference typical/gifted
~1.3 for FCI; ~1.2 for MPI
(Large)
None None None None
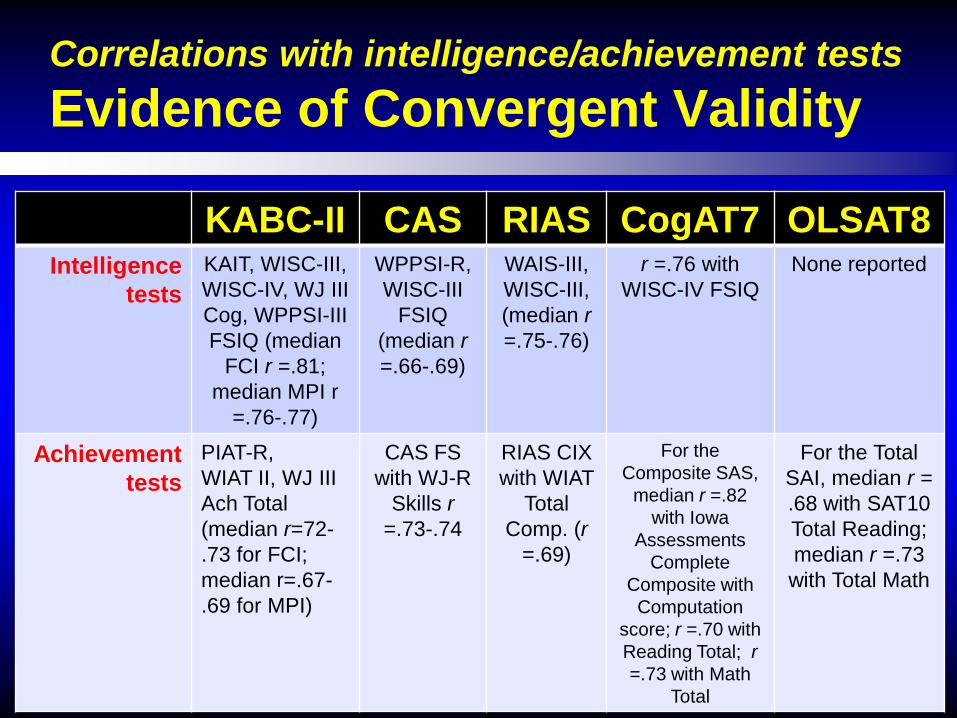
Correlations with intelligence/achievement tests Evidence of Convergent Validity
WISC-IV
WJ III NU Cog
SB5
DAS-II
Intelligence tests
r =.83 to .86 with WASI
FSIQ
DAS GCA, SB-IV, WISC-III, WPPSI-R FSIQ (median
r =.73-.74)
WAIS-III, WISC-III, WJ
III Cog, WPPSI-R
FSIQ (median r =.82-.83)
WISC-IV with GCA yields r
=.84; SNC has r = .78
Achievement tests
WIAT-II, WIAT-III Total
(median r =.82-.87)
WJ III Ach Total Ach (r=.75 for
GIA-Std and r =.76 for GIA-
Ext)
WIAT-II Total, WJ III Ach Academic
Applications (r =.80-.84)
KTEA-II, WIAT-II,
WIAT-III, WJ III Ach Total
(median r =.80)
Correlations with intelligence/achievement tests Evidence of Convergent Validity
KABC-II CAS RIAS CogAT7 OLSAT8 Intelligence
tests KAIT, WISC-III, WISC-IV, WJ III Cog, WPPSI-III FSIQ (median
FCI r =.81; median MPI r
=.76-.77)
WPPSI-R, WISC-III
FSIQ (median r =.66-.69)
WAIS-III, WISC-III, (median r =.75-.76)
r =.76 with WISC-IV FSIQ
None reported
Achievement tests
PIAT-R, WIAT II, WJ III Ach Total (median r=72-.73 for FCI; median r=.67-.69 for MPI)
CAS FS with WJ-R
Skills r =.73-.74
RIAS CIX with WIAT
Total Comp. (r
=.69)
For the Composite SAS,
median r =.82 with Iowa
Assessments Complete
Composite with Computation
score; r =.70 with Reading Total; r =.73 with Math
Total
For the Total SAI, median r = .68 with SAT10 Total Reading; median r =.73 with Total Math
Ecological Validity
Ecological validity relates test performance to various aspects of person-environment functioning in everyday life.
Example: In a sample n = 406, WISC-IV FSIQ correlates at r =.53 with teacher ratings on the Intellectual scale and r =.54 with teacher ratings on the Academic Ability scale of the Gifted Rating Scales (GRS-S), but less with the Leadership scale (r = .29).
Consequential Validity
As formulated by Messick (1989, 1995), consequential validity refers to the actual and potential consequences of test use (e.g., disparate or discriminatory impact on protected groups)
After a comprehensive survey of validity research, Cizek, Bowen, and Church (2010) reported that consequential validity research was “essential nonexistent in the professional literature” (p. 732).
Some concluding observations Evidence of Test Score Validity
Ability and intelligence tests vary in the degree to which they measure knowledge, reasoning, and mathematical abilities
Tests vary in their auditory/visual processing demands and speed requirements
All tests with gifted samples report large typical student – gifted student differences
Most tests report composite correlations r > .70 with other ability tests and achievement tests
Some concluding observations Evidence of Test Score Validity
Highest mean test scores in gifted samples tend to be on high “g” tests with content emphasizing verbal acquired knowledge, followed by fluid reasoning (both high “g” abilities)
Lowest mean test scores in gifted samples tend to be on low “g” tests and cognitive processing tests, that tap processes such as performance speed
Areas for future research Evidence of Test Score Validity What about our tests predicts success in
gifted curriculums? Correlations with multiple indices of outcome in the
gifted classroom and curriculum. Effects of verbal, visual, learning, speed on
classroom performance
Does “g” still define giftedness at higher levels, or something else? Structural invariance and g loadings to test
Spearman’s Law of Diminishing Returns. Are all good “g” tests the same? Spearman’s
Indifference of the Indicator.
Ability and intelligence tests
Evidence of Test Score Fairness
On Test Score Fairness
The broad concept of test fairness extends from the statistical properties of test items across particular groups through the application of test scores for decision-making, and finally extending through the consequential social impact of the decision.
On Test Score Fairness
Test score bias is a statistically-identified problem that refers to systematic introduction of measurement error for a particular group of interest.
Fairness refers in a more global sense to how test scores are used to make decisions.
Equity refers to the societal values attached to intended and unintended consequences of using test scores to make decisions.
Conventional evidence of fairness Fairness of Theory and Content
WISC-IV
WJ III NU Cog
SB5
DAS-II
Test theory addresses
fairness
No No No No
Bias content review panel
Yes No Yes Yes
KABC-II CAS RIAS CogAT7 OLSAT8 Yes Yes No No No Yes No Yes Yes Yes
Conventional evidence of fairness Statistical Indices of Fairness
WISC-IV
WJ III NU Cog
SB5
DAS-II
DIF analyses reported
No No (conducted but
inadequately reported)
Yes Yes (using IRT procedures)
Structural invariance
reported
No
Yes
Yes No
Reliability generalization
Yes (for special populations,
but not race/ethnic groups)
No No Yes (for special populations,
but not race/ethnic groups)
KABC-II CAS RIAS CogAT7 OLSAT8 Yes Yes Yes Yes Yes No No Yes Yes No No No Yes Yes No
Conventional evidence of fairness Fair Prediction and Outcome
WISC-IV
WJ III NU Cog
SB5
DAS-II
Equivalent prediction of achievement
No No Yes Yes
Group mean score
differences
Yes (published separately)
No No No
KABC-II CAS RIAS CogAT7 OLSAT8 No Yes No Yes No Yes Yes
(published separately in a series of Naglieri articles)
No Yes No
US DOE Office of Civil Rights Minority Gifted Underrepresentation
The problem of minority underrepresentation in gifted education programs has long been recognized and is the main reason for the rise of nonverbal tests in the identification process
Any minority-group child who is or may be gifted is protected by civil rights laws that prohibit discrimination based on race or national origin.
The Office of Civil Rights can be enormously effective in ordering school districts to change gifted identification practices.
Specific to gifted learners Evidence of Test Score Fairness
WISC-IV
WJ III NU Cog
SB5
DAS-II
Evidence of Proportionate identification
in gifted programs
No
No
No
No
KABC-II CAS RIAS CogAT7 OLSAT8 No No No Yes No
Ability and intelligence tests with gifted learners
Overview of Test Strengths and Limitations
Wechsler (2003) WISC-IV
Wechsler Intelligence Scale for Children
Normed for ages of 6 to16 years Consists of 10 core and 5 supplemental
subtests; the WISC-IV Integrated includes optional process-based subtests in each of the four factor-defined domains on the WISC-IV
The Wechsler intelligence scales are decidedly atheoretical, beyond their emphasis on g, and in recent years they have exemplified a test in search of a theory.
WISC-IV Strengths
Wechsler Intelligence Scale for Children
1. Far and away the industry standard for gifted assessment (Robertson, Pfeiffer, & Taylor, 2011)
2. Emphasizes reasoning and knowledge (60% of subtests) relative to processing capacity and speed (40% of subtests)
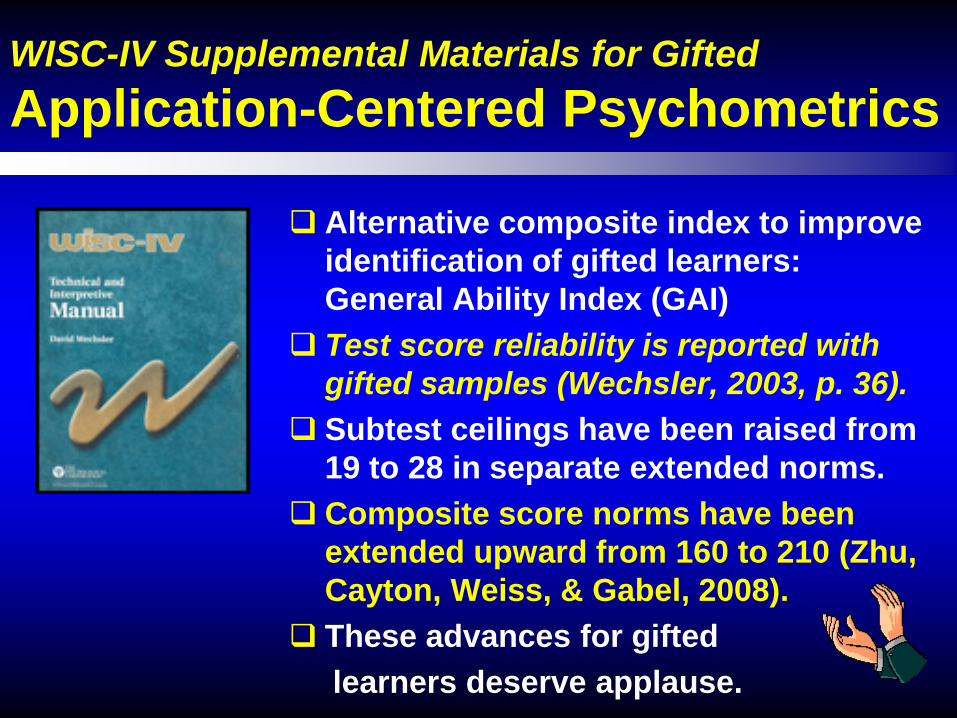
3. Offers the General Ability Index (GAI) as a purer measure of “g” than FSIQ
4. Extended Norms represent a technical innovation with huge implications for gifted learners
WISC-IV (2003) Limitations, Part 1
Wechsler Intelligence Scale for Children
1. Some 40% of WISC-IV FSIQ allocated to cognitive efficiency, which is low “g” and of questionable predictive power for at least half of gifted students
2. Processing speed is a common relative weakness among gifted learners. In 47.5% of our GMU consecutive gifted referral sample, PSI falls in the average range or lower AND PSI is the lowest index score
WISC-IV (2003) Limitations, Part 2
Wechsler Intelligence Scale for Children
3. The inexplicable omission of Arithmetic as a test with high “g” from core subtests reduces the test’s capacity to detect mathematically precocious gifted students.
4. As the industry leader, the WISC must develop improved evidence of fairness and meaningful linkage to educational interventions if the construct of intelligence is to survive sociopolitical battles in education.
Woodcock, McGrew, & Mather (2001, 2007) WJ III NU Cog
WJ III NU Tests of Cognitive Abilities
An assessment battery normed for ages 2 through 90 plus years and conormed with a leading achievement test, the WJ III NU Ach.
Consists of two batteries: a 10-test standard battery and a 20-test extended battery. A Diagnostic Supplement includes an additional 11 tests.
Based on the CHC theory of cognitive abilities.
WJ III NU Cog Strengths, Part 1 WJ III NU Tests of Cognitive Abilities
1. A study (n=34) by Margulies and Floyd (2009) with independent GT identification criteria showed Gf (mean=117.4, SD=9.9) and Gc (mean=115.3, SD=10.3) best differentiated gifted from nongifted matched students
2. The WJ III is technically progressive in its use of item response theory, including its pioneering applications of Rasch logit scores (transformed to W scores)
WJ III NU Cog Strengths, Part 1 WJ III NU Tests of Cognitive Abilities
3. Conormed with industry-leader achievement test, the WJ III NU Tests of Achievement
4. Elegant exemplar of the Cattell-Horn-Carroll factorial model of cognitive abilities; however, no hierarchical exploratory factor analysis (of the type previously conducted by Carroll) has been yet published with the WJ III Cog
WJ III NU Cog Limitations, Part 1 WJ III NU Tests of Cognitive Abilities
1. Yields the lowest scores of all seven intelligence tests with known gifted samples (GIA Std=116, SD=10).
2. Numerous serious technical problems, including the need for a normative update a mere six years after initial publication and the absence of printed norms.
WJ III NU Limitations, Part 2 WJ III NU Tests of Cognitive Abilities
3. Largest contribution to GIA consistently comes from the Verbal Comprehension test (Gc), and Gf is “a rather weak, poorly defined factor” according to John Carroll (2003). GIA is most defined by knowledge.
4. A pattern of overstated claims, technical omissions, and selective reporting of research findings. See Wasserman & Maccubbin (2003) and Wasserman (2013).
Normed for ages 2 through 85+ years Consists of 10 subtests, with the tasks
comprising subtests administered in an age-appropriate spiral omnibus format The SB5 features age-appropriate
tasks and endeavors to integrate the CHC model with the traditional verbal-nonverbal dichotomy
SB5 Strengths Stanford-Binet Intelligence Scales
1. The SB5 provides a good measure of the general ability factor, “g.” All SB5 subtests (9 out of 10) but Nonverbal Fluid Reasoning have high (>70) g loadings.
2. The spiral omnibus age-scale format keeps assessments varied, brief, and fast-moving.
SB5 Strengths Stanford-Binet Intelligence Scales
3. In reporting the SB5 gifted sample (Roid, 2003), the test performs well with known gifted learners; however, in the Minton and Pratt (2006) study the SB5 performed quite poorly with WISC-III identified gifted learners
4. The Extended IQ score (EXIQ) is unresearched but promising.
SB5 Limitations, Part 1 Stanford-Binet Intelligence Scales
1. Support is poor for the SB5 division of test content into verbal and nonverbal. Inexplicably, some nonverbal tests require the examinee to verbally express an answer (e.g., Picture Absurdities which is part of Nonverbal Knowledge). In hierarchical EFA, “… some of the SB-5 ‘nonverbal’ subtests actually account for more verbal factor variance than nonverbal factor variance …” Canivez (2008, p. 539).
SB5 Limitations, Part 2 Stanford-Binet Intelligence Scales
2. Factor analyses do not support the SB5 five factor interpretive structure (FR, KN, QR, VS, WM) (e.g., Canivez, 2008).
offers efficient ability profiling divided into two overlapping batteries standardized for ages 2½ through 17 years
consists of four core subtests (lower level) or six core subtests (upper level) for the Early Years Battery (ages 2:6-6:11) and six core subtests for the School-Age Battery (ages 7:0-17:11).
developed to accommodate diverse perspectives, but it now aligns most closely with the Cattell-Horn-Carroll model
DAS-II Strengths, Part 1 Differential Ability Scales-II
1. Provides a superior measure of general ability (GCA) that effectively captures the abilities of known gifted learners in the test handbook’s special population study (mean GCA=125.4 [SD=10.3]; see Elliott, 2007)
2. Psychometrically rigorous, advanced, and comprehensive relative to other intelligence tests; exceptionally well-constructed
DAS-II Strengths, Part 2 Differential Ability Scales-II
3. Adequate specificity for all subtests and cluster scores for their individual interpretation independent of “g”, thereby potentially facilitating identification of twice-exceptional students (Elliott, 2007)
4. Co-norming of the Early Years Battery with the School-Age Battery for ages 5:0 to 8:11 permits earlier identification of gifted preschoolers
DAS-II Limitations Differential Ability Scales-II
1. Much subtest content appears redundant with the WISC-IV, probably explaining the similar results to assessment with the WISC-IV GAI
2. The Copying subtest, a paper and pencil measure of visual-motor integration, contributes to the GCA from ages 3:6 to 6:11 but does not effectively discriminate gifted from matched nongifted students (Elliott, 2007, pp. 186-187)
measures processing and cognitive abilities from age 3 years through 18 years and is conormed with the KTEA-II
Depending on age and theoretical framework, batteries consist of 5 to 10 core subtests and 3 to 7 supplemental subtests.
Developed with an unusual dual theoretical foundation, lending itself to interpretation with either the CHC framework or a Luria (PLSS) neuropsychological processing framework.
KABC-II Strengths Kaufman Assessment Battery-II
1. Endeavors to minimize the impact of cultural and linguistic differences in assessment, reporting data showing lower group mean score differences between majority and minority groups
2. The Kaufmans continue to be progressive and innovative in their psychometric test development work
3. May well identify a different type of gifted learner than that identified with knowledge-loaded tests like the WISC-IV
KABC-II Limitations, Part 1 Kaufman Assessment Battery-II
1. Processing subtests yield lower overall composite mean scores than traditional tests (mean KABC-II FCI=120.1 [11.8] and MPI=118.7 [11.9] in gifted sample, replicating K-ABC findings (e.g., McCallum, Karnes, & Edwards, 1984; Naglieri & Anderson, 1985)
2. Dual theoretical foundation (CHC and Luria) is unusual and raises issues about construct validity
KABC-II Limitations, Part 2 Kaufman Assessment Battery-II
3. Contents and processes involved in subtest performance not always clear; for example, the Rover subtest was designed to measure Planning/Gf but ended up on Simultaneous/Gv scale on the basis of factor analyses.
4. Needs independent research with gifted
Naglieri & Das (1997) CAS Cognitive Assessment System
cognitive processing battery intended for use with children and adolescents 5 through 17 years of age. available in two batteries: an eight
subtest basic battery and a twelve subtest standard battery derived from Luria’s three functional units
in the brain to yield Planning, Attention, Simultaneous, Successive (PASS)
CAS Strengths Cognitive Assessment System
1. Introduces assessment of executive function into intelligence testing
2. Tends to yield lower group mean score differences between majority and minority groups more than most other intelligence tests (e.g., Wasserman & Becker, 2000)
3. May well identify a different type of gifted learner than that identified with knowledge-loaded tests like the WISC-IV
CAS Limitations, Part 1 Cognitive Assessment System
1. No independent research on gifted applications
2. Some 50% of this test (planning and attention scales) is speeded, putting many gifted students at a disadvantage
3. Processing subtests yield lower overall composite mean scores than traditional tests (mean CAS Full Scale=118.2 [10.0] in gifted sample according to Naglieri & Das, 1997)
CAS Limitations, Part 2 Cognitive Assessment System
4. Problems with theory and test factor structure (little evidence to differentiate planning and attention; see e.g., Wasserman, 2012)
5. Canivez (2011a, 2011b, 2011c, 2011d) reports that after the variance due to general intelligence is removed, the four PASS factors account have inadequate specificity for valid interpretation
1. Administered in less than a half-hour, this is the most time efficient of intelligence tests (but then why not give a WASI-II?)
2. A number of technical innovations in test development (e.g., reporting score internal reliabilities, g loadings, and factor structure by gender and ethnicity)
RIAS Limitations, Part 1 Reynolds Intellectual Assessm’t Scales
1. Independent hierarchical exploratory factor analyses have yielded only fair g-loadings for the four core subtests across nearly all age ranges (Dombrowski, Watkins, & Brogan, 2009).
2. Factor analyses have yielded mixed results, with the nonverbal index subtests failing to support clear extraction of two factors in addition to a general factor (Beaujean, McGlaughlin, & Margulies, 2009; Nelson, Canivez, Lindstrom, & Hatt, 2007).
RIAS Limitations, Part 2 Reynolds Intellectual Assessm’t Scales
2. (Continued) Dombrowski, Watkins, and Brogan (2009) state: “The verbal subtests produced fair to poor factor loadings with the verbal factor, whereas the nonverbal subtests produced poor factor loadings on the nonverbal factor across all age ranges” (p. 501).
3. No published research with gifted samples yet in spite of misleading article titles: “The RIAS and Assessment of Intellectual Giftedness” by Brueggemann, Reynolds, & Kamphaus (2006)
RIAS Limitations, Part 3 Reynolds Intellectual Assessm’t Scales
4. Anecdotal evidence exists that the RIAS discontinue rules of two or three consecutive item scores of 0 dramatically lower the scores of gifted learners, who often succeed on more difficult items but may miss easier items. Bobbie Gilman reports instances in which a 30-point reduction in the CIX results when RIAS scores for all items administered versus scores with the formal discontinue rules are compared.
Lohman (2011, 2012) CogAT 7 Cognitive Abilities Test, Form 7
A group-administered, multiple choice, ten-level ability test normed for use with students between the ages of 5 to 18 (grades K to 12)
Intended to measure inductive and deductive reasoning (fluid ability) through verbal, quantitative, and nonverbal item content
Three test batteries yield a Composite SAS, Verbal SAS, Quantitative SAS, and Nonverbal SAS (normative mean=100, SD=16)
Impressive innovations in ELL testing at the early primary school levels.
CogAT 7 Strengths, Part 1 Cognitive Abilities Test, Form 7
1.Updated norms and co-normed with the Iowa Assessments.
2.The nine subtests in CogAT 7 are now continuous and developmentally appropriate across the entire school-age range of the test.
3.At every level, nearly 100% of students attempted 75% of the items. Test ceilings and floors appear very good.
4.CogAT 7 offers more accurate confidence intervals and reliability estimations for gifted students than almost any other measure.
CogAT 7 Strengths, Part 2 Cognitive Abilities Test, Form 7
5. Factor structure shows that all subtests but one at every level have their highest loadings on “g.”
6.Primary levels use a picture-format with items that were developed to be equally understandable to English and Spanish speakers. Levels at and after age 9 still require reading.
CogAT 7 Strengths, Part 3 Cognitive Abilities Test, Form 7
7.ELL Innovation: For use with ELL students at the three youngest levels (5/6, 7, and 8, corresponding to age), CogAT 7 contains picture-based formats with generic instructions that may be delivered in English or Spanish; only one optional subtest requires item-specific prompts in English or Spanish. Preliminary research suggests that this approach significantly improves identification of gifted ELL students, but only independent research will confirm this promise.
CogAT 7 Strengths, Part 4 Cognitive Abilities Test, Form 7
8.Potential Innovation in integration of CogAT 7, Iowa Assessments, and Renzulli teacher rating scale that has not elsewhere been tried.
9.David Lohman ranks as one of the preeminent scholars in intelligence of this era, and CogAT 7 may solve one of the major challenges in cognitive assessment and produce more equitable identification.
CogAT 7 Limitations, Part 1 Cognitive Abilities Test, Form 7
1. The norms undersampled African Americans and densely populated school districts.
2. Why is reading still required (at and after age 9) for an ability test?
3. Lost opportunity to scale CogAT above 160 to enable scientific research on highly gifted.
4. The author and previous test authors have cautioned against using the Composite SAS for gifted eligibility, because scores may be depressed by one area deficit. This is true for all ability and intelligence tests.
CogAT 7 Limitations, Part 2 Cognitive Abilities Test, Form 7
5. The author recommends the use of local norms rather than national norms for the purposes of gifted eligibility determination. If they were gathered carefully and with adequate sampling as it would appear, the national norms are likely to be optimally stable.
6. Too much CogAT research to date comes only from David Lohman, suggesting that research with this test is overcontrolled and highly selected. The absence of independent scholarship is a red flag.
Otis & Lennon (2003) OLSAT 8 Otis-Lennon School Ability Test, 8th ed.
A group-administered, multiple choice, multilevel test normed with 7 levels for use with students between the grades of Kindergarten through 12 (dates back to Otis, 1918)
OLSAT 8 is a broad range ability test “designed to measure those verbal, quantitative, and figural reasoning skills that are most closely related to scholastic achievement.”
OLSAT 8 generates three School Ability Indexes (Total SAI, Verbal SAI, and Nonverbal SAI) with a normative mean of 100 and a SD of 16.
OLSAT 8 Strengths, Part 1 Otis-Lennon School Ability Test, 8th ed.
1. Large scale norms (N=445,000) 2. Highly diverse verbal and nonverbal content
that may enhance its predictive validity (contains 21 multiple-choice item types designed to tap five content clusters, two in the Verbal area and three in the Nonverbal area)
3. Intermixing of item types and item difficulties (at all but the youngest ages) may offer advantages, but they are not demonstrated or reported.
OLSAT 8 Strengths, Part 2 Otis-Lennon School Ability Test, 8th ed.
4. Linked to Stanford Achievement Test 10th edition (SAT10)
5. The OLSAT is an effective predictor of academic achievement, even in low income urban settings (Karrh, 2009; Pearson, 2005; Wojcik, 2008).
OLSAT 8 Limitations, Part 1 Otis-Lennon School Ability Test, 8th ed.
1. Unsystematic and theory-lite sampling of tasks in the verbal and nonverbal batteries.
2. OLSAT 8 appears to be based primarily on classical test theory, not benefitting from analysis with item response theory psychometrics.
3. Normed with a large urban undersample. 4. Score reliabilities for the Verbal SAI and
Nonverbal SAI need improvement unless the composite reliabilities (in the .80s) is offset by improved predictive validity.
OLSAT 8 Limitations, Part 2 Otis-Lennon School Ability Test, 8th ed.
5. Inadequate evidence of test score validity presented, especially relative to the intended applications of this test, including identification of giftedness
6. No factor analyses to affirm its structure. 7. Needs contemporary research on test score
fairness. 8. Needs independent research with gifted
students. 9. Needs effective academic proponents to guide
research and development.
Finis
If you have comments or would like a complete reference list, please send me an email. I can be reached in my Virginia practice at [email protected] or by telephone at (703) 349-4520.