Demand for energy will increase dramatically in the coming years. A growing awareness of the negative effects of burning fossil fuels is generating a demand for clean, renewable energy. The U.S. energy sector is implementing a variety of power generation methods in addition to traditional nuclear and fossil fuel sources, such as photovoltaic solar, wind, geothermal, and tidal power. Changes in corporate structure and ownership patterns, aimed to encourage sustainability and ensure prices reflect the true social cost of production, further add to the complexity of the American energy sector, and raise some important questions. What constituent groups are affected by changes in diversity in the domes tic energy sector? Do increases in energy source and organizational diversity improve the security of our energy supply? How does change in energy diversity affect the cost consumers pay for energy? Can weuse diversity trends to improve energy related policies? This research seeks to answer some of those questions.The study develops empirical models that utilize data from the Department of Energy and stock market data for U.S. energy companies. Regression analysis is employed to explain the effect of diversity and other relevant factors on balance, variety, and disparity of energy. The research considers the policy implications of diversity. While early stages of diversification may result in net benefits for both energy companies and consumers, over-diversifying energy sources and corporate structures may result in net loss. Increases in transaction costs, decreased economiesof scale and increases in implementation costs for sector-wide policy changes are possible reasons for this. The study concludes by examining the current implementation of renewable energy and what diversity means for the U.S. internationally.
ArcologyDesigns Studio May 2013 1 | Page An Examination of U.S. Energy Policy in Terms of Security and Diversity The Effects on Energy Supply, the Economy, and Our Environment Borislav Sabotinov
Transcript
ArcologyDesigns Studio May 2013
1 | P a g e
An Examination of U.S. Energy Policy in Terms of Security and Diversity
The Effects on Energy Supply, the Economy, and Our Environment
Borislav Sabotinov
ArcologyDesigns Studio May 2013
2 | P a g e
The Effects of Diversity on the U.S. Energy Sector
Abstract
Demand for energy will increase dramatically in the coming years. A growing awareness of the negative effects of burning fossil fuels is generating a demand for clean, renewable energy. The U.S. energy sector is implementing a variety of power generation methods in addition to traditional nuclear and fossil fuel sources, such as photovoltaic solar, wind, geothermal, and tidal power. Changes in corporate structure and ownership patterns, aimed to encourage sustainability and ensure prices reflect the true social cost of production, further add to the complexity of the American energy sector, and raise some important questions. What constituent groups are affected by changes in diversity in the domestic energy sector? Do increases in energy source and organizational diversity improve the security of our energy supply? How does change in energy diversity affect the cost consumers pay for energy? Can we use diversity trends to improve energy related policies? This research seeks to answer some of those questions. The study develops empirical models that utilize data from the Department of Energy and stock market data for U.S. energy companies. Regression analysis is employed to explain the effect of diversity and other relevant factors on balance, variety, and disparity of energy. The research considers the policy implications of diversity. While early stages of diversification may result in net benefits for both energy companies and consumers, over-diversifying energy sources and corporate structures may result in net loss. Increases in transaction costs, decreased economies of scale and increases in implementation costs for sector-wide policy changes are possible reasons for this. The study concludes by examining the current implementation of renewable energy and what diversity means for the U.S. internationally.
ArcologyDesigns Studio May 2013
3 | P a g e
Table of Contents Overview ......................................................................................................................................... 5
Chapter 1: The Instrumental Role of Individual Agency in the Energy Sector ............................... 5
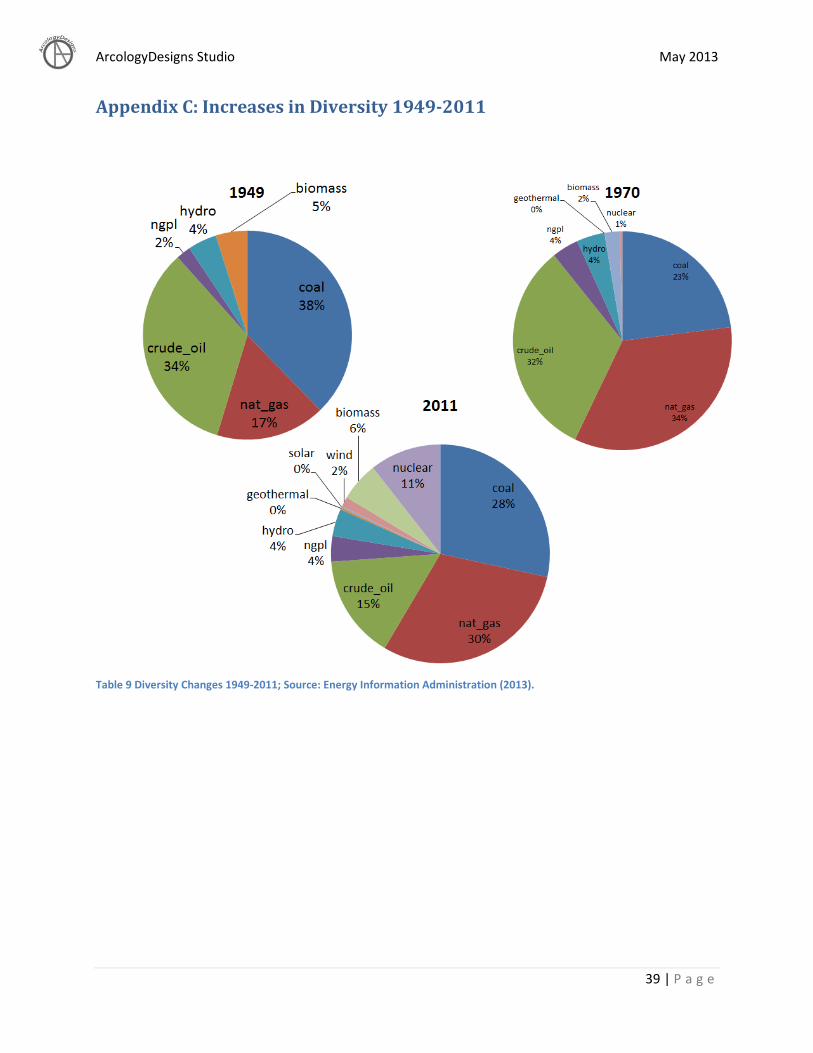
Diversity in our energy sector does more than increase the security of supply. It affects our workforce, environment, economy, and ability to lead the lives we want. To analyze energy diversity “as a simple function of conventional categories of primary fuels or fuel-price variability…is to [miss] a crucial part of its strategic value.”1 Diversity must be evaluated holistically, especially in regards to public policy, as incompleteness or inconsistency can result in “potentially negative feedbacks between high penetrations from intermittent renewables and the inflexibility of large, predominantly base-load plant like nuclear power,”2 which can crowd-out investment in alternative methods of energy generation. Historic trends indicate diversity is on the increase (see Appendix C: Increases in Diversity 1949-2011).
I begin by examining the role of individual agency and choice in the energy sector in Chapter 1. In Chapter 2, I examine the currently ongoing shift from fossil fuels to renewable sources through two distinct schools of thought. These first two chapters are intended to set the attention of this work on the effects of renewables and factors that affect, but are perhaps external to, the energy sector.
Chapter 3 examines the effect of diversity on the energy supply and the economy through a brief examination of specific case studies. Chapter 4 examines in detail the quantitative models on which this study is based and proposes three novel indices to measure energy security and diversity. Chapter 5 provides a game-theoretic analysis of the motivation of agents in the energy sector and how this affects company behavior. This relates to Chapter 1 where the role of individual agency is examined on a theoretical basis. Chapter 6 takes the lessons learned from Chapters 1 – 5 and applies it to specific and measurable policy recommendations aimed to address factors affecting the security of our energy supply.
Chapter 1: The Instrumental Role of Individual Agency in the Energy Sector
Abstract
This chapter addresses ways the energy sector can be holistically transformed to ensure it is sustainable, environmentally safe, and that it delivers socially valuable results. We examine the Sen Thesis, which provides a conceptual framework based on the instrumental role of energy production as a means of enhancing human freedom. Individual agency empowers citizens to use energy for valuable purposes and take part in civil discourse; this makes possible the construction of better policies for the future. The components of the framework are mutually reinforcing and can help usher in a new energy sector, one better able to increase the agency of all members of society while meeting their needs. This policy agenda, rooted in the Sen Thesis, is contrasted with the utilitarian and libertarian approaches and their respective advantages and disadvantages, which are noted in an effort to prevent inappropriate policy choices.
ArcologyDesigns Studio May 2013
6 | P a g e
The Value of Individual Empowerment
Energy is necessary for both commercial and civilian activities; as such, one must ensure the energy sector has the capacity to meet demand in a sustainable, environmentally conscious manner. Simply satisfying demand is insufficient – unsustainable energy policies and excessive levels of pollution can adversely affect the lives of people by limiting their access to energy and therefore their freedom to conduct business and interact with one another in the market. By examining energy in terms of its instrumental role in promoting human freedom, and its ability to increase individual agency, the way forward to a socially responsible, environmentally neutral, and economically strengthening energy sector becomes clear. The change needed in the energy sector is attainable through an all-inclusive approach taking multiple criteria into consideration, thus making “simultaneous progress on different fronts, including different institutions, which reinforce each other.”3
The freedom of commerce and communication in a market environment are “part…of the basic liberties that people have reason to value.”4 Energy is the building block that enables commerce and makes associated freedoms feasible; without energy contemporary activities related to exchange, manufacturing, and technology use become unmanageable. Energy, therefore, is a means to an end but not an end itself. Sen sees income and wealth as “general-purpose means for having more freedom to lead the kind of lives we have reason to value.”5 In the same way energy is a means for obtaining more freedom to better the lives of people. A counter-argument may point out that it takes income to obtain energy, making it a commodity. This is misleading.
Maslow’s hierarchy of needs6 sees initial income used to obtain food, water, and shelter – the basic necessities of life – followed by other valuables which may not be considered necessary. In a similar way energy is used for the same purposes, more specifically the production of food, delivery of water, and construction of housing followed by other uses. Energy, like income, is invested where it is most valuable, with the value determined by individual and societal needs, followed by preferences. Sen demonstrates that “the economic entitlements [a] person has will depend on the resources owned or available for use as well as on conditions of exchange, such as relative prices and the working of the markets.”7 Energy is an element influencing the price of virtually all goods and services and thus the capacity of individuals to claim their entitlement, which is presumably earned. How, then, can public policy guarantee an individual’s ability to obtain energy so that he or she may in turn use it to pursue valued activities that fulfill their needs?
Ways to Get There
Such policy is achieved through a rounded, multifaceted approach targeting several social, economic, and political factors exerting direct and indirect effects on the energy sector. The transformation of energy policy to maximize individual agency and freedom becomes possible by: decreasing yearly work hours to free up time for education and family; increasing employment security, “including a living minimum wage, protection of labor’s right to organize, and generous parental leaves;” redesigning the corporate model to value “stakeholder primacy rather than shareholder primacy;” placing limits on marketing that may skew public decision
ArcologyDesigns Studio May 2013
7 | P a g e
making and discourse; providing “incentives for local and locally owned production and consumption; including strong social and environmental provisions in trade agreements; providing rigorous environmental, health, and consumer protection;” designing more efficient and equitable tax codes and energy regulations; allocating “greater income support for the poor; increasing spending on neglected public services;” 8 and managing overpopulation issues.
This is a complex yet feasible approach to energy policy. Given that “development has to be more concerned with enhancing the lives we lead and the freedoms we enjoy,”9 a positive transformation of the energy sector is not possible with incremental changes in any single policy area. Cooperation among both the national and state governments is necessary to achieve “systematic, transformative change.”10 One must keep in mind that the goal is not the development of the energy sector itself but the attainment of human freedom, “the intrinsic importance” of which “has to be distinguished from the instrumental effectiveness of freedom of different kinds to promote human freedom.”11
It is this mutually reinforcing approach to energy policy, addressing varying and seemingly disparate and unrelated factors, that enables individuals to become “dynamic promoters of social transformations that can alter the lives of”12 others. Energy production is a “result of human agency, and to understand the incentives that operate on peoples decisions and actions”13 one must look first to their needs and then to the results they find most valuable. Society produces energy first to sustain itself; only then can energy be used for the varying purposes people find valuable. A multifaceted approach to energy production, addressing factors not visibly tied to energy but exerting a powerful influence nonetheless, can better capture the diversity in valuable outcomes among people while simultaneously removing barriers to individual freedom and increasing the agency of all citizens. In that way, they can be free to live as they desire.
The choice, then, is “not whether to respond to the challenge of accommodating divergent perspectives on disparity but how – and with what degree of rigor and openness.”14 The combination of market use with the “development of social opportunities” is still only part of a “broader comprehensive approach that also emphasizes freedoms”15 such as individual rights and the chance to collaborate with others on public policy. We can contrast this instrumental approach under the Sen Thesis with the methods of utilitarianism and libertarianism.
The Utilitarian and Libertarian Perspectives
Utilitarianism judges choices based on “the respective utilities [they] generate”16 and accounts for the “results of social arrangements.”17 It focuses on consequences and the well-being of people as a group but it “has no interest in the actual distribution of utilities, since the concentration is entirely on the total utility of everyone.”18 Thus on the aggregate, energy should be seen as a “[social] good, which people consume together rather than separately.”19 While individuals and businesses consume energy for varying purposes, at the national level energy production and consumption must be guided by policies emphasizing sustainability and affordability so as to promote development and thus human freedom. While the former aspects of utilitarianism are beneficial, this approach “attaches no intrinsic importance to claims of rights and freedoms”20 of individuals and as such serves to diminish their agency.
ArcologyDesigns Studio May 2013
8 | P a g e
The libertarian approach, on the other hand, “demands compliance with certain rules of liberty and propriety, assessing the situation through information on this compliance.”21 The libertarian focus on equitable procedure ignores other vital factors, such as individual preferences and the disadvantage of specific groups within society, such as African American males and females in the U.S. when compared to their white counterparts. As mentioned previously, relative pricing matters and a socially disadvantaged group may not have the agency, or means, to obtain the energy they need. Even if they do, the method of energy production available to them may carry severe negative externalities, that, when accounted for, outweigh the benefits derived. One sees then how “the uncompromising priority of libertarian rights can be particularly problematic since the actual consequences of the operation of…entitlements can include rather terrible results.”22 The significance of certain freedoms, such as the freedoms to be healthy and survive, cannot be ignored on grounds of the ‘priority of liberty’”23 in absolute terms. Thus, libertarianism is limited because it disregards “those variables to which utilitarian and welfarist theories attach great importance [and] also neglects the most basic freedoms that we have reason to treasure and demand.”24 While offering some useful methods to address the needed changes in the energy sector, both the utilitarian and libertarian styles carry severe deficiencies. One must not forget that energy production is the backbone of economic activity, “the priority of [which] is to sustain human and natural communities.”25Regardless of which approach is used, energy prices should reflect “true environmental costs.”26 This ensures information is accurately transmitted between individuals, further increasing their agency.
Concluding Remarks
Accurate information also leads to stronger and more useful public discourse. Civil discourse about energy policies and policies in general is an “important requirement of good public policy since the appropriate role and reach of markets cannot be predetermined on the basis of some”27 singular principle. The diversity in energy sources, uses, and effects combined with the varying individual and societal needs and priorities, serves to emphasize the need for “critical public debate.”28 Public discussion leads to better and more useful policy choices, ensuring “energy production [is] distributed and decentralized, and predominantly renewable.”29 Renewable energy is a critical aspect in the transformation of the energy sector because it enables it to not only deal with current issues but anticipate future ones as well, given its sustainability element. An examination of contemporary energy sources reveals that “each possible sustainable energy pathway displays dynamics of ‘increasing returns,’”30 thus making renewable energy a prime candidate for future growth and development, and thus an increase in both human freedom and agency.
ArcologyDesigns Studio May 2013
9 | P a g e
Chapter 2: Problems and Opportunities in the Transition from Fossil Fuels to Renewables
Abstract
This chapter examines opportunities in the transition from fossil fuels to renewable energy types through two approaches - the Hamiltonian and Wilsonian schools of thought. They offer unique and practical ways in which energy related policies may be analyzed. The Hamiltonian economic focus and the Wilsonian social focus both carry diverse benefits and disadvantages. The ongoing energy sector transformation can be addressed using either school of thought; alternatively, a combination of Hamiltonian and Wilsonian methods can offer some of the benefits of both approaches while mitigating any respective drawbacks through mutual reinforcement. By relying on existing infrastructure to remain internationally competitive, facilitating trade in order to build partnerships and alliances, and providing the international community with an example of successful socioeconomic renewable energy and sustainability policies the United States can successfully transition from fossil fuels to clean energy. Additionally, this will expedite the shift in international perception necessary to favor environmentally sound business models.
Ways Forward
The United States is beginning a gradual transition from traditional to renewable methods of electricity generation. This poses special challenges in terms of both domestic and international policies. America’s existing energy infrastructure and international partnerships are primarily centered on traditional fossil fuels – coal, oil and natural gas. The cost of implementing new, cleaner and more sustainable alternatives is twofold; existing infrastructure must be appropriately modified or dismantled31 and the sites cleaned up prior to erecting new, renewable energy facilities. Decision makers must take into account the developed infrastructure surrounding existing coal mines and power plants, oil wells and refineries and fracking32 operations when implementing policies designed to facilitate the transition from fossil fuels to wind, solar and geothermal sources. Laying down new infrastructure is simpler; existing infrastructure poses special challenges because it must undergo the costly process of being removed or redesigned to accommodate new technology. Analyzing such policy options through both the Hamiltonian and Wilsonian schools of thought offers unique perspectives and illuminates several effective courses of action.
A Hamiltonian Perspective on the Transition
The Hamiltonian school views energy in terms of economic choices, opportunities and costs; it is “neither isolationist, unrealistically idealistic, nor amateurish33” but rather firmly grounded in the contemporary sociopolitical reality. Energy is required for economic development, industry and growth. A critical factor to consider is the effect a costly energy sector transition may have on the United States’ international competitiveness. Renewable energy is currently more expensive34 and lacks the base load capacity35 of traditional sources. A
ArcologyDesigns Studio May 2013
10 | P a g e
hasty conversion at a time when alternative energy is not cost effective could increase the cost of business, consequently decreasing American exports and trade opportunities. International investors are likely to seek more profitable ventures in low-cost markets. Hamiltonians will thus lean towards supporting existing infrastructure and traditional methods of energy generation, even if it requires continuous petroleum imports.
America’s dependence on such imports is not necessarily a “zero-sum game,” as Hamiltonians view “commerce as…a cause of peace” and pursue “constructive compromises of mutual benefit in [their] dealings with foreign powers36.” Trade requires cooperation, assists in the building of relationships and provides positive benefits to the involved participants. Nevertheless, the strategic importance of oil to the US economy and military is not lost on Hamiltonians who conduct “foreign policy with one eye on the necessity of maintaining access to…strategically necessary materials37.” According to the Hamiltonian view, participation in trade, including trade involving vital resources, assists in the formation of alliances that actually serve to increase the security of the United States38.
It is the existence of vested economic interest that assures international cooperation and stability and the existence of a “global economic system that rest[s] primarily on the free participation of independent states39.” A rapid transition from fossil fuels to renewables may serve to undermine the existing trade relations between the United States and oil exporting nations, such as Canada, Mexico, Saudi Arabia and Iraq40. This, in turn, might potentially destabilize the international community and preclude cooperation in the future. Thus, the benefits of the Hamiltonian approach are principally associated with increased trade, security and competitiveness and favorable international relations and cooperation. Its drawbacks, however, raise social and environmental concerns both here and abroad.
A persistent focus on fossil fuels as a primary energy source generates high levels of pollution, which, in the Hamiltonian school, are not counted as a direct cost. Instead, pollution is an externalized cost that must be paid for by the public. Assigning a dollar value to the damage caused by pollution is no easy task. This, nevertheless, is not the primary reason for the externalization of environmental costs. The problem lies deeper, striking at the very motivation for Hamiltonian activities – profit. The primary motive of business is to generate profit, which can be raised by allowing “real social, environmental, and economic costs [to be] borne by society at large and not by the firm.41” This serves to distort corporate behavior and decision making.
This is true at both the domestic and international levels. In their pursuit to attain Western-like affluence, many nations all but ignore environmental degradation and the contamination of natural resources, such as air, water and soil. An examination of the negative effects of pollution is beyond the scope of this analysis. What is of note, however, is that the Wilsonian school is capable of negating many of the Hamiltonian shortcomings.
A Wilsonian Perspective on the Transition
The Wilsonian approach is, at its most basic level, an inverse of the Hamiltonian perspective; it is strong where Hamiltonians are weak and vice versa. While it lacks economic prowess, it is capable of addressing the negative social and environmental effects of Hamiltonianism. The major impact of Wilsonian thought lies in the “creation of institutions,
ArcologyDesigns Studio May 2013
11 | P a g e
relationships, and cultural and social realities42.” That is to say, a Wilsonian approach enables the United States to build the regulatory institutions and foster the cultural mentality necessary to use Hamiltonian methods while appropriately addressing negative externalities. By advocating for carbon capture and storage, clean energy, regulatory oversight of Hamiltonian business practices and a shift in the cultural mentality so it is more mindful of the individual and collective impact on the environment43, the Wilsonian school creates a framework capable of channeling the Hamiltonian desire for trade, business growth and profit in a socially and ecologically constructive manner.
Wilsonians believe that “democratic policies are pulled toward the center and towards a rational concept of interest44.” Domestically, this interest currently focuses on the environment and its preservation through the implementation of sustainable energy sources and corporate practices. Wilsonian thought holds that “American foreign policy should support the social and political objectives of…the movement45.” This attitude contains both positive and negative properties. The benefit of the Wilsonian approach is primarily domestic, evaluated in terms of a healthier environment, with positive policy spillovers possible at the international level. By striving for domestic change, the United States creates a positive example for the international community and demonstrates that commercial success and environmental quality are not mutually exclusive goals.
This demonstration is vital given the Wilsonian missionary experience of the past; Wilsonians today know that “in order…to be effective, they [must] do more than preach the Gospel46.” Thus, the United States must lead the way in the global transition from fossil fuels to renewable energy. Rather than tell the international community to change their economic policies to be environmentally mindful, the United States can provide an example validating the importance of a healthy environment and the role renewable energy plays in bringing it about. This is an opportune time for many developing countries that have limited to no existing infrastructure based on fossil fuels. With appropriate economic incentives and policy choices they can avoid the mistakes of the past while laying the foundations for sustainable infrastructure. It is here, in international relations, that Wilsonian thought is most vulnerable.
The Wilsonian approach is exposed to criticism by the international community primarily because it “insists that the United States has the right and the duty to change the rest of the world’s behavior, and that the United States can and should concern itself not only with the way other countries conduct their international affairs, but with their domestic policies as well47.” Nations may feel resentment and a sense of unfairness when Wilsonians condemn them for environmental damage and advocate they change their domestic policies to scale down economic development. In the eyes of developing nations, they are doing nothing different from what the United States and other industrialized nations did to attain a high standard of living. This raises several problematic questions. Why should developing nations scale back economic development for the sake of the environment when developed Western nations did not? Why should the developing world not compete on an equal level with the United States and Europe by “catching up48”? Wilsonians believe “’backward’ countries [can] and should develop into Western-style industrial democracies49” but this process is viewed through an ethnocentric lens.
The very act of perceiving some nations as backward can be seen as either “patronizing50” or offensive. Wilsonian thought holds that “democracies make better and more
ArcologyDesigns Studio May 2013
12 | P a g e
reliable partners than monarchies and tyrannies51” and while this may be true, the United States is more likely to deal with the latter rather than the former given the locations of the world’s largest oil supplies. Imposing American cultural and social values on developing nations, insisting that an international order must be based on “principles of democratic government52” and that the “support of democracy abroad is…a practical imperative53” can be seen as a “’moralistic’ rather than a ‘moral’ foreign policy54.” This may have the unintended consequence of disrupting international relations if foreign governments feel threatened by the United States’ attempt at ideological propagation. The Hamiltonian approach to international cooperation through commerce is perhaps a more viable approach. This indicates that the Hamiltonian and Wilsonian schools of thought can work in concert to reinforce their strengths while avoiding or managing their respective weaknesses.
Concluding Remarks
A dual approach to public policy planning for the energy sector transformation, taking both Hamiltonian and Wilsonian ideas into consideration, is beneficial because it “deals with the use of today’s resources to meet tomorrow’s needs. It specifically tackles issues markets cannot solve: the choice of how much in the aggregate to invest, the directions to be taken by new technology [and] the question of how much weight and urgency are to be given to environmental issues55.” This seemingly symbiotic relationship between the Hamiltonian and Wilsonian schools of thought suggests that the most practical and beneficial approach is to use them not independently but rather in combination with one another. Both schools “look to a stable world order as the best case outcome of their activities56.” Both methods seek to ensure the economic and social success of the United States on the domestic and international levels; this “common set of concerns draws Wilsonians and Hamiltonians together, [enabling them] to work together on the set of interests and values they have in common57.” Using traditional energy, the U.S. can remain internationally competitive; engaging in commerce enhances domestic security through alliances and stability. Determined but gradual implementation of clean energy, especially when it becomes cost effective, shows other nations America’s commitment to leading by example and providing a clean, healthy environment for society, both at home and abroad.
ArcologyDesigns Studio May 2013
13 | P a g e
Chapter 3: The Importance of Energy Diversity – Its Effects on Energy Production and the Economy
Let us briefly examine two case studies. In the first, we take a look at Singapore and Hong Kong, specifically the effects government action has on policy and industry transformation. “The Singaporean government…pursued an active policy of industrial targeting, which has led to rapid structural transformation and allowed the Singaporean economy to catch up and surpass Hong Kong's initial lead in manufacturing. This is of use in exploring the implications of models that emphasize the existence of an explicit technological ladder (e.g., Stokey, 1988; Wan, 1975; Young, 1991a).”58 Here we see that government can actively target a specific industry and support its transformation. Is this what we see in the U.S. today in relation to renewable energy? This question must be answered in the affirmative. Subsidies to corn ethanol and other biofuels, the support of solar and wind power facilities, and renewable research grants are only a few examples of the many ways in which government is taking an active role in supporting the industry transition from traditional fossil fuels to renewable energy.59
While the U.S. is not interfering in the energy sector to the degree Singapore or Hong Kong interfered with certain industries, this may be problematic. Young (1992) demonstrates that “Singapore is a victim of its own targeting policies, which are increasingly driving the economy ahead of its learning maturity into the production of goods in which it has lower and lower productivity.”60 We see evidence of this occurring in the U.S.; results in Chapter 3 indicate that certain types of renewable energy actually reduce the overall security of the energy supply. Take solar power for example; it is far more expensive than coal. Thus, a strong governmental support of solar industry can lead to an overdevelopment in an industry that is less productive and more expensive than developed energy industries, such as coal and natural gas.
This can lead to “endogenous depreciation,”61 which occurs when a new technology is rapidly introduced into the market. Because many secondary industries are designed with traditional power sources in mind, large amounts of assets become obsolete or experience sizeable depreciation in value. As per our previous example, as solar power takes a larger share of the market and begins to take hold due to government support, coal power plants and infrastructure based on coal power can depreciate or become obsolete if new secondary technology based on solar power is introduced at a rapid pace.
This leads us to our second case study, relating to the security of the energy supply. In this case, I examine security through energy pricing, specifically the price of coal energy. Coal exerts a strong impact on our economy. As the most stable and abundant energy source, it is unlikely the United States will see a dramatic reduction in coal usage in the near future. Coal has a strong base load capacity, making it a good fuel source for electricity generation. Due to coal’s strong impact on both the industrial and residential energy sectors, it is imperative that one is able to analyze and predict future coal prices.
The model is based on 40 observations between the years of 1970-2010. Data was obtained from the Departments of Energy and the Energy Information Administration. The five independent variables are:
ArcologyDesigns Studio May 2013
14 | P a g e
1. Price of oil($/milBTU) 2. Price of nuclear fuel ($/milBTU) 3. Previous year’s price of coal ($/milBTU) 4. Previous year’s oil imports(billBTU) 5. Previous year’s energy consumed (billBTU) Regression: Price of Coal = 85.097 + .014 Price of Oil + .614 Oil Imports + .602 Last Year’s Coal Price – 32.877 Consumed Energy + .435 Price of Nuclear Fuel + Ui On average, holding all other factors constant, it indicates that given: • A$1 increase in oil prices, coal prices increase by 1.4% • A1% increase in last year’s oil imports, coal prices increase 0.614% • A1% increase in last year’s coal prices, coal prices increase 0.602% • A1% increase in last year’s total consumed energy, coal prices decrease 32.877% • A$1 increase in nuclear fuel prices, coal prices increase 43.5%
Results show all variables to be highly significant at the alpha = 0.01 level, with the exception of nuclear fuel prices, which are significant at alpha = 0.05. The regression R^2 is significant at alpha = 0.01. Since both the model regression and variable coefficients are significant, the model can be used for analysis and prediction, providing insight into what influences energy prices. The model does not suffer from autocorrelation or multicollinearity problems. The Durbin-Watson d-statistic at 2.03 is well within the rejection region. Variance inflation factor (VIF) test for multicollinearity is low at 9.60 (< 10). Breusch-Pagan and Cook-Weisberg heteroskedasticity tests, however, indicate non-constant variance of the error terms. This can be explained in part by the presence of lagged variables that are also closely related with our dependent study variable of relative coal price changes.
As the error term of one variable changes from year to year, the changes of the corresponding error terms in the remaining variables follow a similar pattern. The variable most responsible for the presence of heteroskedasticity in the regression is the lagged logarithm of petroleum imports; heteroskedasticity can thus be addressed by dividing all variables in the regression by the offending variable. The regression R^2 value is very high at 0.9762, with a high F statistic of 278.4; thus the regression results are statistically significant from zero and help explain approximately 97.62% of observed variation in coal prices, on average, ceteris paribus. As can be seen in Figure 3, all coefficients are statistically significant. The combination of these results allows the model to be used to both predict the price of coal and analyze the components contributing to its variability. The coefficients behave in accordance with theoretical expectations. Take for example the negative sign on the coefficient for total consumed energy – should consumption (i.e., demand) increase, theory expects coal prices to decline due to both economies of scale and supply and demand predictions. Given the abundant and readily available supply of coal, an increase in demand will lead to a corresponding increase in supply, driving coal prices down.
It appears coal prices are determined by a variety of factors, the two most important being total energy consumed and previous coal prices. What is striking about the results is that
ArcologyDesigns Studio May 2013
15 | P a g e
oil and nuclear fuel price increases lead to corresponding increases in the cost of coal, though causality is not established. Given the recent trend in increasing oil prices, understanding the existing relationship between coal and oil is valuable.
The cost of energy is a vital economic and environmental issue, affecting millions of people in the U.S. on a daily basis. While this model is by no means perfect it provides a new framework through which coal price variation may be studied. This regression may be used to analyze current coal prices given previous data or to predict future energy prices given current data. Future research in this area may analyze the effects of the decreasing oil supply on the demand for coal and any additional effects of oil imports on coal use and price variation.
Chapter 4: Model Overview Theoretically I consider diversity in a manner comparable to Stirling (2009) by taking a holistic perspective of diversity and considering the four primary factors outlined in Table 1 below: diversity, variety, balance, and disparity. Table 1 Components of Diversity as a Unifying Concept
62
Diversity an en evenly balanced reliance on a variety of mutually disparate options
Variety the number of diverse categories of option into which an energy system may be appointed
Balance a function of the apportionment of the energy system across the identified options
Disparity the manner and degree in which energy options may be distinguished
Algebraically, a pairwise comparison between diversity options appears as follows:
We see diversity defined here as the sum of pairwise option disparities, weighted in
proportion to option contributions, where Pi and Pj are proportional representations of options i and j in a particular disparity space. Stirling (2009) introduces two exponential terms (α and β) and allows them to take all possible permutations of the values 1 and 0, such that:
In this way we can capture four properties of interest: variety, balance, disparity, and diversity.
Dataset and Likelihood of Measurement Errors Overview
The primary goal of our sample is to represent the population; therefore, precise definition of the study population is critical. Samples represent a population without having to examine every member of the population – whether it is every tire in a factory, the thoughts of every person in the U.S. on a given topic, or the number or type of energy generating
)(, jiji
DijPiPjD
)(, jiji
PiPjDijD
ArcologyDesigns Studio May 2013
16 | P a g e
facilities. Sample size determines the specificity at which the sample “represents” the population. To ensure representation, specific parameters are set. These parameters determine how many “members” of the population must be examined to be representative. The rate of occurrence of the study attribute in the population – such as energy production or rate of accident occurrence – affects the sample size. Parameters defining the researchers’ expectations of accuracy (the level beyond chance), and a measure of confidence that a sample of this size will be representative of the population are also set.
A central priority of this study is to ensure that any inferences can be legitimately made from the operationalization’s in the study to the theoretical constructs on which they are based. In essence, our observed pattern of energy diversification – the realistic operation – must correspond with the theoretical pattern – how the object, or the categories examined, should operate. It is most useful when there is considerable variation among the size of sampling units, assuring that all existing energy production facilities and methods have an equal probability of being examined. This study focuses specifically on the amount of energy generated not by different facilities but by an industry type as a whole. By aggregating facilities of similar types across the housing, industrial, and commercial sectors over the period between 1949 and 2011 we obtain a reliable dataset of 63 observations that take all facilities into account without the need to sample facilities. Data was obtained from the Department of Energy, the Energy Information Administration, and the Mine Safety and Health Administration.
There is a possibility for both random and systematic error based on data reporting or collection faults, although the probability of systematic error is low. Random error is caused by factors that randomly affect measurement of the variable across the sample. However, it does not have a consistent effect across the entire sample but rather pushes observed scores up or down randomly. This indicates that if all random errors in a distribution were visible they would add to zero – there would be an equal number of both positive and negative inaccuracies. Therefore, it does not necessarily affect the average but the variability around it.
Systematic error, however, is steadily positive or negative and exerts an effect on the average of results, shifting them either left or right. This is identified as the “bias” in a measurement and, if significant enough, may obscure the true results of a study. The aggregate time series sample in this study aims to avoid systematic error, though there is still a possibility that errors of measurement may occur.
U.S. Population 63 229.3889 46.77012 149.19 311.59
ArcologyDesigns Studio May 2013
18 | P a g e
Table 3 Energy Source and Contribution63
ArcologyDesigns Studio May 2013
19 | P a g e
Supply Security Models
I begin by asking the following questions: Does diversity affect the security of energy supply? Did the OPEC Embargo in the 1970s affect the supply of energy? Do renewables matter in terms of energy security? To answer these questions, several models were developed, three of which are outlined in Table 4 below.
Model 1 is an ordinary least squares (OLS) regression. Variables for total fossil, wind, and other renewable energy and U.S. population are significant at α=.01 and the OPEC Embargo categorical variable at α=.05. Value inflation factor (VIF) is high at 28.43, with wind energy produced at an individual value of 74.73, suggesting the presence of multicollinearity. The Cook-Weisberg test for heteroskedasticity reveals P=.109, ruling out heteroskedastic error terms. The Durbin-Watson d-statistic is .9147, indicating positive autocorrelation. Durbin’s alternative test indicates serial autocorrelation.
Testing for the Akaike (AIC) and Schwartz (BIC) information criterion we obtain -454.76 and -437.62, respectively. Notice the large negative values. If we take the information criterion to be an indicator of information lost (i.e., entropy) as we use the theoretical construct of the model to describe reality, this raises several concerns. Given the high R^2 value, F statistic and significant coefficients we expect a low information criterion. It is possible that either the model or the variables are incorrectly specified. Another possibility is that we are using the wrong data to describe economic output or energy performance. It is also possible, albeit unlikely, that no causality exists between the dependent and the independent variables used in the model.
This does not appear to be the case here. Replacing wind, solar, and other renewables with the aggregate “total renewables” variable significantly reduces VIF to 7.26 (< 10). Models 2 and 3 address autocorrelation issues by abandoning the OLS model in favor of Newey-West estimates. “As the time between error terms increases, the correlation between the error terms decreases. The Newey-West estimator can be used to improve OLS regression when variables have heteroskedasticity or autocorrelation.”64 On average, ceteris paribus, the data provides sufficient evidence for us to reject H0=0 in favor of H1=! 0. Diversity does have an impact on energy supply.
In model 3, where renewables are aggregated and Newey-West estimates are used, the renewables categorical variable becomes significant. I favor model 3 because all variables are statistically significant, it effectively addresses the issues present in the OLS regression and it adheres to theoretical expectations. Interpreting the coefficients, we see that a 1% increase in population leads to a 0.22% increase in total energy produced. We see similar results with our other variables – as they increase, so does total energy produced within the U.S. This makes theoretical sense, as we expect the production of energy to increase with the emergence of renewables, the OPEC Embargo (because the energy not imported has to be obtained domestically), or increases in population. From the results in Table 5 we can also see that the production of fossil fuels has by far the largest impact on the security of the supply of the energy sector. A percent decrease in total renewables only decreases total produced energy by .09%. However, a 1% decrease in fossil fuel production leads to a .81% decrease in overall energy generation.
ArcologyDesigns Studio May 2013
20 | P a g e
Table 4 Diversity and the Effects on Energy Supply
(1) (2) (3) OLS Newey-West Newey Alt
VARIABLES+ Total Produced Total Produced Total Produced
Renewables Dummy 0.00634 0.00634 0.02807** (0.00527) (0.00750) (0.01146) Total Fossil Produced 0.80436*** 0.80436*** 0.81433***
(0.01359) (0.01540) (0.01516) Wind Produced -0.00185 -0.00185 (0.00125) (0.00173) Solar Produced 0.00405*** 0.00405*** (0.00110) (0.00119) Other Renewables 0.11354*** 0.11354*** (0.00877) (0.01383) OPEC Embargo Dummy 0.00769** 0.00769 0.00937* (0.00312) (0.00465) (0.00525) U.S. Population 0.21790*** 0.21790*** 0.22945*** (0.02100) (0.03427) (0.03346) Total Renewables 0.09511*** (0.01546) Constant 0.67903*** 0.67903*** 0.72030*** (0.13810) (0.15386) (0.18123) R-squared 0.99940
Standard errors in parentheses
*** p<0.01, ** p<0.05, * p<0.1
+ All variables are in logarithmic form
ArcologyDesigns Studio May 2013
21 | P a g e
Net Imports Index Models
I begin by asking the following questions: Do energy imports affect total energy
production? How do net energy imports measure against total domestic energy production? Do renewables affect net imports? What impact do various energy sources have on net imports? To answer these questions, several models were developed, three of which are outlined in Table 5 below. The dependent variable is “net imports index,” an index I created by dividing net imports by total produced energy. The indices developed in this study are examined in more detail towards the end of this chapter.
Model 1 is an ordinary least squares (OLS) regression. Variables for total fossil, wind, and other renewable energy and the renewables dummy are significant at α=.01 and U.S. population at α=.05. Value inflation factor (VIF) is high at 28.43, with wind energy produced at an individual value of 74.73, suggesting the presence of multicollinearity. The Cook-Weisberg test for heteroskedasticity reveals P=.0789, suggesting presence of heteroskedasticity in the error terms. The Durbin-Watson d-statistic is 1.1778, indicating positive autocorrelation. Durbin’s alternative test indicates serial autocorrelation.
Testing for the Akaike (AIC) and Schwartz (BIC) information criterion we obtain 347.09 and 364.24, respectively. Notice the large positive values. If we take the information criterion to be an indicator of information lost (i.e., entropy) as we use the theoretical construct of the model to describe reality, this raises several concerns. Given the high R^2 value, F statistic and significant coefficients we expect a low information criterion. It is possible that either the model or the variables are incorrectly specified. Another possibility is that we are using the wrong data to describe economic output or energy performance. It is also possible, albeit unlikely, that no causality exists between the dependent and the independent variables used in the model.
This does not appear to be the case here. Replacing wind, solar, and other renewables with the aggregate “total renewables” variable significantly reduces VIF to 7.69 (< 10). Model 2 addresses autocorrelation issues by abandoning the OLS model in favor of Newey-West estimates. “As the time between error terms increases, the correlation between the error terms decreases. The Newey-West estimator can be used to improve OLS regression when variables have heteroskedasticity or autocorrelation.”65 On average, ceteris paribus, the data provides sufficient evidence for us to reject H0=0 in favor of H1=! 0. Energy imports do affect total domestic energy production.
In model 2, renewables are not aggregated while Newey-West estimates are used. I favor model 2; even though the population variable becomes insignificant, this model effectively addresses the issues present in the OLS regression and significantly reduces standard errors. Interpreting the coefficients, we see that both fossil and wind power production are negative. Thus a 1% increase in wind production reduces net imports by 2.05 units. It must be noted that all models are in lin-log format. Results do adhere to theoretical expectations, as we expect net imports to decrease as domestic energy production increases. The total fossil coefficient is -27.57, exerting a significantly larger impact on net imports than wind or other renewables, which is positive, suggesting that increases in alternative renewables (see Table 3
Energy Source and Contribution) creates inefficiencies.
ArcologyDesigns Studio May 2013
22 | P a g e
Table 5 Diversity and Net Imports (Developed Index)
(1) (2) (3) OLS Newey OLS Alt VARIABLES
+ Net Imports
Index Net Imports
Index Net Imports
Index
Environmental Dummy 8.16481*** 8.16481*** 5.63842* (3.05671) (2.43179) (2.84922) Total Fossil Produced -27.57334*** -27.57334*** -0.47991 (7.89004) (9.24531) (6.37443) Wind Produced -2.05845*** -2.05845*** (0.72308) (0.50256) Solar Produced 0.62310 0.62310 (0.64079) (0.58212) Other Renewables 22.94141*** 22.94141*** (5.09356) (5.00442) OPEC Embargo Dummy -0.56949 -0.56949 1.20776 (1.81254) (1.54695) (2.07447) U.S. Population 27.20134** 27.20134 -21.55843** (12.18933) (16.42055) (8.88287) Total Renewables 21.56411*** (5.50858) Constant 1.31432 1.31432 -200.38016** (80.17321) (92.59863) (81.24839) R-squared 0.76259 0.65912
Standard errors in parentheses
*** p<0.01, ** p<0.05, * p<0.1 + All variables are in logarithmic form
ArcologyDesigns Studio May 2013
23 | P a g e
Impact on Human Life Models
I begin by asking the following questions: Does diversity affect the number of mining related fatalities? Does coal production have an impact on mining fatalities? Does energy consumed from sources other than coal affect mining fatalities? Does an increase in renewable energy production lower mining fatalities? To answer these questions, several models were developed, three of which are outlined in Table 6 below.
Model 1 is an ordinary least squares (OLS) regression. All variables are significant at α=.01. Value inflation factor (VIF) is low at 4.87; there is no multicollinearity present. The Cook-Weisberg test for heteroskedasticity reveals P=.0299, suggesting error terms are heteroskedastic. The Durbin-Watson d-statistic is 1.01122, indicating positive autocorrelation. Durbin’s alternative test indicates serial autocorrelation.
Testing for the Akaike (AIC) and Schwartz (BIC) information criterion we obtain 36.08 and 46.8, respectively. Notice the small values. If we take the information criterion to be an indicator of information lost (i.e., entropy) as we use the theoretical construct of the model to describe reality, this indicates that the model is a good fit. Given the high R^2 value, F statistic and significant coefficients we expect a low information criterion, which is indeed what we have.
Model 2 uses Newey-West estimates to address the presence of heteroskedasticity and autocorrelation in the OLS regression; we can see in Table 6 that coefficients do not change. The only difference lies in the renewables dummy, which drops in significance from α=.01 to .1. On average, ceteris paribus, the data provides sufficient evidence for us to reject H0=0 in favor of H1=! 0. Diversity in energy sources does have an impact on mining fatalities. In model 3, a Poisson distribution is used; the average number of mining fatalities is sufficiently low that we can think of it as a count variable. Given that recorded mining fatalities occur at a fixed interval of time, “independently of the time since the last event,” we can use the Poisson distribution to create “a discrete probability distribution that expresses the probability of an event (such as mining fatalities) to occur.”66 Model 3 does not use logarithmic variables as models 1 and 2 do; it uses variables in their original units (see Table 2 Variables Summary). I favor model 3 because all variables are statistically significant, it effectively addresses the issues present in the OLS regression and it adheres to theoretical expectations.
Recall that our dependent variable, average mining fatalities, is a count variable; the “Poisson regression models the log of the expected count as a function of the predictor variables. We can interpret the Poisson regression coefficient as follows: for a one unit change in the predictor variable, the difference in the logs of expected counts is expected to change by the respective regression coefficient, given the other predictor variables in the model are held constant.”67 Thus, a one unit change in coal produced creates a -.441 unit decrease in our dependent variable. This does not adhere to our theoretical expectations, as we expect mining fatalities to increase as coal production increases. The average mining injuries variable has a coefficient of 49.44; it is positive as we expect but we do not expect that a one unit change in injuries will produce a 49 unit change in fatalities. While the variables are all highly statistically significant and model misspecification errors have been addressed, it may be unwise to use the coefficients as predictors. We can, however, say that diversity, energy consumption, and coal production have an impact on mining fatalities, though we may not be able to predict it.
ArcologyDesigns Studio May 2013
24 | P a g e
Table 6 Diversity and Mining Fatalities Reduction
(1) (2) (3)
OLS NEWEY-WEST POISSON
VARIABLES+
Average Mining
Fatalities Average Mining
Fatalities Average Mining
Fatalities
Coal Produced -1.72040*** -1.72040*** -.4410334***
(0.39882) (0.43784) (.0529107)
Tot Cons – Coal
Cons -0.61608*** -0.61608*** .2009312***
(0.19186) (0.13103) (.0176699)
Avg Mining
Injuries 0.75946*** 0.75946*** 49.44346***
(0.13572) (0.20156) (9.193236)
Environmental
Dummy -0.56629*** -0.56629*
(0.18275) (0.32541)
US Population -.0266258***
(.0011985)
Constant 37.22956*** 37.22956*** 10.71898***
(5.36410) (5.49766) (.1350214)
R-squared 0.93933 .9455 pseudo
Standard errors in parentheses
*** p<0.01, ** p<0.05, * p<0.1
+ Variables in models 1 and 2 are logarithmic, count in model 3
ArcologyDesigns Studio May 2013
25 | P a g e
Examination of Created Indices
This study has created three comprehensive indices to track and analyze the behavior of the energy sector in terms of diversity, with a focus on energy security and imports. Let us first review existing literature in the field of energy diversity. Andy Stirling (2009) uses the four variables of diversity, variety, balance, and disparity to theoretically evaluate energy diversity in the stock market as related to portfolio performance. Anne Newman (2007) uses the Shannon-Wiener Index and develops an index of political stability, indicating how stable an energy exporter is and what portion of U.S. energy imports come from nations with a low score in political stability, indicating a security risk and a need for diversification. The Shannon-Weiner Index68 notes how many different types of something there is in a dataset and accounts for “how evenly the basic entities are distributed among those types.”69 A.F. Alhajji and James L. Williams (2003) use petroleum reserves and consumption as a measure of energy security. The aforementioned indices are effective in certain situations; nevertheless, a general and robust method of determining energy diversity and its impact on production is necessary. Table 7 provides a general overview of the three indices. Table 7 Indices Overview
Index Calculation Rescaling Scale Critical Value
Coal (Consumed-Produced)/Net Imports
((max-min)/(Vt-min))*100
0-100 58.44
Fossil Fuels (Consumed-Produced)/Net Imports
((max-min)/(Vt-min))*100
0-100 48.37
Security – Net Imports
Net Imports/Total Energy Produced
((max-min)/(Vt-min))*100
0-100 1.554
The indices for coal and fossil fuel are calculated as follows: total consumed of energy source – total produced of energy, divided by net imports. This provides a share of surplus or deficiency from net imports. For coal, an index value > 58.44 indicates that consumption exceeds production. For fossil fuels, an index value > 48.37 indicates that consumption exceeds production. The higher the value, the greater shortfall and the larger the portion of net imports. For the majority of years between 1949 and 2011, the fossil security index remains above the critical value. This is in line with our observations of long periods of oil imports and imbalances between domestic consumption and production.
Lower values indicate an over-concentration in a specific sector. Notice in Table 8 that around 1962, the fossil index reached 100 while the coal index fell to 0; in 1965, the opposite occurred. This depicts when the maximum and minimum values were reached in the time period in question, namely 1949-2001. It is interesting to note that when the fossil fuel index falls, the coal rises, and vice versa. This makes theoretical sense. The two combined are the largest energy sources in the United States. Should production in one source fall, production in the other picks up. This demonstrates an important lesson about the relationship between security and diversity. If the only energy source in the U.S. in 1965 was coal, then production
ArcologyDesigns Studio May 2013
26 | P a g e
would suffer. Because of diversification, however, the net effect is to smooth out domestic energy production. If a deficiency in one source is identified by the market, the response of energy producers relying on an alternative source is to increase production and meet demand. This acts as a safeguard against potential energy price volatility and overdependence on imports. With the advent of renewable energy sources, nascent as though they may be currently, we should expect to see greater increases in energy source and organizational diversity and the development of additional indices to monitor the impact of renewables on energy diversity and security.
The final index is the Net Imports Index, calculated by dividing net imports by total energy produced and rescaling from 0-100. What this does is produce an index of the share of total energy production held by net imports. Index values greater than the critical value of 1.554, such as 100 in 1987, does not mean that 100% of total energy produced was represented by net imports. It means that the maximum value for the date range selected (1949-2011) was reached in that year and that something caused net imports to represent a larger portion of total energy produced. Take the two dips in 1972 and 1974 for instance; further analysis shows that the decline in index values for those years is due to the OPEC embargos which decreased energy import levels during those times. The combination of all three indices provides a holistic representation of the energy sector and creates new opportunities for energy analysis.
Table 8 Indices Behavior 1949-2011
-20.00
0.00
20.00
40.00
60.00
80.00
100.00
120.00
Coal Index
Fossil Index
Security Index
ArcologyDesigns Studio May 2013
27 | P a g e
Chapter 5: Game Theoretic Analysis of Diversity in the Energy Sector
Linked Games Reach Nash, Rather than Static, Equilibria70
Consider a repeatable irrigation game in the commons domain. Here, a village with an agricultural economy depends on crops for food and trade. The crops are watered through a complex irrigation mechanism that requires the cooperation of the villagers for building, repair, and maintenance. In this game, there are multiple agents Si; each round, agents may cooperate or shirk from cooperation.
In a non-linked repeatable game, a cooperating agent gains Vt – Ce, or the value of their share of crops at time t minus the effort of cooperation. Shirking yields Vt, with the cost absent since no effort is expanded that round. Without an enforcement mechanism, it is in an agent’s best interest to be a “free rider”, or shirk from cooperation while depending on other villagers to pick up the slack. Shirking can be said to strictly dominate cooperation as a strategic action choice. Thus a static equilibrium is reached where each round agents cooperate if they have cooperated before and shirk if they have shirked before without repercussion. For a variety of reasons, such as work ethic, values, desire for a successful crop, desire to feed one’s family, not all agents will shirk. However, without a proper incentive mechanism for cooperation, the proportion of cooperating agents will be less than socially desired. There will be a shortage of work hours contributed towards the maintenance of the irrigation system.
Suppose now the irrigation game is linked with a social benefits game. In an unrestricted rural community, agents depend on each other for support during times of need, participate in community activities, and exchange services and information. In the absence of a third party enforcement mechanism, such as government, the linkage of games can produce socially efficient outcomes. Now, if an individual chooses to shirk from cooperation, they bear the cost Cso, or the cost of ostracism from community activities and social benefits. If Cso > Ce, the cost of social ostracism is greater than the cost of the effort of cooperation. Thus, in a repeated game, agents will choose the new non-dominated strategy of cooperation, since cooperation now strictly dominates shirking. This yields a Nash equilibrium.
Consider now that under cooperation, the payoffs for each agent are evenly split between participating members and that members may select their level of effort towards cooperation. In a case with only two agents then, the payoffs will be split ½ and ½. Thus, the payoff function for agent is71:
( ) [ ( )]
Here, .5 is the benefit split between the two agents and , is the gain from cooperation, and
is the effort cost of agent The following is derived after differentiation: ( ) ( )
1 ( )
2
1 FOC – first order condition
2 SOC – second order condition
ArcologyDesigns Studio May 2013
28 | P a g e
( ) Thus, the best response for player one given player two’s choice emerges. Equivalently, the best response for player two given player one’s choice is given by:
( ) The above two equations show the dependence on effort levels of S2 for S1 and S1 for S2 respectively. If the process continues and we know that people will not play non-best responses we converge on the intersection of the lines created by the best response choices of player two given player one’s actions and the best response choices of player one given player two’s actions. Therefore, the following is found after solving:
; where ( )
It is observed that effort levels become irrelevant because agents bear the full cost of their effort and earn only ½ of the payoffs. Thus, it is in agent one’s best interest to select the minimal level of effort in order to minimize their costs. If player two chooses a higher effort level, then agent one benefits; if player two also chooses a minimal effort level, player one neither benefits nor loses. Therefore, an inefficient amount of effort will be chosen each round because at the margin, the players bear the full cost of their effort and earn only 50% of the payoff through an even split after cooperation. Even with a linkage to the social benefits and ostracism game, cooperation in the irrigation network will be below a socially desirable level. A payoff incentive mechanism is necessary to correct for this deficiency and attain a socially desirable level of cooperation and levels of effort.72
To do this, we must consider how the actions of agents are brought about by the way in which they decode exogenously received information. This information can be in the form of price signals from the market, or trade domain, or exogenously generated rules by the government in the polity domain. Refer to Appendix A for a visual diagram of how an equilibrium can reinforce an agent’s perspective and belief in existing institutions.
How This Relates to Energy Diversity The previous section used irrigation for simplicity; let us now apply this general principle to the energy sector. There are many players and many institutions; both exogenous and endogenous rules exist. Endogenous are the ones that originate within an energy company, such as hiring policies, attitude toward safety, and rules governing the interaction between different departments. Exogenous are rules imposed upon the energy sector, such as government safety regulations, emissions limits, and trade regulations. Because there are many players in the energy sector and cooperation is required to achieve common goals, the same situation arises as in our irrigation game. Pollution is a classic example, with the cap-and-trade policy as an example of a government policy designed to take advantage of the strategic responses of players in the energy sector. All energy generation
ArcologyDesigns Studio May 2013
29 | P a g e
facilities produce pollution, some more than others. Pollution, however, is inherently a social problem. Smog and soot created by one plant can affect the nation as a whole, not just the employees of the company. Thus cleaning up or reducing pollution is an activity that affects the entire energy sector. Small energy companies have an incentive not to reduce pollution. Their contribution is small and cost to clean up or reduce pollution is higher, both absolutely and as a fraction of the overall value of their assets. Large producers also have an incentive not to reduce pollution – the market is large and consists of many players. If they can wait and let other players reduce their pollution levels, aggregate contamination levels may decrease to or below a federally mandated standard, such as for air quality, eliminating their need to pay. To prevent this waiting game, the cap-and-trade system allows big polluters to buy credits from those able to reduce their pollution in a cost-effective manner. Thus companies able to reduce pollution are financially compensated while unable companies benefit as well, as the cost of the credits is less than the cost they’d have to pay to buy and install new emissions control equipment. Thus the behavior of the energy sector is “smoothed out” between players with varying costs and preferences. This demonstrates that effective public policy should be tailored to the strategic behavior of players in a given sector.
Chapter 6: Policy Proposals to Improve the Security of our Economy, Environment, and Energy Supply
The following sections outline specific and measurable policy proposals that address key aspects of our energy sector in a holistic, all-encompassing manner. The goal is to identify critical areas that are not necessarily directly a part of the energy sector, as, say, a power plant would be. Rather the intent is to identify major problem areas in related sectors that hold back the development and transformation of our energy sector and suggest a specific, practical solution.
Changes in Agriculture Methods
Abstract
The goal is to place electronic sensors in agricultural fields across the U.S. that will
monitor water usage, chemical treatment of soil, and other critical factors in the growing of crops. This will conserve water by maximizing irrigation efficiency, reduce water pollution by ensuring soil is not excessively treated with chemicals, and keep food prices low. This memo examines how such a bill can be successfully introduced and passed in Congress. By reaching out to key agriculture and chemical companies and influential environmental groups we can garner crucial support while guaranteeing the proposal has a broad appeal. To ensure the proposal’s success we must use a cross-partisan strategy and create a coalition between Democrats and progressives and libertarians on both sides. Bipartisanship, however, will not work and must be avoided.
ArcologyDesigns Studio May 2013
30 | P a g e
How to Pass Such a Bill
This EASII (Electronic Agricultural Sensors Infrastructure Initiative)73 proposal calls for
electronic sensors in agricultural fields throughout the United States and will benefit both farmers and the public at large. Currently, agriculture is the principal end user of water, consuming over 70% of groundwater extracted from rivers and lakes for the purpose of irrigation.74 Eutrophication, the process of excessive algae growth due to high nutrient concentration, is a direct result of agricultural fertilizer runoff.75 Strategically placed sensors, embedded in the soil, can provide farmers with data on soil dehydration and chemical concentration levels. This ensures the efficiency of water use for irrigation; crops will be watered only when needed and in the appropriate amount. It will also prevent crop failure due to dehydration. The sensors will tell growers exactly how much chemicals per square foot to use, reducing excessive fertilization, pesticide, and herbicide treatments; this reduces fresh water eutrophication and the damage to wildlife habitats it causes. Also, the implementation and maintenance of EASII will create jobs in the agriculture and IT sector.
In an era of increasing digitization, globalization, and reliance on technology EASII is a logical move. It will ensure the US remains globally competitive while keeping food prices low by increasing the efficiency of our agricultural sector. We must master the “next big change in technology, which [is] networking – the hyper-connecting of the world in which the principal platform is no longer the PC but rather billions of interconnected smartphones, sensors, computers, and servers.”76 This proposal makes certain that U.S. agricultural fields are “using the tools of hyperconnectivity in every way possible to produce more goods and services with fewer people” and less resources.77 It also supports the “building and continual [modernization] of our infrastructure…so that American workers and firms can communicate and collaborate effectively and deliver their goods and services swiftly and cheaply to their destinations.”78 By having access to timely and reliable information on the status of soil and crops, farmers can spend less money on fertilizers, water, pesticides and herbicides and less unnecessary time in the fields. Lower cost of growing crops translates into savings for American farmers and families.79 We must highlight this fact to win public support for the proposal. A secondary effect of EASII is to provide a boost to our IT sector in the form of new jobs. The design, manufacture, installation, and repair of the electronic sensors will require engineers, mathematicians, programmers and other professionals. Such individuals are necessary because “the professional judgments of experts are…indispensable. The details of technical and scientific fields lie beyond the easy comprehension of almost all non-specialists;” we need to reach out to our engineers and IT specialists so they can “translate for us.”80 This will signal to them that there is still a place for them in the U.S. economy and that good jobs are still available. Expertise in the IT field requires a college education and given the “substantial…rise in the earnings of those who complete post-secondary education,” EASII provides a boost to the middle class by creating better paying high-tech jobs that call for workers with a college degree.81 This is vital for American interests primarily because in the recent past we failed to concentrate on and develop our strengths – “education, infrastructure, immigration, research and development, and appropriate regulation – just at a time when changes in the world, especially the expansion of globalization and the IT revolution, made adapting [those strengths]
ArcologyDesigns Studio May 2013
31 | P a g e
to new circumstances as important as [they have] ever been.”82 This proposal specifically targets infrastructure and has positive effects for jobs, education, and research. Installing sensors in our fields creates a digital network that provides constant, up to date data to both researchers and farmers. “If we are going to generate the number of decent-paying jobs we need, we need a jobs strategy in line with global best practices. That strategy will almost certainly have to involve more government investment and incentives in generating start-ups.”83 This is precisely what this proposal accomplishes by creating a flow of reliable data for scientists, entrepreneurs, land owners, agricultural and chemical companies, environmental groups, and government agencies. It is also a reason these groups will lend their support for EASII. With the backing of key interest groups, we can secure the political success of this plan. “Every good strategy starts with a vision of where you ultimately want to go;”84 the vision driving this proposal is a desire for a stronger agricultural sector and a healthier environment. Given the current economic climate of budgetary constraints and calls for limited spending, “the right strategy now is neither to slash all discretionary government spending suddenly nor to continue piling up debt to keep the economy stimulated…The right strategy is to have a strategy – a strategy for long-term American growth and nation-building at home.”85 This is accomplished through modernizing the agricultural sector by creating an IT network of sensors preventing the waste and damage of natural water resources. That this approach simultaneously creates jobs and protects our environment speaks to its potential.
Regardless of the benefits EASII brings to the table, bipartisanship will not work as “the cost of today’s partisanship is higher than before.”86 The difference “between what the wider public…wants from its government and the kind of polarized governance that it gets”87 is, while regrettable, a reality with which we must contend. We therefore employ a cross-partisan rather than a bi-partisan strategy. “Compared to classic bipartisanship, the cross-partisan strategy [is] attractive…because it minimizes the number of compromises that must be made to members of the opposing party, and minimizes intraparty criticism.”88 The cross-partisan strategy is most effective in a “competitive, polarized setting,”89 which is the situation we currently face.
By relying on outside interest groups and the public to exert pressure on Congress, we can use the cross-partisan strategy to win some opposing Republican senators and keep Democrats that may consider defecting from party lines. “When executing a cross-partisan strategy, the positions of key interest groups with ties to the opposing party are especially critical. If a senator does not respond to interest-group pressure, he creates re-election risk for himself.”90 We can see this principle at work in Democrat Tom Daschle’s failed re-election bid in 2004; one of the reasons for his failure at the polls is that “farm interests perceived that he had failed to work effectively with Bush on pro-ethanol policies.”91 With this in mind, we must tailor our approach to the current composition of Congress. The Senate has 53 Democrats, 45 Republicans, and 2 independents. The House has 200 Democrats, 232 Republicans.92 The Democratic Party controls the Senate but not the House; this potentially weakens the effectiveness of a cross partisan strategy because the House can block the proposal from reaching the House floor. Thankfully this is unlikely; with the backing of both environmental and business interest groups and public support for the quality jobs this proposal may create, members of Congress will not be able to oppose the proposal without creating re-election risks for themselves.
ArcologyDesigns Studio May 2013
32 | P a g e
By appealing to voters, interest groups, and media in the home state of senators and representatives who may potentially oppose EASII, we make it difficult for them to challenge the merits of this proposal simply due to party divisions and polarization. “The partisan rancor, the name calling, the mutual distrust, and the resulting paralysis on the issues of greatest importance for the nation’s future have made a predictably bad impression on the American public, resulting in a loss of credibility for all political leaders.”93 Should a member of Congress oppose a bill with substantial public and private interest support, they will be perceived as irrationally antagonistic while those in support of EASII appear as rational and supportive of American interests. This serves as a protective measure, defeating opposition before it arises. EASII can be realized by winning the support of key environmental groups, such as Greenpeace International and the National Wildlife Federation and specifically Ducks Unlimited (DU) because of the special relationship between it and farmers, wildlife enthusiasts, hunters and wet-water restoration groups.94 DU “supports balanced agricultural policy that can help American farmers and ranchers to be more competitive and successful in fulfilling local, national, and global needs for food, fiber, and energy. In addition, DU supports agricultural policy that conserves soil, water, wetlands, grasslands, and forests upon which both people and wildlife depend.”95 Winning their support will not be problematic as EASII is in perfect alignment with their core objectives.
EASII also appeals to most other environmental groups because it creates a system capable of addressing uncertainty in climate change. Beyond the “well-established core facts” about global warming “lie many uncertainties. We do not know how hot the world will become or how rapidly it will warm.”96 Thus, we must ensure special interests do not “slow down [our] society’s capacity to adopt new technologies and to reallocate resources in response to changing conditions.”97 The electronic sensor network can be used by climatologists world-wide to study droughts, temperatures, and calculate the effect of chemical soil treatment with greater accuracy. This is increasingly necessary because “the combination of complex climate changes threatens coastal communities and cities, our food and water supplies, marine and freshwater ecosystems, forests, high mountain environments and far more.”98 We can then use the established public and environmental support to reach out to agricultural companies like Cargill, Archer Daniels Midland Company, and Dole Food Company, Inc. that together have a sizeable market share of the growth and distribution of food produce. We can also reach out to chemical companies like DuPont. Greater efficiency in fertilization and soil treatment means they sell fewer products; gaining their support will be more difficult, which is why we first need the support of the public, farmers, and environmental groups as leverage. We must communicate to chemical companies that “if we set high energy-efficiency standards for our own [infrastructure], we would trigger innovation by American companies, which would then be better positioned to compete globally.”99 While EASII may temporarily reduce sales, it will open up new possibilities for production and protect their interests abroad. Once we establish a partnership with key environmental and business groups and have public support, we need to create a coalition between Democrats and progressives and libertarians on both sides of the fence.100 Independents in the Senate are already supportive of the Democratic agenda. Several Republicans from agrarian states101 may be willing to give this proposal their support. We must be “prudent” and “inclined toward collective action”102 between the Democratic Party and key interest groups if we are to block Republican opposition
ArcologyDesigns Studio May 2013
33 | P a g e
and succeed in integrating our agricultural sector into the global IT infrastructure. We can use this collective action to put pressure on Congress and as leverage during negotiations. The tradeoff with this approach is that bipartisanship becomes impractical; given that this proposal relies on a cross-partisan strategy, this is not an issue. Through EASII we can show the public that Congress is not “a fundraising organization that dabbles in legislation on the side”103 but that it has the necessary resolve to drive American interests forward.
Given rising environmental awareness and persistently high unemployment, EASII will appeal to a broad audience. The possible environmental and economic benefits of EASII far outweigh the negative perception environmental groups may have on Congress’ previous votes against stronger CAFÉ standards104 and for SBIR/STTR105 reauthorization, seen as limiting the regulation of greenhouse gases. In the past legislation aimed to strike a balance between business and environmental interests.106 This initiative will be seen as a rational next step, one that is attentive to the needs of business, reducing the likelihood of their opposition.
Concluding Remarks
While we must remain aware of current budgetary constraints, “increasing investment
in research and development is an urgent priority; our spending in this vital area is actually declining.”107 EASII creates opportunities for research, high-tech jobs, reduces water pollution, and keeps food prices low. Such results, however, “are not ends in themselves. They are the means to our larger goal – the place we are actually trying to reach. Our goal is to sustain the American dream at home so it can be enjoyed by the next generation.”108 EASII takes us one step closer to the realization of that very goal.
Reducing Urban Sprawl
Abstract
The goal is to reverse the practice of building outwards on undeveloped land to expand urban communities. Known as urban sprawl, this phenomenon is often uncontrollable and results in severe economic and environmental consequences. By supporting the development of sustainable communities, providing owners of single story buildings with incentives to allow others to expand vertically on their property, and subsidizing the design and construction of multi-purpose facilities, critical issues that will only intensify with time can be addressed.
The Problem and a Proposed Solution
Urban sprawl, the uncontrolled expansion of urban areas onto undeveloped land, contributes significantly to excessive CO2 emissions, travel fatalities, soil erosion, wetland destruction, groundwater pollution, wildlife habitat destruction, automobile dependency, and a host of other economic and environmental problems. This proposal calls for the creation of the Sustainable Communities to Reduce Urban Sprawl (SCRUS) program, which will provide financial incentives in the form of tax breaks and subsidies, to the owners of single story buildings who agree to allow other businesses to expand vertically by building on top of their facilities. In addition, the program aims to develop national and transnational networks that will address policy issues related to urban planning and design.
ArcologyDesigns Studio May 2013
34 | P a g e
The financial incentives alone are insufficient to address the problem of urban sprawl effectively. The U.S. is facing a 23% increase in population from 2010 levels by 2035 and a 40% increase by 2060, when our population will, by some estimates, exceed 420 million people.109 At the same time, the world at large will be home to over 9.5 billion compared to the 6.8 billion it houses today.110 The current model of urban development – building outward with the belief that land and resources are inexhaustible – is unsustainable. We need government networks of legislators, businesspeople, and urban planners that collaborate with their international counterparts to implement best practices across the globe. Government networks are “a pattern of regular and purposive relations among like government units working across the borders that divide countries from one another and that demarcate the ‘domestic’ from the ‘international’ sphere.”111 In this way, the U.S. can not only export but also import viable policy solutions from around the globe, because “in a world of government networks…the same officials who are judging, regulating, and legislating domestically are also reaching out to their foreign counterparts to help address the governance problems that arise when national actors and issues spill beyond their borders.”112 The environmental and economic damage created by urban sprawl certainly falls in this category – pollution from one part of the globe is carried to another by water or air currents, while the destabilization of markets in one region carry profound implications for investors worldwide. This is why we must aim towards sustainable urban development that generates livable cities and avoids the negative effects of uncontrolled, horizontally-spreading urban growth. We must understand “sustainable development… [as] a goal or a value that may drive global environmental policy. Whether it is pursued through traditional international organizations or through a combination of horizontal and vertical government networks should not affect the goal itself.”113 The goal is to improve the way cities around the world are planned and expanded.
Internationally, the movement towards sustainability and away from resource exhaustion is already under way. In recent years the “United Nations Environment Programme (UNEP) and the INECE – itself a regulators network – organized a Global Judges Symposium in conjunction with the UN Conference on Sustainable Development in Johannesburg. The symposium brought together over one hundred of the world’s most senior judges from over eighty countries to discuss improving the adoption and implementation of environment-related laws.”114 While this is a step forward, many nations perceive U.S. involvement and leadership with suspicion.
In 1996 Newt Gingrich created the Twenty-First Century International Legislators Network which aimed to improve the performance of legislators. However, “even when it was in operation, many legislators from other countries may have suspected a hidden substantive agenda behind the project, one tied to the expansion of U.S. power.”115 U.S. involvement may be viewed with suspicion because of our tradition of viewing American solutions to policy problems as better than solutions that originate elsewhere. However, “just as the Canadian and the South African constitutional courts have proved more influential than the U.S. Supreme Court on many human rights issues, officials searching for solutions may be less concerned with the source of an argument than with the merits of the argument itself.”116 This poses a challenge to our traditional unwillingness to change our mind while trying to persuade others to do the same.117
ArcologyDesigns Studio May 2013
35 | P a g e
To convince the international community that urban planning needs to focus on sustainability, vertical expansion, and multi-purpose facilities we must “appear equally willing to be persuaded [by our] listeners’ positions. Adopting such a psychological posture, even if intended as a ruse, is likely to open both minds and ears.”118 A ruse, however, is out of the question as we do not always have the best solutions to policy problems. Objectively evaluating the policy proposals of our international partners and adopting the best ones is in our best interest. This signals the global community that we take the issue of urban sprawl seriously and are willing to adopt the best ideas, regardless of where they originate.
The Western European model of urban planning, for example, would benefit the United States greatly. Implementing inter-city light rail, trams, and complete streets – streets designed for pedestrians, cyclists, and cars rather than cars exclusively – in our own cities can go a long way towards addressing urban sprawl problems. In fact, many states already require complete streets.119 SCRUS takes this a step further by creating a nation-wide federal requirement for complete streets. This will empower our networks to set the example for developing countries. Meanwhile “these networks…[can provide] technical assistance of the kind needed to build governance capacity in many countries around the world. They could be tasked with everything from developing codes of conduct to tackling specific policy problems,”120 such as environmental and economic damage caused by poor urban planning. Assisting in the development of better governance in other nations can empower them to be self-sufficient and take initiative in leading the way towards developing better cities. Our legislators, business owners, and urban planners must use soft rather than hard power. “As defined by Joseph Nye, hard power is ‘command power that can be used to induce others to change their position.’ It works through both carrots and sticks – rewards and threats. Soft power, by contrast, flows from the ability to convince others that they want what you want. It is exercised through setting agendas and holding up examples that other nations seek to follow.”121 SCRUS will establish powerful federal requirements for complete streets, multi-functional buildings, and sustainable communities that will provide a concrete example other nations can follow. Also, it will develop transgovernmental networks that will establish effective agendas to reduce urban sprawl.
What makes a government network truly transgovernmental “is not just ties between like government officials across borders, but rather links, even if informal ones, between government institutions in their performance of their official functions.”122 Such collaboration is necessary to implement best practices while discouraging power struggles between governments. While “the idealized version of this world is one in which the ‘better argument’ prevails, regardless of who makes it, [in] reality, such an ideal is elusive… Differences of power almost always matter at some level.”123 Thus, the U.S. should seek to promote constructive dialogue not simply between nations but between the institutions and networks of these nations because “it is the dialogue itself that is a source both of creative innovation and tempering caution.”124 It must be noted that the international components of SCRUS will be controlled by domestic decision makers elected by the public. Increasingly “national governments are losing power. They can only recreate this power at the global level by creating a global government, but that is unrealistic, so the alternative is a hodgepodge of private sector and public international organizations, for profit and not for profit. It is exactly this hodgepodge that
ArcologyDesigns Studio May 2013
36 | P a g e
Reinecke calls governance instead of government, and it is exactly why another group of critics fear that the formulation of global public policy is being left to experts, enthusiasts, international bureaucrats, and transnational businesspeople – everyone, that is, but politically accountable government officials.”125 SCRUS avoids this by ensuring national legislators and elected officials are in control of the program, which in turn makes certain that voter input plays a vital role in establishing program objectives. In this way, national institutions remain dominant, allowing the constituency to feel included. “National government officials would retain primary power over public policy, but work together to formulate and implement it globally. They would delegate some power to supranational officials, but then work closely with those officials through vertical networks. And they would interact intensively with existing international organizations, corporations, NGOs, and other actors in transnational society, but in a way that makes it clear that government networks are the accountable core of these larger policy networks.”126 This is necessary because “it is both likely and desirable…that a strong asymmetry of power remains between national and supranational institutions, in the sense that national institutions should remain the rule and supranational institutions the exception.”127 If this is not the case, interest groups, business owners, and voters may feel they are being subverted by international agendas not of their own making.
Concluding Remarks
At the national level, SCRUS will provide subsidies and tax breaks to building owners
that allow others to expand vertically on top of their facilities. At the international level it will provide information about best practices, guidance, and set an example for foreign legislators and urban planners. This program will be funded by already existing federal funds appropriated to MAP-21, the Moving Ahead for Progress in the 21st Century Act.128 MAP-21 aims to improve urban transit by resurfacing damaged streets and incorporating pedestrian and bike modes of transportation on resurfaced streets. We can take this a step further by amending the act to require the incorporation of bike and pedestrian transportation modes on new streets. In addition, defense budgetary cuts can be allocated to SCRUS and similar urban redesign and planning initiatives
World order is “a system of global governance that institutionalizes cooperation and contains conflict sufficiently to allow all nations and their peoples to achieve greater peace, prosperity, stewardship of the earth, and minimum standards of human dignity.”129
ArcologyDesigns Studio May 2013
37 | P a g e
Conclusion
This study has aimed to show the value of a multifaceted, comprehensive analysis of security and diversity in the energy sector. Several models were proposed as a way to analyze different energy sources and relevant variables. Three indices were developed to monitor and investigate changes in energy diversity and security as related to coal, fossil fuels, and net imports as fraction of total produced energy over a period of 63 years. Finally, two specific policy changes were proposed, one dealing with how to increase the efficiency of our agricultural sector, the other with how to slow down and prevent urban sprawl. Agricultural waste contributes to energy consumption and pollution, the effects of which on energy diversity and security are currently undetermined. Urban sprawl wastes vast amounts of energy that could otherwise be put to productive uses. The proposals aim to address these two specific problems that affect the energy sector even though they may not seem directly related to it.
Future research should examine the effects of environmental change on energy security, such as how pollution affects the security of energy market portfolios or how escalations in global temperature may affect energy sector diversity and individual choice as related to energy consumption. Another opportunity for further research lies in government intervention in the energy sector through taxation and regulations. Future studies may choose to examine the effect taxes have on energy diversity or whether government safety regulations contribute to a reduction of mining fatalities.
ArcologyDesigns Studio May 2013
38 | P a g e
Appendix A: Taxation Effects on Price Levels130
Figure 1 Taxation and Price Levels - Graphical Overview
Appendix B: Current Equilibria Reinforce Belief in Existing Institutions
Figure 2 – An institution as shared beliefs formed as summary representations of an equilibrium. An institution is represented by the broken line box. (Aoki 2001)
ArcologyDesigns Studio May 2013
39 | P a g e
Appendix C: Increases in Diversity 1949-2011
Table 9 Diversity Changes 1949-2011; Source: Energy Information Administration (2013).
ArcologyDesigns Studio May 2013
40 | P a g e
Endnotes 1 Stirling, Andy. (2010). Multicriteria diversity analysis – A novel heuristic framework for appraising energy portfolios. University of Sussex, Sussex. p.1623 2 Ibid. 1631 3 Sen, Amartya. (1999). Development as Freedom. Anchor Books, New York. p.127 4 Ibid p.6 5 Ibid p. 14, 20, 81 6 Maslow, A. (1943). A Theory of Human Motivation. Psychological Review, 50. p.370-396 7 Sen p.39 8 Speth, James. (2012). America the Possible. Yale University Press, London. p.96 9 Sen p.14 10 Speth p.67 11 Sen p.37 12 Ibid p.189 13 Ibid p. 208 14 Stirling, Andy. (2011). Multicriteria Diversity Analysis – A Novel Heuristic Framework for Appraising Energy Portfolios. University of Sussex, UK. p.1629 15 Sen p.127 16 Ibid p.59 17 Ibid p.61 18 Ibid p.57 19 Ibid p. 128 20 Ibid p.62 21 Ibid p. 57 22 Ibid p.66 23 Ibid p. 66 24 Ibid p.67 25 Speth p.72 26 Ibid p.86 27 Sen p.124, 219 28 Ibid. p.124,219 29 Speth p.84 30 Stirling p.1634 31 “on many days in the year, no traditional base load power plants – those that run year-round – will be needed at all. This will be the case if the feed-in from renewables is particularly high and consumption particularly low. The traditional base load power plants will have to be shut down completely at these times.” Renews Special. (2010). Renewable Energies and Base Load Power Plants: Are They Compatible?” <http://www.unendlich-viel --energie.de/uploads/media/35_Renews_Spezial_Renewable_Energies_and_Baseload_Power_Plants-1.pdf> I Fracturing of subsurface bedrock to extract fossil fuels, primarily natural gas. 33 Mead, Russel W. (2001). Special Providence. The Century Foundation, New York. pp.125 34 Solar $0.38 per KWH; coal $0.006 per KWH; oil $0.05 per KWH; natural gas $0.03 per KWH. Green Econometrics. (2007). Information and analysis on the economics of solar and alternative energies.
ArcologyDesigns Studio May 2013
41 | P a g e
<http://greenecon.net/understanding-the-cost-of-solar-energy/energy_economics.html> 35 “permanently operating base load power plants cover that part of the demand that exists around the clock. When that basic consumption level is exceeded, medium load power plants are additionally used. Peak load power plants are used for unforeseeable fluctuations, such as faulty consumption forecasts or power plant outages, and for certain consumption peaks, such as the “lunch peak” at noon. Their generators provide full service within a few minutes, and are therefore flexibly usable.” Renews Special. (2010). 36 Mead, p.105 37 Ibid, p.110 38 “In security matters, Hamiltonians became committed to American alliances with foreign countries.” Ibid, p.130 39 Ibid, p.127 40 US Energy Information Administration (EIA). (2012). “U.S. Imports by Country of Origin.” < http://www.eia.gov/dnav/pet/pet_move_impcus_a2_nus_ep00_im0_mbbl_m.htm> 41 Speth, James. (2012). America the Possible. Yale University Press. p.5 42 Mead, p.151 43 “these transformations hold the key to moving toa new political economy...from consumerism…to sufficiency and mindful consumption, from more to enough; from runaway enterprise and throwaway communities to vital local economies, from social rootlessness to rootedness and solidarity.” Speth, p.10 44 Mead, p.163. Emphasis mine. 45 Ibid, p.149 46 Ibid, p.143 47 Ibid, p.138 48 Abramovitz, Moses. (1986). Catching Up, Forging Ahead, and Falling Behind. The Journal of Economic History, Vol. 46, No.2. pp.385-406. <http://www.cenet.org.cn/userfiles/2007-9-25/20070925002223921.pdf> 49 Mead, p.146 50 Ibid, p. 153 51 Ibid, p.162 52 Ibid, p.139 53 Ibid, p.164 54 Ibid, p.137 55 Galbraith. The Predator State. p.105 56 Mead, p.167 57 Ibid, p.167 58 Young, Alwyn. “A Tale of Two Cities: Factor Accumulation and Technical Change in Hong Kong and Singapore.” NBER Macroeconomics Annual, 13–54. Cambridge, MA: MIT Press, 1992. p.15 59 Angeletos, George-Marios and Vasia Panousi. (2009). Revisiting the Supply-Side Effects of Government Spending. Finance and Economics Discussion Series – Division of research and Statistics and Monetary Affairs. Federal Reserve Board. Washington, D.C. 60 Ibid p.16 61 Ibid p.45 62 Stirling p.2204-2207 63 Extracted from Stirling, p.2206
ArcologyDesigns Studio May 2013
42 | P a g e
64
Newey, Whitney K; West, Kenneth D (1987). "A Simple, Positive Semi-definite, Heteroskedasticity and Autocorrelation Consistent Covariance Matrix". Econometrica 55 (3): 703–708 65
Newey, Whitney K; West, Kenneth D (1987). "A Simple, Positive Semi-definite, Heteroskedasticity and Autocorrelation Consistent Covariance Matrix". Econometrica 55 (3): 703–708 66 Frank A. Haight. (1967). Handbook of the Poisson Distribution. New York: John Wiley & Sons. 67 Institute for Digital Research and Education. (2013). Stata Annotated Output – Poisson Regression. UCLA. http://www.ats.ucla.edu/stat/stata/output/stata_poisson_output.htm 68 Shannon, C. E. (1948) A mathematical theory of communication. The Bell System Technical Journal, 27, 379-423 and 623-656. 69 Hill, M. O. (1973) Diversity and evenness: a unifying notation and its consequences. Ecology, 54, 427–432. 70 This section is based on theoretical work by Aoki, Masahiko. (2001). Toward a Comparative Institutional Analysis: Linked Games and Institutionalized Linkages. The MIT Press, Cambridge. Pp.213-225 71 Wallace, C.S. (2004). Statistical and Inductive Inference by Minimum Message Length. Springer Science and Business Media. New York. 72 Aoki, Masahiko. (2010). Corporations in Evolving Diversity. Oxford University Press. New York. 73 Acronym subject to change. 74 Lenntech. (2012). Water Treatment Solutions. http://www.lenntech.com/water-food-agriculture.htm 75 USGS. (2013). Eutrophication – Toxic Substances Hydrology Program. http://toxics.usgs.gov/definitions/eutrophication.html 76 Friedman, Thomas and Michael Mandlebaum. (2011). That Used to Be Us – How America Fell Behind in the World it Invented and How We Can Come Back. Farrar, Straus and Giroux, New York. p.354 77 Ibid p.89 78 Ibid p.35 79 The proposal carries an up-front cost that will yield higher benefits post implementation. Costs will be covered by farmers and through an increase or re-allocation of existing agriculture subsidies. 80 Ibid p.287 81 Ibid p.101 82 Ibid p.218 83 Ibid p.323, 315 84 Ibid p.315 85 Ibid p. 163, 218, 230 86 Ibid p.243 87 Ibid p.246-247 88 Graham, John. (2010). Bush on the Home Front – Domestic Policy Triumphs and Setbacks. Indiana University Press. p.324 89 Ibid p.324 90 Ibid p.323 91 Ibid p.323 92 Library of Congress. http://beta.congress.gov/ 93 Friedman and Mandlebaum. p.253 94 Fundraiser Insight. (2013). Top 12 Environmental Organizations Who Use Their Donations Well. http://www.fundraiserinsight.org/articles/environmentalfundraising.html 95 Ducks Unlimited. (2013). Farm Bill – The Importance of Farm Bill Policy to Ducks Unlimited. http://www.ducks.org/conservation/Farm-Bill?poe=hometxt 96 Friedman and Mandlebaum p.191
ArcologyDesigns Studio May 2013
43 | P a g e
97 Olson, Mancur. (1982.) The Rise and Decline of Nations. Quoted in Friedman and Mandlebaum p.260. 98 Friedman and Mandlebaum p.194 99 Ibid p.197 100 Reaching out to relevant committees in the Senate, such as the Committee on Environment and Public Works and the Committee on Commerce, Science, and Transportation can strengthen the coalition. 101 IA, ID, IL, IN, KS, KY, MO, OK and perhaps TX. 102 Friedman and Mandlebaum p.277 103 Ibid p.266 104 Lillis, Mike. "Stabenow Tries to Rewrite History". The Washington Independent. Retrieved March 4, 2013. http://washingtonindependent.com/43582/stabenow-tries-to-rewrite-history 105 Small Business Innovation Research / Small Business Technology Transfer Reauthorization Act of 2011. http://www.sbir.gov/about/about-sbir 106 “My amendment is a common-sense approach that allows protections from carbon pollution, determined by scientists and public health experts, to continue being developed while providing businesses the support and incentives they need as they reduce pollution, generate new clean energy technologies and create jobs.” Sen. Debbie Stabenow wants two-year delay on carbon dioxide limits. March 31, 2011. Retrieved March 4, 2013. http://www.mlive.com/environment/index.ssf/2011/03/sen_debbie_stabenow_wants_two-.html 107 Friedman and Mandlebaum p.230, 315, 163 108 Ibid p.157 109 U.S. Census Bureau. (2010). 2012 National Population Projections – Projections of the Population and Components of Change for the United States: 2015-2060. http://www.census.gov/population/projections/data/national/2012/summarytables.html 110 United Nations. (2011) Department of Economic and Social Affairs, Population Division. World Population Prospects: The 2010 Revision. http://esa.un.org/wpp/ 111 Slaughter, Ann-Marie. (2005). A New World Order. Princeton University Press, Princeton. Electronic Edition – Kindle. Pg.361/6779 112 Ibid p.405 113 Ibid p.611 114 Ibid p.1275 Beyond the United States, to take only one recent example, the United Nations Environment Programme (UNEP) and the INECE – itself a regulators network – organized a Global Judges Symposium in conjunction with the UN Conference on Sustainable Development in Johannesburg. The symposium brought together over one hundred of the world’s most senior judges from over eighty countries to discuss improving the adoption and implementation of environment-related laws 115 Ibid p.2390 116 Ibid p.3832 “Nevertheless, just as the Canadian and the South African constitutional courts have proved more influential than the U.S. Supreme Court on many human rights issues, officials searching for solutions may be less concerned with the source of an argument than with the merits of the argument itself.” 117 Ibid p.3837 “Traditionally powerful actors may find themselves surprised and even entrapped by this dynamic. They may start out intending to use rhetoric, to persuade others to follow their desired course while remaining impervious to changing their own minds.” 118 Ibid p.3839 “Yet elementary psychology teaches that those who would persuade others of their views are likely to be most effective when they appear equally willing to be persuaded of their listeners’ positions. Adopting such a psychological posture, even if intended as a ruse, is likely to open both minds and ears.”
119 National Complete Streets Coalition. (2010). Smart Growth America – Making Neighborhoods Great Together. http://www.smartgrowthamerica.org/complete-streets/federal-policy 120 Slaughter p. 576 “At the same time, these networks could be empowered to provide much more technical assistance of the kind needed to build governance capacity in many countries around the world. They could be tasked with everything from developing codes of conduct to tackling specific policy problems.” 121 Ibid p.3119 122 Ibid p.2441 123 Ibid p.3832“The idealized version of this world is one in which the ‘better argument’ prevails, regardless of who makes it. In reality, such an ideal is elusive, to say the least. Differences of power almost always matter at some level.” 124 Ibid p.4681 125 Ibid p.4818 126 Ibid p.4818 127 Ibid p.4697 “it is both likely and desirable, however, that a strong asymmetry of power remains between national and supranational institutions, in the sense that national institutions should remain the rule and supranational institutions the exception.“ 128 U.S. Department of Transportation. (2013). Federal Highway Administration. “Funding surface transportation programs at over $105 billion for fiscal years (FY) 2013 and 2014, MAP-21 is the first long-term highway authorization enacted since 2005.” http://www.fhwa.dot.gov/map21/ 129 Ibid p.3089 130 Mering, Otto von. (1942). The Shifting and Incidence of Taxation. The Blakiston Company. Philadelphia.