Page 1
i
An Experimental and Numerical Study of the Heat
Flow in the Blast Furnace Hearth
Maria Swartling
Licentiate Thesis
Stockholm 2008
Department of Materials Science and Engineering Division of Applied Process Metallurgy
Royal Institute of Technology SE-100 44 Stockholm
Sweden
Akademisk avhandling som med tillstånd av Kungliga Tekniska Högskolan i Stockholm, framlägges för offentlig granskning för avläggande av Teknologie Licentiatexamen, torsdagen den 5 februari 2009, kl. 10 i B2, Brinellvägen 23, Kungliga Tekniska Högskolan, Stockholm.
ISRN KTH/MSE--08/51--SE+APRMETU/AVH ISBN 978-91-7415-201-2
Page 2
ii
Maria Swartling An Experimental and Numerical Study of the Heat Flow in the Blast
Furnace Hearth
KTH School of Industrial Engineering and Management Division of Applied Process Metallurgy Royal Institute of Technology SE-100 44 Stockholm Sweden ISRN KTH/MSE--08/51--SE+APRMETU/AVH ISBN 978-91-7415-201-2
© The Author
Page 3
iii
"Whether You Think You Can or Can't, You're Right"
Henry Ford
Page 5
v
Abstract This study has focused on determining the heat flows in a production blast furnace
hearth. This part of the blast furnace is exposed to high temperatures. In order to
increase the campaign length of the lining an improved knowledge of heat flows
are necessary. Thus, it has been studied both experimentally and numerically by
heat transfer modeling. Measurements of outer surface temperatures in the lower
part of a production blast furnace were carried out. In the experimental study,
relations were established between lining temperatures and outer surface
temperatures. These relations were used as boundary conditions in a mathematical
model, in which the temperature profiles in the hearth lining are calculated. The
predictions show that the corner between the wall and the bottom is the most
sensitive part of the hearth. Furthermore, the predictions show that no studied part
of the lining had an inner temperature higher than the critical temperature 1150°C,
where the iron melt can be in contact with the lining.
Page 7
vii
Acknowledgements I would like to express my gratitude and appreciation to my supervisors Professor
Pär Jönsson and Dr Anders Tilliander for your encouragement and guidance
throughout this project, and for many valuable discussions and help during the
writing of this thesis.
I owe Bo Sundelin at SSAB Oxelösund a special gratitude for qualified help and
guidance; your support has not been underestimated in any way.
Thanks to SSAB Oxelösund and the personnel at Blast Furnace No. 2, and Olavi
Antila for always driving me to the train station.
Financial supports from the Swedish Energy Agency, the Swedish Steel Producers´
Association and the committee JK21064, as well as grants from Gerhard von
Hofstens foundation during writing of this thesis, are greatly acknowledged.
Thanks to all my colleagues at the department of Materials Science and
Engineering. A special thanks to my friends at the division of Applied Process
Metallurgy for every laugh we have shared. I am grateful that I have the possibility
to work among people from all over the world. Thanks also to Niklas Kojola for
being the funniest roommate one could have.
Thanks to Dr Ragnhild E. Aune for believing in me and supporting me in many
aspects of life, professional as well as personal.
A special thought is sent to Johan for all your support, and to my lovely girlfriends
for every hour spent discussing the important matters of life.
Finally, I would like to thank my dear family: Margareta, Inge and Mikael. Your
pride in me I will always carry with me.
Maria Swartling, Stockholm, December 2008
Page 9
ix
Supplements
The present thesis is based on the following papers:
Supplement 1: “Experimentally determined heat flows in a blast furnace
hearth”
M.Swartling, B. Sundelin, A. Tilliander and P. Jönsson
Supplement 2: “Heat transfer modeling of a blast furnace hearth”
M.Swartling, B. Sundelin, A. Tilliander and P. Jönsson
Parts of this work have been presented at the following conference:
“Temperature measurements on Blast Furnace 2 at SSAB Oxelösund”
M.Swartling, B. Sundelin, A. Tilliander and P. Jönsson
3rd Nordic Conference for Young Scientists, 14-15 May 2008, Helsinki, Finland.
The contributions by the author to the different supplements of the thesis:
1. Literature survey, experimental work, major part of the writing.
2. Literature survey, numerical calculations, major part of the writing.
Page 11
xi
1 INTRODUCTION 1
2 PLANT DESCRIPTION 5
2.1 SSAB Oxelösund 5 2.2 Details of Blast Furnace No.2 5 2.3 Characterization of the state of the hearth of Blast Furnace No.2 6
3 EXPERIMENTAL STUDY 9
4 MATHEMATICAL MODEL 11
4.1 Numerical assumptions 11
4.2 Energy equation 11
4.3 Boundary conditions 12
4.4 Material properties 13
4.5 Calculation procedure 14
5 RESULTS AND DISCUSSION 15
5.1 Experimental study 15
5.1.1 Lining temperature 15
5.1.2 Wall surface temperature 16
5.1.3 Bottom surface temperature 18
5.2 Mathematical model 19
5.2.1 Temperature profile calculations 19
5.2.2 Evaluation of boundary conditions 20
5.2.3 Skull layer 21
5.2.4 Inner surface temperature 23
5.2.5 Thermocouple locations 24
6 CONCLUSIONS 27
7 FUTURE WORK 29
8 REFERENCES 31
Page 13
1
1 Introduction
The blast furnace is a very important reactor in the route of steelmaking. As much
as 67% of all steel produced in 2007 was ore based and the blast furnace processes
stands for 95 % of the world’s ore based production.1 Even though the blast
furnace process is old, it is under constant development. Today, the main focus is
on extending the campaign length, increasing the productivity, decreasing the coke
rate and decreasing the CO2 emissions.
The blast furnace hearth is exposed to high temperatures as well as liquid metal
and slag, causing both erosion and corrosion of the refractory material. An
increased productivity results in higher load on the furnace hearth and thereby
causes difficulties with increasing the campaign length. Keeping this part of the
lining at a low and steady temperature is crucial. Thus, as a part in reaching the
goals, an improved process control is required. A better control of the heat flows in
the hearth would also lead to energy savings, since the cooling requirements can be
better understood and the use of excess water avoid.
The present thesis has focused on determining the heat flows in a production blast
furnace hearth, both experimentally and by heat transfer modeling.
There are two ways of approaching a heat transfer problem: direct and inverse heat
conduction, known as DHCP and IHCP respectively.2 The DHCP formulation is
used when boundary conditions and thermophysical properties of the system are
known. For the IHCP approach, either the thermophysical properties or the
boundary conditions can be unknown; instead, the temperature of the interior has
to be known for some points of the domain.
Page 14
2
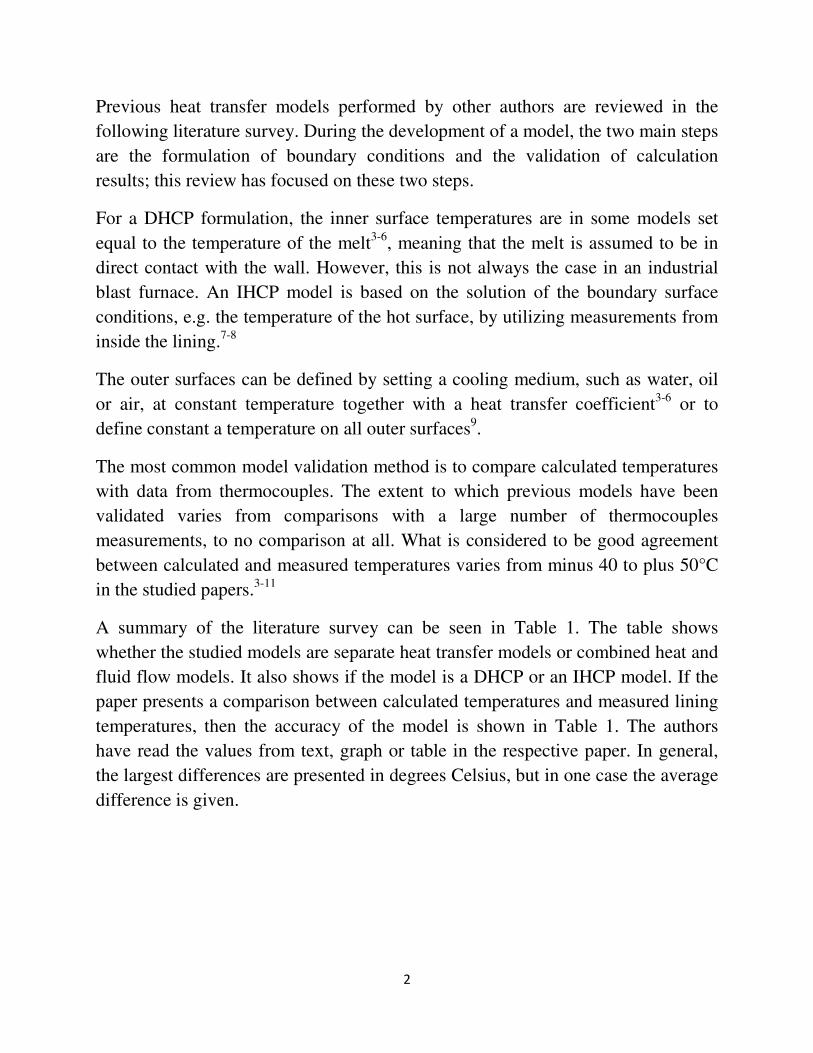
Previous heat transfer models performed by other authors are reviewed in the
following literature survey. During the development of a model, the two main steps
are the formulation of boundary conditions and the validation of calculation
results; this review has focused on these two steps.
For a DHCP formulation, the inner surface temperatures are in some models set
equal to the temperature of the melt3-6, meaning that the melt is assumed to be in
direct contact with the wall. However, this is not always the case in an industrial
blast furnace. An IHCP model is based on the solution of the boundary surface
conditions, e.g. the temperature of the hot surface, by utilizing measurements from
inside the lining.7-8
The outer surfaces can be defined by setting a cooling medium, such as water, oil
or air, at constant temperature together with a heat transfer coefficient3-6 or to
define constant a temperature on all outer surfaces9.
The most common model validation method is to compare calculated temperatures
with data from thermocouples. The extent to which previous models have been
validated varies from comparisons with a large number of thermocouples
measurements, to no comparison at all. What is considered to be good agreement
between calculated and measured temperatures varies from minus 40 to plus 50°C
in the studied papers.3-11
A summary of the literature survey can be seen in Table 1. The table shows
whether the studied models are separate heat transfer models or combined heat and
fluid flow models. It also shows if the model is a DHCP or an IHCP model. If the
paper presents a comparison between calculated temperatures and measured lining
temperatures, then the accuracy of the model is shown in Table 1. The authors
have read the values from text, graph or table in the respective paper. In general,
the largest differences are presented in degrees Celsius, but in one case the average
difference is given.
Page 15
3
Table 1 Summary of literature survey. The values in Accuracy of model are read by the
authors from text, graph or table.
Reference Separate
heat model
Combined heat
and fluid model
DHCP IHCP Accuracy of model
in degrees Celsius
3 X X Average diff. 12.7%
4 X X -
5 X X +37/-40
6 X X -
7 X X -
8 X X +43/-10
9 X X +50/-10
10 X X -
11 X X +40/-20
Current
study
X X ±3
The overall purpose in this thesis is to develop a reliable model of the heat flow in
the blast furnace hearth. This model should utilize temperature data, which are
available in a production furnace. At the same time the model should represent an
improvement to the models presented in the open literature. Thus, one aim has
been to reduce the number of assumptions needed for the heat transfer model. This
has been done by first carrying out manual temperature measurements on the outer
surfaces of the furnace wall and bottom thereafter by comparing these data to
lining temperatures. The experimental study is presented in detail in Supplement
1. The specific aim of the experimental study was to establish a relation between
surface and lining temperatures. To the authors’ knowledge, measurements of
surface temperatures have not been presented in the open literature. In the second
part of the work, the results from the measurements are used in the heat transfer
model development. The methodology of the model is presented in detail in
Supplement 2.
Page 17
5
2 Plant description
2.1 SSAB Oxelösund
SSAB Oxelösund is an integrated ironworks, steelworks and rolling mill; the
production chain starts with raw iron material and ends with a finished plate. The
ironworks has two blast furnaces, Blast Furnace No. 2 and Blast Furnace No. 4,
producing 2000 and 3000 metric tonnes of pig iron a day respectively. Both are
charged with pellets as the iron-bearing material and coke from the company’s
own coke plant. The pig iron is transported with torpedoes to the steelworks, at
which the pig iron is converted into steel and the composition of the steel is set.
The steel is then cast into slabs. The slabs are rolled into heavy plate, heat treated
and hardened in the rolling mill. The annual slab production is 1.6 million metric
tonnes, of which some is exported. Furthermore the production of heavy plate is
586 000 metric tonnes (2006). The company’s special fields are quenched and
tempered steels with brand names such as HARDOX and WELDOX.12
2.2 Details of Blast Furnace No. 2
The current study is performed on Blast Furnace No. 2. Figure 1 shows a cross
section of the hearth schematically outlined. The lining consists of different
refractory zones: wall, bottom, ramming material, a ceramic plate and a steel shell.
The lining is equipped with permanently installed thermocouples; these are placed
in five levels, numbered from 0 to 4 as pointed out in the figure.
Page 18
The outer wall is water cooled to
down to a vessel placed above level
constantly cooled with water
The bottom is equipped with pipes for water cooling; the pipes are placed 30 cm
apart. Each pipe is connected to the adjacent pipes and the water circulates t
all pipes. The cooling is turned on when
Figure 1 Schematic picture of the hearth, and its position in the blast furnace. A two
dimensional cross section represents a specific angle from the tap hole.
2.3 Characterization of the state of the hearth of Blast Furnace
No. 2
In an earlier study, the state
was taken out of operation to be relined
deconstruction of the furnace. Material zones and skull are marked in the figure.
6
The outer wall is water cooled to a position just above the bottom; the water flows
essel placed above level 1 (Figure 1). Subsequently, levels 2
constantly cooled with water, while levels 0-1 are exposed to the surrounding air.
with pipes for water cooling; the pipes are placed 30 cm
apart. Each pipe is connected to the adjacent pipes and the water circulates t
he cooling is turned on when it is decided to be needed.
Schematic picture of the hearth, and its position in the blast furnace. A two
dimensional cross section represents a specific angle from the tap hole.
Characterization of the state of the hearth of Blast Furnace
In an earlier study, the state of the hearth was characterized as the blast furnace
was taken out of operation to be relined. Figure 2 is a photograph taken during the
deconstruction of the furnace. Material zones and skull are marked in the figure.
he water flows
. Subsequently, levels 2-4 are
1 are exposed to the surrounding air.
with pipes for water cooling; the pipes are placed 30 cm
apart. Each pipe is connected to the adjacent pipes and the water circulates through
Schematic picture of the hearth, and its position in the blast furnace. A two-
Characterization of the state of the hearth of Blast Furnace
as the blast furnace
is a photograph taken during the
deconstruction of the furnace. Material zones and skull are marked in the figure.
Page 19
Figure 2 Photograph of the hearth taken during t
Visual observations showed that the lining wear was minor
almost intact, but the pores were penetrated by drops of iron
was no erosion of the bottom lining. Some e
seen in the figure that the wall lining blocks does not have its original rectangular
shape. Nevertheless, the erosion was considered to be minor.
state of the hearth, the campaign length could have been extended.
of the campaign, thermocouples had registered high temperatures, indicating
erosion of the lining. The phenomenon causing the high temperatures were
probably plates of iron that had solidified in cracks and seams.
7
Photograph of the hearth taken during the characterization study.
howed that the lining wear was minor. The ceramic plate was
almost intact, but the pores were penetrated by drops of iron. However,
no erosion of the bottom lining. Some erosion of the wall had
seen in the figure that the wall lining blocks does not have its original rectangular
erosion was considered to be minor. Thus, considering the
state of the hearth, the campaign length could have been extended. Dur
of the campaign, thermocouples had registered high temperatures, indicating
The phenomenon causing the high temperatures were
probably plates of iron that had solidified in cracks and seams.13
. The ceramic plate was
However, overall it
occurred. It is
seen in the figure that the wall lining blocks does not have its original rectangular
considering the
During the end
of the campaign, thermocouples had registered high temperatures, indicating
The phenomenon causing the high temperatures were
Page 21
9
3 Experimental study
In the experimental study the temperature was measured at the outer surfaces of the
hearth wall and bottom using a hand-held thermocouple. When measuring the wall
surface temperature, the thermocouple was put in direct contact with the surface.
Measurements were performed at heights corresponding to level 1-4 (see Figure 1).
For water cooled levels 2-4, the water was not turned off or in any other way
removed. When measuring bottom surface temperature, a thermocouple with a
long wire was attached to a bar. The bar was inserted through a cooling pipe a
certain distance. The rod was pulled out of the cooling pipe a short distance at the
time, measuring temperature at each distance. The bottom measurements were
performed when no water cooling was needed. Figure 3 shows the bottom
measurements in progress.
Temperature was read when the display showed a stable value which fluctuated
less than 2-3°C. The thermocouple used was a CIE 305 Thermometer with a probe
of type K (NiCr-NiAl). The accuracy of the instrument was ±0.3% + 1°C in the
measuring interval. The accuracy of the probe was ±0.75% of the temperature in
°C or ±2.2°C (whichever is greater)14.
Page 22
10
Figure 3 Bottom temperature measurements in cooling pipe in progress.
Page 23
11
4 Mathematical model
A mathematical model of the hearth of the blast furnace has been developed. In
this chapter, a summary of the model is presented.
4.1 Numerical assumptions
In order to simplify the calculations the following assumptions were made:
• Two-dimensional
• Steady state
• No heat generation within the system
• Only solid materials, i.e. no mass transfer
It should be noted that even though the model is set up as two-dimensional model,
each cross-section is unique and axial symmetry is not assumed.
4.2 Energy equation
The equation of energy to be solved has the following form in Cartesian
coordinates and constant density and heat conductivity2:
k
S
z
T
h
T
r
Tk
z
Tv
h
Tv
r
Tv
t
TC zhrp
0
2
2
2
2
2
2
+
∂
∂+
∂
∂+
∂
∂=
∂
∂+
∂
∂+
∂
∂+
∂
∂ρ
(1)
Page 24
12
where
ρ = density
Cp = specific heat capacity
T = temperature
t = time
vi = velocity in i-direction
k = heat conductivity
S0 = heat source
r, h, z = coordinates
When considering the given numerical assumptions, the following terms of
equation 2 will be removed:
k
S
z
T
h
T
r
Tk
z
Tv
h
Tv
r
Tv
t
TC zhrp
0
2
2
2
2
2
2
+
∂
∂+
∂
∂+
∂
∂=
∂
∂+
∂
∂+
∂
∂+
∂
∂ρ
(2)
The final equation to be solved has the form:
02
2
2
2
=
∂
∂+
∂
∂
h
T
r
T
C
k
pρ (3)
4.3 Boundary conditions
Figure 4 shows a cross section of the computational domain. The dots in the
interior represent thermocouple positions, numbered 1-14. Boundary positions are
marked with dots denoted a-p. Three axes are defined: height, h; distance from
wall, d; bottom radius, r. The boundaries are divided into three categories:
adiabatic, outer and inner boundaries. The outer boundaries are calculated based on
measurements from lining thermocouples. The relations between lining and outer
surface temperatures are based on the findings in the experimental study in
Supplement 1, some of which are presented in the Results and Discussion section.
Page 25
Figure 4 Computational domain.
4.4 Material properties
The thermophysical and thermodynamic properties required as input
mathematical model are density, heat conducti
properties are listed in Table
Table 2 Lining material properties.
Zone Material
A Wall Carbon
B Shell Steel
C Ceramic
plate
Mullite
D Bottom Carbon
E Ramming
material
Carbon
13
Computational domain.
Material properties
The thermophysical and thermodynamic properties required as input
model are density, heat conductivity and specific heat capacity.
Table 2.15-17
Lining material properties. T is the temperature in Kelvin.
Density ρ
kg/m3
Heat Conductivity k
W/m K
Specific heat capacity C
J/kg K
1610 17 1.459T+367.
8030 30 449
2500 2 1200
1570 10 1.739T+486.
1610 60 1.739T+486.
The thermophysical and thermodynamic properties required as input in the
vity and specific heat capacity. The
Specific heat capacity Cp
.459T+367.5
1.739T+486.1
1.739T+486.1
Page 26
14
4.5 Calculation procedure
Data from thermocouple readings are inserted to the model and the initial boundary
conditions are determined. The energy equation is solved in Fluent version
6.2.26.18 As a result from the calculation, the temperatures from the coordinates
corresponding to the thermocouple positions are returned. The calculated values
are compared to the measured lining temperatures. If necessary, the boundary
conditions are adjusted and a new calculation is performed. As a final calculation
result, a complete two-dimensional temperature profile of the lining is returned.
The condition to terminate the procedure is when the calculated and measured
lining temperatures agree within ±3 degrees for all thermocouple positions. This is
a condition assumed to yield sufficient accuracy of the calculations, based on the
technical tolerances of the thermocouples installed. The methodology of the
calculation procedure is shown in Figure 5.
Figure 5 Calculation procedure.
Page 27
15
5 Results and discussion
In the first part of this chapter, some of the results from the experimental study are
highlighted. Then calculation results from the mathematical model will be
presented and discussed.
5.1 Experimental study
5.1.1 Lining temperature
Lining temperature data from thermocouples on level 1 and level 2 are presented in
Figure 6. The thermocouples are placed at the same angle from the tap hole and at
the same radius. The temperature data reaches from November 2006 to May 2008.
Included in the figure is Average-Difference which is the temperature difference of
level 1 and level 2 minus the average temperature difference of the last 14 days.
Page 28
16
Figure 6 Lining temperature data from November 2006 to May 2008.
When studying the temperature data, it can be seen that there are periods of local
maximum or minimum. Under steady conditions the value varies around zero (i.e.
when the temperature difference is equal to the average value of the last 14 days).
When a heat front enters the lining, it is registered in one of the levels before the
other, and is therefore seen as a local peak in the Average-Difference-curve. The
clear peaks are marked in the figure with vertical lines. The peaks often occur
some days before the local maximum or minimum temperature. The line is based
on historical temperature data, but with the advantage that it is visually easier to
detect when the value, with a clear peak, deviates from zero. The manual surface
temperature measurements were performed during steady blast furnace operation,
when the value of the Average-Difference-curve is close to zero.
5.1.2 Wall surface temperature
Wall temperature measurements from one measuring occasion (January 16, 2008)
are presented in Figure 7. The height along the outside of the shell is on the vertical
axis and the horizontal axis shows the temperature. The different lines represent
the angle from the tap hole, see Figure 1. The four measuring positions at each line
represent levels 1-4.
Page 29
17
Figure 7 Temperature profile along outer wall
The wall temperature seems to be constant at the water-cooled part of the furnace
wall (levels 2-4 at height -0.6 to 1.6 m) and higher at the non-cooled part of the
wall (level 1 at height -1.2 m).
Figure 8 shows the temperature profile at level 3 for two different angles from the
tap hole, for one measuring occasion (January 8, 2008). The temperature is given
on the vertical axis and the horizontal axis shows the distance from the outside of
the shell. Distance 0 mm is the surface temperature, and at distance 170 and 370
mm are the lining temperatures.
Figure 8 Temperature profile along level 3.
-1,5
-1
-0,5
0
0,5
1
1,5
2
10 15 20 25 30 35 40
Heig
ht in
mete
rs
Temperature in Celsius
Wall surface temperature, 2008-01-16
45
60
90
120
135
150
180
210
225
240
270
300
R² = 0,9992
R² = 0,9893
0
20
40
60
80
100
120
0 170 370
Tem
pera
ture
in C
els
ius
Distance from shell in millimeters
08-01-08, Level 3
45
90
Linear (45)
Linear (90)
Page 30
18
The temperature profiles are linear; linear adaptations give a R2-value close to 1.
This means that it is possible to calculate the surface temperature by making a
linear adaptation between the lining temperatures and then extrapolate the curve to
the surface. These results also indicate that the hearth was in a thermal steady-state
during the measurements.
5.1.3 Bottom surface temperature
The bottom surface temperature measurements are presented as the temperature
along the radius at different angles from the tap hole. Examples of the results from
measurements performed February 14, 2008, are seen in Figure 9. The temperature
is plotted along the radius for the angles 0° and 150° from the tap hole. The filled
circles represent experimentally measured surface temperatures; the unfilled circles
are lining temperature measured by thermocouples on level 1 along the same
radius.
Figure 9 Bottom temperature profiles.
From the temperature measurements it is seen that the bottom temperature profiles
do not have a constant slope. There is one slope at the center part of the bottom and
another steeper slope from radius 1-1.25 m. The same two slopes are found for
those angles where at least two thermocouples are placed at a radius larger than 1
m.
0
50
100
150
200
250
0 1 2 3 4 5
Tem
pera
ture
in C
els
ius
Radius in meters
080214, Temperature along radius
Surface 150
Lining 150
Surface 0
Lining 0
Page 31
19
5.2 Mathematical model
5.2.1 Temperature profile calculations
Figure 10 shows the lining temperatures at three thermocouple positions during a
period of 90 days. Two of the positions are in the bottom (level 1 and level 2) and
one position is in the wall (level 3). By using the developed model, temperature
profiles were calculated for a few occasions chosen during this period (day 32, 40,
48, 56 and 70). In these calculations the transition from a steady period to an
unsteady period, and back to a steady period can be studied. It should be noted that
this studied period has the highest lining temperature registered during the whole
2.5 years campaign length of the blast furnace, and thus represents an extreme
situation.
Figure 10 Lining temperature during a 90 days period, starting at October 20, 2007.
In Figure 11 the calculated bottom temperatures at radius 0 m are presented for two
positions: the inner surface and the seam between the ceramic plate and the bottom
(carbon refractory). The material zones are indicated in Figure 1. The temperature
1150°C is included in the figure, which is the solidification temperature for carbon
saturated iron. The bottom center furnace part is where the highest lining
temperatures are found.
Page 32
20
Figure 11 Bottom temperature at radius r=0 m.
5.2.2 Evaluation of boundary conditions
The experimental study that established the relations used as boundary conditions
was performed during steady blast furnace operation. The outer boundary
conditions for three dates representing a steady blast furnace operation and one
date representing an unsteady operation are presented in Figure 12; the unsteady
date chosen is day 48 in the studied time period. The horizontal axis shows the
initial boundary conditions, based on the relations found in the experimental study.
The vertical axis shows the final adjusted boundary conditions.
0
200
400
600
800
1000
1200
1400
32 40 48 56 70
Te
mp
era
ture
in C
els
ius
Days
Bottom temperature, radius r=0
1150 Celsius
Inner surface
Ceramic plate-Carbon
refractory seam
Page 33
21
Figure 12 Initial and final boundary conditions for the outer surfaces.
For the dates representing the steady periods, the boundary conditions are adjusted
up to maximum 5 degrees. However, more adjustments are needed for the unsteady
period. The adjustments are mainly needed at the upper part of the wall. This
indicates that the water cooling is not enough to keep the wall at a constant
temperature under unsteady conditions.
5.2.3 Skull layer
When creating the model geometry the whole lining was initially assumed to be
intact. That assumption is based on the observations from the characterization
study; the studied furnace is constructed by mainly the same materials as before the
relining.13 If the temperature of the inner surface exceeds 1150°C, the iron melt can
be in contact with the lining, causing erosion and corrosion of the refractory
materials. If, however, the temperature of the inner surface is less than 1150°C, a
solidified layer of melt mixed with coke, called skull, is assumed to protect the
lining. Calculations of temperature profiles showed that the studied part of the
lining was colder than the critical temperature 1150°C, even for the highest
temperature registered during the campaign.
It is therefore of interest to calculate the skull thickness. Details of the calculations
are given in Supplement 2. The results of the calculations for one position of the
0
50
100
150
200
250
0 50 100 150 200 250Fin
al B
C t
em
pe
ratu
re in
Ce
lsiu
s
Initial BC temperature in Celsius
Initial and final BC temperatures outer surface
2007-06-18
2007-10-31
2008-03-28
Day 48
Page 34
22
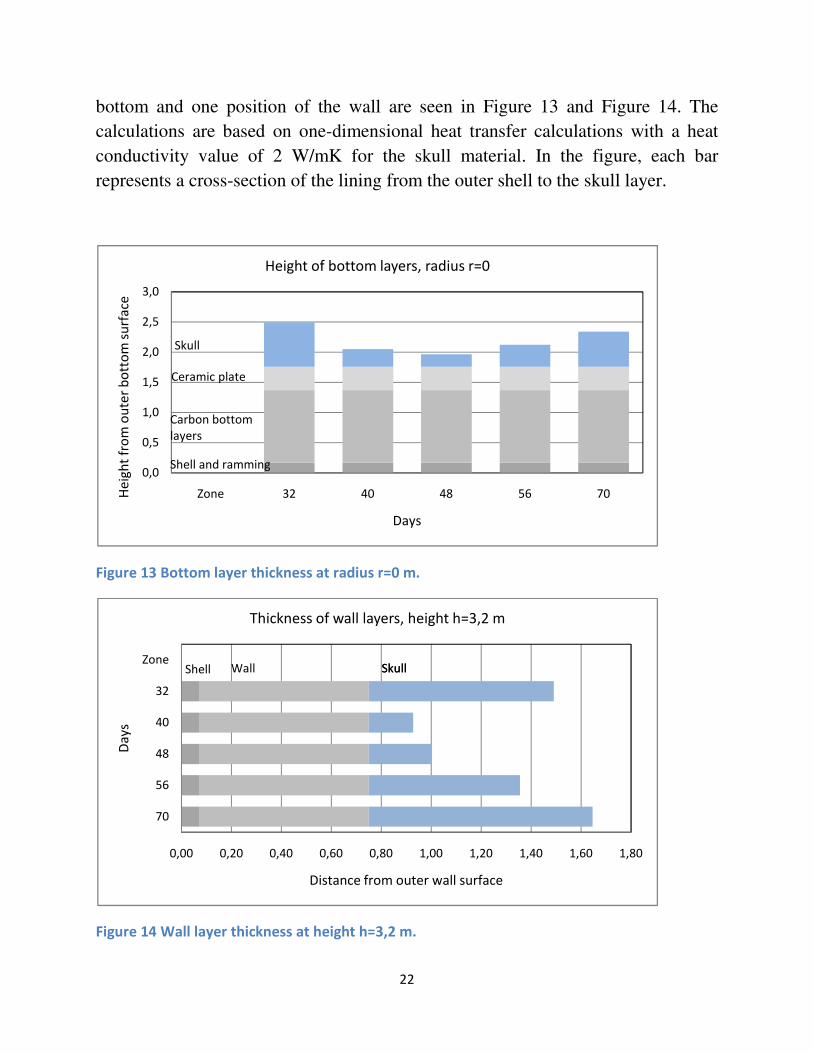
bottom and one position of the wall are seen in Figure 13 and Figure 14. The
calculations are based on one-dimensional heat transfer calculations with a heat
conductivity value of 2 W/mK for the skull material. In the figure, each bar
represents a cross-section of the lining from the outer shell to the skull layer.
Figure 13 Bottom layer thickness at radius r=0 m.
Figure 14 Wall layer thickness at height h=3,2 m.
0,0
0,5
1,0
1,5
2,0
2,5
3,0
Zone 32 40 48 56 70He
igh
t fr
om
ou
ter
bo
tto
m s
urf
ace
Days
Height of bottom layers, radius r=0
Skull
Ceramic plate
Carbon bottom
layers
Shell and ramming
0,00 0,20 0,40 0,60 0,80 1,00 1,20 1,40 1,60 1,80
70
56
48
40
32
Zone
Distance from outer wall surface
Da
ys
Thickness of wall layers, height h=3,2 m
SkullWall SkullShell
Page 35
23
The skull thickness during the studied period was in the range of 0.21-0.74 m and
0.17-0.90 m for the bottom and the wall thickness respectively. This is
approximately in the same range as in a study by Torrkulla et al.10, where the
bottom skull thickness was in the range of 0.2-0.95 m and the wall thickness in the
range of 0.25-0.85 m, within a period of 200 days.
During the characterization study it was concluded that the wall skull material
consisted of blast furnace slag mixed with coke.13 When slag covers the hearth
wall, the mechanism causing it may not only be solidification; a cold wall can
cause a local increase of the slag viscosity, and as a consequence it adheres to the
wall. Taking that mechanism into consideration, skull thickness calculations
become far more complicated.
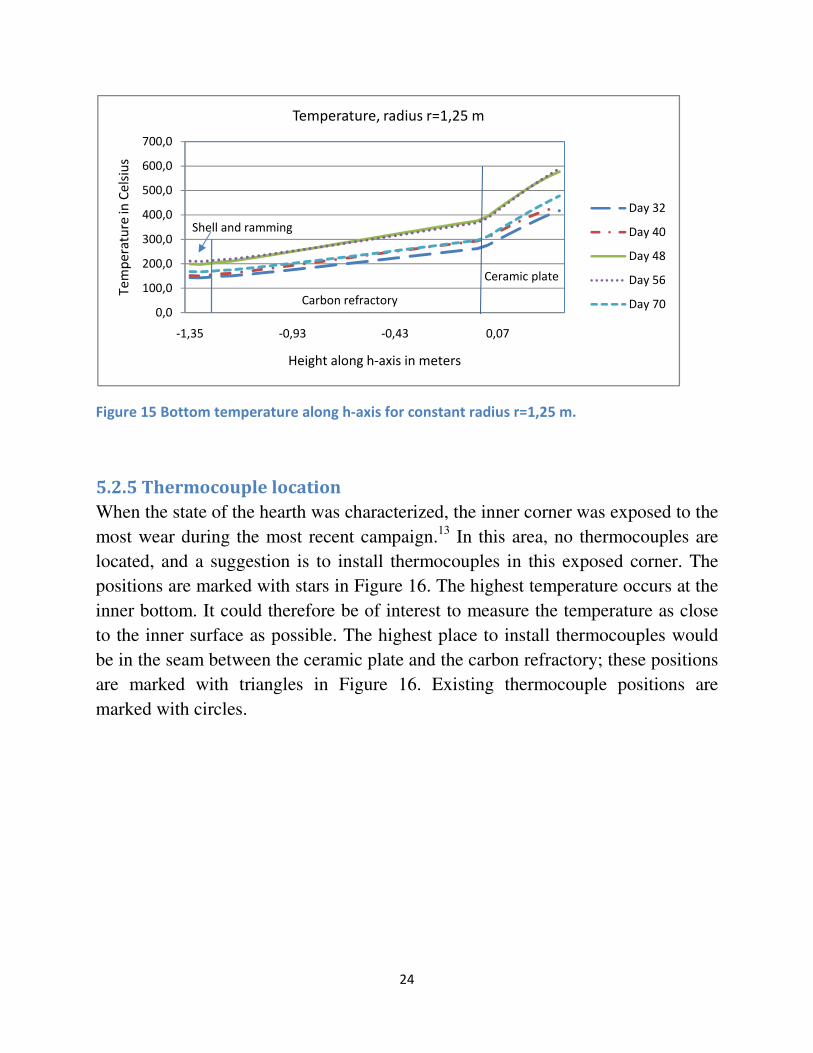
5.2.4 Inner surface temperature
In Figure 15 the bottom temperature along the h-axis (for axes, see Figure 4) is
presented for a constant radius of 1.25 m. The different lining materials are marked
in the figure, and the positions of these in the blast furnace are given in Figure 1.
The temperature curves are linear, but with different slope for each material zone.
When studying the slopes for each material zone, it was found that the quotient
between the slopes of the different material zones were almost equal for every
studied date. This is important for future process control, since it enables quick
estimations of the inner surface temperature directly from thermocouple readings
in the carbon refractory zone.
Page 36
24
Figure 15 Bottom temperature along h-axis for constant radius r=1,25 m.
5.2.5 Thermocouple location
When the state of the hearth was characterized, the inner corner was exposed to the
most wear during the most recent campaign.13 In this area, no thermocouples are
located, and a suggestion is to install thermocouples in this exposed corner. The
positions are marked with stars in Figure 16. The highest temperature occurs at the
inner bottom. It could therefore be of interest to measure the temperature as close
to the inner surface as possible. The highest place to install thermocouples would
be in the seam between the ceramic plate and the carbon refractory; these positions
are marked with triangles in Figure 16. Existing thermocouple positions are
marked with circles.
0,0
100,0
200,0
300,0
400,0
500,0
600,0
700,0
-1,35 -0,93 -0,43 0,07
Te
mp
era
ture
in C
els
ius
Height along h-axis in meters
Temperature, radius r=1,25 m
Day 32
Day 40
Day 48
Day 56
Day 70
Shell and ramming
Carbon refractory
Ceramic plate
Page 37
Figure 16 Existing thermocouple configuration (circles) and suggestions of new thermocouple
positions (triangles and stars).
The suggested thermocouples would improve the validation of the
model; moreover, skull layer calculations
area. Installing the corner thermocouples would be possible during the current
campaign. However, the suggested bottom thermocouples can only be installed
during a relining.
25
Existing thermocouple configuration (circles) and suggestions of new thermocouple
The suggested thermocouples would improve the validation of the
moreover, skull layer calculations would be possible for the exposed corner
Installing the corner thermocouples would be possible during the current
suggested bottom thermocouples can only be installed
Existing thermocouple configuration (circles) and suggestions of new thermocouple
The suggested thermocouples would improve the validation of the heat transfer
r the exposed corner
Installing the corner thermocouples would be possible during the current
suggested bottom thermocouples can only be installed
Page 39
27
6 Conclusions
It is important to carefully control the temperature of the hearth lining during a
blast furnace operation in order to have a long operational life-length of the
furnace. This study has focused on determining the heat flows in a production blast
furnace hearth, both experimentally and numerically. First, measurements of
temperatures in the lower part of a production blast furnace were carried out.
Second, a heat transfer model was developed, which was used to calculate the
temperature profiles in the hearth lining.
The specific conclusions from the study may be summarized as follows:
• For those positions in the furnace bottom, defined as angles, where
thermocouples are installed, the outer bottom and wall temperatures can be
calculated.
• The relations established in the experimental study can be used as boundary
conditions in the mathematical model with sufficient accuracy for steady
blast furnace operation. During an unsteady operation, some adjustments are
needed.
• It is possible to quickly estimate the inner surface temperature directly from
thermocouple readings, by using a calculated quotient between the heat flow
through the ceramic plate and the heat flow through the carbon refractory.
• The corner between the wall and the bottom is identified to be the most
sensitive part of the lining. It is suggested that thermocouples are installed
in this area, to improve the temperature control and enable skull layer
calculations.
Page 40
28
• For a studied time period, with a large lining temperature increase, no part of
the lining at the studied angle had an inner temperature higher than the
critical temperature 1150°C. During the time period the bottom skull layer
thickness varied between 0.21-0.74 m, based on one-dimensional heat
transfer calculations using a heat conductivity value of 2 W/mK for the skull
material.
Overall, the results of this study show that the current modeling approach is
very useful to determine suitable locations of thermocouples. Furthermore, it
has the potential to be used to suggest how the cooling conditions at the bottom
and the wall can be optimized in order to decrease variation in temperatures in
the lining. This, in turn will increase the operational lifetime of a blast furnace.
It can also lead to energy savings, since the cooling requirements can be better
understood and the use of excess water avoid.
Page 41
29
7 Future work
• Improve boundary conditions and model validation with the new suggested
thermocouple positions.
• Skull layer calculations for more positions of the inner surface, specially the
corner area, including chemical analysis of skull material.
• Extend the heat transfer model to include the unsteady tap hole area.
• Model the tap cycle, including both the heat flow and the fluid flow.
• Study the effects of different cooling conditions on the temperature
distribution in the hearth.
Page 43
31
8 References
1. Internet: www.jernkontoret.se
2. M Necati Özisik: Heat Conduction, John Wiley & Sons Inc, North Carolina,
1993.
3. Yan, Zhou, Chaubal, Zhao: Three-dimensional computational modeling of a
blast furnace hearth, Iron & Steel Technology. Vol. 2, no. 1, pp. 48-58. Jan.
2005.
4. Takatani, Inada, Takata: Mathematical model for transient erosion process of
blast furnace hearth, ISIJ International (Japan). Vol. 41, no. 10, pp. 1139-
1145. 2001.
5. Kumar: Heat transfer analysis and estimation of refractory wear in an iron
blast furnace hearth using finite element method, ISIJ International. Vol. 45,
no. 8, pp. 1122-1128. 2005.
6. Jung, Kim: Estimation model of the hearth refractory thickness and its
application to the operation, Steel Research. Vol. 72, no. 4, pp. 125-129.
Apr. 2001.
7. Rex, Zulli, Plat, Tanzil, Skimmings, Jelenich: Determination of the state of
the hearth of the BHP STEEL´s blast furnaces.
8. Kurpisz: A method for determining steady state temperature distribution
within blast furnace lining by measuring temperature at selected points,
Trans. Iron Steel Inst. Japan. Vol. 28, no. 11, pp. 926-929. Nov. 1988.
Page 44
32
9. Panjkovic, Truelove, Zulli: Numerical modeling of iron flow and heat
transfer in blast furnace hearth, Ironmaking and Steelmaking (UK). Vol. 29,
no. 5, pp. 390-400. Oct. 2002.
10. Torrkulla, Saxén: Model of the state of the blast furnace hearth, ISIJ
International (Japan). Vol. 40, no. 5, pp. 438-447. 2000.
11. Roldan, Zhang, Deshpande, Huang, Chaubal, Zhou: 3-D CFD analysis for
blast furnace hearth wear, Iron & Steel Technology, vol. 4, no. 3, pp. 43-50,
Mar. 2007.
12. Internet: www.ssab.se
13. Swartling: Characterization of the state of the blast furnace hearth, Master
Thesis in Applied Process Metallurgy, Materials Science and Engineering,
Royal Institute of Technology, Sweden, 2006.
14. Internet: www.elfa.se
15. Internet: www.graftech.com
16. Personal communication with Peter Sylvén, Graftech, 2008.
17. Internet: www.kayelaby.npl.co.uk: Tables of Physical and Chemical
Constants.
18. Internet: www.fluent.com