'. -, NASA Technical Memorandum 86698 .---. .. .... NASA-TM-86698 19850021659 An Experimental Study of Plane Mixing Layer Development R.D. Mehta land R.V. Westphal May 1985 "'", '985 J U L 'J I· LANGLEY RES=ARCH CENTER LIBRARY, NASA VIRGltlfA NI\5/\ National Aeronautics and Space Administration 1111111111111 1111 11111 11111 11111111111111 1111 NFOI061 https://ntrs.nasa.gov/search.jsp?R=19850021659 2019-05-01T18:21:02+00:00Z
Transcript
'. -,
NASA Technical Memorandum 86698
.~-- .---. .. ~ ....
NASA-TM-86698 19850021659
An Experimental Study of Plane Mixing Layer Development R.D. Mehta land R.V. Westphal
May 1985
"'", '985 J U L 'J I·
LANGLEY RES=ARCH CENTER LIBRARY, NASA
HA~,~?TO~L VIRGltlfA
NI\5/\ National Aeronautics and Space Administration
An (= (U, + U2)/2fn» wavelength of spanwise vortices in mixing laye~
v kinematic viscosity
iii
o spreading parameter
00
spreading parameter for single-stream mixing layer
Subscripts
quantity measured in high-speed side
2 quantity measured in low-speed side
m maximum value of quantity
Superscripts
(prime) fluctuating component (e.g., u = U + u l)
(overbar) time-averaged quantity
iv
SUMMARY
Detailed mean flow and turbulence measurements were made in the near-field of two plane mixing layers in air with a maximum velocity of 21 m/sec. The experimental rig enabled mixing layers of velocity ratios 0 and 0.46 to be generated simultaneously. Cases with both tripped and untripped initial boundary layers were studied. In all cases, it was found that the two-stream layer developed to the self-preserving state in a distance much shorter than did the single-stream layer which followed accepted criteria for the development distance. The asymptotic levels of the turbulence quantities in the two-stream layer and the development of the single-stream layer showed agreement with existing data. The results suggest that the two-stream mixing layer should provide a better test case for the development of turbulence models and calculation methods than the single-stream mixing layer.
1. INTRODUCTION
The turbulent plane mixing layer that forms at the interface between two uniform streams of different velocity at sufficiently high Reynolds number is a freeturbulent shear flow of considerable technological interest. Apart from its direct importance in engineering applications (e.g., an aircraft jet engine), a mixlng layer exhibits certain features that have made it a popular choice for the testing of calculation methods. Boundary conditions are easily formulated and there are no bounding solid surfaces to complicate mesh specification. In particular, mixing layers are thought to be more sensitive to the modeling of turbulence than are boundary layers (Rodi, 1915).
The plane mixing layer is also a popular choice because the asymptotic behavior of this flow is thought to be quite simple in theory. Townsend (1916) shows that the governing equations and boundary conditions for the turbulent plane mixing layer can yield "self-preserving" (or "fully developed") solutions for a sufficiently high Reynolds number and downstream distance. In practice, it is difficult to determine whether the self-preserving state has been achieved. The necessary conditions are:
1. The mixing layer thickness grows linearly with distance.
2. The shape of the mean velocity profile is independent of downstream distance when scaled by the local mixing layer thickness.
3. The profiles of all turbulence quantities are independent of streamwise location when scaled by mixing layer thickness; in particular, peak values of the turbulence stresses should be independent of streamwise location.
It is generally believed that all mixing layers achieve such a self-similar condition after a sufficient development distance. Attention has, therefore, been directed toward determining the asymptotic spreading rate and turbulence properties of the self-similar plane mixing layer (see Rodi, 1975; Birch and Eggers, 1973; and Birch, 1980 for reviews). The single-stream mixing layer is simpler to set up than the two-stream and has received the most study. Townsend (1976) shows that the maximum shear stress for any self-similar plane mixing layer (normalized by the velocity difference Uo)' can be computed in terms of a shear-layer entrainment parameter assuming an error-function shape for the mean profile. He recommends using Sabin's (1965) value for the entrainment parameter, which yields:
-- 2 -u'v'/U = 0.011 m 0
The classical analysis also shows that the effect of velocity ratio on spreading rate can be correlated by the relation:
ala = A = (1 - R)/(l + R) o
( 1 )
(2)
However, many areas of confusion remain regarding the self-preserving properties of plane mixing layers. Mixing layers seem to be very sensitive to small changes in the state and thickness of the initial boundary layer (Batt, 1975; Birch, 1977; Oster, 1977; Browand and Latigo, 1979), and to free-stream turbulence intensity (Patel, 1978; Saiy and Peerless, 1978; Pui and Gartshore, 1979). Poor agreement exists regarding spreading rates and values of turbulence quantities in selfpreserving regions that are independent of initial conditions (Rodi, 1975; Weisbrot et al., 1982; Oguchi and Inoue, 1984). There is also controversy over the existence and importance in plane turbulent mixing layers of two-dimensional large structures, such as observed by Brown and Roshko (1974). Statements of opposing views can be found in Bradshaw (1980) and Roshko (1980). Further detailed discussions on this subject can be found in Chandrsuda et al., 1978; Dimotakis and Brown, 1976; Koochesfahani et al., 1979; Champagne et al., 1976; and Breidenthal, 1980.
In spite of the rather strong theoretical arguments of Townsend (1976) and the implications of equation (2), the suggestion persists that mixing layer turbulence structure may depend on velocity ratio. Rodi (1975) presents several alternate definitions of A for equation (2). Batt (1977), Yule (1971), and Browand and Latigo (1979) all suggest that turbulence structure (e.g., the maximum value of
u,2 /U;) depends on velocity ratio. And, the single-stream layer (for which there is an abundance of data) may actually be a "singular" case because of the odd constraint on the initial entrainment streamline. In his review of plane mixing layers, Rodi (1975) separates the single-stream case and shows some differences in the self-preserving turbulence properties of single- and two-stream layers. At this time it is not certain whether measurement difficulties significantly affect this
2
preliminary conclusion, especially for the single-stream case where near-zero velocities are encountered.
The main difficulty in resolving these issues is that the agreement among experiments of nominally identical flows is rather poor, especially for the turbulence data (Rodi, 1975). This is mainly attributed to the differences in experimental setup and operating conditions. It is also recognized (Tutu and Chevray, 1975) that classical hot-wire techniques can be seriously in errOr when used in highly turbulent flows such as the plane mixing layer, particularly in regions of high local turbulence intensity as are encountered on the low-speed side of the singlestream mixing layer. It seems apparent that there is a lack of reliable data which would enable individual effects to be identified, even for the fully developed region.
The distance required for a mlxlng layer to achieve the self-preserving condition ("development distance") has been closely examined only for the case of singlestream mixing layers. Bradshaw (1966) found that the development distance was about 1000 times the momentum thickness of the initial boundary layer; or, alternatively, that the development distance Reynolds number was about 700,000. Various investigators (e.g., Wood and Bradshaw, 1982) have confirmed the criterion based on initial momentum thickness; but, as observed by Oster et al. (1977), neither criterion is readily extended to the two-stream case. There are no accepted criteria for development distance of a two-stream layer. The difficulty in applying some of the suggested criteria for development distance to the case of the two-stream mixing layer is discussed below in section 3.
The lack of consensus regarding the turbulence properties and growth rate of the fully developed plane mixing layer (as well as the confusion about the effects of velocity ratio, initial boundary layer state, and free-stream turbulence), seems to be partly a result of a lack of experimental data in the near-field of the plane ~ixing layer. Bradshaw (1966) presented near-field data for the single-stream mixing layer, but no such reliable, detailed turbulence measurements are available for the two-stream layer. It must also be noted that the near-field turbulence properties can show marked sensitivity to changes in velocity ratio and boundary layer state; this makes computation of this flow zone a very challenging test for turbulence models. Considering further that practical flows always contain nearfield regions which influence noise generation, it is evident that this region deserves more attention.
The objective of the present investigation was to compare the near-field turbulence structure of the single-stream mixing layer to that of a two-stream mixing layer for both tripped and untripped initial boundary layers. The two mixing layers were generated simultaneously in the same rig (as specifically recommended by Rodi, 1975) so that the initial and the operating conditions would be comparable. This approach has the advantage of providing a unique simultaneous comparison of the near-field mixing layer development. The disadvantage of the configuration is that the two mixing layers must eventually merge, limiting the streamwise extent over which they may be studied. Detailed measurements of the mean and turbulence
3
properties, including some second- and third-order correlations, were made in the near-field of the two mixing layers.
The experimental apparatus and techniques are presented in section 2. Section 3 contains the main results and discussion and the conclusions are given in section 4. Further detailed results for all four cases are included in the Appendix.
2. EXPERIMENTAL TECHNIQUES
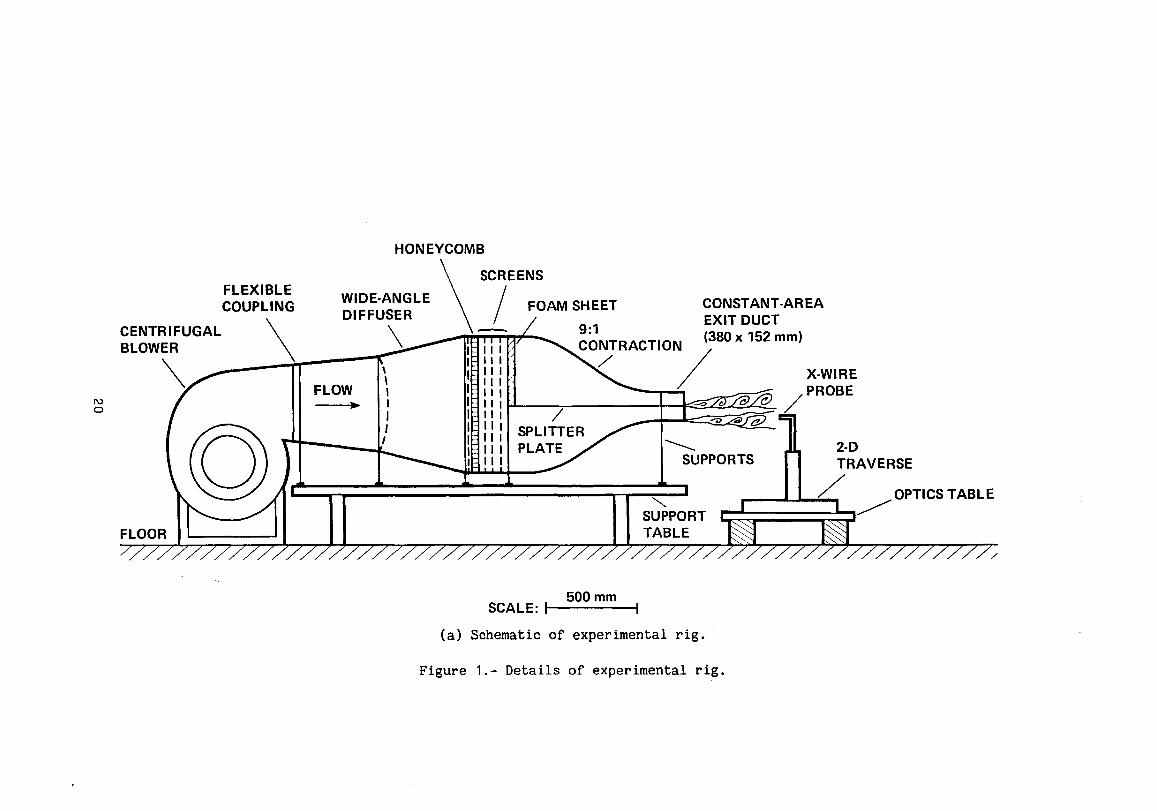
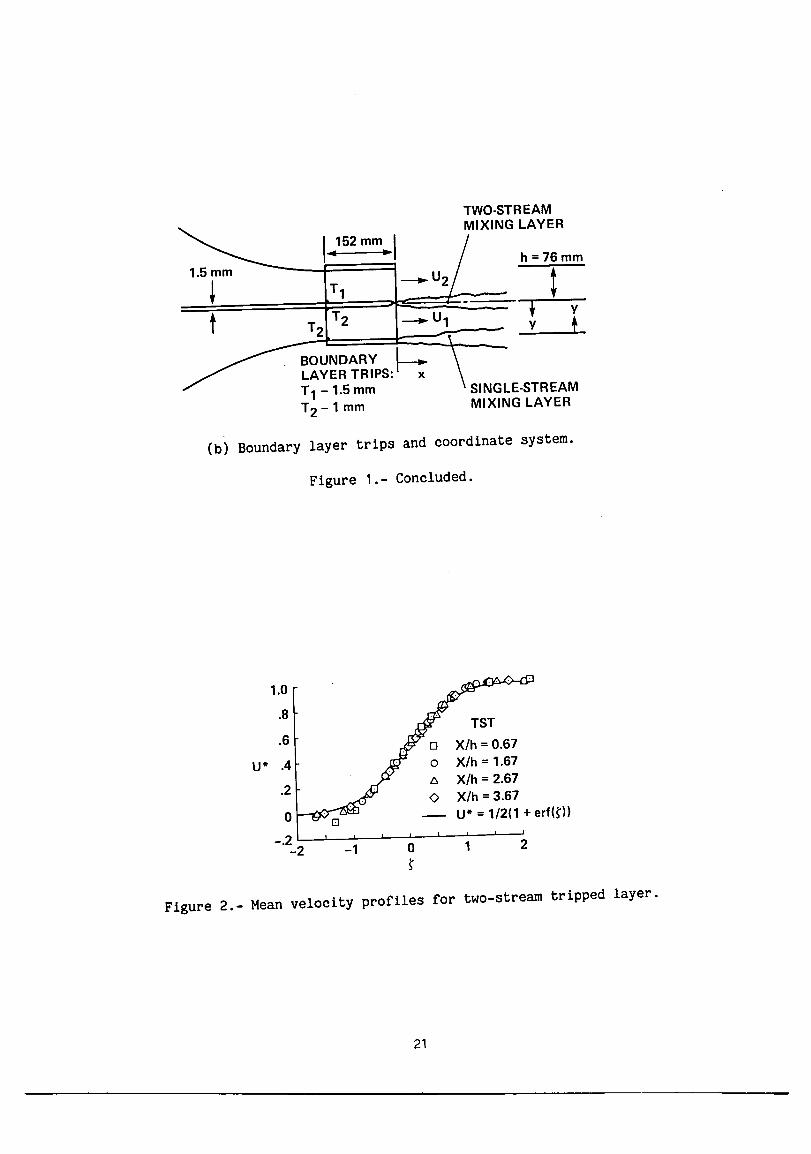
A 380 mm x 152 mm (15 in. x 6 in.) open-curcuit blower wind tunnel (fig. 1(a» was used for the experiments. The two-stream mixing layer was generated by installing a sheet of dense foam over the upper half of the last screen and dividing the flow in the contraction with a 1.5 mm thick splitter plate. This arrangement produced two streams with a velocity ratio of 0.46. Both ends of the splitter plate were tapered to zero thickness, the upstream end to minimize disturbance and the downstream end to minimize wake effects in the two-stream layer. For tripped cases, round wire trips were attached at the entry to the constant-area exit duct (fig. 1(b». This provided a region for boundary layer development at nearly zero pressure gradient prior to the formation of the mixing layers. The single-stream layer was formed at the lower lip of the development duct by the exiting high-speed side of the flow. In addition, another single-stream layer also develops from the top lip, but this region was not investigated.
In the untripped cases, the boundary layers forming the two-stream layer appear laminar (table 1), but the boundary layer forming the single-stream layer is clearly transitional, presumably due to the longer effective development distance. Thus, the objective of matching initial conditions was not met for the untripped cases.
The mixing layers exhausted into the still laboratory air where the measure- \ ments were made. Although lateral end-plates were not installed, two-dimensionality of the flow was confirmed through spanwise comparison of mean flow and turbulence profiles and a test of the two-dimensional conservation laws (see section 3). The free-stream velocity on the high speed side was about 21 mlsec, with a turbulence level of 0.2% at the duct exit. A two-degrees-of-freedom traversing system was mounted on an optics table supported on the floor.
The measurements were made using miniature X-wire probes. The wires were 5 ~
tungsten elements about 1 mm long welded to the supports. The spacing between the wires was also about 1 mm. The probes were calibrated statically in the potential core of the high-speed duct exit flow assuming a "cosine-law" response to yaw, with the effective angle determined by calibration. The analog signals were filtered (low pass at 10 Khz), DC offset, and amplified (x10) before being fed into a NASAbuilt computer interface. The interface contained a fast sample-and-hold AID converter with 12 bit resolution and a multiplexer for connection with another interface and ultimately to an HP 9845 computer.
4
The software allowed for rapid calibration and data acquisition, including correction for ambient temperature drift. The static calibration was implemented for each sample using a look-up table and the angular sensitivity was used to determine the two instantaneous components (u and v) of velocity. Signal statistics were then computed using running sums of the various moments of the velocity samples. Full details of the X-wire data acquisition system hardware and software, as well as particular response equations employed, are given in Westphal and Mehta (1983).
3. RESULTS AND DISCUSSION
3.1 Development of Mean Velocity and Turbulence Properties
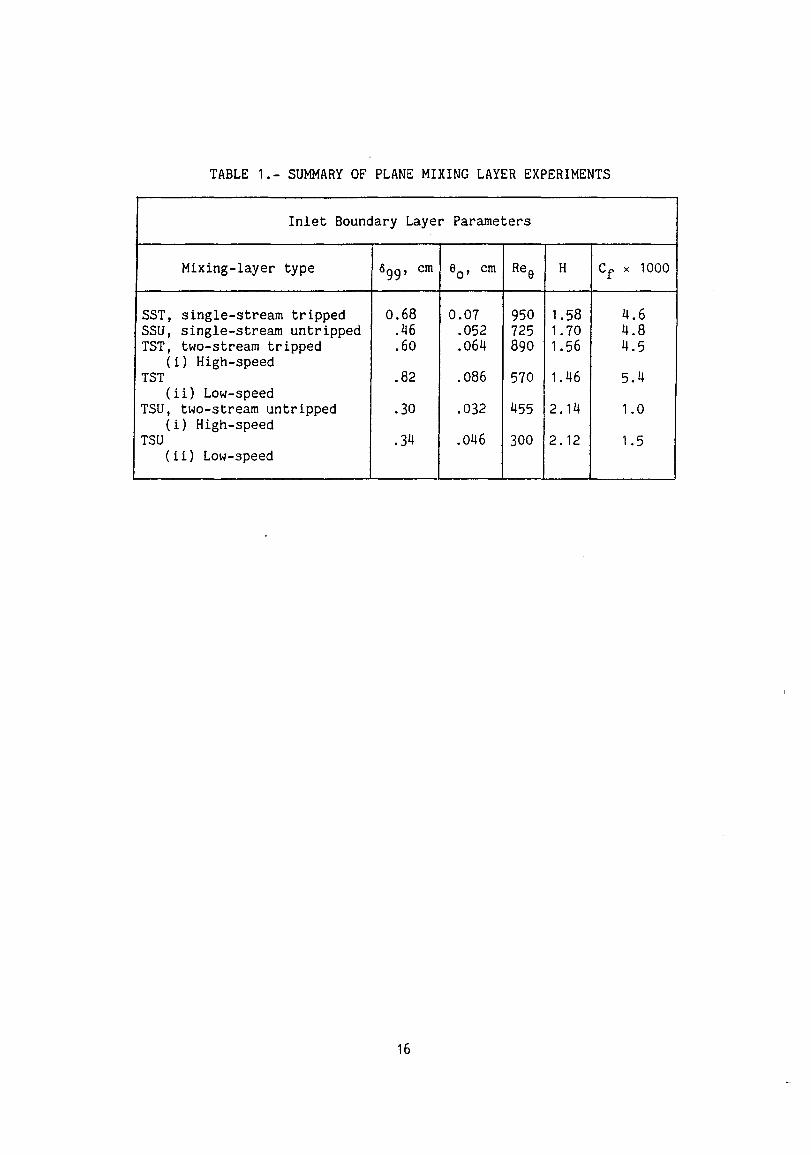
The X-wire data were acquired at various streamwise locations for each of the four cases (tripped or untripped, single- and two-stream cases) as summarized in table 1. The measurements extend only to X/h < 4, since the mixing layers are expected to interact downstream of this location (following Weir, Wood and Bradshaw, 1981). The shear layer thickness, momentum thickness (evaluated from the mean profile) and maximum turbulence shear stress are also recorded in table 1 for reference. Following Townsend (1976), the normalizing velocity scale is chosen as the velocity difference across the layer, and the shear layer thickness is used to normalize the Y coordinate.
Shear layer thickness is defined using a least-square fit of the mean to the error function profile shape:
where
U* = [1 + ERF(~)]/2
~ = (Y - Y )/6 o (4)
Yo and 6 are both determined by the fitting procedure. In figure 2, mean velocity profiles for the two-stream layer with the boundary layer tripped are plotted against the similarity parameter,~. Also shown in this figure is Townsend's (1976) error function relation. The mean profiles fit the error function to within 1% rms error within the range 0.1 < U* < 0.9 for the two-stream cases thus justifying the use of this procedure for providing an accurate, objective method of defining the shear layer thickness. It is notable that the mean profile nearly always fits the error function shape, even upstream of the self-preserving region. This was also found to be true for the single-stream layer.
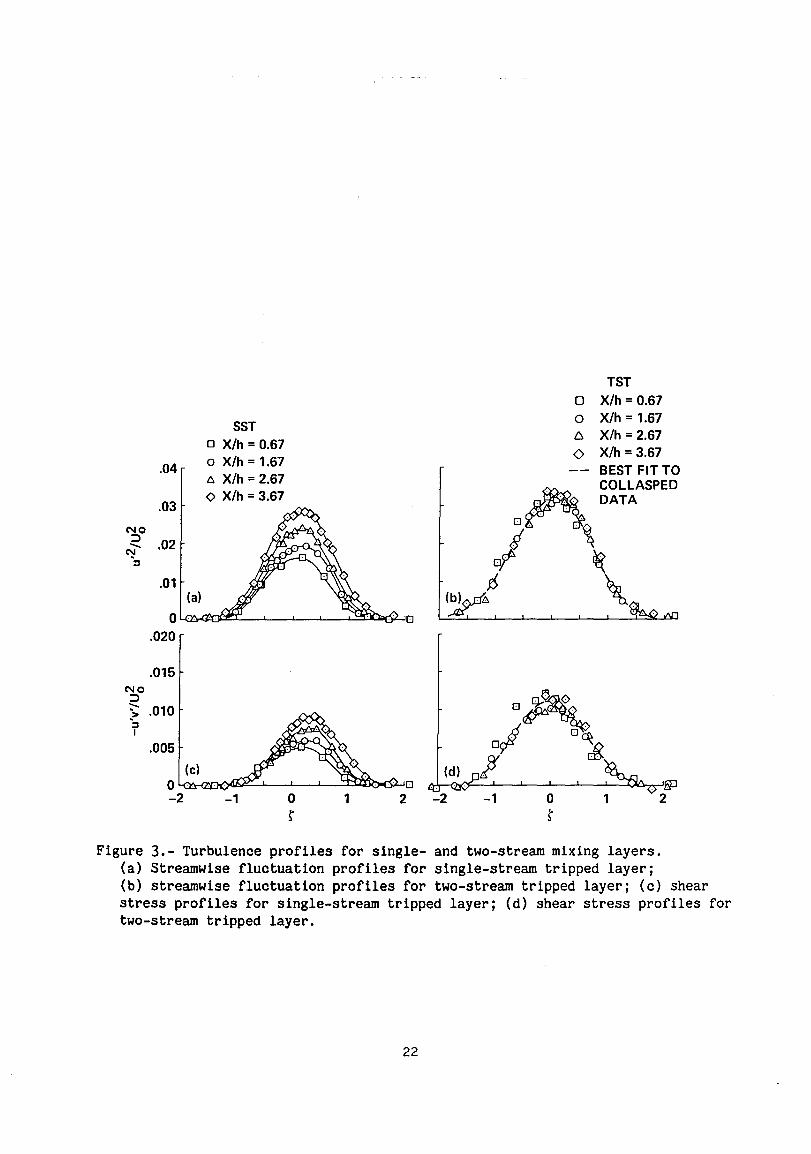
2 --The u' and u'v' profiles for the single-stream layer were compared to the two-stream layer for the tripped case in figure 3(a) to 3(d). It was clear that the single-stream layer was still developing at the last measurement station (X/h = 3.67) since turbulence stresses were increasing within the mixing layer.
Normalization of the u,2 profiles for the two-stream layer seems to indicate that
5
full development had been achieved at X/h = 0.67. However, the u'v' profiles show better similarity for X/h > 1.67. A curve is faired through the two-stream mixing layer data to indicate the self-similar profile shape.
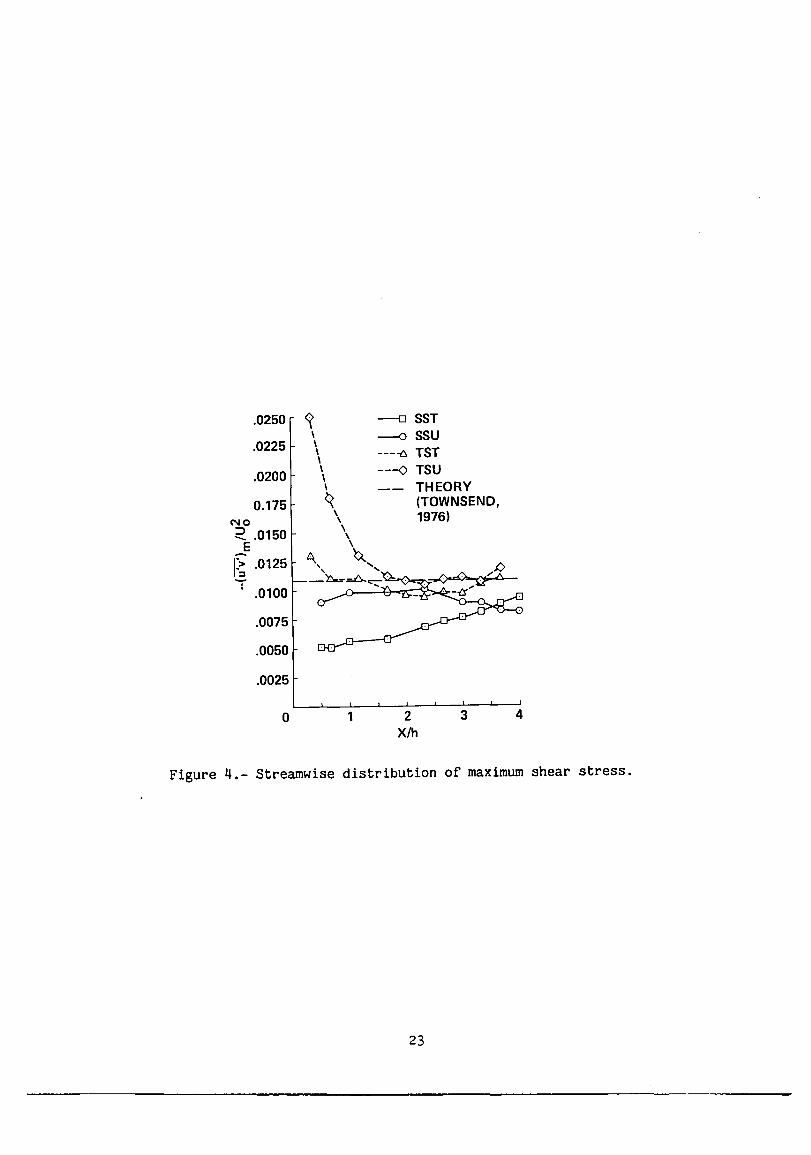
The streamwise development of the maximum measured shear stress is shown for all four cases in figure 4. Here again, the maximum shear stress for the two-stream layers has reached a constant value, whereas that for the single-stream layers was still varying monotonically at the last measurement station (X/h = 4). The upturn in maximum shear stress for the two-stream layers at X/h - 3.3 is probably due to the onset of interaction between this mixing layer and the single-stream layer from the upper lip. (Note that while the two-stream layer curves upward (toward the lowspeed side), the single-stream layer from the bottom lip curves downward (away from the two-stream layer) and so it is not affected as much. Also, the actual shear stress values are about four times higher in the single-stream layer and so it would take longer for the interaction effect to show up.)
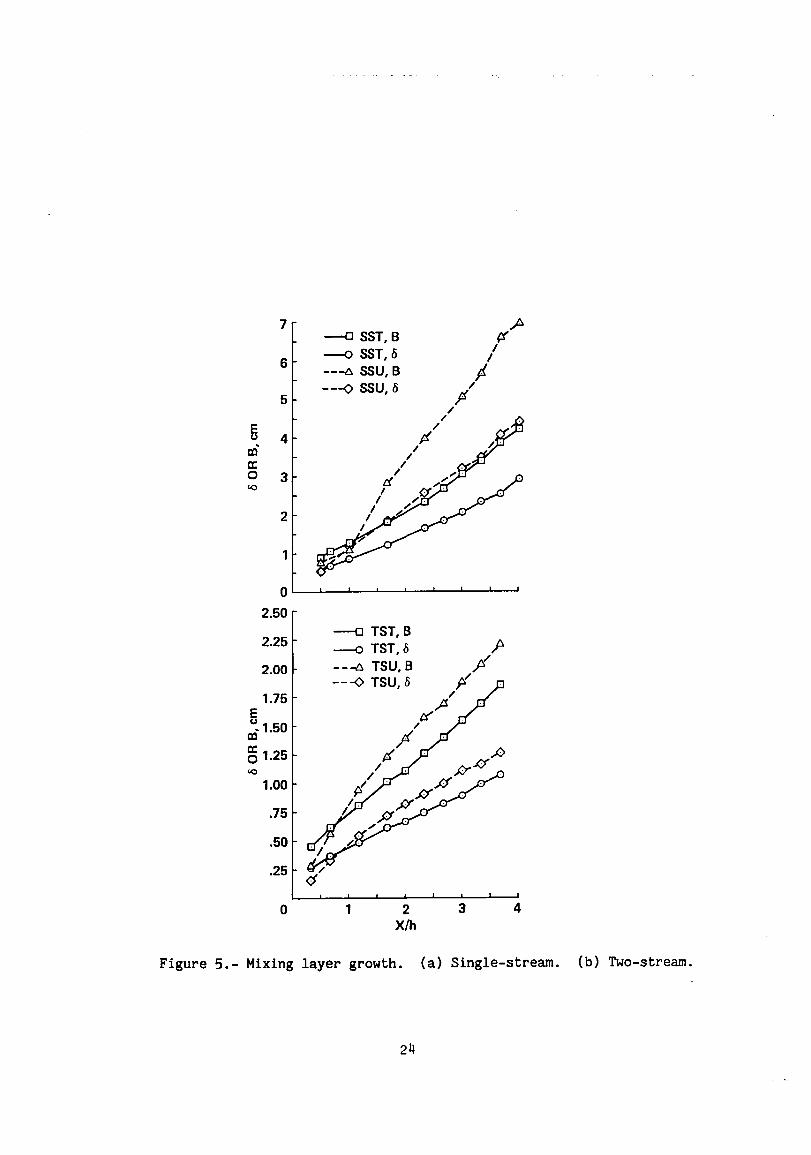
The evaluated growth rates of the single and two-stream mixing layers, with tripped and untripped boundary layers, are shown in figure 5. The designations used in table 1 (TST, TSU, SST, SSU) refer to the tripped and untripped cases for twostream and single-stream mixing layers, respectively. The untripped layers grow faster initially, so they are much thicker at a given position downstream. Although the growth appears to be linear for X/h > 2 in all the cases, for the singlestream cases, the mixing layer has not yet achieved self-similarity. Thus, linear growth seems to be a poor indicator of self-similarity. The growth rate for the untripped single-stream layer is clearly higher than the tripped case, while those for the two-stream layers are almost the same for X/h > 2.
3.2 Single-Stream Mixing Layer Properties
The development of the single-stream layer is similar to that found by Bradshaw (1966). Rodi (1975) in his review, cites Bradshaw et al. (1964) measurements in the fully developed region (made earlier in the same rig as Bradshaw, 1966), as the most self-consistent and reliable set of data for the single-stream mixing layer. The relatively high values of maximum shear stress at X/h < 1.5 (fig. 4) for the untripped case, the monotonic rise for the tripped case and the crossover at X/h - 3.5 are all qualitatively similar to Bradshaw's results. Birch and Eggers (1973) also show a similar behavior of the shear stress in the near-field. The results also seem to follow Bradshaw's 1000 9
0 criterion for reaching full develop
ment. In the present investigation, this distance is equivalent to X/h = 9 for the tripped boundary layer, and X/h = 7 for the untripped case. However, the asymptotic value for the maximum shear stress in the present case may be somewhat lower than Bradshaw's measured value of 0.01; it should be noted that the Reynolds number in the present investigation is also lower.
6
3.3 Fully Developed Properties of the Two-Stream Layer
The mean and turbulence properties in the developed region of both the twostream mixing layers are shown in figure 6(a) to 6(f). Profiles at the two extreme streamwise stations within the developed region are plotted for each case. Apart from the three measured Reynolds stresses, terms representing turbulence transport
(u'v,2) and turbulence structure (Ruv ) are also plotted in this figure. Profiles of all the quantities are seen to collapse reasonably well although the actual (maximum) values for the untripped case are slightly higher.
All the results presented above seem to indicate that a two-stream mixing layer attains the self-preserving state much faster (about 4-5 times) than does a singlestream layer, for either tripped or untripped initial boundary layers. There is no obvious explanation for this large difference in development distance. The initial and operating conditions were matched as far as possible. The free-stream turbulence level is found to affect the spreading rate (Patel, 1978) and presumably the development distance significantly. However, the free-stream turbulence level in the present experiments was the same in all the cases, except that the single-stream layer also entrains ambient room air which may have a higher effective turbulence intensity level.
Two-dimensionality of the mixing layers can be evaluated by testing whether the measured shear stresses agree with the growth rate. The relationship between shear stress and mean velocity implied by the conservation of momentum is given by Townsend (1976) for a two-dimensional mixing layer as:
where
L~ = f(au/ay)i dy/fau/aY)dY
Using Townsend's (1976) evaluations for the integrals in [5], his result in the present notation is:
(5)
For the2measured growth rates in the present case, t~iS relation gives
-u'v'/U = 0.0117 for the tripped case and -u'v'/U = 0.0136 for the untripped case~ ¥hese values are somewhat higher than our ~ea~urements (Fig. 4). However, the maximum shear stress given by Townsend's analysis (1976, p. 230) which eliminates the dependence on velocity ratio by using Sabin's (1965) measured value for the entrainment parameter, is in excellent agreement with our results for the twostream mixing layers (Fig. 4). In addition, spanwise measurements of all the quantities at X/h = 2.67 showed that the two-stream layer was reasonably
7
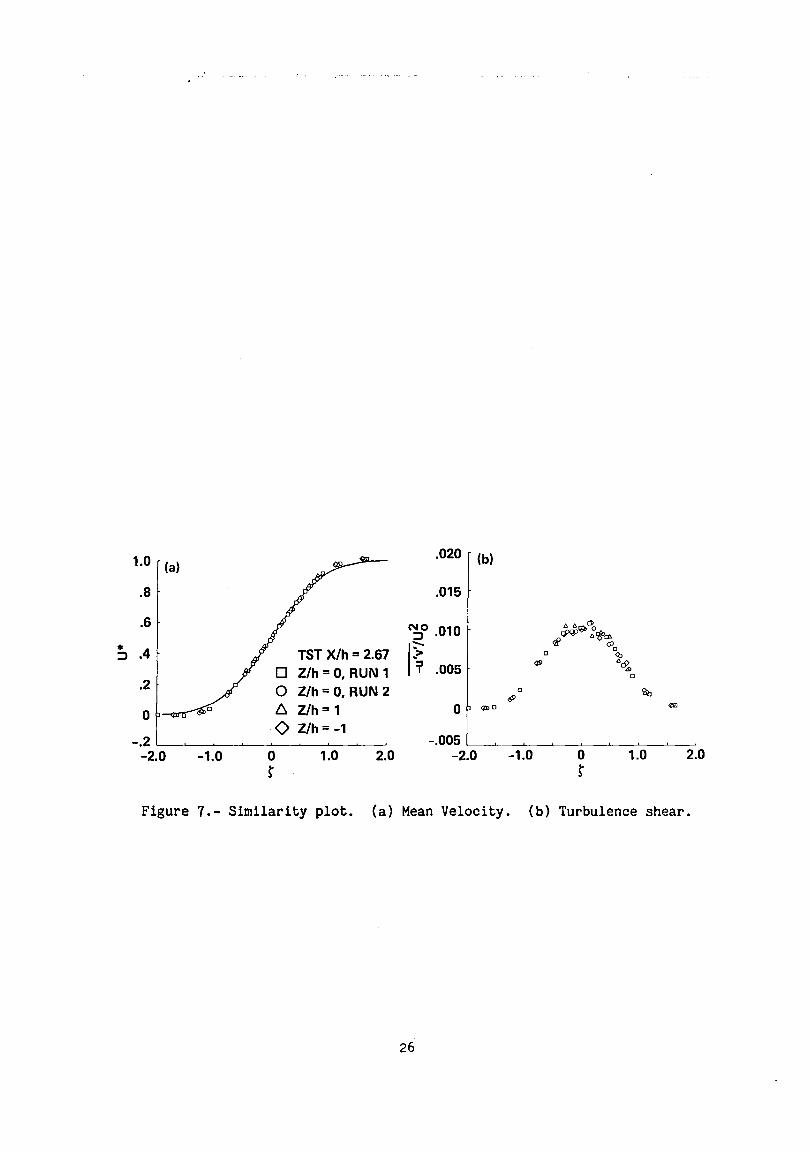
two-dimensional. Excellent collapse of the mean velocity and shear stress at three spanwise stations is illustrated in figure 1a and b. Spanwise variation of the thickness parameters (0, a, and B) is well within 3% (Table 1). Thus it is highly unlikely that our two-stream mlxlng layer was grossly affected by three-dimensionality of the flow field due to a lack of lateral end-plates.
3.4 Attainment of Self-Similarity for the Two-Stream Layer
The necessary conditions for full development were discussed above in section 1. For the two-stream mixing layers, all these conditions are satisfied downstream of X/h - 1.5. The collapse of the mean velocity profiles and two of the Reynolds stresses, for the tripped case, are clearly illustrated in figures 2 and 3(b) and 3(d).
The maximum shear stress has also reached constant asymptotic values (fig. 4), although the actual level for the untripped case is slightly higher; this is consistent with the higher growth rate. Rodi (1975) cites Patel's (1970, 1973) data as the most reliable for the two-stream mixing layer. Patel's maximum shear stress (_u'v'/U2 = 0.0103) compares well with our measured value, -u'v'/U2 - 0.011. The trend ofOhigher turbulence levels for the untripped case is also a~parent in the plots for the turbulence quantities in figure 6(a) to 6(f). However, for both cases, the agreement of the turbulence distributions measured at X/h = 1.67 and X/h = 3.33 is well within the range required for qualification as fully devel-
oped. The collapse of the triple product, u'v,2, which represents the transport of u'v' in the normal y-direction, further confirms that the turbulence transport is in equilibrium. The excellent collapse of the shear correlation coefficient, Ruv ' around a constant value of 0.5 for both cases, confirms that the turbulence structure is also in equilibrium over almost the whole width of the mixing layer. In the absence of any external effects, the turbulence intensities and structure within the mixing layer cannot be expected to change further.
The spreading rates for both cases, tripped and untripped, have reached constant asymptotic values (fig. 5(b». The spreading rate for a given velocity ratio can be evaluated using semi-empirical relations. Using equation (2) with R = 0.46 gives:
o o = 0.37 (6)
o
Taking the commonly accepted value (Rodi, 1975) of 11 for 0 0 then yields a value of 29.7 for 0 in our two-stream case.
Now the growth rate can be obtained from the spreading parameter 0 as follows:
do/dX = 110 = 1/29.7 = 0.034
8
The measured values for the two cases compare well with this estimate; d6/dX = 0.031 (tripped case) and d6/dX = 0.033 (untripped case).
Thus, unless there is more than one asymptotic state for a fully developed mixing layer (which we believe to be unlikely), the two-stream layer studied in the present investigation has satisfied all the criteria for self-similarity.
Rodi (1975) suggests that the Reynolds number (Rex) must be sufficiently high (-107) for the mixing layer structure to become independent of the initial conditions. Ho~ever, in the present experiments, the maximum value of Rex attained was about 4xl0 and the data for the tripped and untripped cases are only slightly different, with both cases having achieved self-similarity. Thus, from the present data, it can be suggested that Reynolds numbers as high as 107 may not be necessary in determining whether the self-preserving state is achieved. Also, the two-stream layer results show that the state of the initial boundary layer (laminar or turbulent) does not affect the development distance significantly, although details of the near-field evolution of turbulence quantities are drastically affected.
3.5 Criteria for Estimation of Development Distance
There is no obvious single parameter (or family of parameters) that can adequately define the development distance of a two-stream mixing layer. Birch and Eggers (1973) suggested that the development distance will increase with velocity ratio, but they did not substantiate this statement. Spencer's (1970) results for
u,2 seem to agree with this suggestion, but his w,2 results indicate collapse of the profiles for X > 18 cm for both velocity ratios (R = 0.6 and 0.3). Moreover, Spencer reports that the nature of the flow in the initial boundary layers was "sinusoidal," which would be expected to affect the behavior of the streamwise velocity further downstream. Unfortunately Spencer does not show the streamwise
development of 2 --v' and u 'v' .
Ho and Huerre (1984) plotted some single- and two-stream mixing layer data in the form of peak turbulence level versus downstream distance for both laminar and turbulent initial boundary layers. The nondimensional downstream distance was defined as AX/An , with An - e/0.032. Ho (private communication, 1985) has advised that the value of e on the high-speed side was employed for the two-stream mixing layer data. Although Ho and Huerre (1984) state that the asymptotic turbulence level is reached for all the mixing layers at the same streamwise station, AX/A n = 10, their plot suggests a value closer to 20 which corresponds to AXle = 625. For single-stream layers, A = 1 and so this corresponds to X/e = 625, somewhat lower than the widely accepted value of 1000. Applying this criterion to the present data gives development distances of X/h = 7, 14, 6, and 4 for TSU, TST, SSU, and SST, respectively. Apart from clearly overestimating the development distances for the two-stream layers, this criterion also suggests that the twostream layers should take longer to reach self-similarity than the single-stream
9
layers. Only one set of two-stream data (Browand and Latigo, 1979) was used to demonstrate the applicability of the proposed criterion to all mixing layers. The reason for the apparent success was that Browand and Latigo's (1979) development distance agrees, somewhat fortuitously we believe, with single-stream layer development if 0 from the high-speed side is used. The rationale for using 0 from only the high-speed for two-stream mixing layers is not apparent.
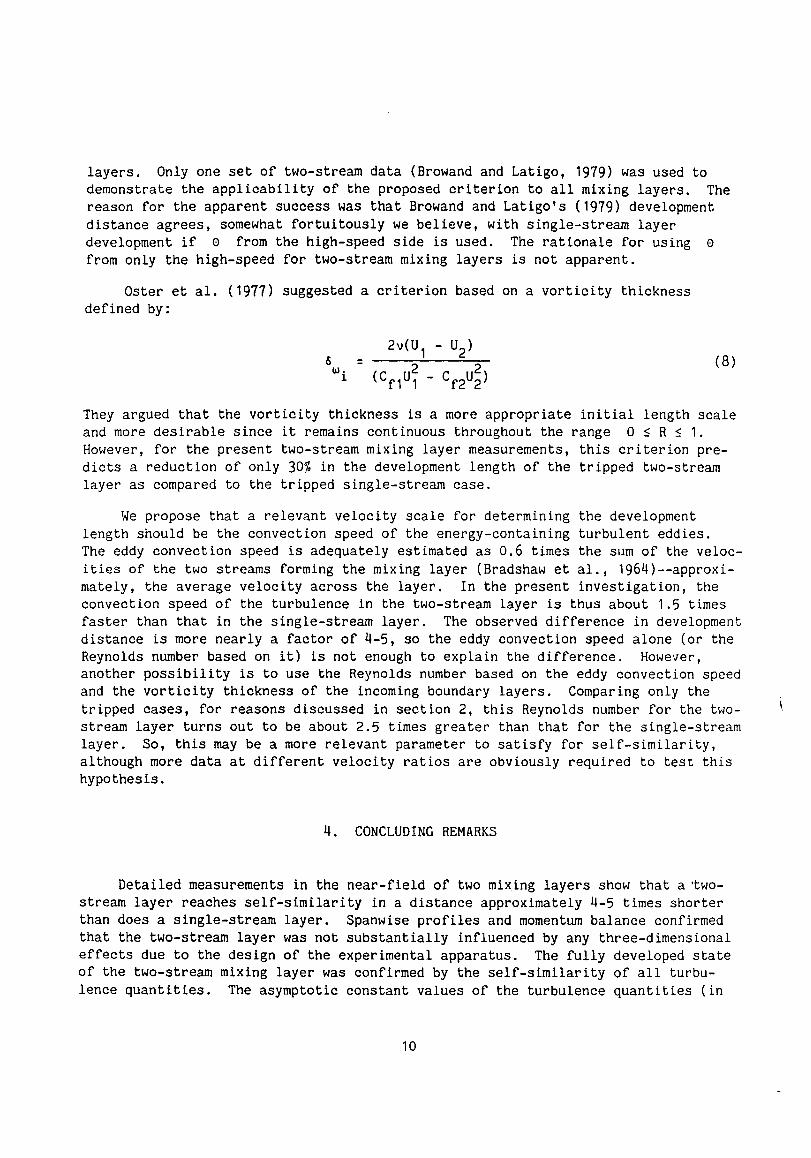
Oster et al. (1977) suggested a criterion based on a vorticity thickness defined by:
(8)
They argued that the vorticity thickness is a more appropriate initial length scale and more desirable since it remains continuous throughout the range 0 ~ R ~ 1. However, for the present two-stream mixing layer measurements, this criterion predicts a reduction of only 30% in the development length of the tripped two-stream layer as compared to the tripped single-stream case.
We propose that a relevant velocity scale for determining the development length should be the convection speed of the energy-containing turbulent eddies. The eddy convection speed is adequately estimated as 0.6 times the sum of the velocities of the two streams forming the mixing layer (Bradshaw et al., 1964)--approximately, the average velocity across the layer. In the present investigation, the convection speed of the turbulence in the two-stream layer is thus about 1.5 times faster than that in the single-stream layer. The observed difference in development distance is more nearly a factor of 4-5, so the eddy convection speed alone (or the Reynolds number based on it) is not enough to explain the difference. However, another possibility is to use the Reynolds number based on the eddy convection speed and the vorticity thickness of the incoming boundary layers. Comparing only the tripped cases, for reasons discussed in section 2, this Reynolds number for the twostream layer turns out to be about 2.5 times greater than that for the single-stream layer. So, this may be a more relevant parameter to satisfy for self-similarity, although more data at different velocity ratios are obviously required to test this hypothesis.
4. CONCLUDING REMARKS
Detailed measurements in the near-field of two mIxIng layers show that a ,twostream layer reaches self-similarity in a distance approximately 4-5 times shorter than does a single-stream layer. Spanwise profiles and momentum balance confirmed that the two-stream layer was not substantially influenced by any three-dimensional effects due to the design of the experimental apparatus. The fully developed state of the two-stream mixing layer was confirmed by the self-similarity of all turbulence quantities. The asymptotic constant values of the turbulence quantities (in
10
particular, the shear stress), agreed well with existing data taken at higher Reynolds numbers. This implies that Reynolds number may not be a very important parameter as far as attainment of the self-preserving condition is concerned.
Further, the development distance of the two-stream layer is not affected significantly by the state of the initial boundary layers. The rapid development distance is not adequately explained by criteria based on the initial momentum thickness or vorticity thickness. We propose that a Reynolds number based on the eddy convection speed and the vorticity thickness may be a more relevant parameter for defining the required development distance. Unless the single-stream layer is an extremely pathological case, our results and discussion indicate that the development distance of a mixing layer should DECREASE with increasing velocity ratio.
The relatively fast development, regardless of initial conditions, and the better accuracy of available X-wire data for two-stream mixing layers (when compared to single-stream) should make it more attractive for developing and testing turbulence models. However, it must be noted that the details of the near-field development are drastically affected by the initial conditions, regardless of velocity ratio.
11
APPENDIX
DATA REDUCTION AND TABULATED DATA
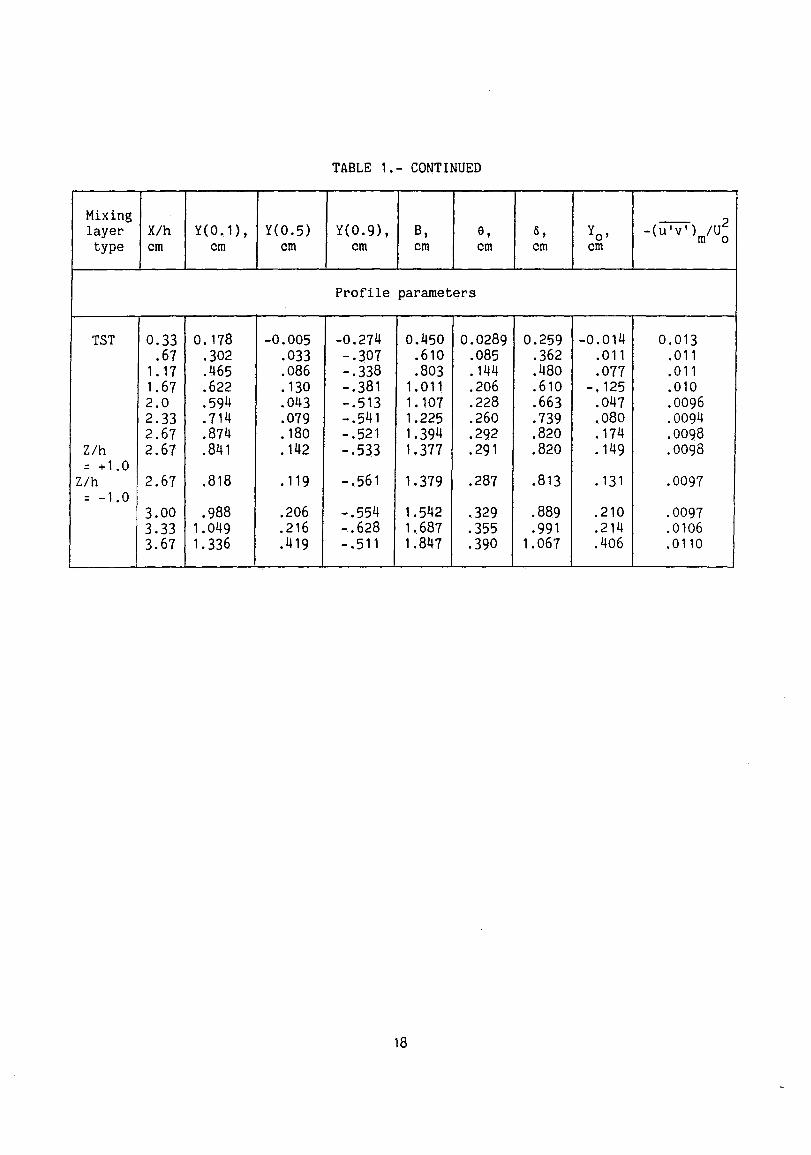
Table 1 summarizes all the data acquired for this study. Data reduction resulted in the determination of the profile parameters also given in table 1. A simple cubic interpolation was used to locate profile points at which the normalized velocity achieved a particular value (e.g., Y(U* = 0.1». Direct integration of the interpolated profile using an adaptive quadrature routine was performed to obtain the thickness of parameter 9. A two parameter minimization routine was employed to yi~ld best-fit values of Yo and 0 for the error function mean velocity profile.
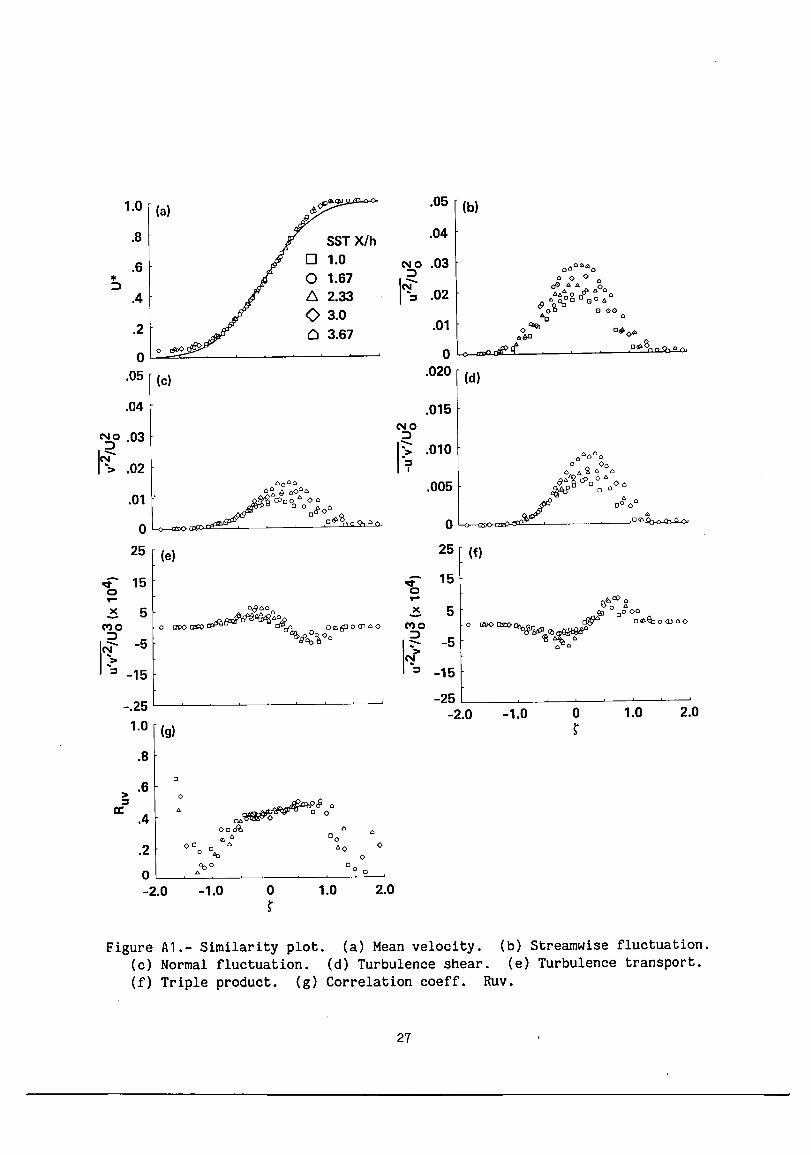
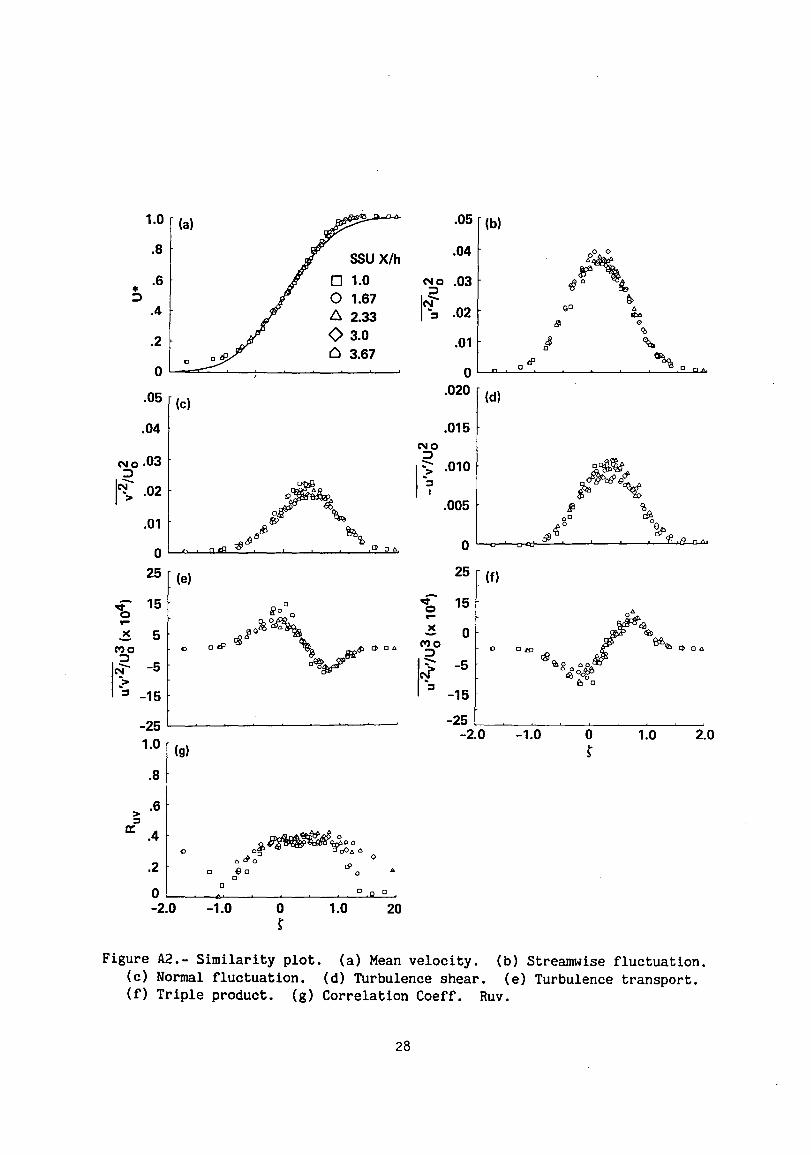
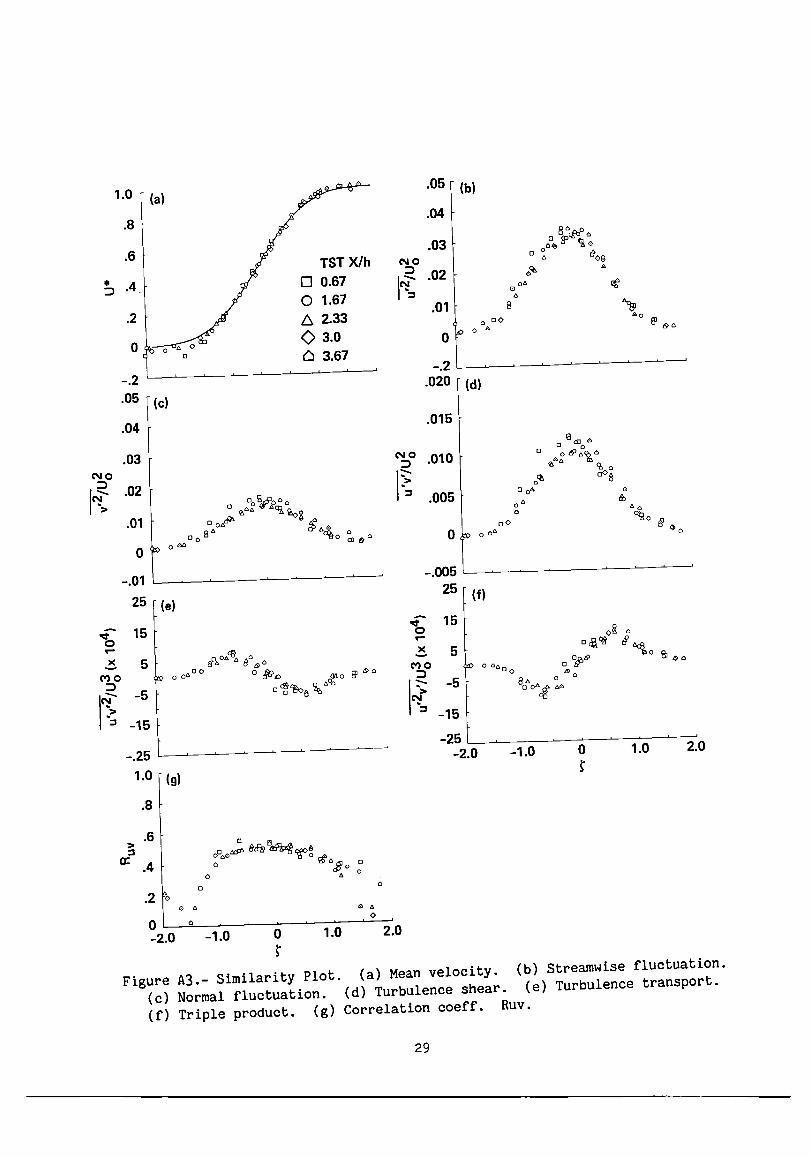
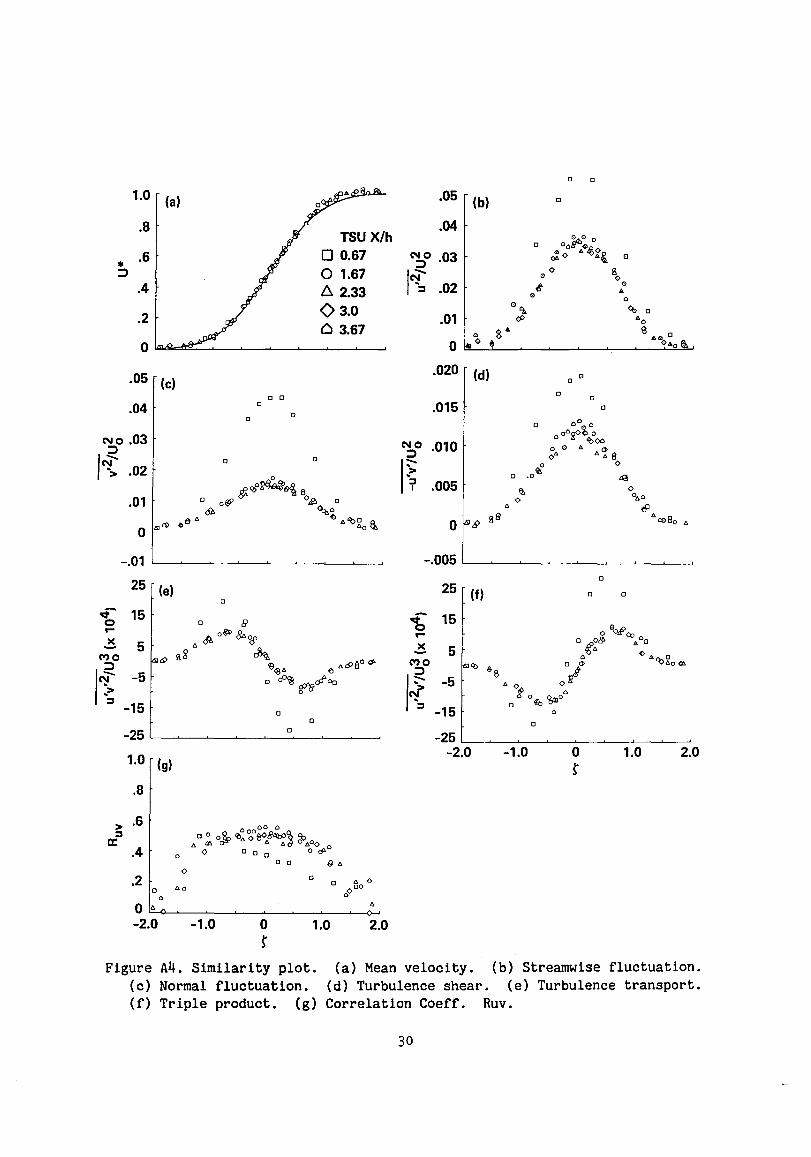
Figures A1-A4 show detailed profiles of seven different quantities for five streamwise locations in each of the four cases. For these figures, the cross-stream coordinate Y has been normalized using the best-fit parameters Y and o.
12
REFERENCES
Batt, R. G.: Some Measurements on the Effect of Tripping the Two-Dimensional Shear Layer, AIAA J., vol. 13, no. 2, 1975, pp. 245-247.
Batt, R. G.: Turbulent Mixing of Passive and Chemically Reacting Species in a LowSpeed Shear Layer, J. Fluid Mech., vol. 82, pt. 1, 1977, pp. 53-95.
Birch, S. F.: On the Developing Region of a Plane Mixing Layer. Turbulence in Internal Flows, S. N. B. Murthy, ed., Hemisphere Publishing Company, Washington, D.C., 1977, pp. 89-100.
Birch, S. F.: Planar Mixing Layer, in AFOSR-HTTM-Stanford Conference on Complex Turbulent Flows, vol. 1, S. J. Kline, B. J. Cantwell, and G. M. Lilley, eds., 1980, pp. 170-175.
Birch, S. F.; and Eggers, J. M.: A Critical Review of the Experimental Data for Developed Free Turbulent Shear Layers, Conference Proceedings--Free Turbulent Shear Flows Conference, NASA Langley Research Center, Hampton, Va., July 20-21, 1972, NASA SP-321, vol. 1, 1973, pp. 11-40.
Bradshaw, P.; Ferriss, D. H.; and Johnson, R. F.: Turbulence in the Noise-Producing Region of a Circular Jet, J. Fluid Mech., vol. 19, 1964, pp. 591-624.
Bradshaw, P.: The Effect of Initial Conditions on the Development of a Free Shear Layer, J. Fluid Mech., vol. 26, 1966, pp. 225-236.
Bradshaw, P.: Introduction to the Section on "Coherent Structures," Proc. 2nd Symp. Turb. Shear Flows, London. Springer-Verlag, Berlin, 1980.
Breidenthal, R. E.: Response of Plane Shear Layers and Wakes to Strong ThreeDimensional Disturbances, Phys. Fluids, vol. 23, no. 10, Oct. 1980.
Browand, F. K.; and Latigo, B. 0.: Growth of the Two-Dimensional Mixing Layer from a Turbulent and Nonturbulent Boundary Layer, Phys. Fluids, vol. 22, no. 6, June 1979.
Brown, G. L.; and Roshko, A.: On Density Effects and Large Structure in Turbulent Mixing Layers, J. Fluid Mech., vol. 64, 1974, pp. 775-816.
Champagne, F. H.; Pao, Y. H.; and Wygnanski, I. J.: On the Two-Dimensional Mixing Region, J. Fluid Mech., vol. 74, pt. 2, 1976, pp. 209-250.
Chandrsuda, C.; Mehta, R. D.; Weir, A. D.; and Bradshaw, P.: Effect of Free-Stream Turbulence on Large Structure in Turbulent Mixing Layers, J. Fluid Mech., vol. 85, 1978, pp. 693-704.
13
Dimotakis, P. E.; and Brown, G. L.: The Mixing Layer at High Reynolds Number: Large Structure Dynamics and Entrainment, J. Fluid Mech., vol. 78, no. 3, 1976, pp. 535-560.
Ho, C. M.; and Huerre, P.: Perturbed Free Shear Layers, Ann. Rev. Fluid Mech., vol. 16, 1984, pp. 365-424.
Koochesfahani, M. M.; Catherasoo, C. J.; Dimotakis, P. E.; Gharib, M.; and Lang, D. B.: Two-Point LDV Measurements in a Plane Mixing Layer, AIAA J., vol. 17, no. 12, 1979, pp. 1347-1351.
Mills, R. D.: Numerical and Experimental Investigations of the Shear Layer Between Two Parallel Streams, J. Fluid Mech., vol. 33, pt. 3, 1968, pp. 591-616.
Oguchi, H.; and Inoue, 0.: Mixing Layer Produced by a Screen and its Dependence on Initial Conditions, J. Fluid Mech., vol. 142, 1984, pp. 217-231.
Oster, D.; Wygnanski, I. J.; and Fiedler, H.: Some Preliminary Observations on the Effect of Initial Conditions on the Structure of the Two-Dimensional Turbulent Mixing Layer. Turbulence in Internal Flows, S. N. B. Murthy, ed., Hemisphere Publishing Co., Washington, D.C., 1977, pp. 67-87.
Oster, D.; and Wygnanski, I. J.: The Forced Mixing Layer Between Two Parallel Streams, J. Fluid Mech., vol. 123, 1982, pp. 91-130.
Patel, R. P.: A Study of Two-Dimensional Symmetric and Asymmetric Turbulent Shear Flows, Ph.D. Thesis, McGill University, 1970.
Patel, R. P.: An Experimental Study of a Plane Mixing Layer, AIAA J., vol. 11, no. 1, 1973, pp. 67-71.
Patel, R. P.: Effects of Stream Turbulence on Free Shear Flows, Aero Quarterly, vol. 29, 1978, pp. 33-43.
Pui, N. K.; and Gartshore, I. S.: Measurements of the Growth Rate and Structure in Plane Turbulent Mixing Layers, J. Fluid Mech., vol. 91, pt. 1, 1979, pp. 111-130.
Rodi, W.: A Review of Experimental Data of Uniform Density Free TUrbulent Boundary Layers, in Studies in Convection, vol. 1, B. E. Launder, ed., Academic Press, 1975, pp. 79-165.
Roshko, A.: The Plane Mixing Layer--Flow Visualization Results and ThreeDimensional Effects, paper presented at Intl. Conf. on the Role of Coherent Structures in Modeling Turbulence and Mixing, Madrid, Spain, June 1980.
Sabin, C. M.: An Analytic and Experimental Study of a Plane, Incompressible, Turbulent Shear Layer with Arbitrary Velocity Ratio and Pressure Gradient, Trans. ASME J. Bas. Engr., vol. 87, 1965, pp. 421-428.
14
Saiy, M.; and Peerless, S. J.: Measurements of Turbulence Quantities in a TwoStream Mixing Layer, J. Fluid Mech., vol. 89, pt. 4, 1978, pp. 709-722.
Spencer, B. W.: Statistical Investigation of Turbulent Velocity and Pressure Fields in a Two-Stream Mixing Layer, Ph.D. Thesis, University of Illinois at UrbanaChampaign, 1970.
Townsend, A. A.: Structure of Turbulent Shear Flow, Second ed., Cambridge Univ. Press, 1976, pp. 227-230.
Tutu, N. K.; and Chevray, R.: Cross-Wire Anemometry in High-Intensity Turbulence, J. Fluid Mech., vol. 71, pt. 4, 1975, pp. 785-800.
Weir, A. D.; Wood, D. H.; and Bradshaw, P.: Interacting Turbulent Shear Layers in a Plane Jet, J. Fluid Mech., vol. 107, 1981, pp. 237-260.
Weisbrot, I.; Einav, S.; and Wygnanski, I.: The Nonunique Rate of Spread of the Two-Dimensional Mixing Layer, Phys. Fluids, vol. 25, no. 10, 1982, pp. 1691-1693.
Westphal, R. V.; and Mehta, R. D.: Crossed Hot-Wire Data Acquisition and Reduction System, NASA TM-85871, 1984.
Wood, D. H.; and Bradshaw, P.: A Turbulent Mixing Layer Constrained by a Solid Surface. Part 1. Measurements Before Reaching the Surface, J. Fluid Mech., vol. 122, 1982, pp. 57-89.
Yule, A. J.: Spreading of Turbulent Mixing Layers, AIAA J., vol. 10, no. 5, 1971, pp. 686-687.
15
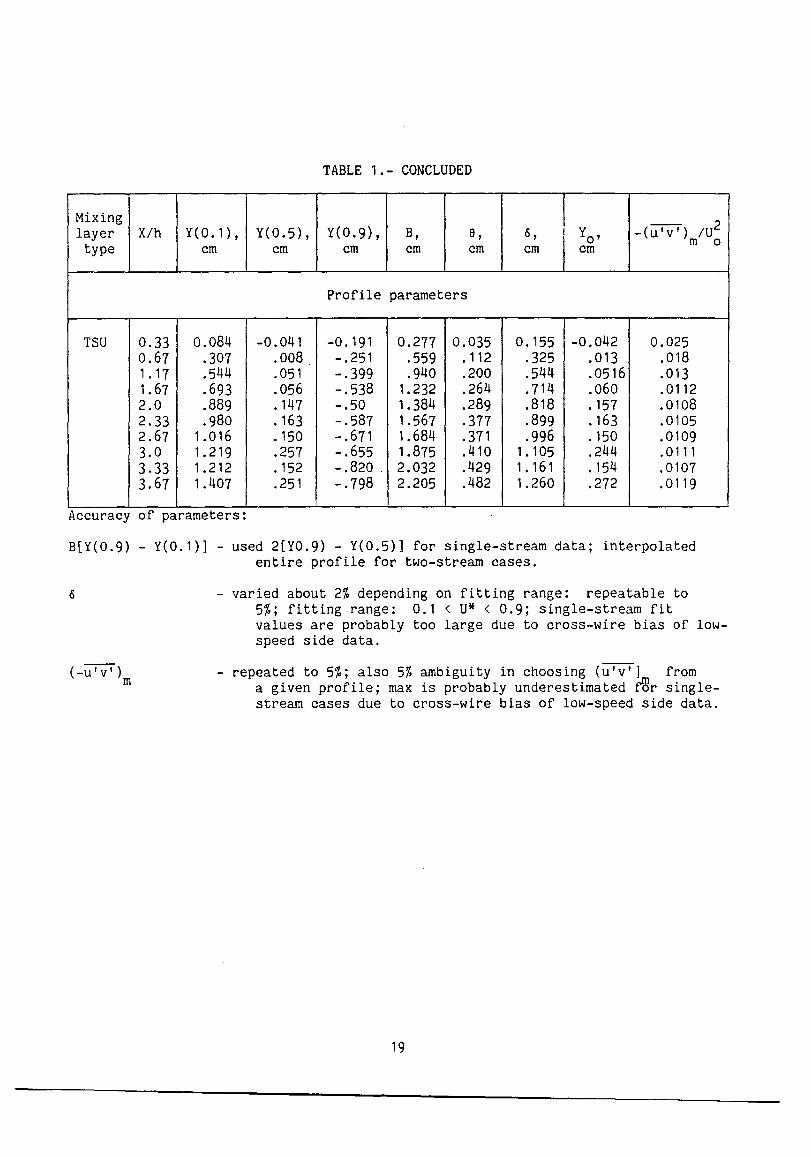
TABLE 1.- SUMMARY OF PLANE MIXING LAYER EXPERIMENTS
B[Y(0.9) - Y(O.l)] - used 2[YO.9) - Y(0.5)] for single-stream data; interpolated entire profile for two-stream cases.
- varied about 2% depending on fitting range: repeatable to 5%; fitting range: 0.1 < U* < 0.9; single-stream fit values are probably too large due to cross-wire bias of lowspeed side data.
- repeated to 5%; also 5% ambiguity in choosing (u'v'l from a given profile; max is probably underestimated ~r singlestream cases due to cross-wire bias of low-speed side data.
Figure 6.- Mean and turbulence velocity. (a) Mean velocity profiles in two-stream mixing layers; (b) streamwise fluctuation profiles for two-stream layers; (c) normal fluctuation profiles for two-stream layers; (d) shear stress profiles for two-stream layers; (e) turbulence transport profiles for two-stream layers; f) shear correlation coefficient profiles for two-stream layers.
R. D. Mehta and R. V. Westphal 85159 10. Work Unit No.
9 .. Performing Organization Name and Address
Ames Research Center, 11. Contract or Grant No. Moffett Field, CA 94035
13. Type of Report and Period Covered
12. Sponsoring Agency Name and Address Technical Memorandum National Aeronautics and Space Administration 14. Sponsoring Agency Code Washington, DC 20546
15. Su pplementary Notes
Point of contact: R. D. Mehta, Ames Research Center, MS 227-8, Moffett Field, California 94035 (415) 694-5862 or FTS 464-5862
16. Abstract
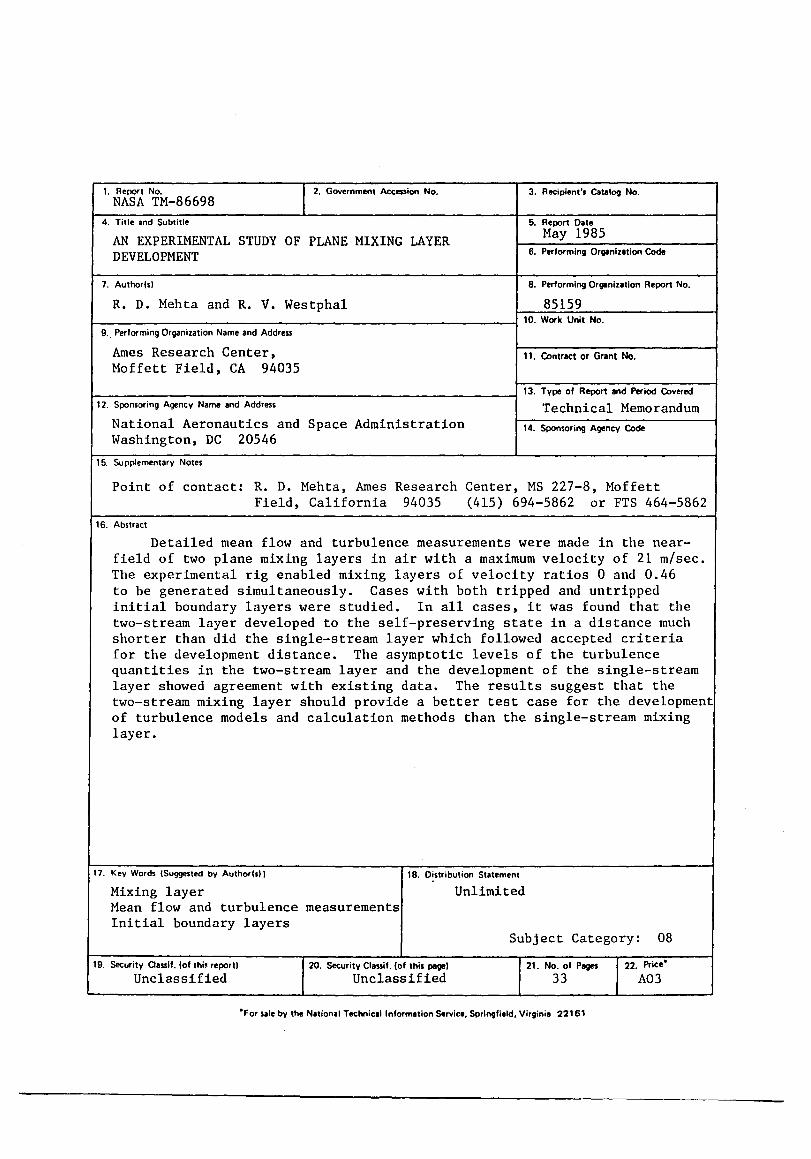
Detailed mean flow and turbulence measurements were made in the near-field of two plane mixing layers in air with a maximum velocity of 21 m/sec. The experimental rig enabled mixing layers of velocity ratios 0 and 0.46 to be generated simultaneously. Cases with both tripped and untripped initial boundary layers were studied. In all cases, it was found that the two-stream layer developed to the self-preserving state in a distance much shorter than did the single-stream layer which followed accepted criteria for the development distance. The asymptotic levels of the turbulence quantities in the two-stream layer and the development of the single-stream layer showed agreement with existing data. The results suggest that the two-stream mixing layer should provide a better test case for the development of turbulence models and calculation methods than the single-stream mixing layer.
17. Key Words (Suggested by Author(s)) 18. Distribution Statement
Mixing layer Unlimited Mean flow and turbulence measurements Initial boundary layers
Subject Category: 08
19. Security Oassif. (of thi' report) 20. Security Classif. (of this pagel 21. No. of Pages 22. Price·
Unclassified Unclassified 33 A03
·For sale by the National Technicllinformllion Service, Springfield, Virginia 22161