U.S. Department of the Interior U.S. Geological Survey Open-File Report 2017–1132 Prepared in cooperation with the Florida Fish and Wildlife Conservation Commission An Expert Elicitation Process To Project the Frequency and Magnitude of Florida Manatee Mortality Events Caused by Red Tide ( Karenia brevis)
Transcript
U.S. Department of the InteriorU.S. Geological Survey
Open-File Report 2017–1132
Prepared in cooperation with the Florida Fish and Wildlife Conservation Commission
An Expert Elicitation Process To Project the Frequency and Magnitude of Florida Manatee Mortality Events Caused by Red Tide (Karenia brevis)
An Expert Elicitation Process To Project the Frequency and Magnitude of Florida Manatee Mortality Events Caused by Red Tide (Karenia brevis)By Julien Martin, Michael C. Runge, Leanne J. Flewelling, Charles J. Deutsch, and Jan H. Landsberg
Prepared in cooperation with the Florida Fish and Wildlife Conservation Commission
Open-File Report 2017–1132
U.S. Department of the InteriorU.S. Geological Survey
U.S. Department of the InteriorRYAN K. ZINKE, Secretary
U.S. Geological SurveyWilliam H. Werkheiser, Acting Director
U.S. Geological Survey, Reston, Virginia: 2017
For more information on the USGS—the Federal source for science about the Earth, its natural and living resources, natural hazards, and the environment—visit https://www.usgs.gov or call 1–888–ASK–USGS.
For an overview of USGS information products, including maps, imagery, and publications, visit https://store.usgs.gov.
Any use of trade, firm, or product names is for descriptive purposes only and does not imply endorsement by the U.S. Government.
Although this information product, for the most part, is in the public domain, it also may contain copyrighted materials as noted in the text. Permission to reproduce copyrighted items must be secured from the copyright owner.
Suggested citation:Martin, Julien, Runge, M.C., Flewelling, L.J., Deutsch, C.J., and Landsberg, J.H., 2017, An expert elicitation process to project the frequency and magnitude of Florida manatee mortality events caused by red tide (Karenia brevis): U.S. Geological Survey Open-File Report 2017–1132, 17 p., https://doi.org/10.3133/ofr20171132.
We are grateful to the panel of experts and to the other team members who helped with the workshop: Catherine Langtimm, Cathy Beck, and Amy Teague of the U.S. Geological Survey; Martine de Wit, Leslie Ward-Geiger, Alina Corcoran, Kari Rood, Denise Boyd, and Jeffrey Hostetler of the Florida Fish and Wildlife Conservation Commission; and Sheri Barton of the Mote Marine Laboratory. Brittany Combs helped with some of the data processing. We also thank the following individuals who provided constructive reviews of drafts of this report: Catherine Langtimm, Daniel Slone, and James Lyons of the U.S. Geological Survey and Martine de Wit of the Florida Fish and Wildlife Conservation Commission.
Manatees and Red Tide .......................................................................................................................2Severity of Red-Tide Mortality Events ...............................................................................................2Uncertainties About the Future Effect of Red Tide on Manatees .................................................3Expert Judgment ...................................................................................................................................3
Methods...........................................................................................................................................................3Historical Frequency of RTMM Events .............................................................................................3Expert Elicitation Process ...................................................................................................................4Future Frequency of Manatee Mortality Events Due to Red Tide .................................................4Magnitude of the Effect of Red-Tide Events on Manatee Mortality Rate ...................................5Time Periods ..........................................................................................................................................6Probability Distributions and Aggregation of Estimates From Expert Elicitation .......................6
Results .............................................................................................................................................................6Historical Frequency of RTMM Events .............................................................................................6Conceptual Model.................................................................................................................................6Expert Elicitation Results .....................................................................................................................7
Frequency of RTMM Events .......................................................................................................7Magnitude of Red-Tide Mortality Events ...............................................................................12
1. Graphs showing probability distributions for the frequency of moderate red-tide-related manatee mortality events in the Southwest region under the three-class model .........................................................................................................................9
2. Graphs showing probability distribution for the relative magnitude of moderate red-tide-related manatee mortality events in the Northwest region under the three-class model .......................................................................................................................10
3. Graphs showing probability distributions for the frequency of moderate or intense red-tide-related manatee mortality events in three regions over two time periods .........................................................................................................................11
4. Graphs showing probability distributions for the relative magnitude of moderate and intense red-tide-related manatee mortality events in the Atlantic and Northwest regions over two time periods under the two- and three-class models .....................................................................................................................13
vi
Tables
1. Historical frequencies of red-tide-related manatee mortality events for each region in Florida, 1996–2015 ........................................................................................5
2. Forecast probabilities and relative magnitudes of red-tide-related manatee mortality events, two-class model, for each region ...............................................................7
3. Forecast probabilities and relative magnitudes of red-tide-related manatee mortality events, three-class model, for each region .............................................................8
4. Forecast probabilities of moderate or intense red-tide-related manatee mortality events for each region ..............................................................................................12
Conversion Factors
International System of Units to U.S. customary units
Multiply By To obtain
Length
kilometer (km) 0.6214 mile (mi)kilometer (km) 0.5400 mile, nautical (nmi)
Volume
liter (L) 0.2642 gallon (gal)
AbbreviationsAT Atlantic region
CBM Core Biological Model
CI confidence interval
FWC Florida Fish and Wildlife Conservation Commission
FWRI Florida Fish and Wildlife Research Institute
NW Northwest region
PDF probability density function
RTMM red-tide-related manatee mortality events
SD standard deviation
SW Southwest region
USGS U.S. Geological Survey
WGMMUME Working Group on Marine Mammal Unusual Mortality Events
An Expert Elicitation Process To Project the Frequency and Magnitude of Florida Manatee Mortality Events Caused by Red Tide (Karenia brevis)
By Julien Martin,1 Michael C. Runge,1 Leanne J. Flewelling,2 Charles J. Deutsch,2 and Jan H. Landsberg2
1U.S. Geological Survey.2Florida Fish and Wildlife Conservation Commission.
AbstractRed tides (blooms of the harmful alga Karenia brevis)
are one of the major sources of mortality for the Florida manatee (Trichechus manatus latirostris), especially in southwest Florida. It has been hypothesized that the frequency and severity of red tides may increase in the future because of global climate change and other factors. To improve our ecological forecast for the effects of red tides on manatee population dynamics and long-term persistence, we conducted a formal expert judgment process to estimate probability distributions for the frequency and relative magnitude of red-tide-related manatee mortality (RTMM) events over a 100-year time horizon in three of the four regions recognized as manatee management units in Florida. This information was used to update a population viability analysis for the Florida manatee (the Core Biological Model). We convened a panel of 12 experts in manatee biology or red-tide ecology; the panel met to frame, conduct, and discuss the elicitation. Each expert provided a best estimate and plausible low and high values (bounding a confidence level of 80 percent) for each parameter in each of three regions (Northwest, Southwest, and Atlantic) of the subspecies’ range (excluding the Upper St. Johns River region) for two time periods (0−40 and 41−100 years from present). We fitted probability distributions for each parameter, time period, and expert by using these three elicited values. We aggregated the parameter estimates elicited from individual experts and fitted a parametric distribution to the aggregated results.
Across regions, the experts expected the future frequency of RTMM events to be higher than historical levels, which is consistent with the hypothesis that global climate change (among other factors) may increase the frequency of red-tide
blooms. The experts articulated considerable uncertainty, however, about the future frequency of RTMM events. The historical frequency of moderate and intense RTMM (combined) in the Southwest region was 0.35 (80-percent confidence interval [CI]: 0.21−0.52), whereas the forecast probability was 0.48 (80-percent CI: 0.30−0.64) over a 40-year projected time horizon. Moderate and intense RTMM events are expected to continue to be most frequent in the Southwest region, to increase in mean frequency in the Northwest region (historical frequency of moderate and intense RTMM events [combined] in the Northwest region was 0, whereas the forecast probability was 0.12 [80-percent CI: 0.02−0.39] over a 40-year projected time horizon) and in the Atlantic region (historical frequency of moderate and intense RTMM events [combined] in the Atlantic region was 0.05 [80-percent CI: 0.005–0.18], whereas the forecast probability was 0.11 [80-percent CI: 0.03−0.25] over a 40-year projected time horizon), and to remain absent from the Upper St. Johns River region.
The impact of red-tide blooms on manatee mortality has been measured for the Southwest region but not for the Northwest and Atlantic regions, where such events have been rare. The expert panel predicted that the median magnitude of RTMM events in the Atlantic and Northwest regions will be much smaller than that in the Southwest; given the large uncertainties, however, they acknowledged the possibility that these events could be larger in their mortality impacts than in the Southwest region.
By its nature, forecasting requires expert judgment because it is impossible to have empirical evidence about the future. The large uncertainties in parameter estimates over a 100-year timeframe are to be expected and may also indicate that the training provided to panelists successfully minimized one common pitfall of expert judgment, that of overconfidence. This study has provided useful and needed inputs to the Florida manatee population viability analysis associated with an important and recurrent source of mortality from harmful algal blooms.
2 An Expert Elicitation Process To Project the Frequency and Magnitude of Florida Manatee Mortality Events Caused by Red Tide
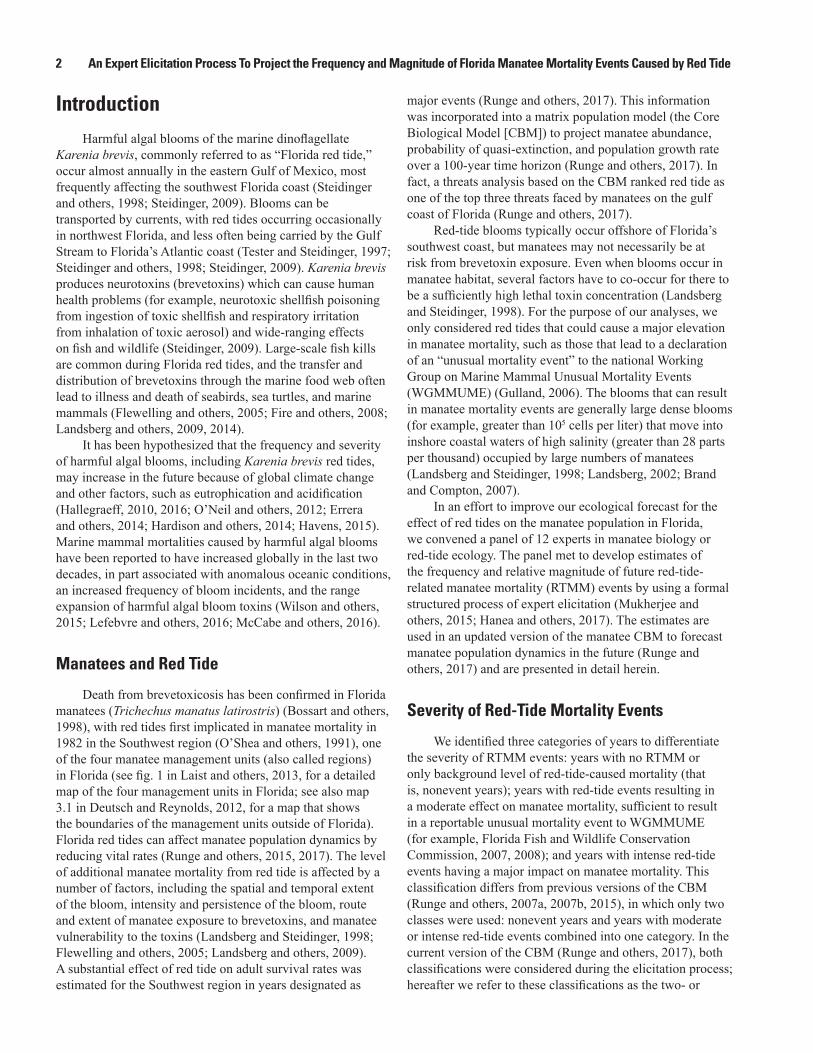
IntroductionHarmful algal blooms of the marine dinoflagellate
Karenia brevis, commonly referred to as “Florida red tide,” occur almost annually in the eastern Gulf of Mexico, most frequently affecting the southwest Florida coast (Steidinger and others, 1998; Steidinger, 2009). Blooms can be transported by currents, with red tides occurring occasionally in northwest Florida, and less often being carried by the Gulf Stream to Florida’s Atlantic coast (Tester and Steidinger, 1997; Steidinger and others, 1998; Steidinger, 2009). Karenia brevis produces neurotoxins (brevetoxins) which can cause human health problems (for example, neurotoxic shellfish poisoning from ingestion of toxic shellfish and respiratory irritation from inhalation of toxic aerosol) and wide-ranging effects on fish and wildlife (Steidinger, 2009). Large-scale fish kills are common during Florida red tides, and the transfer and distribution of brevetoxins through the marine food web often lead to illness and death of seabirds, sea turtles, and marine mammals (Flewelling and others, 2005; Fire and others, 2008; Landsberg and others, 2009, 2014).
It has been hypothesized that the frequency and severity of harmful algal blooms, including Karenia brevis red tides, may increase in the future because of global climate change and other factors, such as eutrophication and acidification (Hallegraeff, 2010, 2016; O’Neil and others, 2012; Errera and others, 2014; Hardison and others, 2014; Havens, 2015). Marine mammal mortalities caused by harmful algal blooms have been reported to have increased globally in the last two decades, in part associated with anomalous oceanic conditions, an increased frequency of bloom incidents, and the range expansion of harmful algal bloom toxins (Wilson and others, 2015; Lefebvre and others, 2016; McCabe and others, 2016).
Manatees and Red Tide
Death from brevetoxicosis has been confirmed in Florida manatees (Trichechus manatus latirostris) (Bossart and others, 1998), with red tides first implicated in manatee mortality in 1982 in the Southwest region (O’Shea and others, 1991), one of the four manatee management units (also called regions) in Florida (see fig. 1 in Laist and others, 2013, for a detailed map of the four management units in Florida; see also map 3.1 in Deutsch and Reynolds, 2012, for a map that shows the boundaries of the management units outside of Florida). Florida red tides can affect manatee population dynamics by reducing vital rates (Runge and others, 2015, 2017). The level of additional manatee mortality from red tide is affected by a number of factors, including the spatial and temporal extent of the bloom, intensity and persistence of the bloom, route and extent of manatee exposure to brevetoxins, and manatee vulnerability to the toxins (Landsberg and Steidinger, 1998; Flewelling and others, 2005; Landsberg and others, 2009). A substantial effect of red tide on adult survival rates was estimated for the Southwest region in years designated as
major events (Runge and others, 2017). This information was incorporated into a matrix population model (the Core Biological Model [CBM]) to project manatee abundance, probability of quasi-extinction, and population growth rate over a 100-year time horizon (Runge and others, 2017). In fact, a threats analysis based on the CBM ranked red tide as one of the top three threats faced by manatees on the gulf coast of Florida (Runge and others, 2017).
Red-tide blooms typically occur offshore of Florida’s southwest coast, but manatees may not necessarily be at risk from brevetoxin exposure. Even when blooms occur in manatee habitat, several factors have to co-occur for there to be a sufficiently high lethal toxin concentration (Landsberg and Steidinger, 1998). For the purpose of our analyses, we only considered red tides that could cause a major elevation in manatee mortality, such as those that lead to a declaration of an “unusual mortality event” to the national Working Group on Marine Mammal Unusual Mortality Events (WGMMUME) (Gulland, 2006). The blooms that can result in manatee mortality events are generally large dense blooms (for example, greater than 105 cells per liter) that move into inshore coastal waters of high salinity (greater than 28 parts per thousand) occupied by large numbers of manatees (Landsberg and Steidinger, 1998; Landsberg, 2002; Brand and Compton, 2007).
In an effort to improve our ecological forecast for the effect of red tides on the manatee population in Florida, we convened a panel of 12 experts in manatee biology or red-tide ecology. The panel met to develop estimates of the frequency and relative magnitude of future red-tide-related manatee mortality (RTMM) events by using a formal structured process of expert elicitation (Mukherjee and others, 2015; Hanea and others, 2017). The estimates are used in an updated version of the manatee CBM to forecast manatee population dynamics in the future (Runge and others, 2017) and are presented in detail herein.
Severity of Red-Tide Mortality Events
We identified three categories of years to differentiate the severity of RTMM events: years with no RTMM or only background level of red-tide-caused mortality (that is, nonevent years); years with red-tide events resulting in a moderate effect on manatee mortality, sufficient to result in a reportable unusual mortality event to WGMMUME (for example, Florida Fish and Wildlife Conservation Commission, 2007, 2008); and years with intense red-tide events having a major impact on manatee mortality. This classification differs from previous versions of the CBM (Runge and others, 2007a, 2007b, 2015), in which only two classes were used: nonevent years and years with moderate or intense red-tide events combined into one category. In the current version of the CBM (Runge and others, 2017), both classifications were considered during the elicitation process; hereafter we refer to these classifications as the two- or
Methods 3
three-class hypotheses. Note that, in both cases, the nonevent class includes background levels of mortality caused by red tide, which may not be negligible.
Uncertainties About the Future Effect of Red Tide on Manatees
One of the structural questions in the CBM that we had to address was whether the variation in RTMM among years is best captured with two classes (nonevent years, RTMM years) or three classes (nonevent years, moderate RTMM years, intense RTMM years). The two-class hypothesis assumes that RTMM events in 1996 and 2013 were within the normal range of variation of years with red-tide events and that the large number of red-tide-related manatee deaths in 2013 (276 confirmed or suspected) in the Southwest region can partly be explained by an increased population size (Florida Fish and Wildlife Conservation Commission, 2013). The three-class hypothesis assumes that the effects of red tide on manatee mortality in 1996 and 2013 were substantially greater than during the other red-tide years and therefore warrant a separate category of event, despite being relatively rare. For example, factors that likely contribute to intense RTMM events include a longer persistence of the bloom over a larger area of manatee habitat and a greater likelihood that individual manatees would be exposed to lethal concentrations of brevetoxin. We developed estimates of the effects of red tide for each of those cases and decided to consider both hypotheses in our population model.
A second important issue pertains to projections of the frequency of RTMM events into the future. One approach was to use the data on recent historical frequencies by region and then to assume that these observed frequencies represent unbiased estimates of actual long-term frequencies, which will not change over the next 100 years. An alternative approach was to use expert elicitation to estimate frequencies (and associated uncertainties) over the coming century and to assess whether those may change during that time period. We combined the alternative resolutions to these two questions into four scenarios of projected frequencies of RTMM events: (i) two classes, historical frequencies; (ii) three classes, historical frequencies; (iii) two classes, forecast frequencies; and (iv) three classes, forecast frequencies.
Expert Judgment
Ideally, we would have obtained the parameter estimates from reliable, empirical, mechanistic, mathematical models that consider biological and physical processes to predict red tides and their effects on manatee mortality. Because such complex models are not currently available, we used an expert judgment process (Morgan, 2014; Lyon and others, 2015; Sutherland and Burgman, 2015). Expert judgment techniques can be used to elicit probability distributions from a group of experts when information about the parameters of interest is
sparse or nonexistent (Morgan, 2014; Lyon and others, 2015). Formal expert judgment methods use a structured approach to elicit parameter estimates from experts while accounting for uncertainty, reducing cognitive biases, and integrating the best available scientific information. Expert judgment is used extensively for decision making in many settings, such as health assessment, evaluation of the impacts of global climate change, engineering, and natural resource management (Morgan, 2014; Lyon and others, 2015; Sutherland and Burgman, 2015). The baseline scenario of the CBM used the expert-elicited estimates of future frequency and magnitude of RTMM events because most experts believed that these estimates represented better reflections of the future than did the estimates based on historical patterns. Our expert elicitation process accounts for uncertainty within and among experts. We also present a novel approach to aggregating information from experts that favored competing hypotheses about the effect of red tide on manatee mortality.
Methods
Historical Frequency of RTMM Events
Before conducting the expert elicitation, we evaluated historical patterns of RTMM events. Scientists from three organizations—U.S. Geological Survey (USGS), Florida Fish and Wildlife Conservation Commission’s Fish and Wildlife Research Institute (FWC/FWRI), and Mote Marine Laboratory—developed annual covariates indicative of potential manatee exposure to red-tide toxins to model annual adult survival rates (Langtimm and others, written commun., 2017). Based on patterns of bloom characteristics that resulted in large numbers of manatee deaths (Landsberg and others, 2009), data in the FWC/FWRI Harmful Algal Bloom Database were used to assess the spatial and temporal extent, seasonal timing, and intensity of red-tide blooms and to classify each year in the historical record from 1996 to 2014. They identified 1996, 2002, 2003, 2005, 2006, 2012, and 2013 as meeting the criteria for an expected lethal exposure that could result in lower regional survival. Information was deemed insufficient to rank years by severity. Mean annual adult survival during red-tide years, excluding 1996 and 2013 where data were insufficient to estimate survival, was reduced by 0.018 (standard error = 0.005) compared to baseline years (Langtimm and others, 2016; Runge and others, 2017; Langtimm and others, written commun., 2017). A newly developed analytical method based on carcass counts (the fraction-of-mortality analysis in Runge and others, 2017; Hostetler and others, written commun., 2017) was used to determine whether the two years (1996, 2013) with unprecedented numbers of red-tide-related carcasses did, in fact, have substantially higher levels of additional red-tide-related mortality than the other red-tide years did. Estimates of
4 An Expert Elicitation Process To Project the Frequency and Magnitude of Florida Manatee Mortality Events Caused by Red Tide
additional annual adult mortality in the Southwest region were 0.02 (standard deviation = 0.002) for five moderate RTMM events that took place in 2002, 2003, 2005, 2006, and 2012 and 0.07 (standard deviation = 0.008) for intense events that occurred in 1996 and 2013 (Runge and others, 2017; Hostetler and others, written commun., 2017).
On the basis of the criteria for classifying RTMM years, we estimated the historical frequencies (1996–2015) of moderate and intense RTMM events for three of the four manatee management units in Florida: Atlantic (AT), Southwest (SW), and Northwest (NW). The frequencies of intense and moderate RTMM events for each region were calculated from the proportion of such events in the 20-year time series considered. We calculated the 80- and 95-percent confidence intervals (CIs) by using the Pearson-Klopper method (also known as “exact” method) implemented with the R package “binom” using R version 3.2.4 (Dorai-Raij, 2015; R Core Team, 2016). We assumed that RTMM events do not occur in the fourth manatee management unit in Florida, the Upper St. Johns River region, because the water bodies therein have low salinity and are therefore inhospitable to marine algae such as Karenia brevis.
Expert Elicitation Process
We assembled a panel of 12 scientists (from FWC/FWRI’s Harmful Algal Bloom group and Marine Mammal program, USGS Sirenia Project, and Mote Marine Laboratory’s Marine Mammal Program) with expertise in manatee biology and health or red-tide ecology. We convened four meetings with this group in January 2016. The four steps of the Investigate Discuss Estimate Aggregate (IDEA) protocol were used to guide the process: (1) investigation of the data and available information; (2) discussion of data interpretation, perspectives, and potential mechanisms underlying RTMM events; (3) elicitation of parameter estimates; and (4) aggregation of individual estimates (Hanea and others, 2017). During the first two meetings, we discussed the important causal processes affecting RTMM, considering historical records of RTMM events, the available literature on the subject, and the knowledge of the participants. The experts developed a conceptual model and considered factors (for example, eutrophication, sea surface temperature, manatee warm-water habitat) that could potentially influence red tide and manatee distribution and their co-occurrence, as well as how these factors may change over the next century.
Prior to beginning the elicitation stage of the process, we provided background information on cognitive biases such as anchoring and overconfidence to emphasize the need for formal methods of elicitation (Sutherland and Burgman, 2015). We then trained the experts in the methods we were to employ, conducting sample elicitations on quantities that were unknown to the participants but known to the facilitator (for example, rate of sea level rise).
The last two meetings focused on the formal expert elicitation process for obtaining parameter values of the frequency and magnitude of RTMM events in each region. We applied a three-point elicitation method to reduce issues associated with overconfidence (Mukherjee and others, 2015; Hanea and others, 2017). For each parameter to be elicited, we asked the participants to provide a low bound, a high bound, and a best value for each parameter such that they were 80 percent confident that the true value was between the two bounds. The “best” estimate was taken to represent the median in our analysis. We conducted two rounds of elicitation. In the first round, participants provided their values independently. The facilitator of the meeting then provided an anonymous summary of the values. The participants then discussed the rationale behind their estimates and were offered the opportunity to revise their values during a second round. We emphasized that the goal of the second round was not to reach a consensus but to reduce errors associated with potential miscommunication (that is, linguistic uncertainty) and to further clarify the mechanisms of manatee mortality associated with red tides (Sutherland and Burgman, 2015). This approach differs from the more traditional use of the Delphi method, in which experts are encouraged to reach a consensus (Morgan, 2014; Johnson and others, 2017). One limitation of seeking consensus is that it may result from group pressure and, therefore, may mischaracterize the actual state of knowledge (Woudenberg, 1991; Morgan, 2014; Sutherland and Burgman, 2015, Johnson and others, 2017).
As explained in the introduction, we considered two hypotheses about how best to categorize years: one that represented RTMM with two classes (nonevent years, red-tide mortality event years) and an alternate hypothesis that represented RTMM with three classes (nonevent, moderate RTMM, intense RTMM). The experts were asked to indicate which hypothesis was most plausible to them. The majority of the participants chose the three-class hypothesis (8 out of 12 participants for the Atlantic and Northwest regions; 9 out of 12 for the Southwest region), whereas the rest favored the two-class hypothesis. We fitted distributions for the two groups separately.
Future Frequency of Manatee Mortality Events Due to Red Tide
We asked the panelists to provide us with elicited values for the frequency of RTMM events in each of the three geographic regions over the next 100 years. We provided them with the frequency estimates based on historical data (table 1). They were also allowed to use any information available on this topic. The participants discussed some of the processes that could affect red-tide frequency before the elicitation. For instance, they considered the hypothesis that increased sea surface temperatures due to climate change will lead to an increase in frequency and severity of red-tide blooms, and therefore RTMM events, compared to the historical frequency.
Methods 5
Table 1. Historical frequencies of red-tide-related manatee mortality events for each region in Florida, 1996–2015.
[The frequencies of intense and moderate red-tide-related manatee mortality events for each region were calculated from the proportion of such events in the 20-year time series considered. The 80- and 95-percent confidence intervals were calculated by using the Pearson-Klopper method (also known as “exact” method) implemented with the R package “binom” (Dorai-Raij, 2015; R Core Team, 2016). CI, confidence interval; —, not applicable]
Region Intensity Mean 80-percent CI 95-percent CI
Atlantic
Intense 0 — —
Moderate 0.050 0.005–0.181 0.001–0.249
Either 0.050 0.005–0.181 0.001–0.249
Northwest
Intense 0 — —
Moderate 0 — —
Either 0 — —
Southwest
Intense 0.100 0.027–0.244 0.012–0.317
Moderate 0.250 0.127–0.415 0.087–0.491
Either 0.350 0.207–0.518 0.154–0.592
Magnitude of the Effect of Red-Tide Events on Manatee Mortality Rate
Another parameter of interest is the magnitude of the effect of red tides on manatee mortality in each management unit. In the Southwest region, this parameter was based on empirical data. The carcass-based fraction-of-mortality analysis provided preliminary estimates of 0.02 and 0.10 additional mortality from RTMM events for subadults and adults (combined) in moderate and intense red-tide years, respectively, whereas the effects on calves were estimated to be about twice those rates; note that these additional mortality estimates have been updated since the workshop (Runge and others, 2017; Hostetler and others, written commun., 2017). An independent sight-resight approach using the Barker robust design model provided a similar estimate for additional adult mortality (0.018) due to moderate RTMM events in the Southwest region (Langtimm and others, written commun., 2017). Estimates for intense events based on the Barker robust design model are currently not available. Estimates for other management units were not available or were not considered reliable (for example, in the Atlantic region only one RTMM event was recorded in our dataset).
To estimate the magnitude of the effect for the Northwest and Atlantic regions, we used an expert elicitation process. We elicited the ratio of expected average additional mortality due to a red-tide event in a region relative to the same measure of mortality in the Southwest region:
where R[region, severity] is the ratio to be elicited for the region
other than the Southwest (that is, Atlantic or Northwest) for RTMM events (with the severity level corresponding to either moderate or intense);
M[region, severity] is the mortality for the region other than the Southwest (that is, Atlantic or Northwest) for RTMM events (with the severity level corresponding to either moderate or intense); and
M[Southwest, severity] is the mortality for the Southwest for RTMM events (with the severity level corresponding to either moderate or intense).
As an example, if the expert thought that the effect of a moderate event on mortality in another region would be half that observed in the Southwest region, then the ratio would be 0.5 (alternatively, it would be 2 if the mortality was twice as high as in the Southwest region). Note that these mortality impacts are conditional on the occurrence of a mortality event; a region may have a low frequency of occurrence but a high magnitude of impact on mortality when it does occur. We assumed that the magnitude of RTMM events would not change in the Southwest region.
6 An Expert Elicitation Process To Project the Frequency and Magnitude of Florida Manatee Mortality Events Caused by Red Tide
Time Periods
The experts proposed that we subdivide the forecast time horizon into two time periods: period 1, lasting about 40 years (from 2011 to 2050), and period 2, lasting about 60 years (from 2051 to 2110); 2050 coincides roughly with the projected loss of warm-water effluents at most powerplants (Runge and others, 2017; Runge and Deutsch, written commun., 2017). The rationale for this distinction was that these changes in operation would affect manatee winter distribution and spring dispersal and, therefore, their potential exposure to red tides. One hypothesis that was discussed is that when manatees frequent the thermal discharges of powerplants in low-salinity or freshwater habitats, they will not typically be exposed to red tide because the distribution of Karenia brevis is constrained by salinity; blooms are usually absent in waters below 28 parts per thousand salinity and therefore are not typically found in manatee warm-water habitats (Landsberg and Steidinger, 1998). This separation in time period applied to both the magnitude and frequency parameters.
Probability Distributions and Aggregation of Estimates From Expert Elicitation
For each parameter, we created a probability distribution that described the uncertainty within and across experts from which we could generate values in the manatee model simulation (with the CBM, Runge and others, 2017). We built these probability distributions in two steps: first, we estimated a probability distribution that described the elicited quantiles from each expert separately; second, we aggregated these distributions across experts.
Separately for each expert and each parameter, we fitted probability distributions to the information from the three-point elicitation by assuming that the elicited points represented quantiles of a distribution and finding the best-fit distribution to those quantiles. We assumed a beta distribution for RTMM event frequency (two-class case), a Dirichlet distribution for RTMM event frequency (three-class case), and a lognormal distribution for red-tide magnitude parameters. In most cases, the three values elicited by the experts for each parameter were considered to be the 10th percentile, 50th percentile or median, and 90th percentile; however, in the cases where zero was specified as a lower bound, we considered the high value as the 80th percentile. The distributions were fitted by using MATLAB (MathWorks, Inc., version R2010b).
To aggregate across experts for a particular parameter, we averaged the probability density functions (PDFs) across experts and then found the parameters of a single beta, Dirichlet, or lognormal distribution that best fit the average PDFs, as measured by the Kullback-Leibler distance (Kullback and Leibler, 1951).
To aggregate across hypotheses (the two- and three-class hypotheses), we formed a weighted probability distribution function by weighting the two component PDFs according to the number of experts who supported each hypothesis.
Some of the distributions for the aggregated estimates for the magnitude parameters led to extreme values with unrealistically high probabilities. This artifact of the lognormal distribution was addressed by truncating the distribution.
Results
Historical Frequency of RTMM Events
The estimates of historical frequencies of RTMM events over a recent 20-year period (1996–2015) are summarized in table 1. Seven years (frequency of 0.35) have been identified as meeting the environmental conditions that might induce elevated manatee mortality from red tide in the Southwest region during this timeframe. No RTMM events are known to have occurred in the Northwest region, and only one (in 2007–8) occurred in the Atlantic region (Fire and others, 2015). From the historical record there were only two reports of intense RTMM events, and both occurred in the Southwest region (frequency of 0.10). The CIs associated with these frequency estimates were rather large (table 1).
Conceptual Model
The experts identified several key factors that may drive the distribution and density of red tide and manatees, with an important consideration being the spatiotemporal overlap of the two. For manatees, the distributions of forage resources (that is, seagrass) and thermal refugia (for example, springs and powerplant effluent areas) were considered to be primary drivers. The seasonal timing of red-tide bloom movement inshore is also a significant factor. Because Karenia brevis blooms generally form offshore in the Gulf of Mexico in the fall and can be transported inshore and persist over winter through spring, RTMM events are most likely to occur in the fall, winter, and early spring on the southwest coast (Landsberg and Steidinger, 1998; Steidinger, 2009). Winter and spring also correspond to the dry season in Florida (Southeast Regional Climate Center, 2017), when freshwater flows generally decline and coastal salinities rise, increasing the opportunity for Karenia brevis blooms to move into the inshore habitats occupied by manatees. Occasionally, red tide is entrained in the Gulf Stream and transported to the east coast, which potentially puts manatees in the Atlantic region at risk (Fire and others, 2015).
Results 7
Expert Elicitation Results
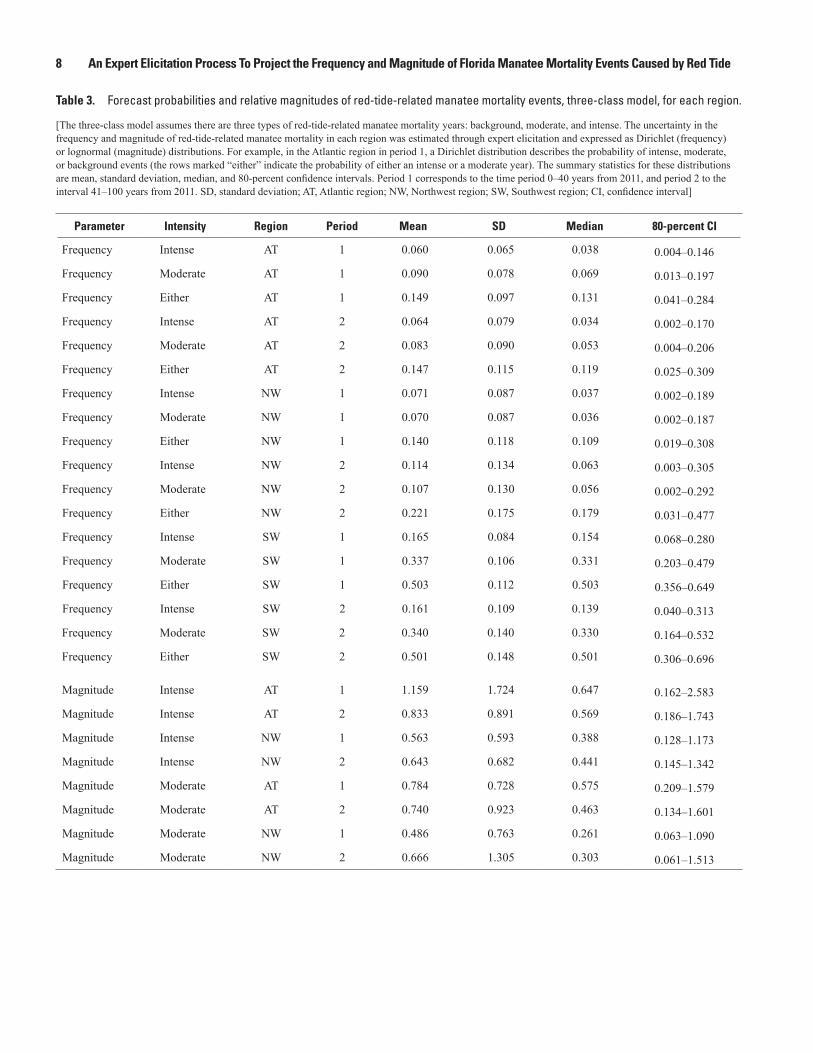
We fitted probability distributions for 30 parameters (18 frequency and 12 magnitude parameters) and summarized key descriptive statistics (mean, standard deviation, median, 80-percent CI) for the aggregated distributions (tables 2 and 3). To illustrate the variation in estimates among panelists, and how that information was aggregated into an overall distribution, figure 1 shows the frequency of a moderate RTMM event for the Southwest region for the group that favored the three-class hypothesis. Figure 2 shows the relative magnitude of moderate RTMM events in the Northwest region under the three-class model. Both figures emphasize the large uncertainty within and among experts for each parameter considered.
Frequency of RTMM EventsThe estimated frequency of RTMM events (moderate
or intense) over the next 40 and 100 years was judged to be greatest in the Southwest region, continuing the historical pattern (tables 2 and 3, fig. 3). The probability of either a moderate or intense RTMM event occurring is shown in table 4 for each region, including the combined values across two- and three-class groups. These values are most easily visualized as probability distributions in figure 3. The relative ranking of frequency in the Atlantic and Northwest regions differed slightly between the two groups of experts for period 1, but the CIs overlapped considerably, and the median estimates for both regions were substantially lower than for the Southwest
region (table 4, fig. 3). In the Northwest region, manatee distribution is strongly associated with freshwater rivers and their estuarine mouths, so a red-tide bloom is less likely to enter or to persist in those inshore areas with lower salinities. The Atlantic region covers several hundred kilometers of intracoastal waters that are separated from the ocean by barrier islands; not only would a Karenia bloom have to be entrained from the Gulf of Mexico to Florida’s east coast, but it would also need to make its way through a limited number of inlets to reach most manatee habitats. We know that this type of event has occurred (Fire and others, 2015), but the likelihood was deemed to be quite low.
The means and medians for the probability distributions of estimated RTMM event frequencies were generally somewhat greater than the historical frequencies (compare results in table 1 to those in table 4). The difference was particularly pronounced for the estimates in the Southwest region by the group that favored the three-class hypothesis: the median forecast for moderate or intense mortality (“either” category in table 3) was 0.50 compared to 0.35 in the recent 20-year period (tables 1, 3, and 4). The median frequency estimates for some participants were greater for period 2 than for period 1, consistent with the hypothesis that changes associated with climate change would lead to an increase in frequency of red-tide events. This direction of temporal change was counteracted, however, by other participants whose estimates were greater for period 1 than for period 2. The rationale for this projected decrease in frequency by some of the experts was that changes in operation of powerplants would lead to a shift and increased
Table 2. Forecast probabilities and relative magnitudes of red-tide-related manatee mortality events, two-class model, for each region.
[The uncertainty in the probability and magnitude of red-tide-related manatee mortality in each region was estimated through expert elicitation and expressed as beta (frequency) or lognormal (magnitude) distributions. The summary statistics for these distributions are mean, standard deviation, median, and 80-percent confidence intervals. Period 1 corresponds to the time period 0–40 years from 2011, and period 2 to the interval 41–100 years from 2011. SD, standard devia-tion; AT, Atlantic region; NW, Northwest region; SW, Southwest region; CI, confidence interval]
Parameter Region Period Mean SD Median 80-percent CI
Frequency AT 1 0.081 0.062 0.065 0.016–0.166
Frequency AT 2 0.059 0.032 0.054 0.023–0.103
Frequency NW 1 0.219 0.213 0.150 0.010–0.546
Frequency NW 2 0.203 0.096 0.191 0.089–0.334
Frequency SW 1 0.389 0.157 0.380 0.188–0.603
Frequency SW 2 0.376 0.165 0.365 0.167–0.602
Magnitude AT 1 1.848 5.989 0.545 0.074–4.039
Magnitude AT 2 2.137 6.241 0.693 0.101–4.743
Magnitude NW 1 0.699 1.852 0.247 0.039–1.567
Magnitude NW 2 1.113 3.353 0.351 0.050–2.460
8 An Expert Elicitation Process To Project the Frequency and Magnitude of Florida Manatee Mortality Events Caused by Red Tide
Table 3. Forecast probabilities and relative magnitudes of red-tide-related manatee mortality events, three-class model, for each region.
[The three-class model assumes there are three types of red-tide-related manatee mortality years: background, moderate, and intense. The uncertainty in the frequency and magnitude of red-tide-related manatee mortality in each region was estimated through expert elicitation and expressed as Dirichlet (frequency) or lognormal (magnitude) distributions. For example, in the Atlantic region in period 1, a Dirichlet distribution describes the probability of intense, moderate, or background events (the rows marked “either” indicate the probability of either an intense or a moderate year). The summary statistics for these distributions are mean, standard deviation, median, and 80-percent confidence intervals. Period 1 corresponds to the time period 0–40 years from 2011, and period 2 to the interval 41–100 years from 2011. SD, standard deviation; AT, Atlantic region; NW, Northwest region; SW, Southwest region; CI, confidence interval]
Parameter Intensity Region Period Mean SD Median 80-percent CI
Frequency Intense AT 1 0.060 0.065 0.038 0.004–0.146
Frequency Moderate AT 1 0.090 0.078 0.069 0.013–0.197
Frequency Either AT 1 0.149 0.097 0.131 0.041–0.284
Frequency Intense AT 2 0.064 0.079 0.034 0.002–0.170
Frequency Moderate AT 2 0.083 0.090 0.053 0.004–0.206
Frequency Either AT 2 0.147 0.115 0.119 0.025–0.309
Frequency Intense NW 1 0.071 0.087 0.037 0.002–0.189
Frequency Moderate NW 1 0.070 0.087 0.036 0.002–0.187
Frequency Either NW 1 0.140 0.118 0.109 0.019–0.308
Frequency Intense NW 2 0.114 0.134 0.063 0.003–0.305
Frequency Moderate NW 2 0.107 0.130 0.056 0.002–0.292
Frequency Either NW 2 0.221 0.175 0.179 0.031–0.477
Frequency Intense SW 1 0.165 0.084 0.154 0.068–0.280
Frequency Moderate SW 1 0.337 0.106 0.331 0.203–0.479
Frequency Either SW 1 0.503 0.112 0.503 0.356–0.649
Frequency Intense SW 2 0.161 0.109 0.139 0.040–0.313
Frequency Moderate SW 2 0.340 0.140 0.330 0.164–0.532
Frequency Either SW 2 0.501 0.148 0.501 0.306–0.696
Magnitude Intense AT 1 1.159 1.724 0.647 0.162–2.583
Magnitude Intense AT 2 0.833 0.891 0.569 0.186–1.743
A. Years 0–40, individual experts B. Years 41–100, individual experts
C. Years 0–40, aggregated D. Years 41–100, aggregated
Figure 1. Probability distributions for the frequency of moderate red-tide-related manatee mortality events in the Southwest region under the three-class model. A, Time period 0–40 years from present, individual expert responses. B, Time period 41–100 years from present, individual expert responses. C, Time period 0–40 years from present, aggregated results. D, Time period 41–100 years from present, aggregated results. In the individual results (A and B), the colored lines represent individual experts. In the aggregated results (C and D), the blue lines show the distributions averaged across experts; the green lines show the beta distribution that best fit the average distribution.
10 An Expert Elicitation Process To Project the Frequency and Magnitude of Florida Manatee Mortality Events Caused by Red Tide
0 0.5 1.0 1.5 0 0.5 1.0 1.5
0 0.5 1.0 1.5 0 0.5 1.0 1.5
0
2
4
6
8
10
0
1
2
3
4
0
1
2
3
0
0.5
1.0
1.5
2.0
2.5
A. Years 0–40, individual experts B. Years 41–100, individual experts
C. Years 0–40, aggregated D. Years 41–100, aggregated
Prob
abili
ty d
ensi
ty
Relative magnitude of moderate red-tide mortality events
Figure 2. Probability distribution for the relative magnitude of moderate red-tide-related manatee mortality events in the Northwest region under the three-class model. The relative magnitude is the ratio of the additional mortality associated with moderate red-tide events in the Northwest region to the corresponding mortality in the Southwest region. A, Time period 0–40 years from present, individual expert responses. B, Time period 41–100 years from present, individual expert responses. C, Time period 0–40 years from present, aggregated results. D, Time period 41–100 years from present, aggregated results. In the individual results (A and B), the colored lines denote individual experts. In the aggregated results (C and D), the blue lines show the distributions averaged across experts; the green lines show the lognormal distribution that best fit the average distribution. The right tails of the distributions are truncated for presentation purposes.
Results 11
0 0.5 1.0 0 0.5 1.0
0 0.5 1.0 0 0.5 1.0
0 0.5 1.0 0 0.5 1.0
0
5
10
0
2
4
6
8
0
2
4
0
5
10
0
2
4
6
8
0
2
4
Prob
abili
ty d
ensi
ty
AT
NW
SW
Frequency of moderate or intense red-tide mortality events
Years 0–40 Years 41–100
Figure 3. Probability distributions for the frequency of moderate or intense red-tide-related manatee mortality events in three regions over two time periods (0–40 and 41–100 years). The fitted probability density functions are shown for the experts who supported the two-class hypothesis (blue lines), the experts who supported the three-class hypothesis (green lines), and the weighted average of the two groups (thick black lines). AT, Atlantic region; NW, Northwest region; SW, Southwest region.
12 An Expert Elicitation Process To Project the Frequency and Magnitude of Florida Manatee Mortality Events Caused by Red Tide
Table 4. Forecast probabilities of moderate or intense red-tide-related manatee mortality events for each region.
[The median probability of either a moderate or an intense red-tide-related manatee mortality event is shown with the 80-percent confidence interval. The two-class and three-class models were combined by drawing from each according to the number of experts that favored the corresponding hypothesis (shown as “weight” in the table). For reference, the historical frequencies in each region are Atlantic, 0.050 (0.005–0.181); Northwest, 0.00; Southwest, 0.350 (0.207–0.518)]
dispersion in manatee winter distribution during period 2 that would reduce the risk of spatial overlap with red tide (for example, manatees moving to secondary warm-water refuges with a lower risk of exposure to red tide). Experts considered the second hypothesis to be most relevant in the Southwest and Atlantic regions, where large numbers of manatees use powerplant effluent areas for warmth, and less so in the Northwest region, where they primarily rely on springs. Overall, the aggregated distributions of the probability of either moderate or intense events overlapped greatly for the two time periods (table 4, fig. 3).
Magnitude of Red-Tide Mortality Events
The magnitude of RTMM events in a region was elicited as a ratio relative to estimated mortality rates in the Southwest region; a magnitude of less than 1 indicated that the participants anticipated lower rates of red-tide events in that region compared to the Southwest. The experts considered that the same hypotheses—regarding climate change and shift in manatee distributions due to loss of thermal effluents from powerplants—would apply here as for the frequency parameters. The magnitude of manatee mortality will be affected by the degree of manatee concentration during an inshore red-tide bloom; if manatees are more clustered during the winter because there are fewer warm-water refuges, for example, the probability of a RTMM event may be reduced, but the effect of such an event, if it occurs, would be elevated.
Elicited median mortality effects in the Northwest and Atlantic regions were much less than in the Southwest region (that is, ratios of less than 1) in both time periods (tables 2 and 3), as clearly illustrated in figures 2 and 4. Where and when a Karenia bloom penetrates the intracoastal waters of the Atlantic region would likely determine how large of a mortality effect it might exert on the manatee population. Given that outside of the winter season manatees are distributed across more than 700 kilometers of Florida’s Atlantic coastline (from the Georgia border to Florida Bay)—plus much more coastline in States north of Florida—a red-tide bloom may not affect a large segment of the population unless it enters high-use manatee habitats. Several experts considered the possibility that the magnitude of the effect could be greater in the Atlantic region than in the Southwest region because of the possibility of red tide co-occurring with large aggregations of manatees; for example, in the northern Indian River Lagoon during the spring migration period (Deutsch and others, 2003; Martin and others, 2015) or in southeastern Florida during a winter cold period. The patterns for the medians among regions also suggested that the magnitude of the effect would be greater in the Atlantic region than in the Northwest region (tables 2 and 3). In all cases the uncertainty was very large; in fact, the 80-percent CI for all parameters suggested that the magnitude of the effect in the Atlantic and Northwest regions could possibly be much higher or much lower than in the Southwest region (tables 2 and 3). Likewise, the probability distributions overlapped greatly between the two time periods (fig. 4).
Discussion 13
0 0.5 1.0 1.5 0 0.5 1.0 1.50
2
0
2
0 0.5 1.0 1.5 0 0.5 1.0 1.50
2
0
2
0 0.5 1.0 1.5 0 0.5 1.0 1.50
2
0
2
0 0.5 1.0 1.5 0 0.5 1.0 1.50
2
0
2
0 0.5 1.0 1.5 0 0.5 1.0 1.50
2
0
2
0 0.5 1.0 1.5 0 0.5 1.0 1.50
2
0
2
AT
NW
Prob
abili
ty d
ensi
ty
Relative magnitude of red-tide mortality events
Two-class, combined
Three-class, moderate
Three-class, intense
Two-class, combined
Three-class, moderate
Three-class, intense
0–40 years 41–100 years
Figure 4. Probability distributions for the relative magnitude of moderate and intense red-tide-related manatee mortality events in the Atlantic and Northwest regions over two time periods (0–40 and 41–100 years) under the two- and three-class models. The relative magnitude is the ratio of the additional mortality associated with red-tide events in the Atlantic or Northwest region to the corresponding mortality in the Southwest region. The plots show the lognormal distribution that best fit the average distribution across experts (thus corresponding to the green lines in fig. 2C and fig. 2D). The right tails of the distributions are truncated for presentation purposes. AT, Atlantic region; NW, Northwest region.
Discussion
Based on results aggregated across the expert panel, the average frequency of RTMM events in the future is expected to be higher than in the past, although the CIs were large for both the elicited and historical estimates for most parameters (tables 1−4). Several experts thought that the frequency of RTMM events was likely to increase from period 1 to period 2, in part as a result of rising sea surface temperatures, continuing anthropogenic input of nutrients from stormwater discharges, and other nonpoint source pollution into coastal waters as the human population grows. Similarly, some experts judged that the magnitude of the effect of red tide
could increase from period 1 to period 2 in the Atlantic and Northwest regions. The justification for such an increase in magnitude for the Atlantic region stemmed from the expectation that the winter range of manatees would be more restricted after loss of warm-water effluents from powerplants, with a greater proportion of manatees in that region found in the southeastern waters during winter. Nevertheless, the prediction of an increase in frequency and magnitude of RTMM events during period 2 was not uniformly supported by the experts. For instance, several participants considered the possibility of a decrease in both frequency and magnitude due to a shift in distribution and greater winter dispersion of manatees after the elimination of thermal discharges from powerplants. The hypotheses about the effects of climate
14 An Expert Elicitation Process To Project the Frequency and Magnitude of Florida Manatee Mortality Events Caused by Red Tide
change or of changes in the operation of powerplants are not mutually exclusive, and therefore some experts integrated these counteracting effects into their estimates. Experts also considered other factors affecting environmental conditions. For example, the anticipated lower flow at many springs could facilitate the intrusion of red tide into spring-fed waterways and coastal areas that support manatee winter aggregations; this phenomenon would be particularly relevant to areas rich in springs, such as the Northwest region. Overall, the probability distributions for periods 1 and 2 for both parameters were wide, and the conflicting predictions among the participants reflected the large uncertainty associated with complex processes that link red tides to manatee mortality. Experts from the three-class group (three classes of RTMM events) estimated an overall greater frequency of RTMM events in the Southwest and Atlantic regions than did experts from the two-class group (table 4, fig. 3). This finding may be coincidental, but it could possibly be explained by the fact that participants from the three-class group had to elicit the frequencies separately for moderate and intense events. The confidence limits of the aggregated distributions were wide.
Predicting the effects of RTMM events on the Florida manatee population over a century is challenging, especially given the complexity of the processes involved and the level of uncertainty to be expected over such a long time horizon. This was reflected in the large uncertainties associated with the distributions for the aggregated information. The baseline scenario in the CBM—that is, the one that authors felt best represented the available scientific information about the status of the Florida subspecies and the threats it faces—used the elicited estimates of RTMM frequency and magnitude parameters combined over the two groups (that is, classes of hypotheses).
In previous versions of the CBM, the occurrence of RTMM events was treated as independent among regions. During the elicitation meetings, some experts indicated that there is likely to be some dependence. This stems from the historical observation that blooms have not occurred in the Northwest or Atlantic region without a preceding or co-occurring bloom in the Southwest region and from the hypothesis that offshore Karenia brevis bloom initiation provides an explanation of why this has been the case. Upwelling conditions (usually in the fall through spring) driven by the interaction of the Loop Current with the West Florida Shelf may influence bloom severity and extent (Liu and others, 2016). Transport from the offshore formative region—on the middle West Florida Shelf, extending north and south of the Tampa Bay region—generally occurs via onshore, southern flow of the bottom Ekman layer, which explains why most coastal blooms manifest in southwest Florida (Tester and Steidinger, 1997; Walsh and others, 2006; Steidinger, 2009; Weisberg and others, 2009, 2016). Coastal blooms may also manifest in the Atlantic region (for example, Tester and others, 1991; Tester and Steidinger, 1997) or the Northwest region (for example, McCulloch and others, 2013) as a result of transport by currents. According
to this hypothesis, it is unlikely that a red-tide bloom in the Northwest region or the Atlantic region will occur without a prior bloom in the Southwest region. Anomalous physical conditions could, however, potentially lead to a situation where a bloom and associated RTMM event could occur in one of these regions without a detected prior offshore bloom or coastal RTMM event in the Southwest region. Because of the evidence for lack of independence in the underlying cause of RTMM events among regions, Runge and others (2017) used a 0.5 correlation in the occurrence of red tide among regions in the CBM.
The principal aim of the expert judgment process described in this report was to estimate the frequency and magnitude of future RTMM events for incorporation into the population viability analysis known as the manatee CBM. By its nature, forecasting requires expert judgment because it is impossible to have empirical evidence about the future. A structured expert judgment process provides transparency, guards against the cognitive biases to which experts are prone, and allows uncertainty to be quantified. In the future, it may be possible to build a mechanistic forecasting model that links environmental processes to RTMM events and, ultimately, to effects on the manatee population. Such an approach would still require some degree of expert judgment but would be able to integrate knowledge about some of the complex dynamics that affect red-tide genesis and dispersal. We hope that progress in our understanding of red tide and manatee biology through the development of mechanistic models and analyses of new empirical data will allow us to improve estimates of the frequency and magnitude of RTMM events in the future.
References
Bossart, G.D., Baden, D.G., Ewing, R.Y., Roberts, B., and Wright, S.D., 1998, Brevetoxicosis in manatees (Trichechus manatus latirostris) from the 1996 epizootic—Gross, histologic and immunohistochemical features: Toxicologic Pathology, v. 26, p. 276–282.
Brand, L.E., and Compton, A., 2007, Long-term increase in Karenia brevis abundance along the southwest Florida Coast: Harmful Algae, v. 6, no. 2, p. 232–252.
Deutsch, C.J., Reid, J.P., Bonde, R.K., Easton, D.E., Kochman, H.I., and O’Shea, T.J., 2003, Seasonal movements, migratory behavior, and site fidelity of West Indian manatees along the Atlantic coast of the United States: Wildlife Monographs, v. 151, p. 1–77.
Deutsch, C.J., and Reynolds, J.E., III, 2012, Florida manatee status and conservation issues—A primer, in Hines, E., Reynolds, J.E., III, Aragones, L.V., Mignucci-Giannoni, A.A., and Marmontel, M., eds., Sirenian conservation—Issues and strategies in developing countries: Gainesville, Fla., University of Florida Press, p. 23–35.
References 15
Dorai-Raij, S., 2015, binom—binomial confidence intervals for parameterizations: R package version 1.1-1, accessed July 19, 2017, at http://cran.r-project.org/web/packages/binom/binom.pdf.
Errera, R.M., Yvon-Lewis, S., Kessler, J.D., and Campbell, L., 2014, Reponses of the dinoflagellate Karenia brevis to climate change—pCO2 and sea surface temperatures: Harmful Algae, v. 37, p. 110–116.
Fire, S.E., Flewelling, L.J., Naar, J., Twiner, M.J., Henry, M.S., Pierce, R.H., Gannon, D.P., Wang, Z., Davidson, L., and Wells, R.S., 2008, Prevalence of brevetoxins in prey fish of bottlenose dolphins in Sarasota Bay, Florida: Marine Ecology Progress, v. 368, p. 283–294.
Fire, S.E., Flewelling, L.J., Stolen, M., Durden, W.N., de Wit, M., Spellman, A.C., and Wang, Z., 2015, Brevetoxin-associated mass mortality event of bottlenose dolphins and manatees along the east coast of Florida, USA: Marine Ecology Progress, v. 526, p. 241–251.
Florida Fish and Wildlife Conservation Commission, 2007, Florida manatee (Trichechus manatus latirostris) red tide mortality event in southwestern Florida, March–April 2002. Unpublished report by Florida Fish and Wildlife Conservation Commission to the Working Group on Marine Mammal Unusual Mortality Events: St. Petersburg, Fla., Florida Fish and Wildlife Conservation Commission, 44 p.
Florida Fish and Wildlife Conservation Commission, 2008, Florida manatee (Trichechus manatus latirostris) red tide mortality event in southwestern Florida, March–April 2003. Unpublished report by Florida Fish and Wildlife Conservation Commission to the Working Group on Marine Mammal Unusual Mortality Events: St. Petersburg, Fla., Florida Fish and Wildlife Conservation Commission, 48 p.
Florida Fish and Wildlife Conservation Commission, 2013, Marine mammal repeat mortality event. Unpublished summary report no. F4105–13–F by Florida Fish and Wildlife Conservation Commission to the Working Group on Marine Mammal Unusual Mortality Events: St. Petersburg, Fla., Florida Fish and Wildlife Conservation Commission, 12 p.
Gulland, F.M.D., 2006, Review of the Marine Mammal Unusual Mortality Event Response Program of the National Marine Fisheries Service: U.S. Department of Commerce, National Oceanic and Atmospheric Administration (NOAA) Technical Memorandum NMFS–OPR–33, available from the Office of Protected Resources, Silver Spring, Md., NOAA Fisheries, 37 p., accessed July 19, 2017, at http://www.nmfs.noaa.gov/pr/pdfs/health/mmume_review.pdf.
Hallegraeff, G.M., 2010, Ocean climate change, phytoplankton community responses, and harmful algal blooms—A formidable predictive challenge: Journal of Phycology, v. 46, no. 2, p. 220–235.
Hallegraeff, G.M., 2016, Impacts and effects of ocean warming on marine phytoplankton and harmful algal blooms, in Laffoley, D., and Baxter, J.M. eds., Explaining ocean warming—Causes, scale, effects and consequences: Gland, Switzerland, International Union for Conservation of Nature, p. 399–408.
Hanea, A., McBride, M., Burgman, M., Wintle, B., Fidler, F., Flander, L., Twardy, C., Manning, B., and Mascaro, S., 2017, I nvestigate D iscuss E stimate A ggregate for structured expert judgement: International Journal of Forecasting, v. 33, no. 1, p. 267–279.
Hardison, D.R., Sunda, W.G., Tester, P.A., Shea, D., and Litaker, R.W., 2014, Increased cellular brevetoxins in the red tide dinoflagellate Karenia brevis under CO2 limitation of growth rate—Evolutionary implications and potential effects on bloom toxicity: Limnology and Oceanography v. 59, no. 2, p. 560–577.
Havens, K., 2015, Climate change and the occurrence of harmful microorganisms in Florida’s ocean and coastal waters: Florida Sea Grant College Program SGEF216, accessed July 19, 2017, at http://edis.ifas.ufl.edu/pdffiles/SG/SG13600.pdf.
Johnson, F.A., Smith, B.J., Bonneau, M., Martin, J., Romagosa, C., Mazzotti, F., Waddle, H., Reed, R.N., Ketterlin Eckles, J., and Vitt, L.J., 2017, Expert elicitation, uncertainty, and the value of information in controlling invasive species: Ecological Economics, v. 137, p. 83–90.
Kullback, S., and Leibler, R.A., 1951, On information and sufficiency: The Annals of Mathematical Statistics, v. 22, no. 1, p. 79–86.
Laist, D.W., Taylor, C., and Reynolds, J.E., III, 2013, Winter habitat preferences for Florida manatees and vulnerability to cold: PLoS ONE, v. 8, no. 3, accessed October 12, 2017, at https://doi.org/10.1371/journal.pone.0058978.
Landsberg, J.H., 2002, The effects of harmful algal blooms on aquatic organisms: Reviews in Fisheries Science, v. 10, no. 1, p. 113–390.
16 An Expert Elicitation Process To Project the Frequency and Magnitude of Florida Manatee Mortality Events Caused by Red Tide
Landsberg, J.H., Flewelling, L.J., and Naar, J.P., 2009, Karenia brevis red tides, brevetoxins in the food web, and impacts on natural resources—Decadal advancements: Harmful Algae, v. 8, no. 4, p. 598–607.
Landsberg, J.H., and Steidinger, K.A., 1998, A historical review of Gymnodinium breve red tides implicated in mass mortalities of the manatee (Trichechus manatus latirostris) in Florida, USA, in Reguera, B., Blanco, J., Fernandez, M.L., and Wyatt, T., eds. Harmful algae: Paris, United Nations Educational, Scientific and Cultural Organization (UNESCO), Xunta de Galicia and Intergovernmental Oceanographic Commission, p. 97–100.
Landsberg, J.L., Lefebvre, K.A., and Flewelling, L.J., 2014, Effects of toxic microalgae on marine organisms, in Rossini, G.P., ed., Toxins and biologically active compounds from microalgae, v. 2—Biological effects and risk management: Boca Raton, Fla., CRC Press, p. 379–449.
Langtimm, C.A., Kendall, W.L., Beck, C.A., Kochman, H.I., Teague, A.L., Meigs-Friend, G., and Penaloza, C.L., 2016, Model description and evaluation of the mark-recapture survival model used to parameterize the 2012 status and threats analysis for the Florida manatee: U.S. Geological Survey Open-File Report 2016–1163, 20 p., https://doi.org/10.3133/ofr20161163.
Lefebvre, K.A., Quakenbush, L., Frame, E., Huntington, K.B., Sheffield, G., Stimmelmayr, R., Bryan, A., Kendrick, P., Ziel, H., Goldstein, T., Snyder, J.A., Gelatt, T., Gulland, F., Dickerson, B., and Gill, V., 2016, Prevalence of algal toxins in Alaskan marine mammals foraging in a changing arctic and subarctic environment: Harmful Algae, v. 55, p. 13–24.
Liu, Y., Weisberg, R.H., Lenes, J.M., Zheng, L., Hubbard, K., and Walsh, J.J., 2016, Offshore forcing on the “pressure point” of the West Florida Shelf—Anomalous upwelling and its influence on harmful algal blooms: Journal of Geophysical Research (Oceans), v. 121, p. 5501–5515.
Lyon, A., Wintle, B.C., and Burgman, M., 2015, Collective wisdom—Methods of confidence interval aggregation: Journal of Business Research, v. 68, p. 1759–1767.
Martin, J., Edwards, H.H., Fonnesbeck, C.J., Koslovsky, S.M., Harmak, C.W., and Dane, T.M., 2015, Combining information for monitoring at large spatial scales—First statewide abundance estimate of the Florida manatee: Biological Conservation, v. 186, p. 44–51.
McCabe, R.M., Hickey, B.M., Kudela, R.M., Lefebvre, K.A., Adams, N.G., Bill, B.D., Gulland, F., Thomson, R.E., Cochlan, W.P., and Trainer, V.L., 2016, An unprecedented coastwide toxic algal bloom linked to anomalous ocean conditions: Geophysical Research Letters, v. 43, no. 19, p. 10366–10376.
McCulloch, A.A., Kamykowski, D., Morrison, J.M., Thomas, C.J., and Pridgen, K.G., 2013, A physical and biological context for Karenia brevis seed populations on the northwest Florida Shelf during July 2009: Continental Shelf Research, v. 63, p. 94–111.
Morgan, M.G., 2014, Use (and abuse) of expert elicitation in support of decision making for public policy: Proceedings of the National Academy of Sciences of the United States of America, v. 111, no. 20, p. 7176–7184.
Mukherjee, N., Hugé, J., Sutherland, W.J., McNeill, J., Van Opstal, M., Dahdouh-Guebas, F., and Koedam, N., 2015, The Delphi technique in ecology and biological conservation—Applications and guidelines: Methods in Ecology and Evolution, v. 6, no. 9, p. 1097–1109.
O’Neil, J.M., Davis, T.W., Burford, M.A., and Gobler, C.J., 2012, The rise of harmful cyanobacteria blooms—The potential roles of eutrophication and climate change: Harmful Algae, v. 14, p. 313–334.
O’Shea, T.J., Rathbun, G.B., Bonde, R.K., Buergelt, C.D., and Odell, D.K., 1991, An epizootic of Florida manatees associated with a dinoflagellate bloom: Marine Mammal Science, v. 7, no. 2, p. 165–179.
R Core Team, 2016, R—A language and environment for statistical computing: Vienna, Austria, R Foundation for Statistical Computing.
Runge, M.C., Langtimm, C.A., Martin, J., and Fonnesbeck, C.J., 2015, Status and threats analysis for the Florida manatee (Trichechus manatus latirostris), 2012: U.S. Geological Survey Open-File Report 2015–1083, 23 p., accessed July 19, 2017, at http://dx.doi.org/10.3133/ofr20151083.
Runge, M.C., Sanders-Reed, C.A., and Fonnesbeck, C.J., 2007a, A core stochastic population projection model for Florida manatees (Trichechus manatus latirostris): U.S. Geological Survey Open-File Report 2007–1082, 41 p., accessed July 19, 2017, at http://pubs.er.usgs.gov/publication/ofr20071082.
Runge, M.C., Sanders-Reed, C.A., Langtimm, C.A., and Fonnesbeck, C.J., 2007b, A quantitative threats analysis for the Florida manatee (Trichechus manatus latirostris): U.S. Geological Survey Open-File Report 2007–1086, 34 p., accessed July 19, 2017, at http://pubs.er.usgs.gov/publication/ofr20071086.
Runge, M.C., Sanders-Reed, C.A., Langtimm, C.A., Hostetler, J.A., Martin, J., Deutsch, C.J., Ward-Geiger, L.I., and Mahon, G.L., 2017, Status and threats analysis for the Florida manatee (Trichechus manatus latirostris), 2016: U.S. Geological Survey Scientific Investigations Report 2017–5030, 40 p., accessed July 19, 2017, at http://doi.org/10.3133/sir20175030.
Southeast Regional Climate Center, 2017, Historical climate summaries for Florida: Accessed February 28, 2017, at http://www.sercc.com/climateinfo/historical/historical_fl.html.
Steidinger, K.A., 2009, Historical perspective on Karenia brevis red tide research in the Gulf of Mexico: Harmful Algae, v. 8, no. 4, p. 549–561.
Steidinger, K.A., Vargo, G.A., Tester, P.A., and Tomas, C.R., 1998, Bloom dynamics and physiology of Gymnodinium breve with emphasis on the Gulf of Mexico, in Anderson, D.M., Cembella, A.D., and Hallegraeff, G.M., eds., Physiological ecology of harmful algal blooms: Heidelberg, Springer-Verlag, p. 133–153.
Sutherland, W.J., and Burgman, M.A., 2015, Use experts wisely: Nature, v. 526, no. 7573, p. 317–318.
Tester, P.A., and Steidinger, K.A., 1997, Gymnodinium breve red tide blooms—Initiation, transport, and consequences of surface circulation: Limnology and Oceanography, v. 42, no. 5, p. 1039–1051.
Tester, P.A., Stumpf, R.P., Vukovich, F.M., Fowler, P.K., and Turner, J.T., 1991, An expatriate red tide bloom—Transport, distribution, and persistence: Limnology and Oceanography, v. 6, no. 5, p. 1053–1061.
Walsh, J.J., Jolliff, J.K., Darrow, B.P., Lenes, J.M., Milroy, S.P., Remsen, D., Dieterle, D.A., Carder, K.L., Chen, F.R., Vargo, G.A., Weisberg, R.H., Fanning, K.A., Muller-Karger, F.E., Shinn, E., Steidinger, K.A., Heil, C.A., Prospero, J.S., Lee, T.N., Kirkpatrick, G.J., Whitledge, T.E., Stockwell, D.A., Tomas, C.R., Villareal, T.A., Jochens, A.E., and Bontempi, P.S., 2006, Red tides in the Gulf of Mexico—Where, when, and why: Journal of Geophysical Research, v. 111, no. C11003, p. 1–46.
Weisberg, R.H., Barth, A., Alvera-Azcárate, A., and Zheng, L., 2009, A coordinated coastal ocean observing and modeling system for the west Florida Shelf: Harmful Algae, v. 8, no. 4, p. 585–598.
Weisberg, R.H., Zheng, L., Liu, Y., Corcoran, A.A., Lembke, C., Hu, C., Lenes, J.M., and Walsh, J.J., 2016, Karenia brevis blooms on the West Florida Shelf—A comparative study of the robust 2012 bloom and the nearly null 2013 event: Continental Shelf Research, v. 120, p. 106–121.
Wilson, C., Sastre, A.V., Hoffmeyer, M., Rowntree, V.J., Fire, S.E., Santinelli, N.H., Ovejero, S.D., D’Agostino, V., Marón, C.F., Doucette, G.J., Broadwater, M.H., Wang, Z., Montoya, N., Seger, J., Adler, F.R., Sironi, M., and Uhart, M.M., 2015, Southern right whale (Eubalaena australis) calf mortality at Península Valdés, Argentina—Are harmful algal blooms to blame?: Marine Mammal Science, v. 32, no. 2, p. 423–451.
Woudenberg, F., 1991, An evaluation of Delphi: Technological Forecasting and Social Change, v. 40, no. 2, p. 131–150.