49
Degree project in An Expert System for Automatic Relay Performance Analysis SHISONG, GAO Stockholm, Sweden 2012 XR-EE-ICS 2013:006 ICS Masterthesis,
| Date post: | 23-Apr-2018 |
| Category: |
Documents |
| Upload: | phungxuyen |
| View: | 223 times |
| Download: | 1 times |

Degree project in
An Expert System for Automatic RelayPerformance Analysis
SHISONG, GAO
Stockholm, Sweden 2012
XR-EE-ICS 2013:006
ICSMasterthesis,

Dedicate to those who help me in my life

i
Acknowledgments
First of all I want to thanks all the people who make this project possible,speciallyProf. Lars Nordstrm and Dr. Murari Mohan Saha,who give me this precious oppor-tunity. Then I want to express my deep and sincere gratitude to all my supervisors.In the ABB Hans Jernberg, Stig Lidstrm,Torbjrn Einarsson. In ICS department Ar-shad Saleem,Nicholas Honeth. You help me with all your heart. Thanks you for yourknowledges and endless patiences.Nothing would accomplished without your help. Ialso want to thanks my programme mates also close friends Davood babazadeh, Zhaopengcheng, Chen zhenwei. Thanks for you accompany and encourage when i needthem the most. Finally, I wish to thank my parents for all their love and support.

ii
Table of Contents
Abstract i
Dedication ii
Acknowledgments i
List of Acronyms iv
List of Tables v
List of Figures vi
1 Introduction 11.1 Introduction . . . . . . . . . . . . . . . . . . . . . . . . . . . . . . . . 11.2 Background . . . . . . . . . . . . . . . . . . . . . . . . . . . . . . . . 11.3 Project Objectives . . . . . . . . . . . . . . . . . . . . . . . . . . . . 21.4 Initial Motivation of the project . . . . . . . . . . . . . . . . . . . . . 21.5 Project Plan . . . . . . . . . . . . . . . . . . . . . . . . . . . . . . . . 31.6 ESARP System . . . . . . . . . . . . . . . . . . . . . . . . . . . . . . 5
2 Theoretical and background knowledge survey 62.1 Literature review . . . . . . . . . . . . . . . . . . . . . . . . . . . . . 62.2 RTDS relay testing environment . . . . . . . . . . . . . . . . . . . . . 62.3 RTDS relay testing system model . . . . . . . . . . . . . . . . . . . . 72.4 Relay model study . . . . . . . . . . . . . . . . . . . . . . . . . . . . 8
2.4.1 Full scheme measurement . . . . . . . . . . . . . . . . . . . . 82.4.2 Impedance characteristic . . . . . . . . . . . . . . . . . . . . . 9
2.5 COMTRADE Files . . . . . . . . . . . . . . . . . . . . . . . . . . . . 112.5.1 Header Files . . . . . . . . . . . . . . . . . . . . . . . . . . . . 122.5.2 Configuration File . . . . . . . . . . . . . . . . . . . . . . . . 122.5.3 Data File . . . . . . . . . . . . . . . . . . . . . . . . . . . . . 12
3 Concept of model development 133.1 Previews expert system concept . . . . . . . . . . . . . . . . . . . . . 133.2 General Structure for the system development . . . . . . . . . . . . . 143.3 Functional Requirement of the system . . . . . . . . . . . . . . . . . 15
3.3.1 Multi-file reading . . . . . . . . . . . . . . . . . . . . . . . . . 163.3.2 Signal decomposition . . . . . . . . . . . . . . . . . . . . . . . 173.3.3 Dynamic performance of relay calculation . . . . . . . . . . . 17

iii
3.3.4 Identification of different protection zone . . . . . . . . . . . . 18
4 System design 204.1 Detail steps of the system . . . . . . . . . . . . . . . . . . . . . . . . 204.2 Develop environment and component selection . . . . . . . . . . . . . 224.3 Multi Files Reading . . . . . . . . . . . . . . . . . . . . . . . . . . . . 224.4 Relay Model transfer . . . . . . . . . . . . . . . . . . . . . . . . . . . 264.5 Signal Decomposition . . . . . . . . . . . . . . . . . . . . . . . . . . . 274.6 Matlab Java Builder . . . . . . . . . . . . . . . . . . . . . . . . . . . 284.7 Logic steps in Expert environment . . . . . . . . . . . . . . . . . . . . 30
5 System function result 315.1 Analog signals channel plotted . . . . . . . . . . . . . . . . . . . . . . 315.2 Impedance dynamic performance with corresponding time scale . . . 315.3 Automatic saved value of resistance and reactants . . . . . . . . . . . 365.4 Evaluate from Expert advice . . . . . . . . . . . . . . . . . . . . . . 36
6 Future work 376.1 User friendly interface . . . . . . . . . . . . . . . . . . . . . . . . . . 376.2 Robust rule based system . . . . . . . . . . . . . . . . . . . . . . . . 376.3 GUI function for adoptive domains define . . . . . . . . . . . . . . . . 376.4 Optimized parameter resetting for executing analysis . . . . . . . . . 37
7 Conclusions 38
8 Discussion 39
Bibliography 40

iv
List of Acronyms
IED Intelligent Electronic Device
CT Current Transformer
VT Voltage Transformer
SAS Substation Automation Systems
ESARP An Expert System for Automatic Relay Performance Analysis
RTDS Real Time Digital Simulator
IEC International Electrotechnical Commission
GOOSE General Object Oriented Substation Event
COMTRADE Common format for Transient Data Exchange for power systems
PLL Phase-locked loops

v
List of Tables
2.1 Parameters in zone 1 setting . . . . . . . . . . . . . . . . . . . . . . . 10
4.1 tasks for different roles within java builder . . . . . . . . . . . . . . . 29
vi
List of Figures
1.1 General structure of expert system . . . . . . . . . . . . . . . . . . . 21.2 Different zone indication for the fault analysis . . . . . . . . . . . . . 31.3 Project model . . . . . . . . . . . . . . . . . . . . . . . . . . . . . . . 4
2.1 RTDS testing environment . . . . . . . . . . . . . . . . . . . . . . . . 72.2 RTDS relay testing system model . . . . . . . . . . . . . . . . . . . . 82.3 RTDS relay testing system model . . . . . . . . . . . . . . . . . . . . 82.4 Relay protection domain define . . . . . . . . . . . . . . . . . . . . . 92.5 Fault loop model . . . . . . . . . . . . . . . . . . . . . . . . . . . . . 11
3.1 Concept of structure of expert system . . . . . . . . . . . . . . . . . . 143.2 Closed loop testing of a physical relay . . . . . . . . . . . . . . . . . . 15
4.1 Detail steps of the build up expert system . . . . . . . . . . . . . . . 214.2 Test circuit of relay model in RTDS . . . . . . . . . . . . . . . . . . . 264.3 Signal process in the relay model . . . . . . . . . . . . . . . . . . . . 27
5.1 Analog signals channel plotted . . . . . . . . . . . . . . . . . . . . . . 315.2 Impedance dynamic performance with corresponding time scale . . . 325.3 0 percent of line value . . . . . . . . . . . . . . . . . . . . . . . . . . 335.4 50 percent of line value . . . . . . . . . . . . . . . . . . . . . . . . . . 335.5 90 percent of line value . . . . . . . . . . . . . . . . . . . . . . . . . . 335.6 Corresponding time scale . . . . . . . . . . . . . . . . . . . . . . . . . 335.7 0 percent of line value . . . . . . . . . . . . . . . . . . . . . . . . . . 345.8 50 percent of line value . . . . . . . . . . . . . . . . . . . . . . . . . . 345.9 90 percent of line value . . . . . . . . . . . . . . . . . . . . . . . . . . 345.10 Corresponding time scale . . . . . . . . . . . . . . . . . . . . . . . . . 345.11 0 percent of line value . . . . . . . . . . . . . . . . . . . . . . . . . . 355.12 50 percent of line value . . . . . . . . . . . . . . . . . . . . . . . . . . 355.13 90 percent of line value . . . . . . . . . . . . . . . . . . . . . . . . . . 355.14 Corresponding time scale . . . . . . . . . . . . . . . . . . . . . . . . . 35
1
Chapter 1
Introduction
1.1 Introduction
Modern electrical power system is a very large scale of complex and interconnectedsystem that the small disturbance easily would create havoc in power system stabilityand sustainability without operation of power system protection.[1] In the analysisof power system protection the protection relay IED is the crucial part in order toprevent the unexpected event and maintain the integrity and security of the system.It is very useful at identifying problems with the fault relay settings or the algorithmof protection which could cause undesired operation and system disturbances. [2]Byreplaying the recorded fault waveform which generated from the testing devices, theunexpected performance of the relay can be changed through the resetting of theparameters.[3] Such analysis is complicated and expertise knowledge is usually re-quired. Through such test running time of testing devices would usually demandvery high cost. At the same time analysis of recognize and categories the faults todetermine fault location and record data about fault level and fault resistance takelots of human resources in order to evaluate the correctness of the relay operationfor a fault. The objective of this paper is to verify the performance of the relay IEDthrough post-mortem analysis, the completion of design such system will help withoperational decision making while saving working hour as well as the cost of runningtime of testing devices.
1.2 Background
The project is the collaboration between KTH ICS department and company ABBSubstation Automation. The project starts from March 15 2012 officially. The re-quirements of the project are elicited from the senior experts from aspect of SimulationEngineer, Line protection and Application. The material related with the testing re-lay and background knowledge is provided from ABB. The following figure shows thegeneral structure of starting point of the project. The domain knowledge includingLiterature, document and manual will be provided from ABB. The result of testingwill be generated from ABB relay. The knowledge and testing result being put intothe system after data categorization and calculation should evaluate the relay per-formance and the expert advises as a result should generated automatically. Suchdeveloped system should greatly benefit from enhance work efficiency since it takeslong time to analysis all the generated results after relay testing. Also save time from

2
the running time of simulator in order to reduce testing cost base on existing files.The completion of the system should be highly replicable since the difficult of knowl-edge heritage from the expertise. Also such system should be easy to further developinto more robust system in order for meeting higher requirement of the automationanalysis.
Figure 1.1: General structure of expert system
1.3 Project Objectives
After testing through different scenarios the performance of the relay should be eval-uated. The correctness of the relay will be judged through comparison of what therelay seen from the fault and what the actual fault is applied in the system. Domainparameter should be reset from certain behavior of the relay. The result generatedfrom such system should indicate such behavior in the format of report through run-ning all the testing files.
1.4 Initial Motivation of the project
The envisage system should have the characteristic of automatic result report gener-ated and saved through Multi-files processing of the Comtrade Files. The dynamicrelay performance should be calculated and compare with the domain setting to get
3
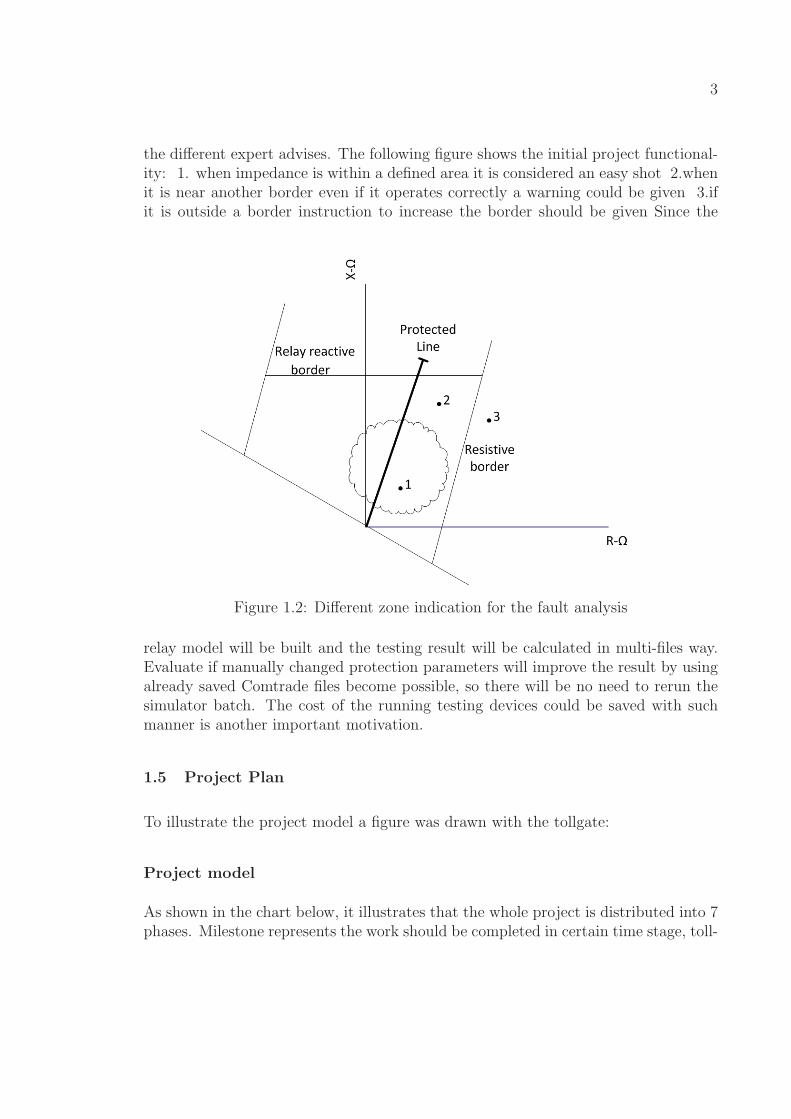
the different expert advises. The following figure shows the initial project functional-ity: 1. when impedance is within a defined area it is considered an easy shot 2.whenit is near another border even if it operates correctly a warning could be given 3.ifit is outside a border instruction to increase the border should be given Since the
Figure 1.2: Different zone indication for the fault analysis
relay model will be built and the testing result will be calculated in multi-files way.Evaluate if manually changed protection parameters will improve the result by usingalready saved Comtrade files become possible, so there will be no need to rerun thesimulator batch. The cost of the running testing devices could be saved with suchmanner is another important motivation.
1.5 Project Plan
To illustrate the project model a figure was drawn with the tollgate:
Project model
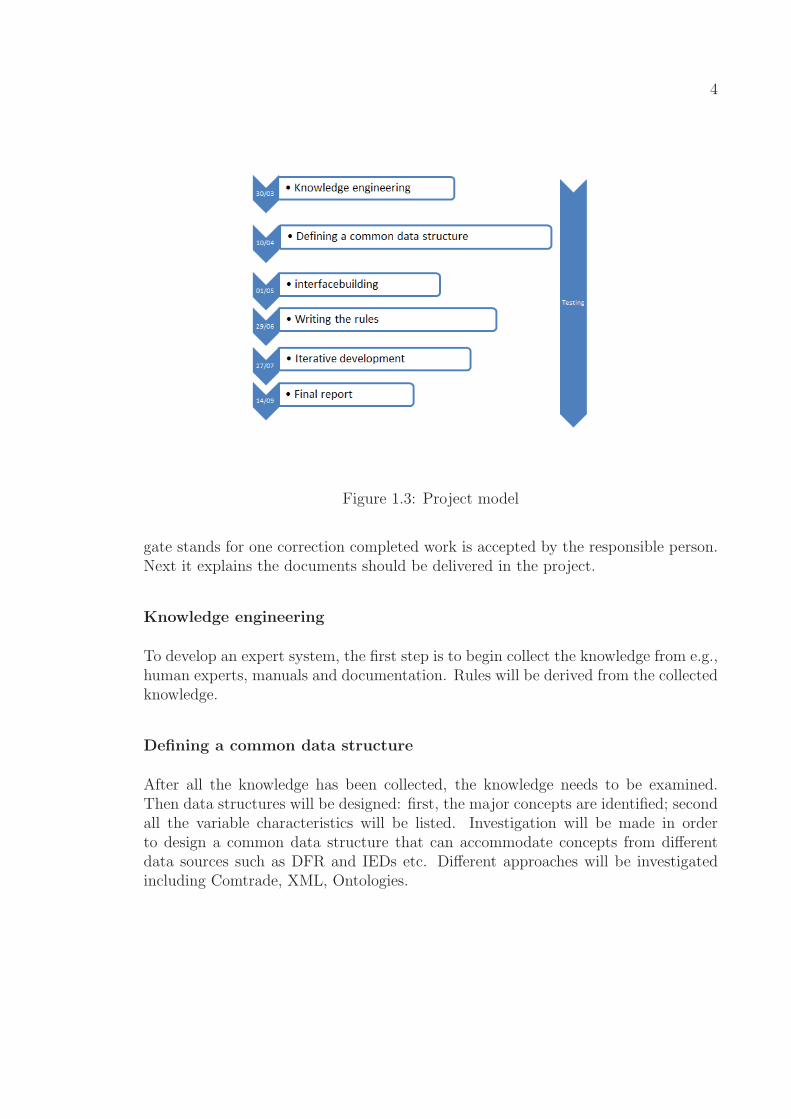
As shown in the chart below, it illustrates that the whole project is distributed into 7phases. Milestone represents the work should be completed in certain time stage, toll-
4
Figure 1.3: Project model
gate stands for one correction completed work is accepted by the responsible person.Next it explains the documents should be delivered in the project.
Knowledge engineering
To develop an expert system, the first step is to begin collect the knowledge from e.g.,human experts, manuals and documentation. Rules will be derived from the collectedknowledge.
Defining a common data structure
After all the knowledge has been collected, the knowledge needs to be examined.Then data structures will be designed: first, the major concepts are identified; secondall the variable characteristics will be listed. Investigation will be made in orderto design a common data structure that can accommodate concepts from differentdata sources such as DFR and IEDs etc. Different approaches will be investigatedincluding Comtrade, XML, Ontologies.

5
Testing and Verification
For making the system more robust, more modular and better understood. Rigoroustest need to apply into every step in system development.
Interface building
To categorize fault types interface building like database access and different compo-nent integration would be investigated.
Writing the rules
Once the former steps all accomplished the process of writing rules shall begin. Itwill be easier for programming and testing if the rules divided into separate modules.
Iterative development
During the developing of the system, more information back to the source alwaysneeds to be reviews to increase the quality of the work.
Final report
The report which covers all stages of the project, as well the detail functions will bepresented.
1.6 ESARP System
An Expert System for Automatic Relay Performance Analysis (ESARP) is designedin the project according to the requirements provided above. ESARP system shouldperform post-mortem analysis of the fault incidents and relay operation. During suchprocess the raw data should be collecting, grouping or clustering automatically. Thenrelay operation correctness will be verified in order to minimize time spend for manualdetailed analysis of simulation shots.

6
Chapter 2
Theoretical and background knowledge survey
2.1 Literature review
Distance relay have changed dramatically in functionality and operating principles inthe last two decades. Microprocessor protective relays nowadays become more andmore complex with the pre-programmed control logic and additional functions.[4][5]In the paper of Testing of advanced distance protection relays typical schemes andfunctional hierarchy are illustrated then the methodology and tools available for therelay testing are further discussed.[3]In the paper of automated test solution for mul-tifunctional protection relays the automatic validation test set-up are being discussed.[5]Such test environment is built up under the test component Agile which will gen-erate the test files. Then the test results are extracted and stored in the defineddatabase. Then the test report is generated. While some related model buildingare done in the paper Modeling and Testing of Protection Relay lED , a matlabbased power system model and fault are simulated. Then the matlab based relayprogram is tested with satisfactory results[6]. Then a PSCAD based faults are simu-lated with the real relay tested on line. Different test scenario is applied and the typeand location of fault detected by the relay IED was compared with the simulatedfault. [5]Similarly in the paper Modeling and Testing of a Digital Distance RelayUsing MATLAB/SIMULINK a digital distance relay for transmission line protectionis modeled and tested under power system block-set and the implement program ofdistance relaying algorithms are served as the main environment. Difference in test-ing environment and way of analysis of this paper will be explain into details withfollowing sectors[7].
2.2 RTDS relay testing environment
The relay testing is performing under the real time digital simulator (RTDS) in thispaper[8]. Such advanced and effective system can be connected in the closed loopwith power system model. Under the controlled and flexible environment the protec-tion component to be subjected to all possible faults and operating condition withinthe digital simulation. The insight of performance of relay as well as the interac-tive with the power system will be provided. Proportional secondary voltage andcurrent signal which the protection equipment would see are used through detailedmodels of transformers instrument such as (CT,PT and CVT).So the effect on theperformance of the relay can be evaluated. The primary voltage and current signals
7
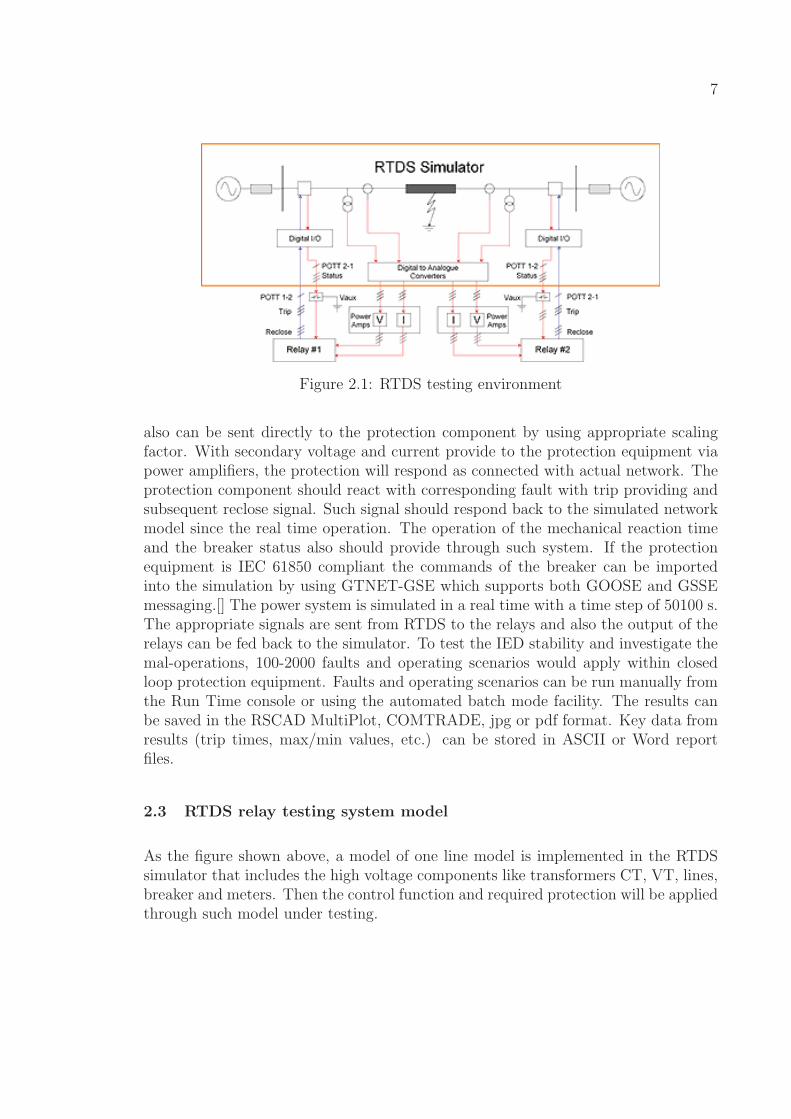
Figure 2.1: RTDS testing environment
also can be sent directly to the protection component by using appropriate scalingfactor. With secondary voltage and current provide to the protection equipment viapower amplifiers, the protection will respond as connected with actual network. Theprotection component should react with corresponding fault with trip providing andsubsequent reclose signal. Such signal should respond back to the simulated networkmodel since the real time operation. The operation of the mechanical reaction timeand the breaker status also should provide through such system. If the protectionequipment is IEC 61850 compliant the commands of the breaker can be importedinto the simulation by using GTNET-GSE which supports both GOOSE and GSSEmessaging.[] The power system is simulated in a real time with a time step of 50100 s.The appropriate signals are sent from RTDS to the relays and also the output of therelays can be fed back to the simulator. To test the IED stability and investigate themal-operations, 100-2000 faults and operating scenarios would apply within closedloop protection equipment. Faults and operating scenarios can be run manually fromthe Run Time console or using the automated batch mode facility. The results canbe saved in the RSCAD MultiPlot, COMTRADE, jpg or pdf format. Key data fromresults (trip times, max/min values, etc.) can be stored in ASCII or Word reportfiles.
2.3 RTDS relay testing system model
As the figure shown above, a model of one line model is implemented in the RTDSsimulator that includes the high voltage components like transformers CT, VT, lines,breaker and meters. Then the control function and required protection will be appliedthrough such model under testing.

8
Figure 2.2: RTDS relay testing system model
2.4 Relay model study
2.4.1 Full scheme measurement
The online testing model of relay which used in the system is ABB REL670. The linedistance protection is up to five zone full scheme protection. The fault loops includethree phase-to earth faults and three phase-to-phase faults for each of independentzone. Also the individual setting of resistive and reactive of each independent zoneis flexible for the user as the backup of transformer connected to the overhead lineand different kinds of cables. The suitable application with auto-reclosing is basedon independent each fault loop measurement of impedance and sensitive and reliablebuilt in phase selection function. Also the adaptive load compensation algorithmfor the quadrilateral function could prevents overreaching of zone1 at load exportingend at phase to earth faults. Such relay can operate independently in directional(forward or reverse) or non-directional mode. The following figure shows the differentmeasuring loops for basic five protection zones. The use of full scheme technique
Figure 2.3: RTDS relay testing system model
compared to switched schemes gives faster operation time[9]. Depending on the faulttype a start element is selected with correct voltages and current. With those selectedvalue of measuring current and voltage each distance protection zone performs likeon independent distance protection IED.

9
2.4.2 Impedance characteristic
Some basic parameters regarding zone1 setting
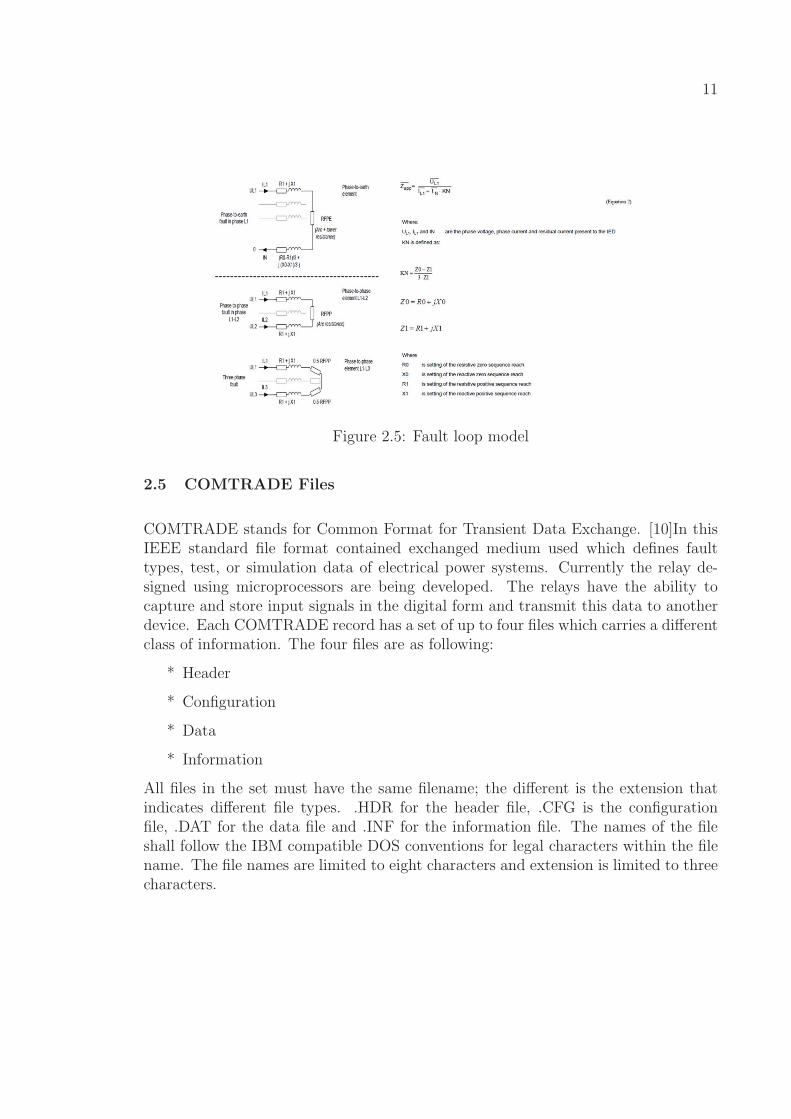
The distance measuring zone includes three intended phase-to-earth fault loopsand three phase-to-phase fault loops. According to the parameter listed above thedistance measuring zone will essentially operate. The full loop reach is presentedas following figure shown. The fault loop model with respect to each fault type is
Figure 2.4: Relay protection domain define
illustrated as following for further calculation. The R1 and X1 stands for positivesequence impedance from measuring pint to the fault location. The actual faultresistances are represented as parameters RFPE and RFPP. The calculation of faultloop use complex values of voltage, current and current changes. The earth returncompensation applies in a conventional manner.

10
Name Values Values Unit Step Default DescriptionOperation Off On On Operation Off / OnIBase 1 - 99999 A 1 3000 Base current, i.e. rated current
OperationDir
Off Non-directionalForwardReverse
ForwardOperation mode of di-rectionality NonDir /Forw / Rev
X1FwPP 0.10 - 3000.00 ohm/p 0.01 30.00Positive sequence re-actance reach, Ph-Ph,forward
R1PP 0.01 - 1000.00 ohm/p 0.01 5.00Positive seq. resis-tance for characteris-tic angle, Ph-Ph
RFFwPP 0.10 - 3000.00 ohm/l 0.01 30.00Fault resistance reach,Ph-Ph, forward
X1RvPP 0.10 - 3000.00 ohm/p 0.01 30.00Positive sequence re-actance reach, Ph-Ph,reverse
RFRvPP 0.10 - 3000.00 ohm/l 0.01 30.00Fault resistance reach,Ph-Ph, reverse
X1FwPE 0.10 - 3000.00 ohm/p 0.01 30.00Positive sequence re-actance reach, Ph-E,forward
R1PE 0.01 - 1000.00 ohm/p 0.01 5.00Positive seq. resis-tance for characteris-tic angle, Ph-E
X0PE 0.10 - 9000.00 ohm/p 0.01 100.00Zero sequence reac-tance reach, Ph-E
R0PE 0.01 - 3000.00 ohm/p 0.01 47.00Zero seq. resistancefor zone characteristicangle, Ph-E
RFFwPE 0.10 - 9000.00 ohm/l 0.01 100.00Fault resistance reach,Ph-E, forward
X1RvPE 0.10 - 3000.00 ohm/p 0.01 30.00Positive sequence re-actance reach, Ph- E,reverse
RFRvPE 0.10 - 9000.00 ohm/l 0.01 100.00Fault resistance reach,Ph-E, reverse
Table 2.1: Parameters in zone 1 setting
11
Figure 2.5: Fault loop model
2.5 COMTRADE Files
COMTRADE stands for Common Format for Transient Data Exchange. [10]In thisIEEE standard file format contained exchanged medium used which defines faulttypes, test, or simulation data of electrical power systems. Currently the relay de-signed using microprocessors are being developed. The relays have the ability tocapture and store input signals in the digital form and transmit this data to anotherdevice. Each COMTRADE record has a set of up to four files which carries a differentclass of information. The four files are as following:
* Header
* Configuration
* Data
* Information
All files in the set must have the same filename; the different is the extension thatindicates different file types. .HDR for the header file, .CFG is the configurationfile, .DAT for the data file and .INF for the information file. The names of the fileshall follow the IBM compatible DOS conventions for legal characters within the filename. The file names are limited to eight characters and extension is limited to threecharacters.

12
2.5.1 Header Files
Header file is an ASCII text file created by the originator of the COMTRADE data,usually generated through the word process program. Such data are intended to beread by the users. The file format is ASCII.
2.5.2 Configuration File
The configuration file is an ASCII text file which is intended read by the computerprogram so such file must be saved in a specific format. The information containedin the configuration file can be used by the computer program to interpret the datain the .DAT file. This information includes items related with sample rates, linefrequency, number of channels, channel information, etc. The configuration file canbe created with a word processing program or by a computer program that createsthe configuration file from the source of the transient recorder. If a word processor isused to generate the file. Such data must be in ASSCII text file format.
2.5.3 Data File
Each input channel for each sample in the record will be saved in the .DAT file. Thenumber stored for a sample corresponding to a scaled version of value presented tothe device that sampled the input waveform. The stored data maybe zero based orzero offset. The zero-based data spans from a negative number to a positive number.While zero off-set number are all positive with a positive number stands for zero. Alsoeach sample is corresponded with a sequence number and time stamp. In additionto data represent analog input that indicate on/off signals are frequently recorded.These are referred to as digital inputs, digital channels, event inputs, or status inputs.Usually such status is represented by the number 1 or 0 in the DAT. File.

13
Chapter 3
Concept of model development
3.1 Previews expert system concept
An expert system which performs detailed diagnosis of the relay operation is pre-sented from the paper An Expert System for Diagnosis of Digital Relay Operation.The system use the relay generated file and report as resource for analyzing. Thetragedy is forward chaining reasoning, logic reasoning and backward chaining. Theimplementation of knowledge through software CLIPS is used for the prediction ofperformance of relay. Commercial software called RELAY ASSISTANT and a relaytest set are used to generate the simulated voltage and current to trigger the relayoperation. The actual behavior of the relay and circuit breaker in terms of statusand timing of logic operands are recorded which has been deliberately manipulatedto introduce the abnormities. As the result a diagnosis report is generated. Bothvalidation information and diagnosis information are listed also the correctness of theanalysis is further proved. In the paper Enhancement of Expert System Philosophyfor Automatic Fault Analysis ideas for automatic fault analysis system based on oscil-lographic fault recorders are discussed. The purpose of the system is to recognize andcategories the fault. Other purpose is to determine fault locations and record dataabout fault level and fault resistance. The correctness of the fault should be analyzed.Such system has not been developed yet because of diversity of protection devices andenormous amount of binary indication possible. And due to the suppliers desire tomaintain the secrecy of their programming code in case of losing intellectual property.Such developed system is intended to provide the system operator control personnelwith information which helps them with operational decision making. While at thesame time some other automatic fault analysis system also explored in this paper.Yuehai et al. (2004) demonstrate a method of using threshold pickups for severalvariables for fault type identification. The type of fault identified by a logical tablewhich requires a great deal of predetermined values based on human expertise. How-ever from all recorders need to be synchronized, clustered and categorized in termsof relevance to a particular fault which required exact fault inception time and faultduration need to be resolved. In a paper by Barros, Perez and Pigazo (2003), theauthors claim that the Short Time Fourier Transform (STFT) and use Kalman filtersto identify disturbance of power quality .Bollen et al. (2007) compare abilities of Ex-pert Systems (ES) and Support Vector Machines (SVM) to classify PQDs. A surveyby Ibrahim and Morcos (2002) reveal that Artificial Intelligence methods like FuzzyLogic, Expert Systems, Artificial Neural Networks (ANN), Genetic Algorithms (GAs)and Adaptive Fuzzy Logic can be experimented with analyses PQDs. A method was

14
developed by Kezunovic, Luo (Shanshan) and Sevcik (2002) uses Genetic Algorithms(GAs) to perform fault location in conditions of sparse field recording availability. Ex-amples regarding fault automatic analysis. For instance, Sun, Jiang and Wang (1998)show how Artificial Neural Networks (ANNs) can be used for different time-spaceson the fault event sequence. Fukuyama and Ueki (1991) showed that ANNs can besuccessfully used to perform waveform recognition and fault identification in order tocluster relevant recording; as long as they are verified by means of a rule based Ex-pert System (ES). Zhang and Kezunovic, 2006 seem to prefer rigorous mathematicalsolutions for detection, classification and location through synchronized sampling bycomparing modal components of currents against thresholds. Unfortunately due tofears of sabotage and direct access to information from protection relays is not usuallypositive. For that reason, the AFA Systems illustrated above most are incorporatewith recorder report instead of relay record [11][12].
3.2 General Structure for the system development
The concept of such server system is that it shall recognize the fault record from theFault Recorder Master station. This Master station shall operate separately fromsuch expert system. Also master station shall access fault recorders of various typesthrough different appropriate protocol. The fault record obtained from master stationshall export and saved in the entry folder of expert system in ASCII COMTRADEformat. The various sequences of analogue and digital channel sample data shouldbe recorded. All of recorded files shall be imported and processed automatically bymeans of signal decomposition, algorithm calculation and Fault classification. All ofthe data and results of analysis also need to be stored automatically. The followingis a general structure of expert system. The further requirement of the system anddetailed structure will be illustrate in the following chapters[12].
Figure 3.1: Concept of structure of expert system
15
3.3 Functional Requirement of the system
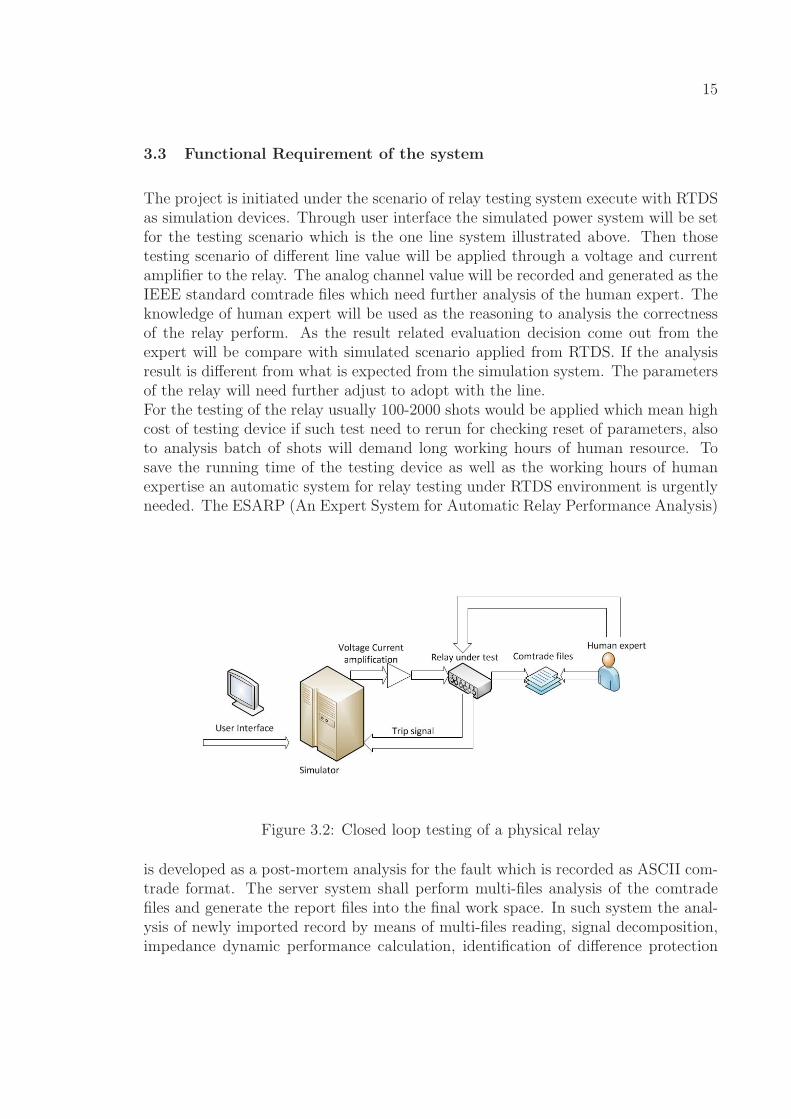
The project is initiated under the scenario of relay testing system execute with RTDSas simulation devices. Through user interface the simulated power system will be setfor the testing scenario which is the one line system illustrated above. Then thosetesting scenario of different line value will be applied through a voltage and currentamplifier to the relay. The analog channel value will be recorded and generated as theIEEE standard comtrade files which need further analysis of the human expert. Theknowledge of human expert will be used as the reasoning to analysis the correctnessof the relay perform. As the result related evaluation decision come out from theexpert will be compare with simulated scenario applied from RTDS. If the analysisresult is different from what is expected from the simulation system. The parametersof the relay will need further adjust to adopt with the line.For the testing of the relay usually 100-2000 shots would be applied which mean highcost of testing device if such test need to rerun for checking reset of parameters, alsoto analysis batch of shots will demand long working hours of human resource. Tosave the running time of the testing device as well as the working hours of humanexpertise an automatic system for relay testing under RTDS environment is urgentlyneeded. The ESARP (An Expert System for Automatic Relay Performance Analysis)
Figure 3.2: Closed loop testing of a physical relay
is developed as a post-mortem analysis for the fault which is recorded as ASCII com-trade format. The server system shall perform multi-files analysis of the comtradefiles and generate the report files into the final work space. In such system the anal-ysis of newly imported record by means of multi-files reading, signal decomposition,impedance dynamic performance calculation, identification of difference protection

16
zone. Also the automatic plotted impedance value and binary results are stored inthe same work place after the automatic analysis is performed. After automatic plot-ted result and recorded files were saved in the relevant destination, the access of thosedata is allowed by the testing controller. The users and experts can amend data andanalysis formulas through specific requirements shall be permit.The requirement of the system will be elicited from the human expert and the docu-ment provided from ABB. According to the requirement the system will be designedinto separate process. The priority and the importance of the detailed design alsowill be presented to fulfill the requirement of the ESARP system. As the followingtable shown is the elicited requirement of the system.
3.3.1 Multi-file reading
ID 3.3.1.1Requirement The Comtrade file address shall be au-
tomatically identifiedPriority HighImportance MustProcess Multi-files reading
ID 3.3.1.2Requirement Record DAT. File information into
Matlab workspacePriority HighImportance MustProcess Multi-files reading
ID 3.3.1.3Requirement Calculate the analog voltage and cur-
rent signals through IEEE standardPriority HighImportance MustProcess Multi-files reading
ID 3.3.1.4Requirement Plotted analog channel informationPriority MediumImportance ShallProcess Multi-files reading

17
3.3.2 Signal decomposition
ID 3.3.2.1Requirement Identify Trigger signalPriority HighImportance MustProcess Signal decomposition
ID 3.3.2.2Requirement Flexible time window for decomposed
resultPriority HighImportance MustProcess Signal decomposition
ID 3.3.2.3Requirement Comply with Multi-files reading func-
tionPriority HighImportance MustProcess Signal decomposition
ID 3.3.2.4Requirement All three phases analog signals shall be
calculatedPriority HighImportance MustProcess Signal decomposition
3.3.3 Dynamic performance of relay calculation
ID 3.3.3.1Requirement Obey ABB algorithmPriority HighImportance MustProcess Dynamic performance of relay calcula-
tion

18
ID 3.3.3.2Requirement Automatic saved R and X result value
in txt filePriority HighImportance MustProcess Dynamic performance of relay calcula-
tion
ID 3.3.3.3Requirement The dynamic of impedance value being
plottedPriority HighImportance MustProcess Dynamic performance of relay calcula-
tion
ID 3.3.3.4Requirement Plotted result of impedance value au-
tomatically savedPriority HighImportance MustProcess Dynamic performance of relay calcula-
tion
3.3.4 Identification of different protection zone
ID 3.3.4.1Requirement Initial Jar componentPriority HighImportance MustProcess Identification of different protection
zone
ID 3.3.4.2Requirement Read txt file with R and X valuePriority HighImportance MustProcess Identification of different protection
zone

19
ID 3.3.4.3Requirement Save each 60 sample value into separate
arrayPriority HighImportance MustProcess Identification of different protection
zone
ID 3.3.4.4Requirement Define protection domainPriority HighImportance MustProcess Identification of different protection
zone
ID 3.3.4.5Requirement Compare generate array with defined
domainPriority HighImportance MustProcess Identification of different protection
zone

20
Chapter 4
System design
4.1 Detail steps of the system
After elicit the requirement, detail steps of the system is further designed to fulfillthe functionality. Each process is designed as the above flow chart. From automaticperspective the close loop of the system guaranteed the whole reading, calculation andanalysis could be realized by just click one button. In the ESARP system the multi-file of Comtrade will be listed and identified first, then analog channel of currentand voltage will be extracted according to the IEEE standard. In the process ofextracting the analog channel the multiplier value should be add with data in theDAT file. The CT, VT value of the .DAT file need to be further considered fromdifferent views of the system. Since the project will be evaluated the performance ofthe relay. So the transformer value should be seen from the secondary side. The analogchannels should be saved in the matlab work space which is needed to be decomposedand further calculated for the dynamic performance of the relay. The fundamentalvalue will be calculated through the DFT filter from the saved value in the matlabworkspace. Such filter should be set with the variable time value so the flexibletime window could be prepared for different processes of fault behavior. The criticalpart of relay performance calculation will be executed according to ABB algorithmsafter all the extracted and filtered values are ready. The samples of calculated valueshould be plotted from selected time window and saved in the text file automaticallyas the data media transfer between the matlab and java/jess environment. Stepsillustrated above are performed in the matlab environment considering the complexfilter value calculation. To integrate matlab environment together with logic steps inthe Java environment. The compiler of matlab java builder is chosen as the tool forthe construction of ESARP system. In this builder matlab files will be wrapped upseparately in the compiler as class and function, after compiling Jar component willbe generated and used for the built up the system in the expert environment. Expertsystem then will initial the jar component and deploy the functions of the multi-filereading, signal decomposition, dynamic relay performance calculation. And the resultof the impedance value will be generated in the work space of expert system. Logicsteps for the analysis first will pick up the files generated from the jar component.Then each 60 samples will be saved in the separate array. Such array will be projectedinto the domain plane for the further comparison. The last step is expert advices willbe generating after comparison being done and advices will be saved in the documentas the final outcome of the system.

21
Figure 4.1: Detail steps of the build up expert system

22
4.2 Develop environment and component selection
To build up such system is to verify the relay performance through the extracted theanalog channel from multi-comtrade files to calculate the critical value by means ofsignal filtering and relay algorithm. That functionality is suitable to perform in thematlab which is numerical computing environment and fourth-generation program-ming language. Matlab allows matrix manipulation, plotting of function and data,implementation of algorithm, creation of user interfaces, and interfacing with pro-grams written in the other languages, including C, C++, Java and FORTRAN.For the further develop of the system as the robust rule based system. Rule enginebased platform JESS is considered for the developing specific logic for reasoning likerelay malfunction. When running the rule engine, rules are carried out also new datawill be created. Usually Jess library is embedding in the java code so Eclipse platformis chosen as the development environment to explore the features.Eclipse is the platform chosen for the system development considering is an integrateddevelopment environment and an extensible plug-in system. It can be develop appli-cation in JAVA by mean of various plug-INS such as the Matlab Jar component. TheEclipse SDK includes the Java development tools, offering an IDE with incrementalJava complier and Java Source files. The IDE also make use of the workspace whichallowing external file modification.Java installation needs to download Java JDK from web java.sun.com. After the JDKbeing appropriate installed system need to configure the environmental variable asthe same path with java bin setting. Then matlab should verify the java environmentby type version number and javac version, if the javac is installed, the version num-ber will be appeared from the command window. Also the work space of the matlabshould be the same as Java IED. So the comtrade files just need to be put into theworkspace then automatic analysis can be performed.
4.3 Multi Files Reading
The IEEE COMTRADE standard is a file format designed for time series data thatis established worldwide and is supported by standards making bodies. The set ofcomtrade files of a given event usually consist three types of files: HDR, CFG andDAT as the obligatory extension. It has a significant number of recording parame-ters that can be adapted for phasor data.[?] In this project the comtrade files are allgenerated from testing relay which means the specific form of Header, configurationand data files. The information contained in the file will be explained as following.Header files:The header file is an ASCII file contains textual information which the originatorwants to convey to the end user. The information related with simulation system, thepower system location, power system impedances, and transformer ratio is conveying

23
through generals, analog channel, binary channels, fault locations, and event chan-nels. In the generals channel, recorded ID, trigger information, sampling frequency,Line value, IED information are defined with specific data. The channel index num-ber, id, transformer rating value, trigger value and fault angle are all defined in theanalog channel. Also information regarding channeled, trigger level setting, triggerenable, value of trigger are set in the binary channels. Fault location loop, directionvalue can be check through fault locations channels and in the event channel mainlycontain the status change of the channel value.Configuration files.The CFG files is a pre-fixed ASCII format which contains information include thestation name, record for the simulation also defines the format of the DAT file. Thecrucial data as date and time, sampling rate, frequency, number and different chan-nels are saved. The CFG. File used in our project has the information of channelsand since the format is prefix, the possibility of multi-files reading for automatedprocessing is prepared. Since analog channel including crucial information regardingvoltage and current, the format as following shall be used.An, chid, ph, ccbm, uu, a, b, skew,min,max, primary, secondary, PS
Where
Anis analog channel index number. Critical, numeric, integer, minimum length = 1character, maximum length = 6 characters, minimum value = 1, maximum value =999999. Leading zeroes or spaces are not required. Sequential counter from 1 to totalnumber of analog channels without regard to recording device channel number.
chidis the channel identifier. Non-critical, alphanumeric, minimum length = 0 characters,maximum length = 64 characters.
phis the channel phase identification. Non-critical, alphanumeric, minimum length = 0characters, maximum length = 2 characters.
ccbmis the circuit component being monitored. Non-critical, alphanumeric, minimumlength = 0 characters, maximum length = 64 characters.
uuare the channel units (e.g., kV, V, kA, A). Critical, alphabetical, minimum length =1 character, maximum length = 32 characters. Units of physical quantities shall usethe standard nomenclature or abbreviations specified in IEEE Std 260.1-1993 [B4] orIEEE Std 280-1985 (R1996) [B5], if such standard nomenclature exists. Numericalmultipliers shall not be included. Standard multiples such as k (thousands), m (one

24
thousandth), M (millions), etc. may be used.
ais the channel multiplier. Critical, real, numeric, minimum length = 1 character,maximum Length = 32 characters. Standard floating point notation may be used(Kreyszig [B7]).
bis the channel offset adder. Critical, real, numeric, minimum length = 1 character,maximum length = 32 characters. Standard floating point notation may be used(Kreyszig [B7]).
The channel conversion factor is ax+b. The stored data value of x, in thedata (.DAT) file, corresponds to a sampled value of (ax+b) in units (uu) specifiedabove. The rules of mathematical parsing are followed such that the data sample xis multiplied by the gain factor a and then the offset factor b is added. Manipulationof the data value by the conversion factor restores the original sampled values.
skewis the channel time skew (in s) from start of sample period. Non-critical, real number,minimum length = 1 character, maximum length = 32 characters. Standard floatingpoint notation may be used (Kreyszig [B7]). The field provides information on timedifferences between sampling of channels within the sample period of a record. Forexample, in an eight-channel device with one A/D converter without synchronizedsample and hold running at a 1 ms sample rate, the first sample will be, at the time,represented by the timestamp; the sample times for successive channels within eachsample period could be up to 125s behind each other. In such cases the skew forsuccessive channels will be 0; 125; 250; 375...; etc.
minis the range minimum data value (lower limit of possible data value range) for datavalues of this channel. Critical, integer, numeric, minimum length = 1 character,maximum length = 6 characters, minimum value = -99999, maximum value = 99999(in binary data files the range of data values is limited to -32767 to 32767).
maxis the range maximum data value (upper limit of possible data value range) for datavalues of this channel. Critical, integer, numeric, minimum length = 1 character,maximum length = 6 characters, minimum value = -99999, maximum value = 99999(in binary data files the range of data values is limited to -32767 to 32767).
primaryis the channel voltage or current transformer ratio primary factor. Critical, real,numeric, minimum length = 1 character, maximum length = 32 characters.
25
secondaryis the channel voltage or current transformer ratio secondary factor. Critical, real,numeric, minimum length = 1 character, maximum length = 32 characters.
PSis the primary or secondary data scaling identifier. The character specifies whetherthe value received from the channel conversion factor equation ax+b will representa primary (P) or secondary (S) value. Critical, alphabetical, minimum length = 1character, maximum length= 1 character. The only valid characters are: p,P,s,S.The data in the data file, the channel conversion factors, and the channel units canrefer to either primary or secondary units. So, a 345 kV to 120 V transformer for achannel in which the units are kV will have the primary factor of 345 and a secondaryfactor of 0.12 (345, 0.12). The primary or secondary variable (PS) is provided as ameans to calculate the equivalent primary or secondary values in applications wherethe primary or secondary value is desired and the alternate value is provided. If thedata originate in an environment that has no primary/secondary relationship such asan analog power system simulator, the primary-secondary ratio shall be set to 1:1.With the determination of the primary (P) or secondary (S) values from the ax+bequation, the user can then determine the values required for analysis or playback.Data files.The DAT files contains the digital time tagged actual data samples which is recordedor simulated event. The discrete analog or logical sources recorded are saved in dif-ferent channels. Analog channels are analysis for the dynamic impedance calculation.The voltage and current value are presented in columns which corresponding to thetime rows. The data is stored in ASCII format as defined in the CFG file. For theautomated files reading the DAT files must conform exactly to the format of CFGfiles.After we obtain all of the information and format contains in the comtrade file, wecan start to decode the files. First we need to import data from the .cfg and .dat file.In this step, the files addresses are listing by using DIR command. After that throughderive the .dat file string, file name and path shall store into the matlab workspace.The text information can be scan into the local cells by opening the .cfg and .dat files.Detailed data will be extracting such as timestamps, analog channels information anddigital channel information after scaling. The final waveforms will be produced asthe post-process through data configuration according to IEEE standard. The savedchannels will be then used by the transferred relay model which will be specified nextchapter. By defining a globe variable the relay model and data extracting could beintegrated. And Through loop reading the function of data extracting the existingcomtrade file could be seen as testing batch injected into a relay model which in theformat of algorithm which reflect the behavior of the relay. The RTDS relay modelshows how the signals of analog channels are processed in the relay. Before the analogchannel signal entering into relay model the signal shall be filtered usually throughlow pass filter to remove the DC noise. Then the sampler will decide the sample
26
rate since the input signal usually is at a much higher sampler rate than the actualrate for protection algorithm. And a PLL in the figure is used for performing thefrequency tracking to adjust the sampling rate. So the protection algorithm couldbe synchronous with the system frequency. The signals then will enter into the fullcycles discrete Fourier transform filter to extract the fundamental values. A full cyclediscrete Fourier transform can be used to create the real and imaginary values forthe phasor representation of values that will be used for the further calculation of theimpedance magnitudes. The single phase quantities can be used to create the phaseto phase values for the necessary calculation of the phase to phase impedance values.For the calculation of phase-to-ground impedance of fault include the ground thesingle phase current quantities are selected to create the zero sequence current thenmultiplied by the K0 factor. The value of zero sequence compensation is necessaryto calculate the correct magnitude of phase to ground impedance for faults which isdetermined by the positive sequence impedance and zero sequence impedance of thetransmission line. The last step is the magnitude quantities calculated are used forthe phase to phase and phase to ground fault according to the vendors algorithms.
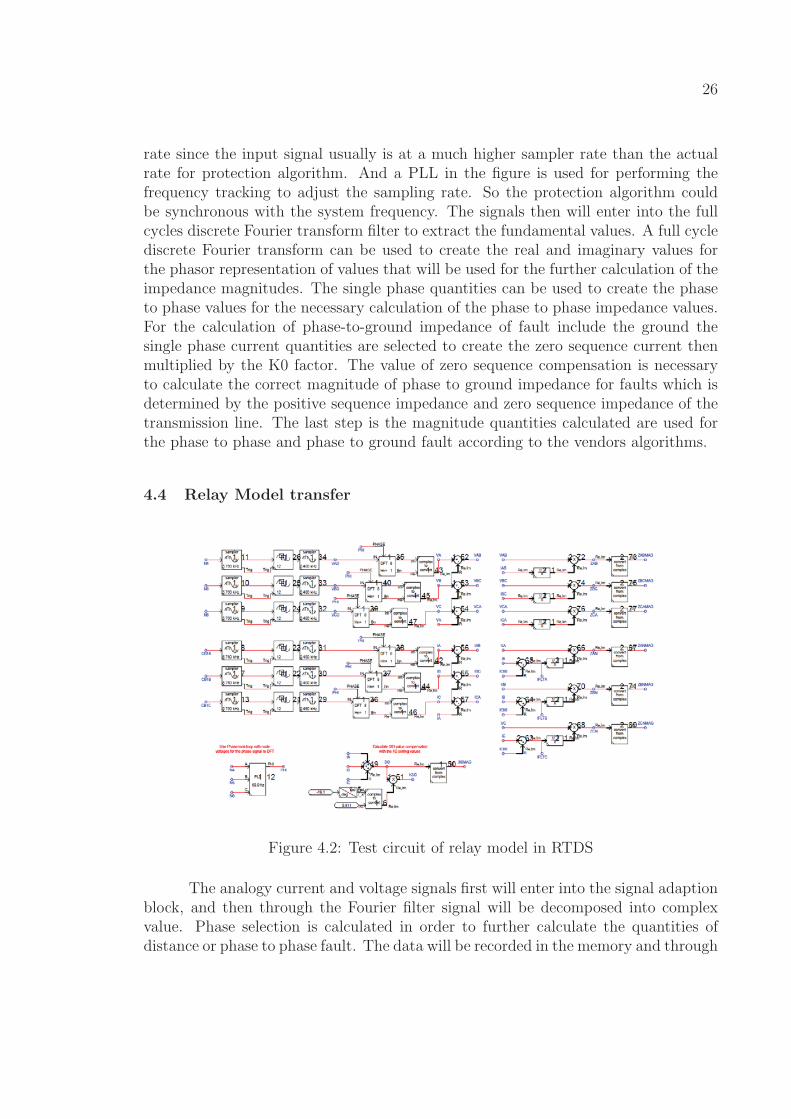
4.4 Relay Model transfer
Figure 4.2: Test circuit of relay model in RTDS
The analogy current and voltage signals first will enter into the signal adaptionblock, and then through the Fourier filter signal will be decomposed into complexvalue. Phase selection is calculated in order to further calculate the quantities ofdistance or phase to phase fault. The data will be recorded in the memory and through
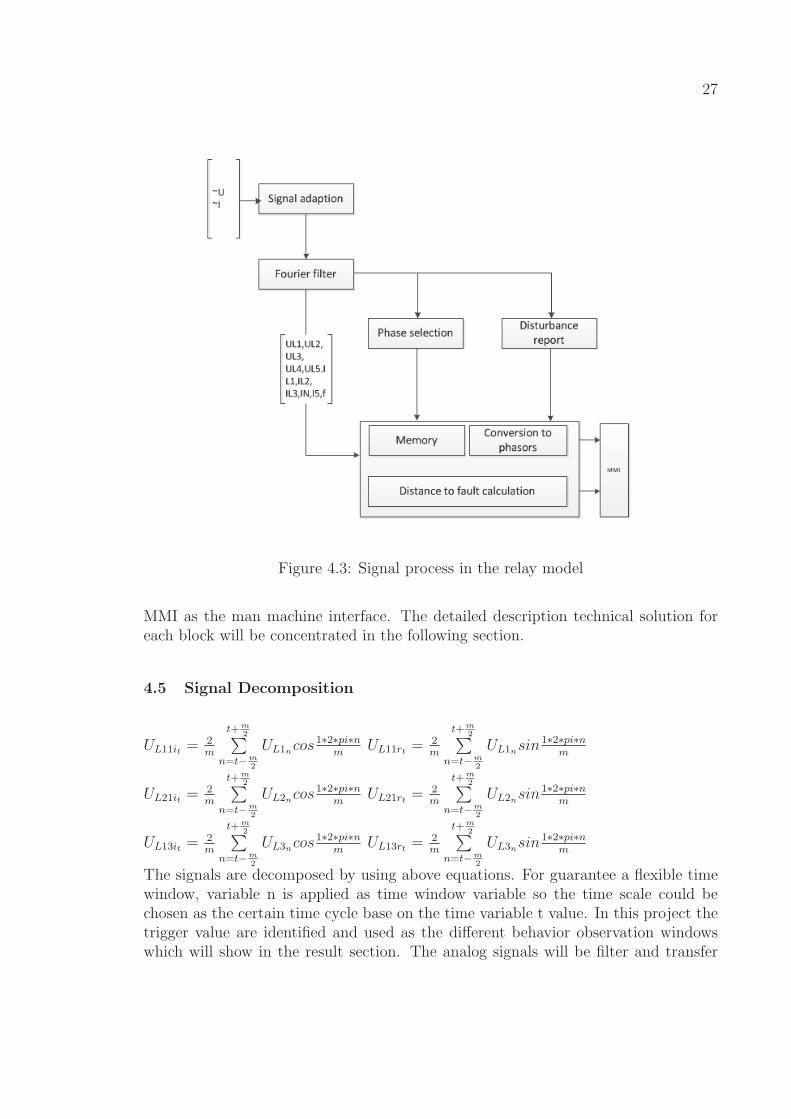
27
Figure 4.3: Signal process in the relay model
MMI as the man machine interface. The detailed description technical solution foreach block will be concentrated in the following section.
4.5 Signal Decomposition
UL11it =2m
t+m2∑
n=t−m2
UL1ncos1∗2∗pi∗n
mUL11rt =
2m
t+m2∑
n=t−m2
UL1nsin1∗2∗pi∗n
m
UL21it =2m
t+m2∑
n=t−m2
UL2ncos1∗2∗pi∗n
mUL21rt =
2m
t+m2∑
n=t−m2
UL2nsin1∗2∗pi∗n
m
UL13it =2m
t+m2∑
n=t−m2
UL3ncos1∗2∗pi∗n
mUL13rt =
2m
t+m2∑
n=t−m2
UL3nsin1∗2∗pi∗n
m
The signals are decomposed by using above equations. For guarantee a flexible timewindow, variable n is applied as time window variable so the time scale could bechosen as the certain time cycle base on the time variable t value. In this project thetrigger value are identified and used as the different behavior observation windowswhich will show in the result section. The analog signals will be filter and transfer

28
into complex value through such equations and further calculated for the dynamicperformance of relay by using ABB algorithms.
4.6 Matlab Java Builder
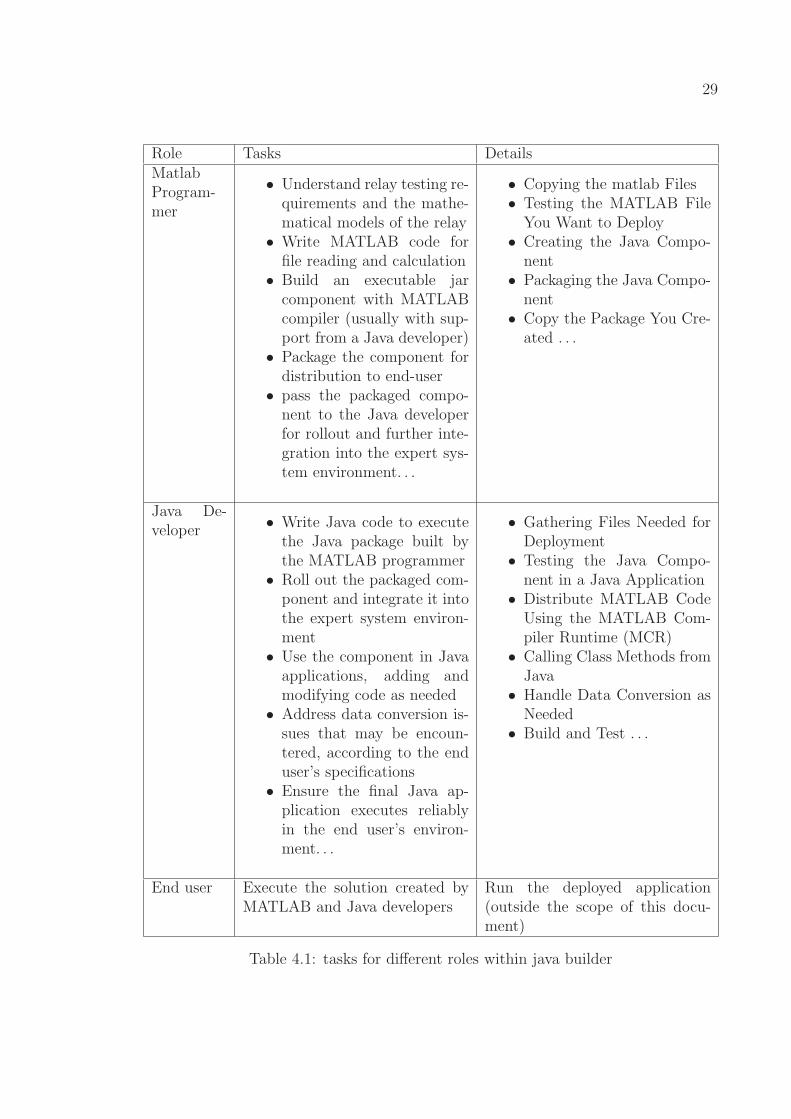
Matlab builder JA enables to create a Java classes within MATLAB programs. Thejar component can be integrated into Java programming as well as deployed with desk-top computer or web servers which do not have MATLAB installed. Such componentmakes MATLAB based computation, visualization and graphical user interface de-ployable and accessible to the end users of java program. The component behavesjust like Java class. So it can be run on the all the platform support MATLAB.[13]The jar files depend on javabuilder.jar which ship with toolbox.java builder.jar whenis instantiated as series events occur.a) Load dependent class in javabuilder.jar.b) The initialization of such classes will trigger the loading of the shared librarieswhich will implement a number of native methods which form the bridge from gen-erated MATLAB builder JA to the Compiler runtime implementation.c) After the shared libraries are loaded the MATLAB runtime is initialized by creat-ing an instance of C++ class.d) Such MCR (Matlab Compiler Runtime) instance triggers the initialization of manysubsystems. One of the subsystems is the MATLAB-Java interface which allowsMATALB to call JAVA directly. When the MCR is loaded into a running JVM, thematlab-Java interface established a connection to the running JVM by calling AttachCurrent Thread.e) Attach Current Thread is a class that loads all classes needed by MATLAB utiliz-ing the interface of Matlab-java.Notice that deploying support for the component shall under the condition of accesswith run time on end user machine. So the created installer for the application shallsupport Java on target machine which means MCR must be installed.Such project demanding different roles in charge of different task as following tableshown, at the beginning of the project end user requirement need to be elicited andsatisfied by matlab coding and Java programming. Then for the MATLAB builderand Java developer tasks are divided into details. The final solution that created andtested shall be executable for the end user after the whole project developed.
29
Role Tasks DetailsMatlabProgram-mer
• Understand relay testing re-quirements and the mathe-matical models of the relay
• Write MATLAB code forfile reading and calculation
• Build an executable jarcomponent with MATLABcompiler (usually with sup-port from a Java developer)
• Package the component fordistribution to end-user
• pass the packaged compo-nent to the Java developerfor rollout and further inte-gration into the expert sys-tem environment. . .
• Copying the matlab Files• Testing the MATLAB FileYou Want to Deploy
• Creating the Java Compo-nent
• Packaging the Java Compo-nent
• Copy the Package You Cre-ated . . .
Java De-veloper
• Write Java code to executethe Java package built bythe MATLAB programmer
• Roll out the packaged com-ponent and integrate it intothe expert system environ-ment
• Use the component in Javaapplications, adding andmodifying code as needed
• Address data conversion is-sues that may be encoun-tered, according to the enduser’s specifications
• Ensure the final Java ap-plication executes reliablyin the end user’s environ-ment. . .
• Gathering Files Needed forDeployment
• Testing the Java Compo-nent in a Java Application
• Distribute MATLAB CodeUsing the MATLAB Com-piler Runtime (MCR)
• Calling Class Methods fromJava
• Handle Data Conversion asNeeded
• Build and Test . . .
End user Execute the solution created byMATLAB and Java developers
Run the deployed application(outside the scope of this docu-ment)
Table 4.1: tasks for different roles within java builder

30
4.7 Logic steps in Expert environment
For the automatic system matlab workspace should be set as the same workspaceof expert system environment. So the file identify, data media generated and resultsaved can be easily accessed.The data media generated in our case is the value of impedance and reactance. Afterthe value being generated the expert system will read from the data media and saveeach 60 samples into the each array in the work space. Such array will stand for thedynamic relay value and will project into the relay plane for comparison. Differentarray project into different relay plane will generate different expert advice and theadvice will be saved automatically. Such file will be used as the further comparisonof RTDS simulation condition. Then if the relay has faulted perform. Parameterswhich shown in the above table need to be reset, then we shall test the relay againto guarantee the relay performance.

31
Chapter 5
System function result
5.1 Analog signals channel plotted
The precondition of the test system is P=381MW Q=-36.9 MVAr export from leftside. Pre-fault current 0.56kA.90 deg inception, CT, VT value are 1000/1 and400kV/100kV. L1 to ground fault and different indication should be given as 0
Figure 5.1: Analog signals channel plotted
5.2 Impedance dynamic performance with corresponding time scale
As shown in the plotted figure the analog signal extract from the Comtrade files willbe used as the source for the relay performance calculation. The different analogchannels are indicated by using different color function. From the figure we can easilysee that from 0.1-0.2 time scale the disturbance happen in the relay. Such triggersignal is very important for diagnose of the dynamic performance of relay. We will
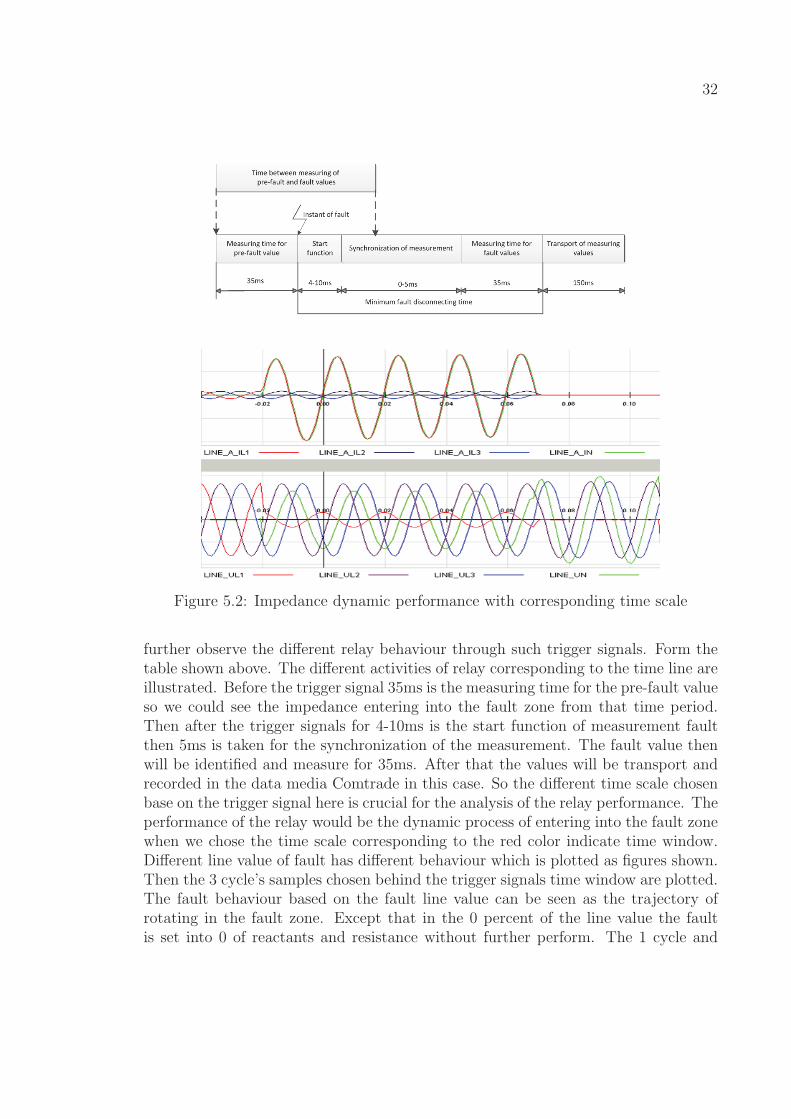
32
Figure 5.2: Impedance dynamic performance with corresponding time scale
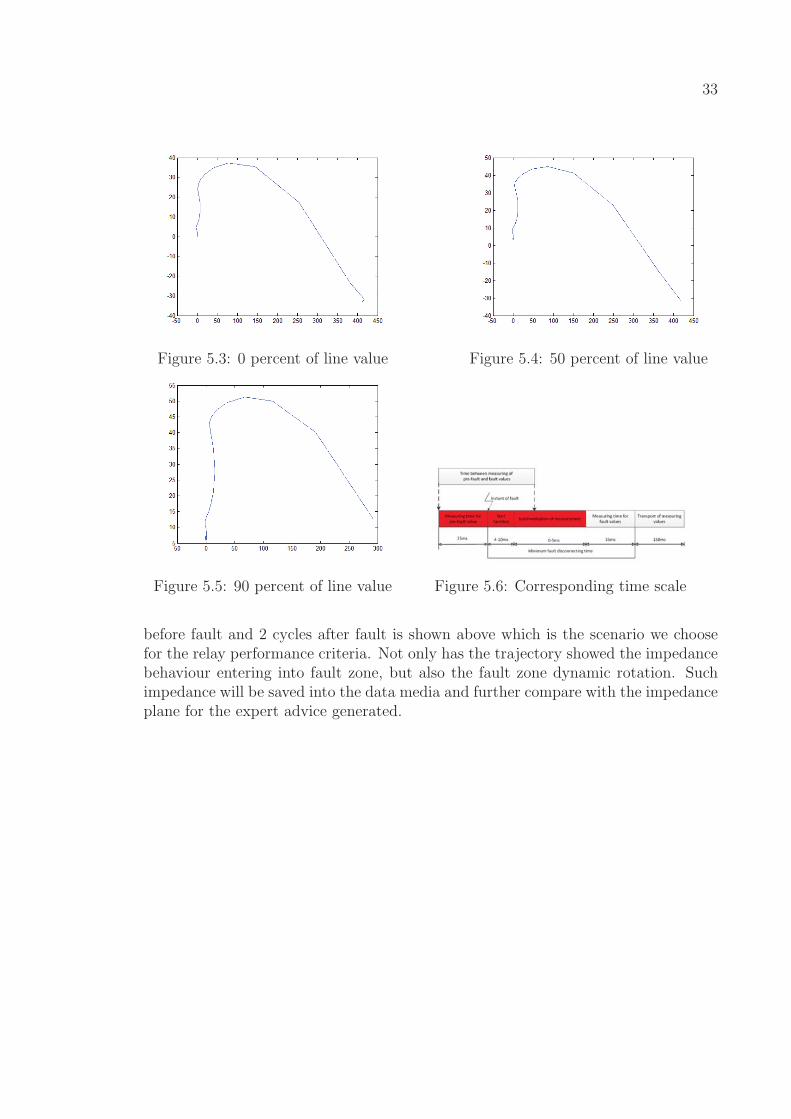
further observe the different relay behaviour through such trigger signals. Form thetable shown above. The different activities of relay corresponding to the time line areillustrated. Before the trigger signal 35ms is the measuring time for the pre-fault valueso we could see the impedance entering into the fault zone from that time period.Then after the trigger signals for 4-10ms is the start function of measurement faultthen 5ms is taken for the synchronization of the measurement. The fault value thenwill be identified and measure for 35ms. After that the values will be transport andrecorded in the data media Comtrade in this case. So the different time scale chosenbase on the trigger signal here is crucial for the analysis of the relay performance. Theperformance of the relay would be the dynamic process of entering into the fault zonewhen we chose the time scale corresponding to the red color indicate time window.Different line value of fault has different behaviour which is plotted as figures shown.Then the 3 cycle’s samples chosen behind the trigger signals time window are plotted.The fault behaviour based on the fault line value can be seen as the trajectory ofrotating in the fault zone. Except that in the 0 percent of the line value the faultis set into 0 of reactants and resistance without further perform. The 1 cycle and
33
Figure 5.3: 0 percent of line value Figure 5.4: 50 percent of line value
Figure 5.5: 90 percent of line value Figure 5.6: Corresponding time scale
before fault and 2 cycles after fault is shown above which is the scenario we choosefor the relay performance criteria. Not only has the trajectory showed the impedancebehaviour entering into fault zone, but also the fault zone dynamic rotation. Suchimpedance will be saved into the data media and further compare with the impedanceplane for the expert advice generated.

34
Figure 5.7: 0 percent of line value Figure 5.8: 50 percent of line value
Figure 5.9: 90 percent of line value Figure 5.10: Corresponding time scale

35
Figure 5.11: 0 percent of line value Figure 5.12: 50 percent of line value
Figure 5.13: 90 percent of line value Figure 5.14: Corresponding time scale
36
5.3 Automatic saved value of resistance and reactants
After all the files reading and data extraction the samples will be calculated accordingto the ABB algorithm. The result of 60 samples of resistance and reactants will beautomatically saved into a txt file. Such data could be further used in other programfor analysis. Also saved data can be the resource of research related whether algorithmof optimal parameters resetting could be developed.
5.4 Evaluate from Expert advice
The expert advice will be the finally result as the system being saved in the txt file.Such result can be compare with the simulated scenario applied on the relay. If thedifference between what relay seen from the fault and what fault applied appear. Theanalysis related with relay parameters will be interfere with the relay.

37
Chapter 6
Future work
6.1 User friendly interface
A user interface needs to develop with the chosen parameters and time window whichthe test people want to observe.
6.2 Robust rule based system
The mal-operation of the relay could have different reasoning:
1. relay is affected by the remote end in feed.
2. when the 3I on parallel line have the same direction as 3I on protected line itwill cause the distance protection to under reach.
3. No start of PHS (phase selection) . . .
Due to the time issue, the system is not fully developed as the phase selectionand directional element need to be added. After the system have fully functions, thesystem could further evolved into the robust rule based system based on artificialintelligent software JESS which has the pattern match reasoning function. The rulebase function system would be more intelligent and more resourced will be saved bysuch system.
6.3 GUI function for adoptive domains define
The zone 3 value usually shows the relay has the domain which needs to be reset. If aGUI function has the dynamic domain reset will be more human interactive. The usercould use such function get more straight forward information of relay performance.
6.4 Optimized parameter resetting for executing analysis
Since the whole system is about to adjust the relay parameters. The saved value of theimpedance could be used as the future analysis. The optimization of the parameterresetting for executing analysis may develop through saved values.

38
Chapter 7
Conclusions
In this project. The ESARP system which has the functionality of multi Comtradefiles reading,signal decomposition, impedance dynamic calculation and indication ofdifference protection zone is achieved. Such system shall benefit the relay testingprocess with time saving of both human analysis and testing devices. Such systemis highly replicable and can be modular into a highly reusable tool which assist thehuman expert to enhance the working efficiency.

39
Chapter 8
Discussion
The next step of the system development will be implement with other functionalityof fault phase selection, direction element of protection and load encroachment. Afterthe fully function developed the system shall testing and integrate with the testingprocess. The possibility of system generated alarm signal and stop testing processshall be discussed. Also to much the into a more intellectual level shall be the futurework to assist the human expert.

40
Bibliography
[1] A. Apostolov and B. Vandiver, “Ensuring the correct operation of distance relaysunder dynamic system conditions,” in Protective Relay Engineers, 2008 61stAnnual Conference for, pp. 72–77, IEEE, 2008.
[2] A. Apostolov, “Effective and efficient testing of multifunctional protection ieds,”in Protective Relay Engineers, 2012 65th Annual Conference for, pp. 382–388,IEEE, 2012.
[3] A. Apostolov and B. Vandiver, “Maintenance testing of multifunctional distanceprotection ieds,” in Transmission and Distribution Conference and Exposition,2010 IEEE PES, pp. 1–6, IEEE, 2010.
[4] W. Zhang, S. Lee, M. Choi, and S. Oda, “Considerations on distance relaysetting for transmission line with statcom,” in Power and Energy Society GeneralMeeting, 2010 IEEE, pp. 1–5, IEEE, 2010.
[5] Z. Li, S. Sheng, S. Richards, and P. Sankarakumar, “Automated test solutionsfor multifunctional protection relays,” in Developments in Power Systems Pro-tection, 2012. DPSP 2012. 11th International Conference on, pp. 1–5, IET, 2012.
[6] M. Kezunovic, Y. Xia, Y. Guo, C. Fromen, and D. Sevcik, “Distance relay ap-plication testing using a digital simulator,” Power Delivery, IEEE Transactionson, vol. 12, no. 1, pp. 72–82, 1997.
[7] A. Abdlrahem and H. Sherwali, “Modelling of numerical distance relays usingmatlab,” in Industrial Electronics & Applications, 2009. ISIEA 2009. IEEE Sym-posium on, vol. 1, pp. 389–393, IEEE, 2009.
[8] R. technologies, “Rtds@ONLINE,” Nov. 2012.
[9] A. manual, “distance protection,” in Section 6, pp. 116–297, IEEE.
[10] A. Phadke, J. Jodice, M. Adamiak, J. Brandt, J. Bright, R. Burnett Jr, C. Cas-tro, T. Cease, D. Clark, and G. Clough, “Comtrade; a new standard for commonformat for transient data exchange,” IEEE Transactions on Power Delivery (In-stitute of Electrical and Electronics Engineers);(United States), vol. 7, no. 4,1992.
[11] X. Luo and M. Kezunovic, “An expert system for diagnosis of digital relay oper-ation,” in Intelligent Systems Application to Power Systems, 2005. Proceedingsof the 13th International Conference on, pp. 6–pp, IEEE, 2005.

41
[12] J. Bekker and P. Keller, “Enhancement of an expert system philosophy for au-tomatic fault analysis,” in Proceedings of 11th Annual Georgia Tech Fault andDisturbance Analysis Conference, 2008.
[13] D. Oswill, “Matlab javabuilder@ONLINE,” June 1994-2012.


