AN EXPLORATORY FACTOR ANALYSIS OF THE HUMAN BEHAVIOR RATING SCALE Except where reference is made to the work of others, the work described in this dissertation is my own or was done in the collaboration with my advisory committee. This dissertation does not include proprietary or classified information. __________________________________ Suzanne Woods-Groves Certificate of Approval: Craig B. Darch Ronald C. Eaves, Chair Professor Professor Rehabilitation and Special Education Rehabilitation and Special Education Anthony J. Guarino Caroline Dunn Associate Professor Professor Educational Foundations, Rehabilitation and Special Education Leadership and Technology E. Davis Martin Jr. Joe F. Pittman Professor Interim Dean Rehabilitation and Special Education Graduate School
Transcript
AN EXPLORATORY FACTOR ANALYSIS OF THE
HUMAN BEHAVIOR RATING SCALE
Except where reference is made to the work of others, the work described in this dissertation is my own or was done in the collaboration with my advisory committee.
This dissertation does not include proprietary or classified information.
Certificate of Approval: Craig B. Darch Ronald C. Eaves, Chair Professor Professor Rehabilitation and Special Education Rehabilitation and Special Education Anthony J. Guarino Caroline Dunn Associate Professor Professor Educational Foundations, Rehabilitation and Special Education Leadership and Technology E. Davis Martin Jr. Joe F. Pittman Professor Interim Dean Rehabilitation and Special Education Graduate School
AN EXPLORATORY FACTOR ANALYSIS OF THE
HUMAN BEHAVIOR RATING SCALE
Suzanne Woods-Groves
A Dissertation
Submitted to
the Graduate Faculty of
Auburn University
in Partial Fulfillment of the
Requirements for the
Degree of
Doctor of Philosophy
Auburn, Alabama
August 4, 2007
iii
AN EXPLORATORY FACTOR ANALYSIS OF THE
HUMAN BEHAVIOR RATING SCALE
Suzanne Woods-Groves
Permission is granted to Auburn University to make copies of this dissertation at its discretion, upon request of individuals or institutions at their expense.
This paper reviews 27 theories of human behavior. The theories were categorized
as arousal, affect, and cognitive; each addressed a certain aspect of human behavior in a
discrete manner. Eaves (1993b) proposed an Integrated Theory of Human Behavior that
tied together existing theories that were undergirded by empirical support. Eaves
described human behavior as consisting of arousal, affect, and cognition. His previous
studies were reviewed that tested aspects of his theory. This study examined the internal
consistency and construct validity of a new instrument, the Human Behavior Rating
Scale, HBRS (2002) that was designed to aid in testing Eaves’ theory.
v
Forty-four sixth, seventh, and eighth grade teachers from two rural southern
counties completed a HBRS for 320 of their students. Cronbach’s alpha was used to
examine the internal consistency for each grade: for the five dimensions of the HBRS:
persistence, curiosity, externalizing affect, internalizing affect, and cognition. Reliability
coefficients ranged from .91 to .98.
The 94 items of the HBRS were used to construct three parcels for each of the
five dimensions. The 15 parcels were then submitted to an exploratory factor analysis
where principal axis factor analysis was employed. The Kaiser-Meyer-Olkin index of
sampling adequacy was .90 for the sample, indicating that the data represented a
homogeneous collection of variables suitable for factor analysis. Bartlett’s test of
sphericity was significant for the sample χ2 (105, N = 320) = 6961.33, p < .0001, which
indicated that the set of correlations in the correlation matrix was significantly different
from zero and suitable for factor analysis.
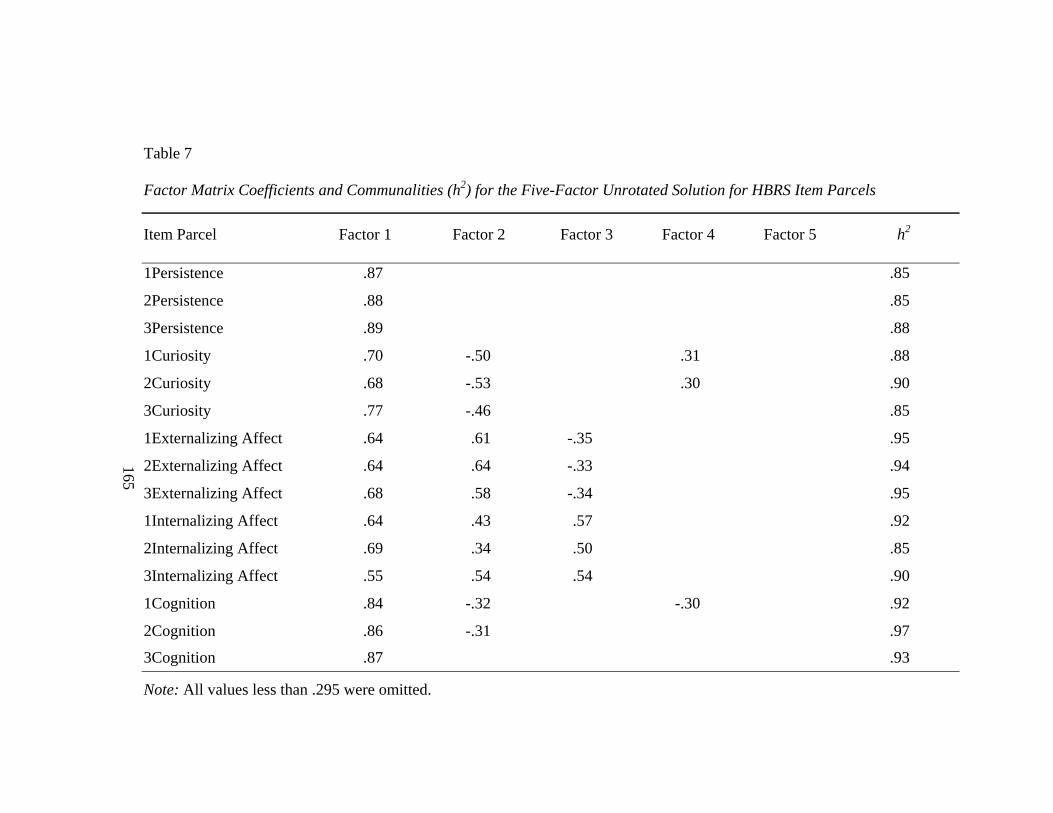
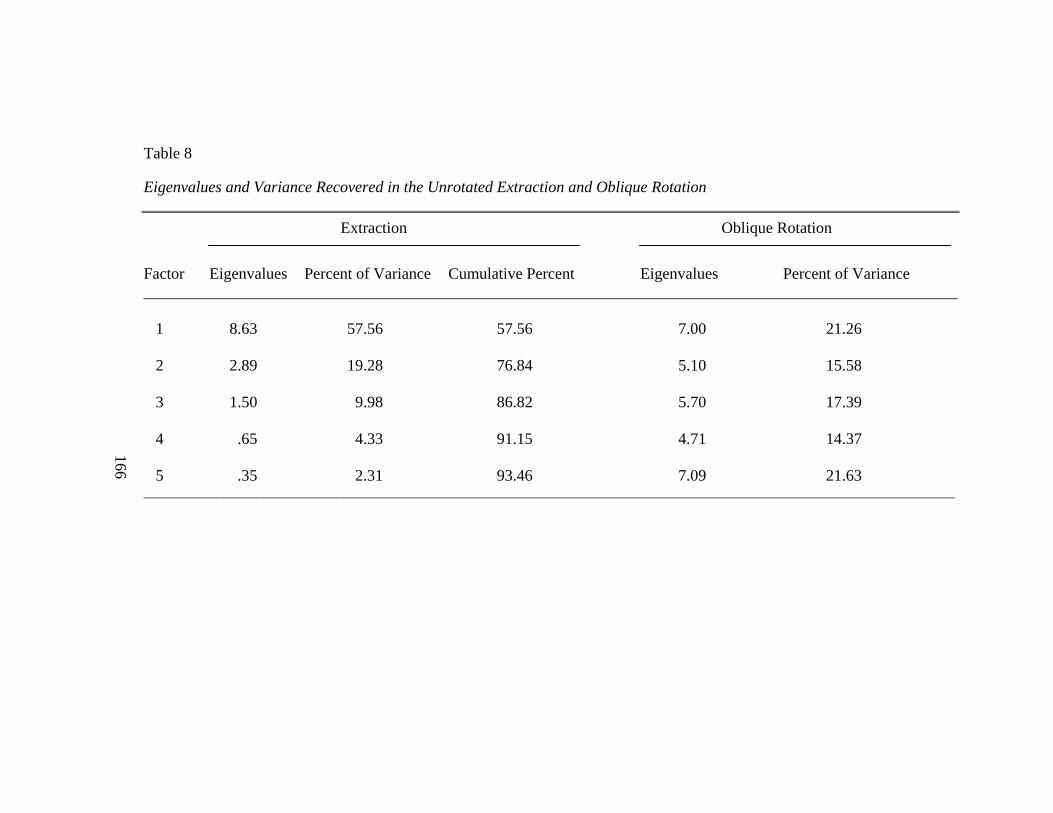
A scree plot identified five factors. Communalities ranged from .85 to .96. An
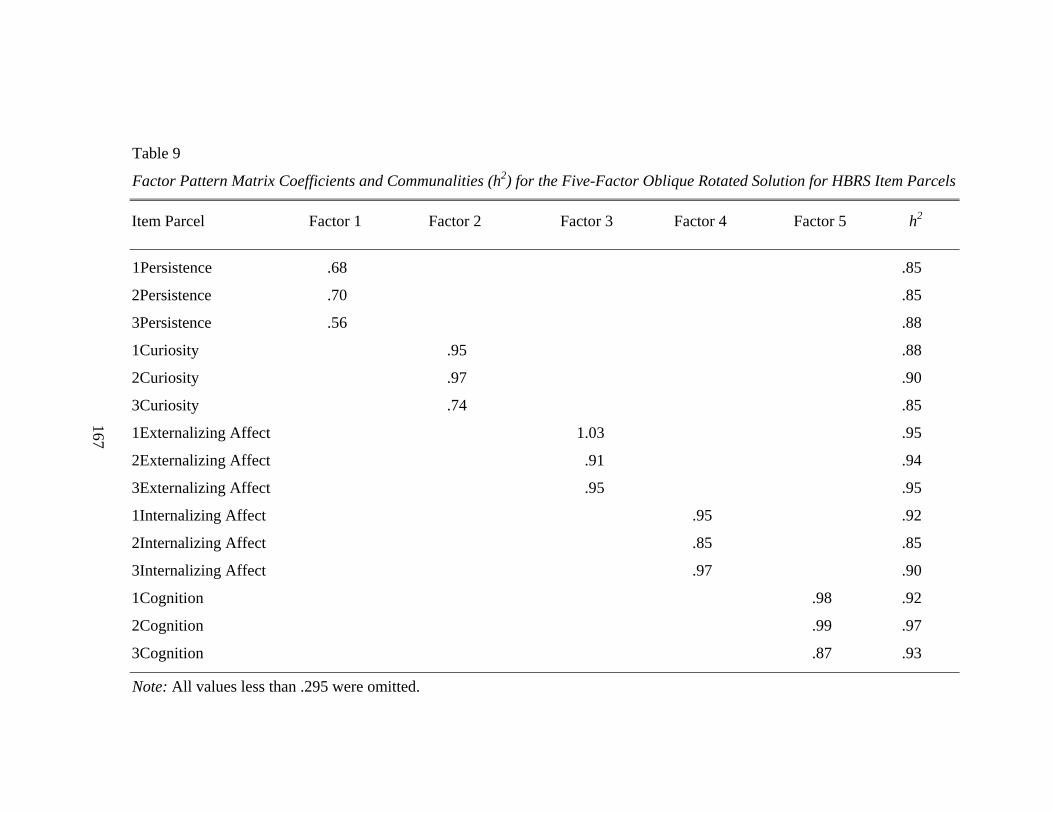
oblique Promax rotation was applied and a five-factor solution was revealed that
recovered 90.24% of the total variance. Each of the three parcels loaded saliently on their
respective factors; persistence, curiosity, externalizing affect, internalizing affect, and
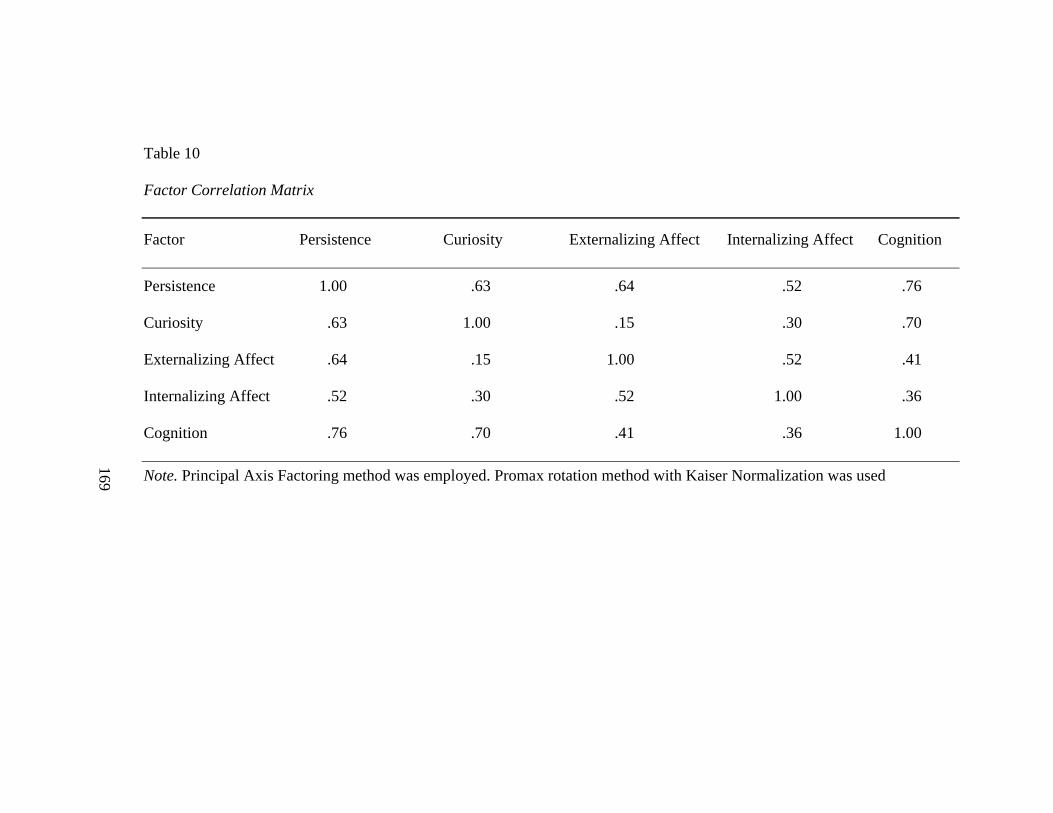
cognition. Pattern matrix coefficients ranged from .56 to 1.03. Intercorrelations between
factors ranged from .15 to .76. The results of this study provided support for the
reliability and construct validity of the HBRS for use with populations similar to the
sample employed.
vi
ACKNOWLEDGEMENTS
I wish to acknowledge and express my sincere gratitude to my committee
members, Dr. Ronald C. Eaves, Dr. Craig Darch, Dr. Anthony Guarino, Dr. Caroline
Dunn, Dr. E. Davis Martin and department chair Dr. Philip Browning for their continued
support throughout my graduate studies. I would like to specifically thank my major
professor and chair of my dissertation committee, Dr. Ronald C. Eaves for his patience,
support, supervision, assistance, and encouragement, all of which have facilitated the
development and completion of my dissertation. I would also like to thank Dr. Thomas
Bice and Mr. Leonard Riley for allowing data to be collected in their respective school
systems. They were extremely gracious and supportive in this process. Finally, I wish to
express my gratitude to the following individuals for assisting in data collection for this
study: Carolyn Speaks, Diane Sheriff, all the principals, and the teachers who participated
in completing the Human Behavior Rating Scales.
vii
Style manual or journal used: Publication Manual of the American Psychological
Association, 5th Edition.
Computer software used: SPSS 11, Windows 2000, and Microsoft Word 2004
viii
TABLE OF CONTENTS Page LIST OF TABLES..................................................................................................... xiii I. INTRODUCTION ......................................................................................... 1 Relevance of the Problem .............................................................................. 3 Background of the Problem ........................................................................... 5 Purpose of the Study ...................................................................................... 6 II. LITERATURE REVIEW .............................................................................. 8 Historical Perspectives: An Overview of Theories........................................ 11 Arousal........................................................................................................... 11 Arousal History.................................................................................. 11 Ivan P. Pavlov ........................................................................ 13 Eugene N. Sokolov ................................................................ 14 Robert B. Malmo ................................................................... 18 John Lacey ............................................................................. 18 Daniel Berlyne ....................................................................... 21 Geraldine Dawson and Arthur Lewy ..................................... 26 Physiological Measures of Arousal ....................................... 28 Summary of Arousal History ............................................................. 28 Affect ............................................................................................................ 29 Affect History .................................................................................... 29 Edward L. Thorndike ............................................................. 30 John B. Watson ...................................................................... 31 Clark L. Hull .......................................................................... 33 Sigmund S. Freud .................................................................. 36 Burrhus F. Skinner ................................................................. 41 Jeffery A. Gray....................................................................... 45 Joseph LeDoux....................................................................... 48
ix
Summary of Affect History ............................................................... 52 Cognition........................................................................................................ 53 Cognitive History............................................................................... 53 Cognitive Theorists............................................................................ 57 Psychometric Theorists...................................................................... 57 Charles E. Spearman.............................................................. 58 Arthur Jensen ......................................................................... 59 Louis L. Thurstone................................................................. 59 Raymond B. Cattell................................................................ 60 John Horn............................................................................... 62 John B. Carroll ....................................................................... 62 Philip E. Vernon..................................................................... 63 Joy P. Guilford ....................................................................... 64 Ecological Theorists........................................................................... 65 Alexander R. Luria................................................................. 66 Robert J. Sternberg................................................................. 68 Howard Gardner..................................................................... 71 Stephen J. Ceci....................................................................... 72 Summary of Cognition....................................................................... 73 Eaves’ Integrated Theory of Human Behavior .............................................. 74 The Significance of Evolution ....................................................................... 75 Adaptive Advantage, Natural Selection, and Survival of the Fittest . 75 Environmental and Morphological Change ....................................... 75 Central Nervous System Components ............................................... 77 The Motor System.................................................................. 77 The Sensory System and Bilaterality..................................... 78 The Arousal and Attention System........................................ 79 The Affective System ............................................................ 80 The Cognitive System............................................................ 83 The Significance of Human Neurological Structures .................................... 85 The Role of Memory.......................................................................... 86 The Significance of Memory ................................................. 86 Types of Memory................................................................... 87
x
Semantic Memory...................................................... 87 Episodic Memory....................................................... 88 Limbic and Cortical Memory..................................... 89 Neurological Behavior Control.............................................. 89 Limbic Behavioral Strategies..................................... 91 Cortical Behavioral Strategies ................................... 92 A Hypothesis to Explain Hemispheric Asymmetry............... 93 Consciousness ........................................................................ 95 Linguistic Consciousness vs Phylogenetic Consciousness ...................................... 95 The Problem of the Self, Consciousness, and Behavioral Control .............................................. 96 Critical Periods................................................................................... 98 Evidence for Critical Periods ................................................. 98 Implications for Critical Periods for Human Behavior.......... 100 Culture, Neurology, and Human Behavior ........................................ 100 The Socialization of a Species ............................................... 100 Culture and the Right Hemisphere......................................... 102 Summary of Eaves’ Integrated Human Behavior Theory.............................. 103 VST Studies ....................................................................................... 106 Visual Similes Test I.............................................................. 106 Visual Similes Test II............................................................. 108 Reliability............................................................................... 111 Validity .................................................................................. 111 Pervasive Developmental Disorder Rating Scale Studies ................. 117 Psychotic Behavior Rating Scale ........................................... 117 Pervasive Developmental Disorder Rating Scale .................. 119 Reliability............................................................................... 120 Content Validity..................................................................... 121 Criterion-Related Validity ..................................................... 121 Construct Validity.................................................................. 125
xi
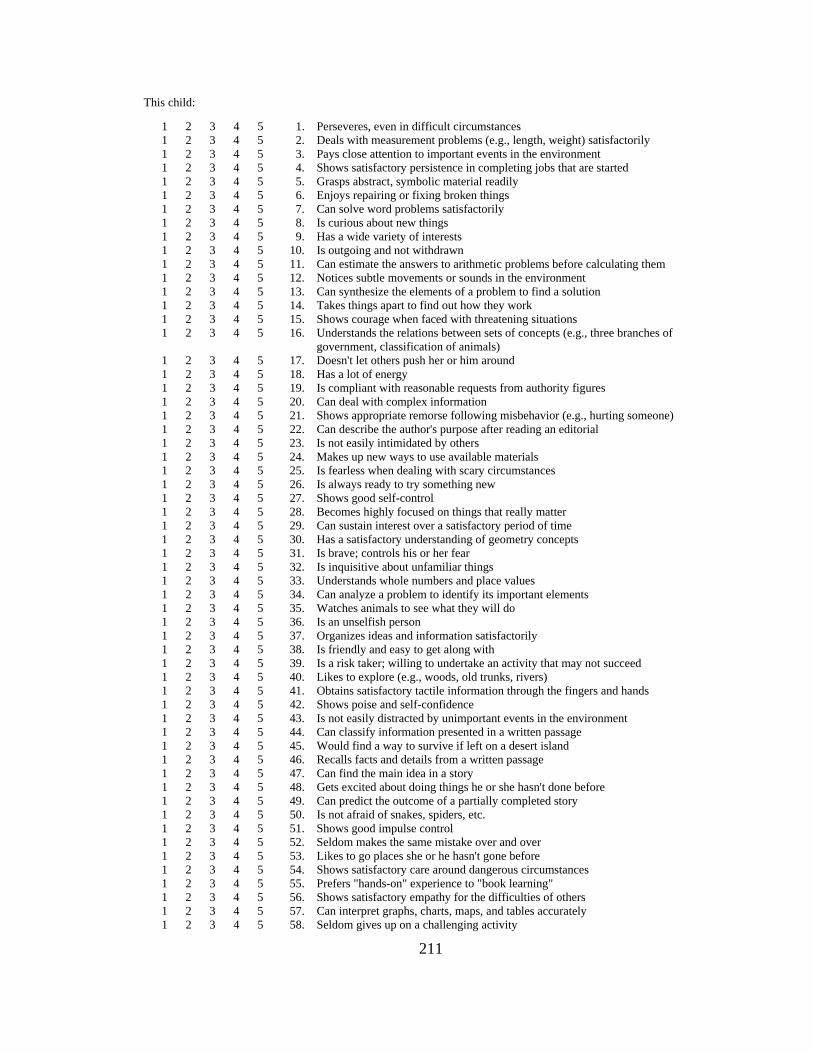
Conclusion ..................................................................................................... 130 III. METHOD ...................................................................................................... 135 Sample............................................................................................................ 135 Sampling Plan .................................................................................... 135 Participants......................................................................................... 136 Instrument ...................................................................................................... 138 Pilot Study.......................................................................................... 139 Procedure ....................................................................................................... 142 Data Analysis ................................................................................................. 144 Reliability........................................................................................... 144 Construct Validity.............................................................................. 145 Research Objectives....................................................................................... 146 IV. RESULTS ...................................................................................................... 147 Descriptive Statistics...................................................................................... 147 Reliability....................................................................................................... 151 Construct Validity.......................................................................................... 152 Exploratory Analysis ..................................................................................... 160 V. DISCUSSION................................................................................................ 170 Speculative Implications for the Integrated Theory of Human Behavior ............................................................... 173 Limitations ..................................................................................................... 177 Future Research ............................................................................................. 179 Implications.................................................................................................... 183 REFERENCES .......................................................................................................... 188 APPENDICES ........................................................................................................... 208 Appendix A: The Human Behavior Rating Scale........................................ 209 Appendix B: Parental Consent/Child-Assent for Alexander City............... 213 Appendix C: Parental Consent/Child-Assent for Chambers County .......... 215 Appendix D: IRB Approval Letter for Study .............................................. 217
xii
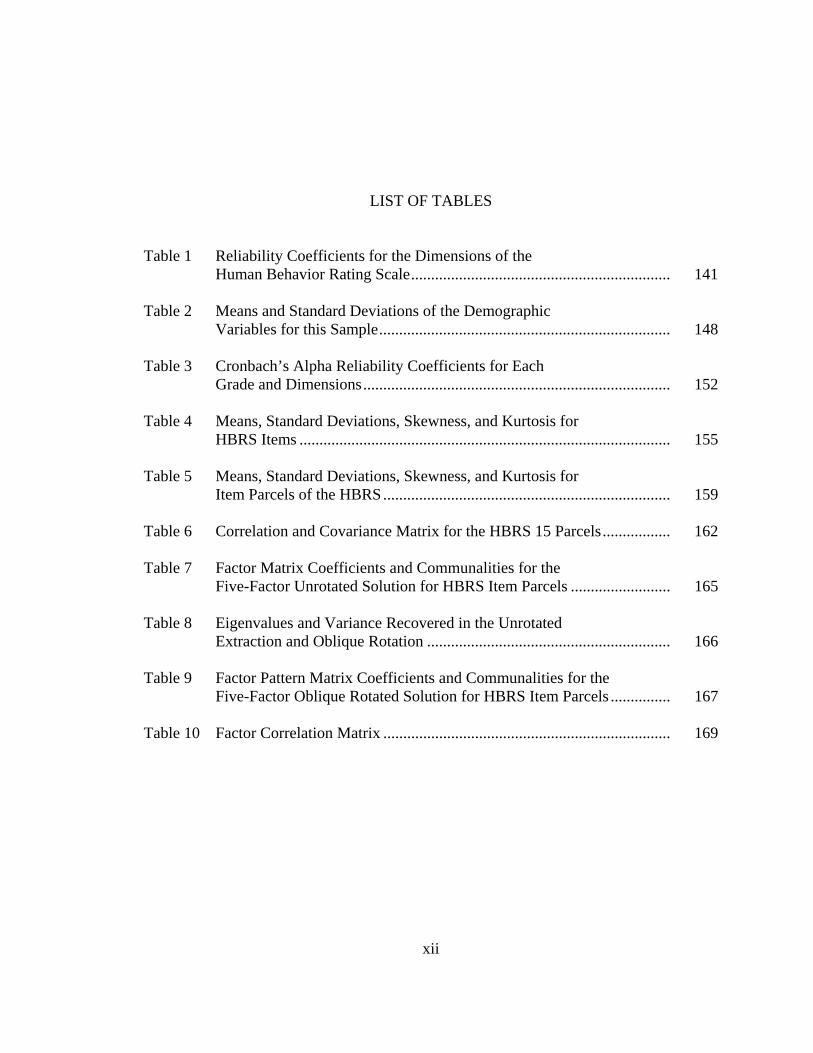
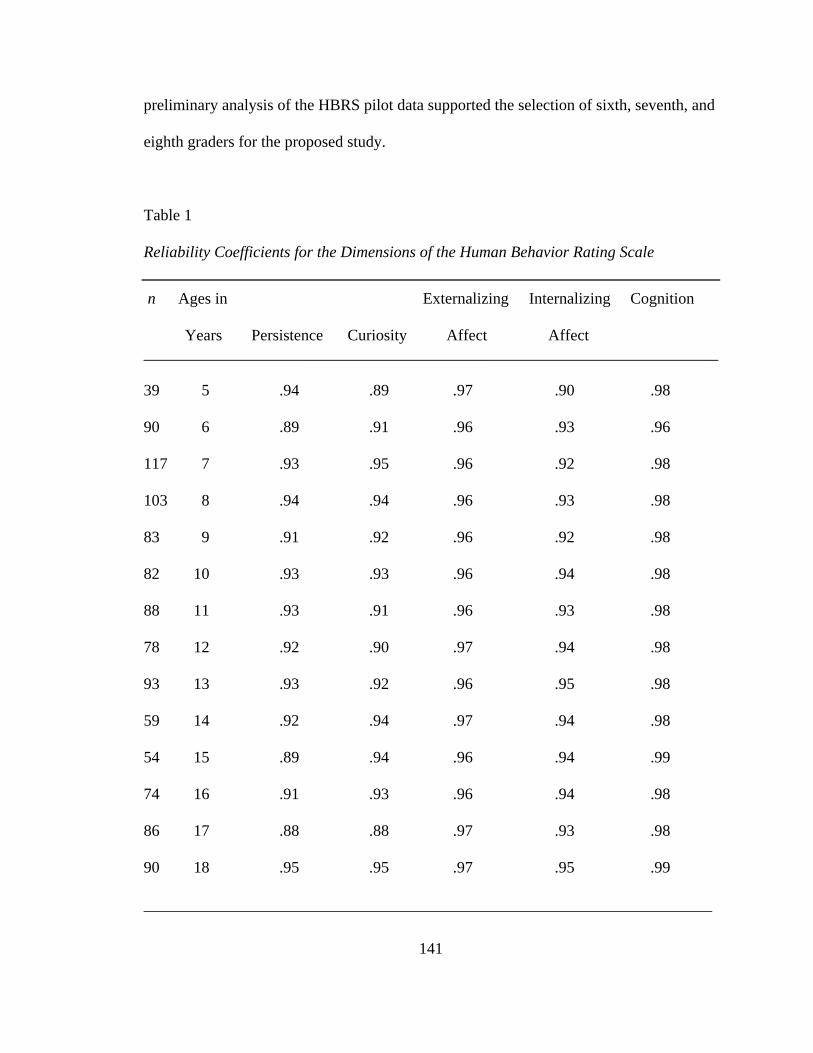
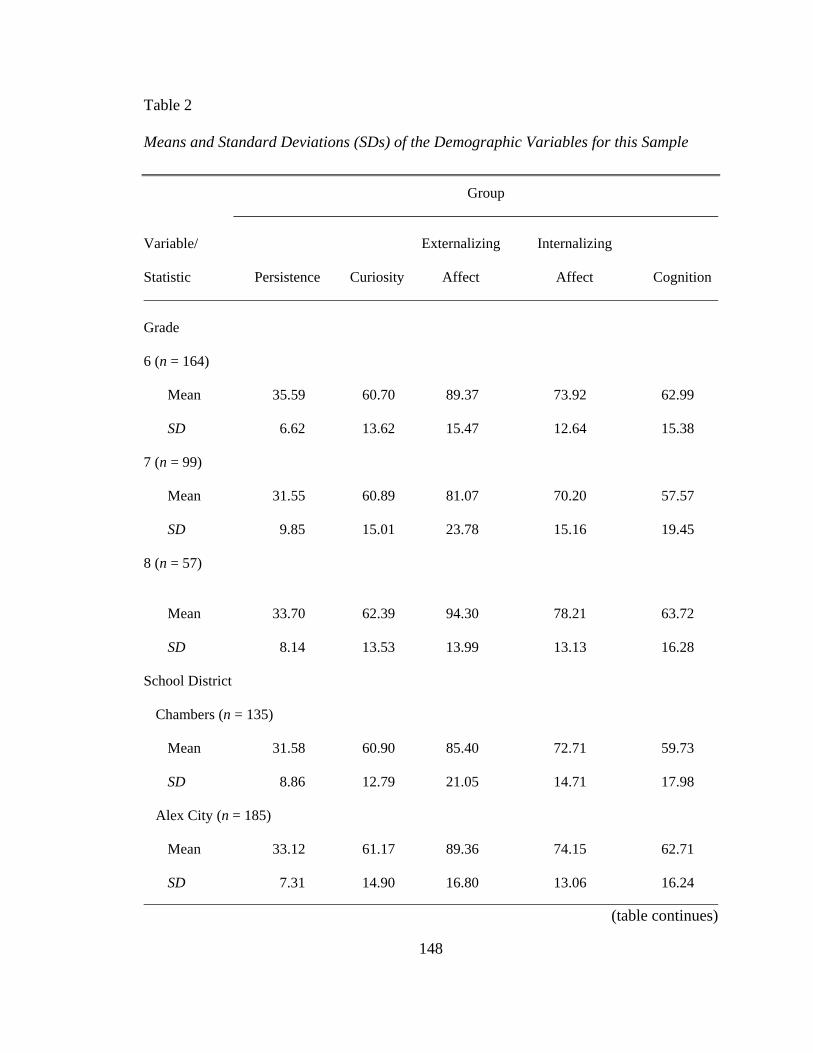
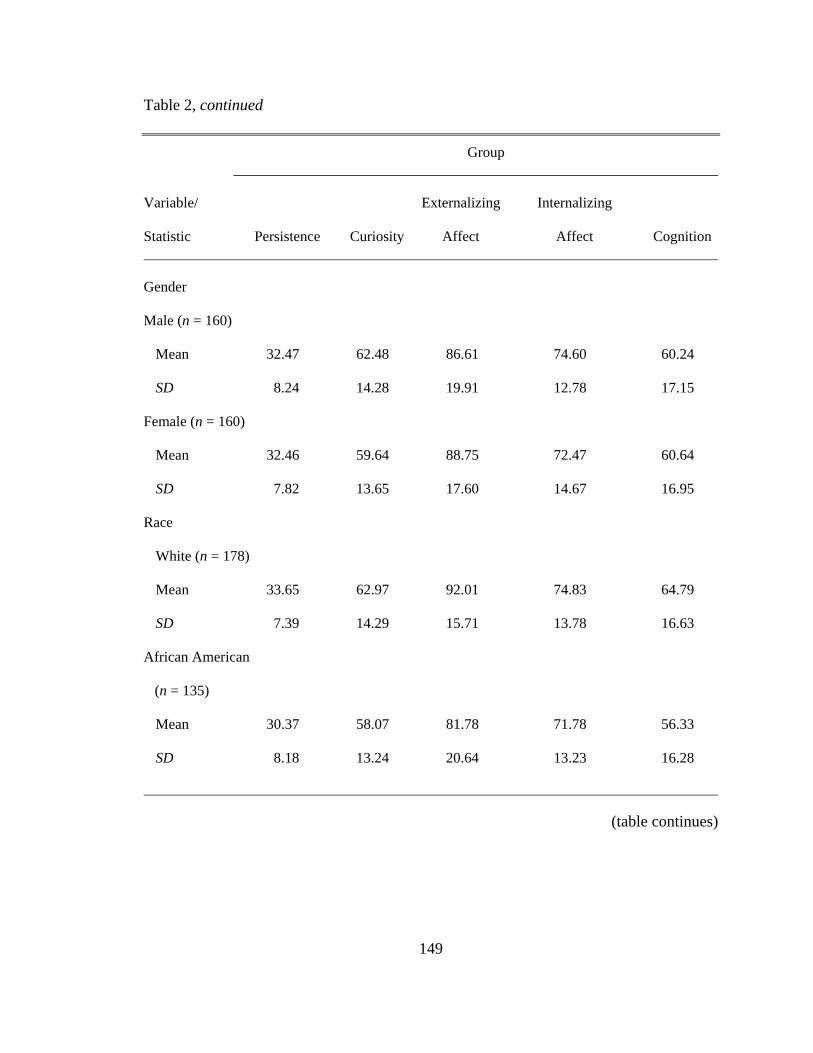
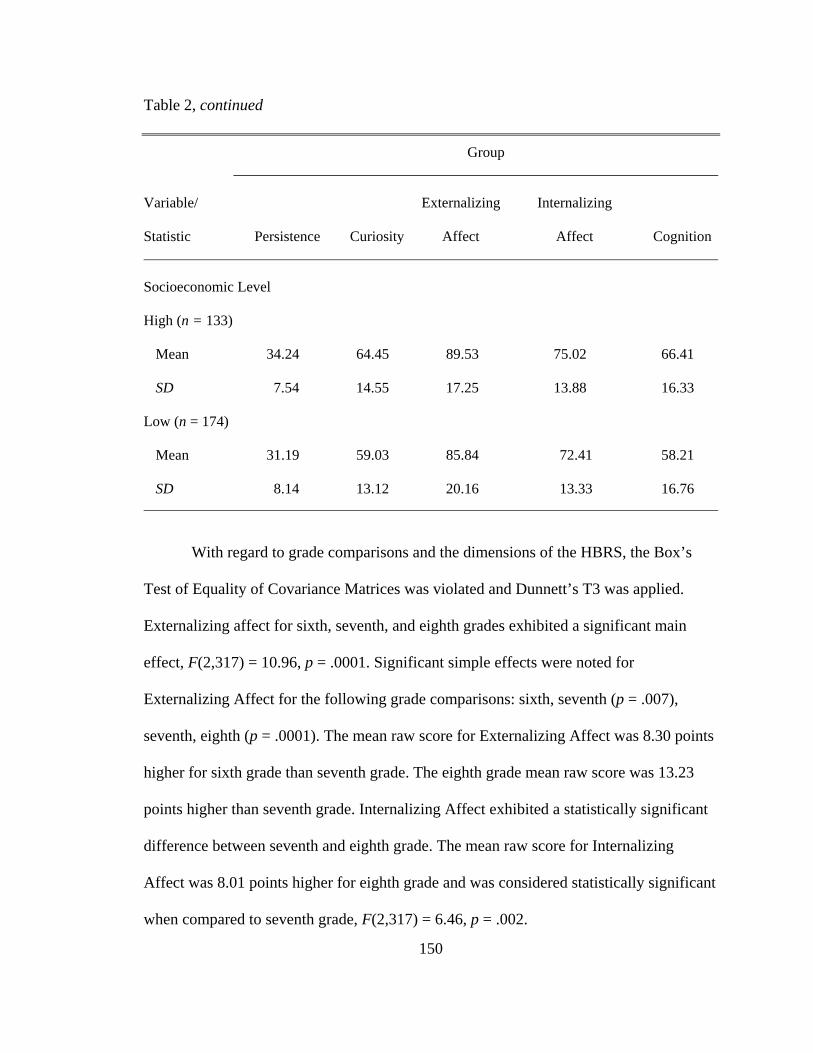
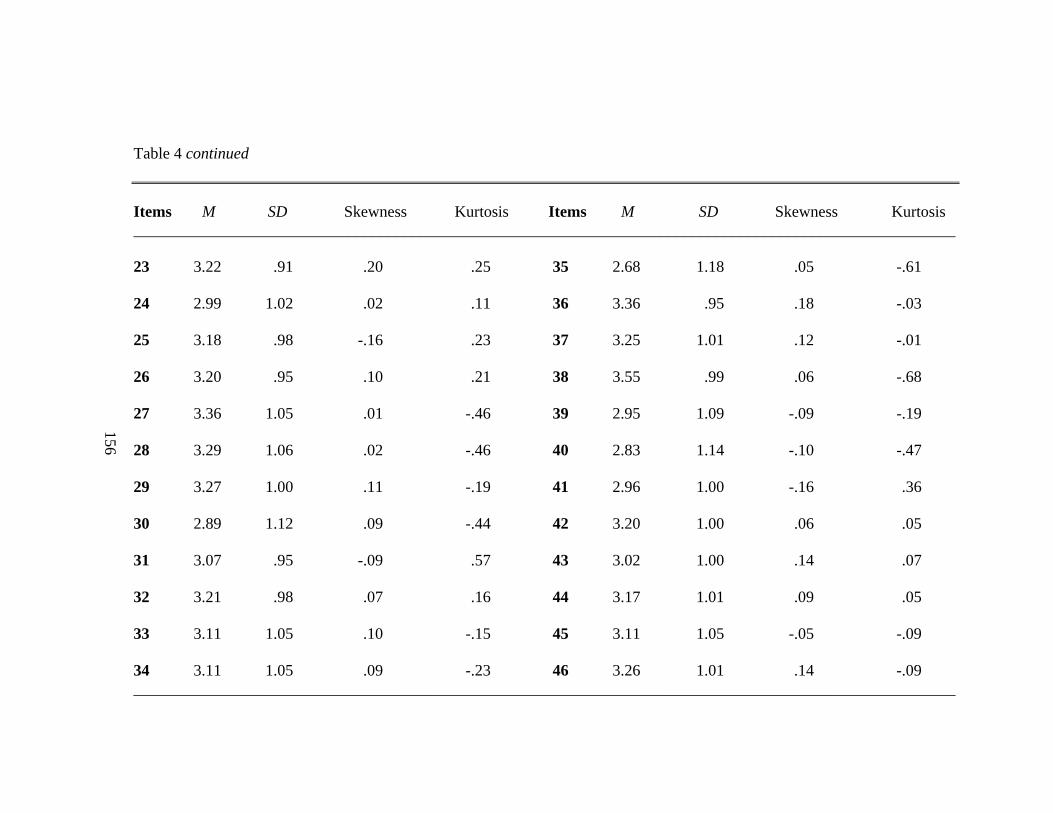
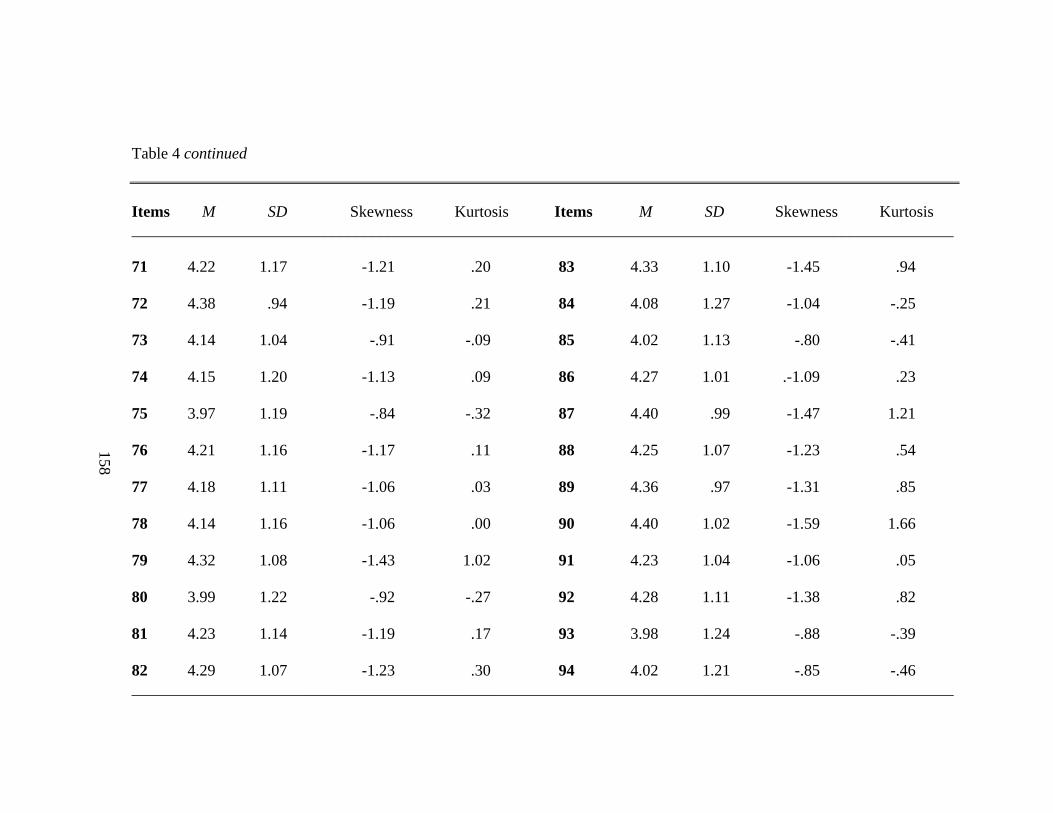
LIST OF TABLES Table 1 Reliability Coefficients for the Dimensions of the Human Behavior Rating Scale................................................................. 141 Table 2 Means and Standard Deviations of the Demographic Variables for this Sample......................................................................... 148 Table 3 Cronbach’s Alpha Reliability Coefficients for Each Grade and Dimensions............................................................................. 152 Table 4 Means, Standard Deviations, Skewness, and Kurtosis for HBRS Items ............................................................................................. 155 Table 5 Means, Standard Deviations, Skewness, and Kurtosis for Item Parcels of the HBRS........................................................................ 159 Table 6 Correlation and Covariance Matrix for the HBRS 15 Parcels................. 162 Table 7 Factor Matrix Coefficients and Communalities for the Five-Factor Unrotated Solution for HBRS Item Parcels ......................... 165 Table 8 Eigenvalues and Variance Recovered in the Unrotated Extraction and Oblique Rotation ............................................................. 166 Table 9 Factor Pattern Matrix Coefficients and Communalities for the Five-Factor Oblique Rotated Solution for HBRS Item Parcels ............... 167 Table 10 Factor Correlation Matrix ........................................................................ 169
1
I. INTRODUCTION
Historically, professionals from many different fields such as biology,
psychology, sociology, and neurology have attempted to unravel the mystery of human
behavior. Edward L. Thorndike (1911) noted the need for investigation into the facets of
human behavior when he stated,
A complete science of psychology would tell every fact about every one’s
intellect and character and behavior, would tell the cause of every change in
human nature, would tell the result which every educational force, every act of
every person that changed any other or the agent himself would have. It would aid
us to use human beings for the world's welfare with the same surety of the result
that we now have when we use falling bodies or chemical elements. In proportion
as we get such a science we shall become masters of our own souls as we now are
masters of heat and light. Progress toward such a science is being made. (p. 6)
With all the technological advances of our day, research within the field of human
behavior still grapples with the question: What are the primary building blocks of human
behavior? Researchers from a variety of fields have attempted to attack this question
from a myriad of angles: (a) anthropologists, look to the past and make extrapolations
from concrete remnants found from ancient cultures; (b) psychiatrists look to the medical
model, which depicts human behavior as a compilation of neurons and physiological
2
processes; and (c) counselors, sociologists, philosophers, and clergy look to extrinsic and
intrinsic variables that may affect an individual’s behavior.
As researchers investigated human behavior, they began to collect a set of
principles to which they subscribed. Once a large body of principles was established an
individual could begin to organize his or her postulates in a holistic fashion to produce a
body of work that attempted to explain a vast array of variables, such as those that
influence human behavior. Certain underlying assumptions concerning human behavior
are accepted by different researchers within each discipline, which leads to disparity even
within a single field. Bolles (1975) noted,
Although a great number of people have contributed in one way or another to our
current understanding of learning, there are a mere half-dozen or so who have
made the big contribution of organizing their ideas into unified patterns that can
be called theories. That these individuals have had the vision and courage to
undertake such syntheses, often with very inadequate data, is reason enough to
give them honored places in the annals of psychology. (p. 1)
Theories cover large bodies of information or facts and assert a particular perspective.
Bigge and Hunt (1958) stated “Action, whether a part of teaching or any other activity in
life, either is linked with theory or it is blind and purposeless. Consequently, any
purposeful action is governed by theory” (p. 257).
O’Donohue and Krasner (1995) acknowledged that human beings naturally
subscribe to a number of theories about the world, such as the notion that the earth was
the center of the solar system and that all the heavenly bodies rotated around it. The
authors noted that scientific theories originally grew out of the process of correcting the
3
erroneous notions of some folk theories. This lends support to the idea that in order for a
theory to influence a field in an all-encompassing manner, it must be widely accepted and
understood. Individuals must be informed of and understand the postulates of the theory.
Theories, which are written in such vague and cumbersome language that the theorists
themselves have trouble relating their ideas to others in a clear cohesive fashion, are not
easily disseminated or understood by individuals within the field.
Relevance of the Problem
It suffices to say that theories of human behavior need to be based on empirical
evidence and readily lend themselves to the testing of their postulates. Individuals such as
Charles Spearman (1904), Clark Hull (1935), and B. F. Skinner (1938) have called on the
need for theories to be supported by empirical evidence. These theorists methodically
constructed systematic methods that outlined the steps to be followed when constructing
and attempting to prove a theory. Despite the widely accepted notion that theories should
be tested through research methods, some theories are so vague that it is difficult to
identify which aspects of the theory to test and how to test them.
Previous and current theories of human behavior tend to focus on discrete aspects
without extrapolating to the total realm of human behavior as it exists within everyday
situations. Disparate theories of human behavior abound. No one theory has
systematically integrated specific schools of thought from other fields. Historically,
behaviorists, mentalists, and psychophysiologists have taken respective opposing
positions concerning human behavior with no concessions for each other. Eaves’ (1993b)
4
Integrated Theory of Human Behavior attempts to remedy this situation by incorporating
information from several different fields into one theory of human behavior.
Theories of human behavior offer direction and information to individuals with
the intention of illuminating what drives human behavior and how it can be shaped. It is
incumbent that individuals within the field of special education study human behavior.
Bigge and Hunt (1958) noted,
Not only has man wanted to learn, but often his curiosity has impelled him
to try to learn how he learns. Since ancient times, at least some members of
every civilized society have developed, and to some degree tested, ideas
about the nature of the learning process. (p. 254)
The authors acknowledged that most teachers, from time to time, have adopted
conflicting features from a variety of theories without realizing that they are
fundamentally incompatible and contradictory in nature. By adopting an integrated theory
of human behavior, a teacher can pull from a systematically organized set of tenants that
can drive his or her assessment, planning, interventions, and teaching style.
Bigge and Hunt (1958) noted that typically, a new theory of learning is not
translated into school practice until 25 to 75 years have elapsed. Once a theory is
adopted, how does it affect society? A comprehensive theory of human behavior could
influence the way special education and psychology construe diagnostic labels for
individuals with disabilities. If a comprehensive theoretical framework existed, special
educators could have greater validity for diagnostic labels. An example of this occurs
within the field of medicine where vast empirical data supports clinically tried treatment
approaches.
5
Within the field of special education the medical field, psychologists, and
legislation determine what diagnostic label may be applied to a specific exceptionality.
For instance, the diagnostic classification of autism has undergone several changes
through the years. Now, autism falls under the pervasive developmental disorder
umbrella and is part of a whole array of other conditions. This influences the number of
individuals who are ultimately diagnosed with autism. Another example occurs when
individuals are deemed not eligible for special education services in the area of emotional
disturbance because they are determined to be socially maladjusted. In some instances it
appears legislation influences what individuals are identified and ultimately qualify for
special education services.
A comparison could be made between the field of special education and the
medical field. If an individual is diagnosed with a heart condition, the physician can
reference a vast body of work, which has empirical support, and choose which discrete
methodology to apply to the specific heart condition that is identified. The field of special
education unfortunately does not have an integrated theory of human behavior to provide
guidance. Aspects from counseling, neuropsychology, and psychology are taught to
special educators in a disparate fashion. Currently, no cohesive theory of human behavior
exists which special educators can reference. Bigge and Hunt (1958) encouraged teachers
to construct their own theory of human behavior through studying existing theories.
Background of the Problem
The need for an integrated theory of human behavior is evident. However, such a
theory should meet several criteria: (a) be written in a simple fashion so it can be easily
6
understood, (b) integrate existing theories that have empirical support, (c) lend itself to
empirical testing, and (d) provide information that can be applied within the field of
education. Eaves’ (1993b) Integrated Theory of Human Behavior is written in simple
language that can be understood by lay persons. His theory has incorporated information
from several fields, all of which are undergirded by empirical support. He has constructed
his theory in a manner that lends itself to empirical testing.
In order to investigate his theory, Eaves has developed three psychometric
assessment instruments. The Visual Similes Test (VST II; 1995), measures affective
arousal and cognitive arousal; the Pervasive Developmental Disorder Rating Scale
(PDDRS; 1993a) is an autism screener and diagnostic instrument that measures arousal,
affect, and cognition; and the Human Behavior Rating Scale (HBRS; 2002) is designed to
measure arousal (persistence and curiosity), affect (externalizing and internalizing), and
cognition.
Purpose of the Study
The purpose of this study was to review arousal, affect, and cognitive theories,
which currently attempt to explain aspects of human behavior. By reviewing different
theories one can note the disparity that exists between the theories. Eaves’ (1993b)
Integrated Theory of Human Behavior was reviewed. His theory proposed that human
behavior resulted from the interaction of specific central nervous system components: (a)
arousal, driven by the reticular activating system; (b) affect, controlled by the limbic
system; and (c) cognition, moderated by the cerebral cortex. Eaves noted that as an
7
individual interacts with his or her environment, he or she becomes specialized in certain
aspects of human behavior.
This occurs in instances where individuals grow up in certain cultures. An
individual who grew up in a primitive environment would become specialized in more
affective or concrete skills, whereas an individual who was raised in a highly
technological environment would become specialized in more cognitive endeavors.
Studies that lent support to Eaves (1993b) Integrated Theory of Human Behavior were
reviewed and the implications of the findings were discussed.
The primary purpose of this study was to investigate the reliability and construct
validity of the Human Behavior Rating Scale (HBRS; Eaves, 2002) with a population of
sixth-, seventh-, and eighth- grade students enrolled in public school. Forty-four teachers
completed a HBRS for each student who returned a signed parental-consent and child-
assent form. Several research objectives were investigated. Two arousal factors, two
affective factors and one cognitive factor were expected to emerge from an exploratory
factor analysis when an oblique rotation was applied. It was expected that each parcel
would load according to expectations and load saliently only on their respective factors.
8
II. LITERATURE REVIEW
In an attempt to provide an overview of some of the competing viewpoints of
human behavior a brief synopsis of select theories has been provided. The theories
reviewed have been placed within one of three categories: arousal, affect, and cognitive
theories. Ultimately, a final theory is discussed that serves to integrate many findings
from theories of arousal, affect, and cognition. The final theory discussed is Eaves’
(1993b) Integrated Theory of Human Behavior that proposes that human behavior is a
result of the interaction of specific central nervous system components: (a) arousal,
located in the reticular activating system; (b) affect, located in the limbic system; and (c)
cognition, located in the cerebral cortex. Eaves (1993b) integrated information from
different disciplines into a comprehensive theory, which attempts to measure the
construct of human behavior through the relationships between arousal, affect, and
cognition.
A plethora of theories currently exist concerning human behavior. One theory that
has been revolutionary for the study of human behavior and sciences has been Darwin’s
theory of Evolution (1859). Darwin’s theory closed the gap that theologians claimed
existed between man and beast. It was hypothesized at the time that man possessed
reason and the notion of free will, while animals were mechanized beasts only “capable
of simple automations” (Bolles, 1975, p. 4). Bolles (1975) noted that Darwin discarded
9
the notion that man has free will and is distinctly different from his animal counterparts
in intellect and disposition. Darwin suggested in his pivotal book Origin of the Species
(1859) that man may have specialized during evolution in the development of his
intelligence in a manner similar to how birds specialized in the development of wings. As
Amsel and Rashotte (1984) described Darwin’s theory,
This work suggested that intelligent or adaptive behavior of animals results from
the operation of relatively simple mechanisms provided by the species’
evolutionary history and activated by the animal’s life experiences. Very simple
creatures seemed incapable of profiting much from experience, and relied very
heavily on their genetic endowment for adaptation to changing conditions.
Animals with more complex nervous systems, and particularly mammals, seemed
capable of extraordinary feats of learning which allowed them to adapt and
survive and radiate into new environments. (p. 13)
Evolution refers to the change in gene frequency over time within a population
and involves natural selection. Corwin and O’Donohue (1995) identified three attributes
that are necessary for evolution to occur through natural selection and that all living
things possess: (a) inheritance occurs when alleles [gene sets] are passed intact from
generation to generation, (b) differential reproduction refers to the variability with which
individuals reproduce, and (c) isolation occurs when genetic lines are not able to
interbreed freely. According to Darwin (1859) natural selection determines which of the
genetically diverse members within a species are best suited to survive and reproduce in a
specific environment. Members of a species that are best suited will survive and
reproduce, while those that are not will perish.
10
Darwin (1859) noted that reproductive competition, as well as other forms of
competition, exist between members of a species. The genetic variability in a species
affects the probability that some members of that species may survive and proliferate.
Sexual reproduction produces more genetically diverse offspring than asexual
reproduction and as such, may increase the probability of survival for some species.
Darwin acknowledged that the result of natural selection is the adaptation of organisms to
prospective environments; as such, a highly adaptive member of a species will live while
a less adaptive member will die.
Darwin (1859) attempted to explain the evolution of new species and organ
systems through the process of gradualism. Gradualism was defined as the process where
new structures emerge in a series of discrete steps that are then selected by the
environment. In modern times this process is noted when mutations of the genotype have
no discernible effect on the phenotype of the organism, and as such, do not affect its
appearance. Corwin and O’Donohue (1995) cited three sources for gradualism: (a) the
process of intensification, which was defined as large evolutionary changes which occur
through a variation on a basic theme such as the formation of glands from scattered
secretory cells; (b) change in function, which occurs when a particular structure is able to
perform two separate functions or when two different organs can perform the same
function within an individual; and (c) the fact that even structures that were beginning to
appear and evolve could serve a selective advantage for an individual or species.
Most theories are in some way or another affected by Darwin’s theory of
evolution. Some theorists have embraced evolution and have been inspired to base their
own theories on its tenants while others ignored evolution completely, or vehemently
11
disputed it. What all of the following theories have in common is that they attempt to
explain some facet of human behavior, and as such, add to the formidable body of work
produced by homo sapiens to explain why humans behave the way they do.
Historical Perspectives: An Overview of Theories
Arousal
Arousal History
Psychophysiology has been the platform from which the basic elements of
psychological processes and the development of adaptive behavior have been
investigated (Lindsley, 1958). Why have some individuals devoted their entire lives to
studying the concept of arousal and its components? Das, Naglieri, and Kirby (1994)
stated that “the concept of arousal has often been linked to the orienting response” and
that “arousal interacts with attention and, in a more global sense, with cognition” (p. 35).
Sokolov, Spinks, Naatanen, and Lyytinen (2002) noted, that
… the orienting reflex [arousal] lies at the heart of information processing, within
a very broad framework of analyses in the brain, and … can elucidate different
levels of organization there, from neuronal levels, through perceptual levels and
memory to semantic levels, and ultimately, behavior. (p. 1)
Arousal has been studied by researchers through the examination of physiological
and nonphysiological measures. The term arousal has been used to describe state and trait
behaviors of individuals, which can lead to confusion when actually defining the concept
of arousal (Venables, 1984). For example, the trait of arousal would be used when an
individual is described as an extrovert or an introvert. In contrast, a state of arousal exists
12
when an individual is said to be aroused by drinking several cups of caffeinated coffee.
Researchers often interchange meanings of arousal from state to trait even within a single
study.
Historically, researchers have struggled with operationally defining the concept of
arousal. Some individuals such as Sokolov (1963) and Malmo (1959) have described
arousal as a unitary process, which acts as an overriding mechanism to direct an organism
into a state of rest or activity along a continuum. Other individuals such as Lacey (1967)
have viewed arousal as a multidimensional process. Lacey (1967) stated, “In lower
animals, … we may in truth speak of different kinds of arousal — autonomic,
electrocortical and behavioral. They are functionally and anatomically separated by
appropriate experimental means. Nature’s experiments yield confirmatory data in human
clinical subjects” (p. 15, 18). Venables (1984) noted that while most psychophysiologists
do not adhere to the existence of unitary arousal, many nonphysiological psychologists
refer to arousal in this way.
In order to avoid confusion in cited works throughout this manuscript the authors’
original wording was used. The reader is asked to bear in mind that the following rubrics
are all representations of the same term: orienting reflex, orienting response, orienting
reaction, and the “What is it” response. The subsequent researchers attempted to explain
the concept of arousal and or its components.
Neuroscience research and the study of arousal found its beginnings within the
Soviet Union (Sokolov & Vinogradova, 1975). Sokolov (1963) attributed Sechenov with
deriving the notion of perception as a system of reflexive acts and the establishment of a
research agenda that investigated the “physiology of sensation” (Schenov, 1952, p. 217).
13
Kimmel (1979) called Schenov (1952) “the father of Russian physiology” and noted his
1863 book, Reflexes of the Brain, delved into the physiological processes of the brain
(Schenov, 1956). Schenov hypothesized that the ability of an individual to perceive
visually a three-dimensional image was a result of the adaptive reflex activity of the
visual analyzer, in other words, light reflexes (Sokolov, 1963). Pavlov (1927) viewed
Schenov’s conceptualization of light reflexes as a series of chained conditioned reflexes.
Ivan P. Pavlov. Siddle (1983) described Pavlov’s work as an attempt to
differentiate certain types of unconditioned and conditioned reflexes from each other
according to their function and the attributes of the stimuli. Pavlov (1927) described the
following unconditioned reflexes: freedom, feeding, defensive, and investigatory
reflexes. His most distinguished contribution to the field of psychology was the discovery
of the investigatory or “what-is it” reflex, developed from his studies of classical
conditioning in dogs. Pavlov (1927) used various stimuli such as bells, lights,
metronomes, rotating discs, and vibrators, all of which tended to elicit an orienting
response in his animals even before the conditioning procedure began. Pavlov (1927)
observed that a dog’s conditioned response to a stimulus would not appear if an
unexpected event occurred which solicited an orienting response. He stated,
It is the reflex [orienting reflex] which brings about the immediate response in
men and animals to the slightest changes in the world around them, so that they
immediately orientate their appropriate receptor organ [eyes, ears, nose, etc.] in
accordance with the perceptible quality in the agent bringing about the change,
making a full investigation of it. (Pavlov, 1927, p. 12)
14
In an attempt to control extraneous stimuli, Pavlov constructed a special
laboratory, the Institute of Experimental Medicine, in Petrograd that he surrounded with
an isolating trench and utilized separate sound-proof rooms (Pavlov, 1960). Pavlov
referred to his laboratory as the “silence tower” and conducted research that investigated
the role of the orienting reflex and its relationship to conditioned responses. He
introduced stimuli to animals and recorded behaviors such as eye movements, adjustment
of the ears, and movement of the body and head of the animal toward the stimulus
(Pavlov, 1960). Pavlov discovered that stimuli, which were novel and elicited early
attentional reactions, would later become effective conditioned stimuli.
Eugene N. Sokolov. Sokolov was credited in 1963 with reintroducing the orienting
reflex to Western researchers. The orienting reflex occurs when an organism detects a
novel stimulus and turns toward the stimulus. The defense reflex is evoked when an
organism detects a noxious stimulus and either aggresses, freezes, or flees. Through the
completion of his book, Perception and the Conditioned Reflex, Sokolov (1963) changed
conceptions of the orienting reflex from being treated as something to be avoided in
studies of classical conditioning to being viewed as indispensable responses that
contribute to adaptation and learning. The orienting response was perceived as a reflexive
tool of adaptation, which varied in its intensity based on individual interpretation of
stimuli and the specific significance it held for the individual.
Sokolov et al. (2002) described the orienting responses as a system for collecting
information from the environment and as a component of exploratory behavior. This
point was illustrated by Voittonis (1949) who observed the exploratory behavior of rats
placed in a field divided into two sections by an electric fence. The rats overcame the
15
electric fence to explore the other side of the field. Voittonis hypothesized that
exploratory behavior was a form of learning for the animal and that it drove the rats to
investigate their environment. Kimmel (1979) concurred by stating “the orienting reflex
provides a foundation for all of the organism’s potential adaptive adjustments to
environmental events” (p. 3). Exploratory behavior is adaptively important in order for
humans and animals to survive and thrive.
Sokolov’s (1963) model described the orienting response as an involuntary,
reflex-like response of an organism to changes within the environment. He differentiated
between the orienting, defensive, and adaptive responses. Sokolov viewed the orienting
response and the defensive response as two arousal systems (Dawson & Lewy, 1989).
The orienting response was evoked by stimuli with mild to moderate intensity and served
to optimize conditions for the perception of the stimulus, while the defensive response
was evoked by harmful stimuli with high intensity and served to reduce the effects of the
stimulus on the organism (Dawson & Lewy, 1989). Berlyne (1960) noted that in a case
where a change in a stimulus occurred, an orienting response may be elicited from an
organism, which could be followed by an adaptive response. An organism’s adaptive
response would function to counteract stimulation by desensitizing the organism to the
change in the stimulus, thus allowing the organism to return to an optimal state of
functioning. Sokolov identified the adaptive reflex as a group of homeostatic reflexes and
described them through the example of the regulatory response of the body to cold and
hot temperatures.
When an individual was exposed to a certain level of temperature change, certain
physiological events took place. When exposed to cold temperature an individual would
16
experience a constriction of blood flow to the head and fingers as a reaction to the
temperature change. Conversely, when an individual was exposed to hot temperature he
or she would experience an increase in blood flow to the head and fingers as a reaction to
the temperature change. Sokolov (1963) noted adaptive reflexes were specific to a
particular type of stimulus and exhibited changes in sensitivity specific to the senses
involved such as pupilary dilation in response to changes in light. He hypothesized that
the action of the adaptive reflex was contingent on the continued presence of the stimulus
and in fact would become more stable and pronounced upon repeated presentations of the
stimuli.
The defensive reflexes also served to counteract stimulation. Berlyne (1960)
noted that the stimuli that evoked defensive reflexes possessed qualities of high intensity
or pain. Sokolov (1963) described defensive reactions as incidents of running away or
withdrawing part of the body from a harmful stimuli as well as aggressive movements
which served to remove or destroy the target stimuli. When compared, distinct
differences in the orienting and defensive responses were acknowledged by Sokolov and
Cacioppo (1997): (a) the orienting response was elicited by low or moderately intense
stimuli where the defensive response was elicited by high intense stimuli; (b) the
orienting response was associated with reciprocal blood restriction within the peripheral
nervous system and a dilation of blood vessels within the brain, whereas the defensive
response is associated with increased peripheral blood flow and brain blood flow
restriction.
Sokolov and Cacioppo (1997) noted further differences between the orienting and
defensive responses: (a) an orienting response had a similar autonomic signal to the onset
17
and offset of a stimulus due to the fact that both were changes in stimulation whereas the
defense response exhibited a larger autonomic response to stimulus onset than stimulus
offset; (b) the orienting response habituated quickly to stimulus repetition, whereas the
defensive response was strengthened or weakened much more slowly as a result of
stimulus repetition.
Sokolov (1963) further hypothesized that if stimuli encountered by an organism
did not match the mental image previously constructed by the organism, then an orienting
response was elicited. When properties of the stimulus matched the mental image the
individual had constructed, habituation occurred. In other words, habituation occurred
when a stimulus no longer evoked an orienting, defensive, or adaptive response from an
organism. The organism becomes familiar, uninterested, and satiated by the stimuli due
to repeated exposure. However, any pronounced change in the stimuli might have
resulted in dishabituation, thus eliciting the orienting response again.
Posner, Rothbart, and Thomas-Thrapp (1997) pointed out that Sokolov showed
that not all sensory stimuli elicited orienting. In fact, sensory stimuli can be habituated
when repeated exposure to the stimulus showed it to be without significance. The process
of orienting depended on the stimulus itself and the previous experiences of the
individual (Posner et al., 1997).
Pribram (1979) attempted to locate the structural parts of the human brain that
contributed to Sokolov’s neuronal model and hypothesized that the fronto-limbic
forebrain was involved in habituation. Pribram (1979) hypothesized that arousal or the
orienting response influenced the limbic system and the cerebral cortex. He stated, “the
controlled, context-dependent, episodic [learning] was a manifestation of fronto-limbic
18
function, and the automatic, context-free, semantic [senses] … had references to the
functions of the posterio-lateral cerebral convexity” (p. 11).
Robert B. Malmo. Malmo’s (1959) activation theory is a unidimensional concept
of arousal that ranges from being in a coma, to an experienced heightened state of
excitement, to being highly stressed. He posed a unidimensional model of arousal that
served as a foundation that facilitates the shift of an organism from a resting state to a
state of activity. Malmo (1959) asserted that arousal processes were part of an
individual’s drive and that these processes revealed the intensive aspects of behavior, and
as such, measures chosen to record arousal would correlate with each other. Malmo
envisioned a continuum of arousal represented through recorded physiological measures
such as electroencephalographs, skeletal motor, and autonomic measures.
An example of activation theory occurs when an individual is aroused by a
stimulus and produces autonomic and electroencephalographic responses such as an
increase in heart rate and blood pressure, a decrease in blood flow to the fingers, an
increase in palmar conductance, and a decrease in baseline alpha activity. These
measured physiological responses were taken to be indicators of a unidimensional
concept of arousal. Lacey (1967) noted that activation theory required that correlational
matrices of measured physiological variables exhibit a significant communality between
measures.
John Lacey. Lacey (1967) argued against a unidimensional concept of arousal. He
proposed that electocortical, autonomic, and behavioral arousal may be considered to be
different forms of arousal. Fowles (1980) noted Lacey argued that at the very least, two
arousal systems exist: one in the reticular activating system and one in the limbic system,
19
which was more closely tied to an organism’s behavioral activation. Lacey disagreed
with the practice of using one form of arousal as overriding another form of arousal. He
felt researchers made this methodological mistake in their studies because the three
hypothesized arousal processes (i.e., electrocortical, autonomic, and behavioral) can
occur at the same time.
If a researcher used a specific device to measure one type of arousal process such
as electrocortical, then the subject’s autonomic and behavioral responses may not be
represented in the results. Lacey subscribed to the notion that physiological and
perceptual-motor responses under typical conditions are for the most part independent
functions that do not function as a unidimensional drive. He noted that physiological
measures of arousal, such as EEG desynchronization and heart rate, have historically
correlated poorly with one another. In order for arousal to be measured in individuals,
researchers search for patterns of arousal by observing an individual over time and in
many different situations.
Lacey and Lacey (1970) proposed that directional heart rate changes, which
accompany the orienting and aversive response in individuals are directly related to
changes within the organism’s sensory threshold. Attention to the environment involves
an increase in informational input and is associated with heart rate decrease, while
inattention to one’s surroundings resulted in a heart rate increase. Lacey indicated that
heart rate is extremely sensitive and directly related to an individual’s arousal level and
how efficiently information is processed.
He spoke of electrocortical, autonomic and behavioral responses as exhibiting
dissociations. A disassociation between cerebral cortex activity with autonomic and
20
behavioral responses has been shown through invasive surgical and pharmological animal
studies (Lacey, 1967). Taking into account these dissociations of physiological measures,
Lacey proposed a multidimensional arousal process that reflected the transaction between
the organism and his environment and as such, indicated the intended goal of behavior.
He asserted that different somatic processes have specific roles to play in the execution of
a diverse array of behavior and interactions with other concurrent responses. These
different somatic processes may be evident in different levels depending upon the nature
of the interaction of the organism with its environment.
Lacey (1967) coined the phrase “situational stereotypy,” which he defined as
“different stimulus situations [the nature of the interaction of the organism with its
environment], which reliably produced different patterns of somatic responses” (p. 52).
He noted several examples of situational stereotypy in which behavior was specific to
each stimulus situation: “warm and cold stimuli, tapping telegraph keys, looking at
pictures, and listening to auditory stimuli,” all of which produced different patterns of
somatic responses specific to each stimulus situation (Lacey, 1967, p. 53). Lacey
acknowledged that recognizing and detecting external stimuli, with no motor response
requirement produced a pattern of responses which consisted of a decrease in heart rate,
with an increase in palmar conductance along with other autonomic responses. He stated,
“attitudes produced different subjective stimulus situations, even though the stimuli were
objectively the same,” which was another example of situational stereotypy (Lacey, 1967,
p. 53). In other words, an individual’s previous experiences contribute to how he or she
might react to subsequent stimuli.
21
Daniel Berlyne. Berlyne (1960) investigated what motivated individuals to pursue
perceptual and intellectual activities. He noted that humans historically have pursued
interests beyond the point of fulfilling their basic biological needs such as forms of
entertainment or curiosity in areas of art and humor. Berlyne (1963) defined exploratory
responses as behaviors performed by an organism that modified stimuli and or introduced
new stimuli from another source into the immediate environment. He noted that virtually
all responses exhibited by an organism had some level of exploratory function and as
such, served as a type of stimulation for the organism in a proprioceptive, visual, and or
auditory sense. Berlyne (1960) placed exploratory behaviors into the following categories
according to the type of response the organism exhibited in reaction to a stimulus: (a)
orienting responses, which consisted of a change in posture or turning one’s eyes, ears,
and or nose toward a stimulus; (b) locomotor exploration, consisted of locomotor
movement; and (c) investigatory responses, which effected changes in external objects,
by manipulating them.
Berlyne further identified exploratory behaviors as either extrinsic, in which
exploratory behaviors introduced cues to guide a subsequent action which led to its own
source of reinforcement, or intrinsic, in which exploration resulted in introducing stimuli
that was rewarding on its own. He also noted there was a distinction to be made between
specific and diversive exploration. Specific exploration provided stimulation from a
designated source, while diversive exploration fell under titles of recreation or
entertainment and served to secure stimulation with “certain structural properties
compatible with a large range of content” or interest (Berlyne, 1963, p. 290).
22
Berlyne (1960, 1963) asked what characteristics or properties of a stimulus tend
to increase the probability that an organism will orient toward it? He hypothesized that
the strength and direction of exploratory behavior was affected by a particular group of
stimulus elements labeled collative properties. Berlyne (1960) defined collative
properties as elements of novelty, change, surprisingness, uncertainty, conflict, and
complexity and discussed how they affected the onset and duration of exploratory
behavior. He examined how collative properties could be combined to produce
similarities and differences, and compatibilities and incompatibilities among elements of
an object or event. Berlyne defined the concept of novelty and parceled the term into
several different levels.
Short-term novelty referred to stimuli that had never been encountered by an
organism before and were considered totally new or stimuli that had not been
encountered by the organism within the past few minutes. Long-term novelty referred to
stimuli that had not been encountered for a period of days. Berlyne (1960) also described
an absolutely novel stimulus as possessing some quality that had never been perceived
before, while a relatively novel stimulus possessed familiar elements or properties
combined in a unique arrangement that had not been encountered before by the organism.
He introduced a habituation hypothesis that was based on the premise that all stimuli
were at one time considered novel by an organism and that currently novel stimuli must
possess properties that have not yet been classified by the organism and placed in their
personal catalogue of stimuli categories (Berlyne, 1960). A second hypothesis was posed
by Berlyne, which noted that novel stimuli are similar in that they induce conflict.
23
Berlyne (1960) stated that an optimal stimulus would possess an intermediate
degree of novelty. Such a stimulus would be familiar, but also possess enough of a novel
quality to evoke an exploratory response from an organism. Stimuli deemed too novel by
an organism could evoke fear resulting in a state of conflict. Stimuli that possessed novel
characteristics may also have exhibited elements of change and surprisingness. Change
referred to a change or movement that occurred while the stimulus was being explored by
the organism.
Surprisingness implied that the stimulus was incongruent or disagreed with the
expectation the organism held for the stimulus. Berlyne noted stimuli could also be
categorized as incongruent by consisting of combinations of stimuli that were novel but
that also contained similar and dissimilar elements the organism had encountered before.
Incongruency contradicted an organism’s expectations based on past experiences. In
other words, the stimuli did not fall neatly into an organism’s preconceived notions.
Berlyne (1960) felt novel stimulus patterns that possessed degrees of surprise and
incongruency aroused levels of uncertainty in organisms. Collative properties of stimuli
would vary in their power to evoke exploratory behavior in individuals based on their
own previous experiences.
Berlyne (1960, 1963) linked exploratory behavior with the concept of an arousal
drive by describing certain physiological aspects of the human nervous system. The
reticular formation, located in the brain stem, was noted by Berlyne to be responsible for
an individual’s arousal, wakefulness, vigilance, and energy level. He also noted that the
reticular activating system interacted with other structures, such as the cerebral cortex, by
sending excitatory messages and receiving facilitatory and inhibitory impulses. Berlyne
24
(1963) stated that messages from the cerebral cortex traveled via the “hypothalamus and
central gray matter of the brainstem, which activated the autonomic nervous system and
the areas in the palaeocortex and brain stem whose stimulation has been found to have
rewarding or punishing effects” (p. 307). The reticular formation includes both ascending
pathways that end in the cerebral cortex and descending pathways, which affect motor
output (Berlyne, 1960). He noted that the upper portion of the reticular activating system
was called the thalamic reticular system and had the capacity to alert broad areas of the
cortex while inhibiting others.
Excitation of the reticular formation resulted in an activation pattern or arousal
pattern within the individual. The reticular formation was reported to function in an
indiscriminant fashion in which it responded in the same way to excitation no matter
what external or internal forces activated it (Berlyne, 1963). Electroencephalograph
(EEG) results indicated an arousal pattern occurred in an individual by showing a change
in waking but relaxed EEG alpha patterns to fast, irregular, low-amplitude patterns
(Berlyne, 1960). When an arousal pattern has occurred in an individual, observable
differences may be detected in behavior such as appearing wide-awake and alert. Berlyne
noted that arousal could be construed as existing along a continuum in which the lower
end would indicate a state of sleep or coma, while the upper end would indicate a state of
frantic excitement.
Berlyne (1963) linked exploratory behavior with increases in arousal, which
occurred when an individual encountered a stimulus that possessed the right amount of
collative variables. The individual would react to certain stimuli as a direct result of his or
her previous experience with similar stimuli. Berlyne stated that collative stimulus
25
properties were the “major determinants of the strength and direction of exploratory
behavior” and as such affected arousal patterns within the individual (p. 313). Collative
stimulus properties were also sources of conflict as previously noted and as such could
result in escalating arousal, which was noted to increase as levels of conflict increased.
Berlyne (1963) proposed a theory of collative motivation in which he differentiated
between arousal potential, level of arousal, and affective tone (i.e., level of discomfort
related to drive level).
Berlyne (1963) hypothesized that arousal potentials, which referred to any
variable capable of evoking an increase in arousal, have a curvilinear relationship to
arousal itself. He described instances of curvilinear relationships: (a) in conditions of
sensory deprivation, arousal may mount but arousal potential may fall inordinately low;
(b) as stimuli that exhibit a decrease in intensity begin to approach the absolute threshold,
such as a person who is trying to hear a speaker whose voice lowers to an almost
inaudible whisper arousal may go up; and (c) an unexpected delivery of bad news can
leave a person in a state of shock or in a trance-like state. Berlyne also noted that
individual arousal patterns or drives have distinct thresholds. Some individuals are rarely
shaken by stressful situations where others “fall apart.” Individuals may exhibit nervous
tendencies or appear to react to situations “as cool as a cucumber.” An individual is
affected by many different factors, such as collative stimulus properties and previous
experiences that interact with their arousal drive to produce behavior.
Berlyne (1963) proposed that an organism was capable of a minimum level of
arousal at anytime and the precise level of arousal depended on internal and external
conditions. If an individual suffered from sleep deprivation, his or her level of arousal
26
might be quite low. However, if the same individual had been placed in an environment
filled with loud noises and lights for a period of time, his or her arousal level might be
quite high (Berlyne, 1963). In the average individual, Berlyne noted that one’s arousal
level might fall somewhere in the middle between the upper and lower extremes
previously mentioned. However, when one’s arousal level is raised above or lowered
below its natural resting state, a condition of conflict and discomfort within the individual
may arise. It is this conflict that motivates the individual to either escape from his or her
current environment or seek out and explore new stimuli. The action of exploratory
behavior is a result of the individual’s attempt to restore balance to his or her arousal
pattern or drive, thus alleviating any discomfort or distress experienced by their
heightened or lowered arousal level.
Geraldine Dawson and Arthur Lewy. Dawson and Lewy (1989) examined
patterns of arousal for individuals with autism. They defined arousal as “the complex
patterns of cardiovascular, respiratory, and central nervous system (CNS) changes that
accompany different states of responsivity to external stimuli” (Dawson & Lewy, 1989,
p. 49). Porges (1976, 1984) posed a hypothesis for a two-component model of attention.
The first component consisted of an orienting response, which referred to an individual’s
initial involuntary reaction to external stimuli influenced by stimulus properties such as
intensity, novelty, and unpredictability. The second component consisted of voluntary,
sustained attention toward an external stimulus and is influenced by symbolic qualities of
the stimulus. Dawson and Lewy (1989) proposed that children with autism exhibited
“deficiencies in arousal modulation, attention to social and nonsocial stimuli, and
socioemotional impairments all of which are closely linked” (p. 69).
27
Dawson and Lewy (1989) stated that autism involves a dysfunction of the
cortical-limbic-reticular system, which is responsible for the basis of attention to novelty.
They noted that individuals with autism may have an abnormal orienting response,
indicated by an acceleration instead of deceleration of heart rate when an orienting
response is evoked and the failure to habituate. According to Dawson and Lewy (1989)
the cortico-limbic-reticular loop is a system of interactive neurons that connect the
cortex, limbic system and reticular activating system together. They described how the
cortical-limbic-reticular system functioned by noting that properties of stimuli are
analyzed and mediated by the primary sensory cortex and hippocampus. Dawson and
Lewy (1989) stated “Once the hippocampus detects novelty in a stimulus, the reticular
activating system is influenced and sends messages to the cortex” (p. 162). This is
exhibited by a disruption in EEG patterns and is accompanied by other physiological
changes that all make up the orienting response. According to Dawson and Lewy, the
element of the limbic system that is responsible for inhibiting the brain’s arousal and
making habituation possible is the hippocampus.
Dawson and Lewy (1989) noted several arousal characteristics of autistic
children: (a) abnormal orienting response; (b) accelerations in heart rate and reductions in
rate of habituation; (c) a failure to habituate; (d) a failure to reinstate to novelty when
habituation does occur; (e) heightened aversive, or defensive, responding; and (f)
inconsistencies in all of the characteristics mentioned above. Individuals with autism
attempt to regulate their own arousal levels through such methods as perseverative
behaviors, avoiding unpredictable stimuli and attending to predictable stimuli such as
familiar objects. Dawson and Lewy (1989) stated
28
Social, emotional, and linguistic stimuli are, by nature, unpredictable and
indeterminate. Thus, these types of stimuli are more likely to be novel and
arousal-producing. In contrast, object-oriented stimuli, such as pattern, space, and
the mechanical aspects of an object, tend to be more predictable (by the
characteristics of the object and/or actions on the object), repeatable, and
determinate. (p. 53)
Physiological measures of arousal. Sokolov and Cacioppo (1997), Lacey (1967),
Graham and Clifton (1966), and numerous other researchers attempted to measure
arousal by utilizing physiological measures such as monitoring cardiac responses, blood
pressure levels, the dilation and constriction of blood flow to designated areas of the
nervous system and organs, and skin conductance activity. Sokolov (1994) investigated
perception through color vision and eye and head movements in addition to attempting to
map the autonomic components of the orienting and defensive responses.
Posner and Raichel (1994) used neuroimaging methods to investigate the
orienting response. As noted earlier, various physiological measures of arousal do not
produce a unidimensional measure of arousal. Fowles (1984) referred to the
incongruencies apparent in the various indices of arousal as a “Tower of Babel like” state
of affairs. He stated “the indices spoke in diverse tongues with so little in common as to
render a unitary concept of arousal meaningless” (Fowles, 1984, p. 143).
Summary of Arousal History
Even though there is disagreement as to exactly how arousal physiologically
comes to fruition, all parties concur that arousal is a necessary component of life. Without
arousal an individual would not orient to food, shelter, or water, nor would they detect a
29
life-threatening stimulus. An individual without the capacity for arousal would
consequently not be able to adapt effectively to the ever-changing world of today.
Problems currently exist in the ability of researchers to measure arousal. Perhaps a further
examination of the many possible types of arousal is needed. There may be many types of
arousal that, due to the lack of reliable and valid assessment instruments, have not yet
been discovered.
Affect
Affect History
Researchers, have attributed characteristics of emotion to the term affect, these
characteristics commonly incorporate terms such as anxiety, depression, and aggression.
Affect in relation to humans continues to influence our society substantially today from
commercials that show delectable food or fancy cars to criminal activity that occurs daily.
Historically researchers have explored affect through two lines of thought: (a)
behaviorism, which consists of the examination of stimuli response patterns in animals
such as dogs, cats, rats, and humans; and (b) mentalism, which involves the investigation
of individuals’ immediate consciousnesses, mental states, and motivations. Pioneers in
the field of behavior analysis included Edward L. Thorndike (1911) and John Watson
(1914). Thorndike (1911) described the incongruencies that existed at that time within the
field of psychology with regard to the study of behavior when he stated,
Again, much time was spent in argumentation about the criteria of consciousness,
that is, about what certain common facts of behavior meant in reference to inner
experience. The problems of inference about consciousness from behavior
distracted attention from the problems of learning more about behavior itself.
30
Finally, when psychologists began to observe and experiment upon animal
behavior, they tended to overestimate the resulting insight into the stream of the
animal’s thought and to neglect the direct facts about what he did and how he did
it. (p. 3)
Edward L. Thorndike. Thorndike (1911) hypothesized that all learning consisted
of the automatic formation of an association between a stimulus situation and the correct
response. He noted that intelligence is a function of the number of connections learned
and as such, occurs through an organism making a direct connection between a stimulus
and its response (Bolles, 1975). Thorndike’s hypothesis of learning was contrary to the
popular ideas of the time. Historically, man and animal were perceived as inherently
different, with humans acquiring knowledge through an intellectual process that involved
the conceptualization of ideas, experience, and knowledge of logical relationships
whereas, animals functioned through the use of instincts and reflexes. Through his
theory, Thorndike narrowed the rift between man and animal through the proposition that
both learned through stimulus response connections.
Thorndike (1911) wrote Animal Intelligence, in which he introduced his law of
effect, which posed that learning occurs only if the response derived has an effect upon
the environment. If the effect of the response is pleasing, then learning occurs. If the
effect of the response is unpleasant, learning also occurs, but the behavior evoked is
weakened rather than strengthened. The associations or habits of organisms become
strengthened or weakened by the nature and frequency of stimulus response pairings.
Thorndike (1911) noted “The greater the satisfaction or discomfort [for the organism],
the greater the strengthening or weakening of the bond [between stimulus and response]”
31
(p. 244). Thorndike devised a method in which he posed that learning could be explained
through observable, measurable, and repeatable means. He also introduced the notion of
reinforcement.
In addition to the law of effect, Thorndike proposed two other laws: (a) the law of
readiness, which hypothesized that a series of responses can be chained together to satisfy
some goal that will result in annoyance if blocked, and (b) the law of exercise, which
hypothesized that connections become strengthened with practice and weakened when
practice is discontinued. The law of readiness dealt with motivation, and, interestingly,
Thorndike conceptualized that motivation could be seen as “the particular pattern of
readiness that exists in the nervous system at a particular moment” (Bolles, 1976, p. 17).
Bolles (1976) noted that Thorndike also proposed the “spread of effect” idea, which
posed that rewards affect not only the connection that produced them but temporally
adjacent connections as well. Thorndike also hypothesized incorrectly that transfer of
learning is dependent upon the presence of identical elements in the original and new
learning situations; therefore, transfer of learning was always specific, and never general.
John B. Watson. Watson (1913) mirrored Thorndike’s view of behaviorism by
stating,
Psychology as the behaviorist views it is a purely objective experimental branch
of natural science. Its theoretical goal is the prediction and control of behavior.
Introspection forms no essential part of its methods, nor is the scientific value of
its data dependent upon the readiness with which they lend themselves to
interpretation in terms of consciousness. The behaviorist, in his efforts to get a
unitary scheme of animal response, recognizes no dividing line between man and
32
brute. The behavior of man, with all of its refinement and complexity, forms only
a part of the behaviorist’s total scheme of investigation. (p. 158)
Watson (1914) hypothesized that when a stimulus and response occur in close
proximity, the connection between them is strengthened. The strength of the connection
increases as the number of occurrences increases. Watson differed from Thorndike in the
respect that he did not subscribe to the concept of reinforcement. Watson attributed
behavior to connections formed through repetition of the stimulus response pattern. He
proposed a neurological model in which a stimulus produces activity in a specified part of
the brain and a response is produced in another part of the brain. When this occurs
simultaneously, neural pathways are strengthened and learning occurs.
It should be noted that Watson hypothesized that all neural pathways have already
been formed in an individual. He believed that individuals were blank slates, which were
molded by society. In an attempt to explicate his theory, Watson and Rayner (1920)
evoked fear in their eleven-month old human subject, Albert, by pairing a loud noise
[striking a hammer upon a suspended steel bar] with the presentation of a rat. As Albert
reached for the rat a loud noise occurred which resulted in Albert falling over to one side,
crawling away, or crying. After three trials, the rat alone evoked the fearful behaviors in
Albert.
Following six trials with the rat and the sound, Watson and Raynor conducted a
series of transfer of training tests, which employed the use of a white rabbit, a dog, and a
fur coat. Even though each stimulus was presented alone, unaccompanied by the loud
noise, Albert still exhibited fearful behaviors. When tested a few days later in a novel
situation, Albert showed little emotion, so Watson conducted additional conditioning
33
trials, which resulted in Albert experiencing fear in the novel situation. Unfortunately,
Albert was removed from the experimental situation before Watson could employ
techniques to decondition him from his learned fearful responses. Watson concluded that
is was possible for individuals to learn emotional responses from Stimulus-Response
pairings within their environment. Albert was made fearful due to his experiences and
interactions in his environment.
Clark L. Hull. In his book Principles of Behavior, Hull (1943) mathematically
conceptualized the notion of motivation and drives as basic components of human
behavior and derived a systematic theory of behavior, which could be tested by
subsequent researchers. Hull (1943) stated
The field of behavior theory centers primarily in the detailed interaction of
organism and environment. Individual and species survival depend upon
numerous optimal physiological conditions; when one of these critical conditions
deviates much from the optimum, a state of primary need arises. Need reduction
[drive] usually comes about through a particular movement sequence on the part
of the organism. Such sequences depend for their success jointly upon the nature
of the need and the nature and state of the environment. (p. 28-29)
Hull’s (1943) mathematical formula sEr = sHr x D x V x K can be explained through the
following example: performance (sEr) is equal to habit strength (sHr) is multiplied by
drive (D), the intensity of a stimulus (V), and by an organism’s expectation of acquiring a
certain stimulus such as food (K).
Hull (1943) noted that a need usually preceded or accompanied an action of an
organism, and as such, the need was said to motivate or drive the associated activity.
34
Berlyne (1960) parceled Hull’s concept of drive into three levels, drive1, drive2, and
drive3. Drive1 referred to drive as a condition that indiscriminately influenced the level of
activity or the energizing effect of drive on an individual. If the organism exhibited a
clear-cut response evoked by a stimulus then one dominant response was elicited.
However, if the organism exhibited confusion or conflicting responses to a stimulus then
a weakened response was elicited. Berlyne (1960) stated,
Hull’s postulate implied that the strength of any response once aroused, would be
multiplied by a factor representing drive strength. The difference in strength
between the proponent response and its competitors (its net reaction potential)
would therefore be multiplied by the same factor. An increase in drive1 would
mean an increase in the vigor, persistence, or reliability with which that response
was elicited. (pp. 165-166)
Drive2 was noted by Berlyne to represent an internal condition that makes certain
overt responses more probable than others. Drive2 exhibited specificity in that it
strengthened relevant response tendencies. Specific cues evoked specific behaviors,
which were biologically useful in a particular state. If drive2 was functioning at a high
rate of intensity the specificity of the behavior elicited may change and would result in an
over generalization of stimuli such as, an animal making sexual advances to inappropriate
objects.
Drive3 was described as a condition whose termination or alleviation is rewarding
to an organism. This drive is credited with promoting the learning of an instrumental
response and refers to the actions in which an organism is motivated to escape from
35
something (Berlyne, 1960). Hull (1943) noted that an individual’s learning depended
upon the action of rewards and that all rewards were direct instances of drive3 reduction.
Amsel and Rashotte (1984) noted Charles Darwin’s influence upon Hull, “Hull
believed that once the laws of learning and their relation to innate behavior were
discovered, they would be found to be similar in all mammalian species and that
individual and species differences could be handled as parametric variations” (p. 14). The
authors also quoted Hull as stating “…any set of principles that comprises a viable
behavior theory must take into account automatic and adaptive responses of organisms”
(Amsel & Rashotte, 1984, p.14). Hull applied Darwin’s concept of variability to his
concept of behavioral tendency, which referred to the situation in which a stimulus sets
up a behavioral tendency where any one of a number of set responses could be evoked.
Each response in the set has an equal probability or reaction potential of being elicited
(Fantino and Logan, 1979). According to Hull (1943) the response that is most adaptive
will be evoked through reinforcement, will have the strongest reaction potential, and will
be the one that occurs.
Hull hypothesized that each response has a measurable reaction potential, and by
determining all the factors that might contribute to one’s reaction potential, a probability
value can be assigned to the occurrence of any response in any situation, thus, predicting
behavior. Hull’s theory proceeded to address interactions among factors, which
contributed to reaction potential (Fantino & Logan, 1979). Bolles (1975) noted that
during the 1970s, Hull’s mathematical postulates fell out of favor with American
psychologists and ultimately were disproved. Amsel and Rashotte (1984) described Hull
as a behavioral analyst rather than a learning theorist and noted that his less popular
36
concepts such as goal attraction, purpose, and directing ideas are still applicable.
Ultimately, Hull contributed significantly to the notion that theoretical ideas should lend
themselves to hypotheses that can be tested through sound scientific means.
Sigmund S. Freud. LeDoux (2003) noted that upon completion of his medical
training in Vienna, Freud took a position as a research scholar focusing on the nervous
systems of fish and crayfish. Freud (1895) posed the idea that the nervous system consists
of neurons, which are distinct but similar in construction and meet together at contact
barriers. He hypothesized that contact barriers allow memory and consciousness to occur
in an individual. Freud turned his attention to psychology and as a result constructed his
psychoanalytic theory of human behavior.
Freud (1920) basically viewed human behavior as deterministic and the product
of irrational forces, unconscious motivations, and biological and instinctual drives which
evolved during the psychosexual stages that occurred from birth to 6 years of age (Corey,
2005). Bigge and Hunt (1968) stated
It would be impossible to overestimate the impact of Freud on psychology, or for
that matter, on Western civilization in general. His thinking changed the manner
in which mental processes are interpreted, gave us a new vocabulary for labeling
mental phenomenal, placed sex in a new perspective, and offered a new approach
to the treatment of mental illness. (p. 71)
Behaviorists such as Hull were influenced by Freud’s deterministic view of behavior,
which attempted to show that even unintentional human behavior has specific
antecedents that can be identified. Even though many have denied basic components of
37
Freud’s theory, his notions of the unconscious and the id signaled a shift to examine the
concept of affect and behavior.
Freud (1949) denoted five stages of psychosexual development that occurred
during human development. The oral stage occurred during the first year of life and
referred to the need for an infant to suckle at his or her mother’s breast in order to satisfy
the need for food and pleasure. If these basic needs are not met then oral fixations may
result, coming to fruition in the form of personality problems. As the individual matures
such problems as mistrust of others or the inability to have intimate relationships may
appear. The anal stage was experienced from the ages of 1 to 2 years old and referred to
emphasis being placed on the anal zone as a focus of the child’s sexual interests. Children
derive pleasure from bowel movements, which create sensations within the mucous
membranes of the anal region. Freud noted that children gain maturational control over
their sphincter muscles, and learn to hold back their bowel movements until the final
moment, which created increased pressure on the rectum and heightened the pleasure of
the final release. Freud further described the fundamentals of toilet training and noted that
if this was not handled properly an individual could develop personality tendencies in
later life such as anal compulsiveness.
Next came the phallic stage, which occurred during the ages of 4 to 6 years old,
and referred to unconscious incestuous desires that a child develops for his or her parent
of the opposite sex. Male children developed an Oedipus complex, while female children
developed an Electra complex. The child represses his or her threatening feelings for his
or her parent. According to Freud, if parents react badly to their child’s desires, possible
harm might be inflicted upon the child’s future sexual development.
38
The latency stage occurred for children during the ages of 6 to 11 years and
referred to the replacement of a child’s previous sexual interests with learning gender
roles from his or her same sex parent. Freud identified the genital stage, and noted it
occurred at the onset of puberty: age 11 years for girls and age 13 years for boys and
lasted until senility. During puberty an individual is obsessed with sexual energy, which
tends to derail established defenses. The adolescent must break ties with his or her
parents at this time, so they can establish new adult-like relationships.
Bigge and Hunt (1968) described Freud’s theory as a form of instinct psychology,
which assumed the existence of specific inborn psychological drives. Freud (1949)
divided the mind into three regions: (a) the conscious, which referred to awareness; (b)
the preconscious, which referred to psychological content that can be brought into
consciousness when necessary; and (c) the unconscious, which referred to repressed
psychological content that was inaccessible to one’s consciousness (Bigge & Hunt,
1968). He emphasized that the content of the repressed unconscious is too distasteful and
filled with disturbing content to be dealt with openly.
Corey (2005) noted that Freud’s greatest contributions to psychology were his
concepts of the unconscious and his delineation of the levels of consciousness. Freud
(1949) viewed the unconscious as the source of primal, instinctive impulses, which
directed the formation of an individual’s personality. He hypothesized that if an
individual failed to handle his or her unconscious desires, they would come to fruition in
the form of a psychological or physiological illness (Bigge & Hunt, 1968). Freud
attempted to investigate the unconsciousness through: (a) analyzing dreams, which he felt
were symbolic representations of unconscious needs, wishes, and conflicts; (b) slips of
39
the tongue and instances of forgetting familiar information such as one’s phone number;
Race Afro-American Asian Native American Pacific Basin/Aleut White
Other ________
Gender Male Female
School Services: Regular Ed Chap I MR LD ED Other ______
About the Rater:
Name: ________________________________ Sex: Male Female
Race: Afro-American Asian Native American Pacific Basin/Aleut White
Other Relationship to child : Teacher
Directions: Judge each item separately from every other item. After reading an item: 1. Ask yourself, is this child's behavior about like other children his or her age? If
the answer is yes, place an 'X' on the '3' in the left-hand column and move on to the next item.
2. If the answer is no, ask yourself, does this child display the behavior to a lower degree than other children his or her age? If the answer is yes, then place an 'X' on the '1' or '2.' Use the '2' when the choice between '1' and '3' is difficult.
3. If the answer to question 2 is no, then the child displays the behavior to a higher degree than other children his or her age. Therefore, place an 'X' on the '4' or '5.' Use the '4' when the choice between '3' and '5' is difficult. Please do not skip items.
1 = The child has never exhibited this behavior or attribute
2 = (Use this number when the choice between '1' and '3' is difficult)
3 = The child displays this behavior or attribute about the same as other children his or her age
4 = (Use this number when the choice between '3' and '5' is difficult)
5 = The child displays this behavior or attribute to a very high degree
211
This child:
1 2 3 4 5 1. Perseveres, even in difficult circumstances 1 2 3 4 5 2. Deals with measurement problems (e.g., length, weight) satisfactorily 1 2 3 4 5 3. Pays close attention to important events in the environment 1 2 3 4 5 4. Shows satisfactory persistence in completing jobs that are started 1 2 3 4 5 5. Grasps abstract, symbolic material readily 1 2 3 4 5 6. Enjoys repairing or fixing broken things 1 2 3 4 5 7. Can solve word problems satisfactorily 1 2 3 4 5 8. Is curious about new things 1 2 3 4 5 9. Has a wide variety of interests 1 2 3 4 5 10. Is outgoing and not withdrawn 1 2 3 4 5 11. Can estimate the answers to arithmetic problems before calculating them 1 2 3 4 5 12. Notices subtle movements or sounds in the environment 1 2 3 4 5 13. Can synthesize the elements of a problem to find a solution 1 2 3 4 5 14. Takes things apart to find out how they work 1 2 3 4 5 15. Shows courage when faced with threatening situations 1 2 3 4 5 16. Understands the relations between sets of concepts (e.g., three branches of
government, classification of animals) 1 2 3 4 5 17. Doesn't let others push her or him around 1 2 3 4 5 18. Has a lot of energy 1 2 3 4 5 19. Is compliant with reasonable requests from authority figures 1 2 3 4 5 20. Can deal with complex information 1 2 3 4 5 21. Shows appropriate remorse following misbehavior (e.g., hurting someone) 1 2 3 4 5 22. Can describe the author's purpose after reading an editorial 1 2 3 4 5 23. Is not easily intimidated by others 1 2 3 4 5 24. Makes up new ways to use available materials 1 2 3 4 5 25. Is fearless when dealing with scary circumstances 1 2 3 4 5 26. Is always ready to try something new 1 2 3 4 5 27. Shows good self-control 1 2 3 4 5 28. Becomes highly focused on things that really matter 1 2 3 4 5 29. Can sustain interest over a satisfactory period of time 1 2 3 4 5 30. Has a satisfactory understanding of geometry concepts 1 2 3 4 5 31. Is brave; controls his or her fear 1 2 3 4 5 32. Is inquisitive about unfamiliar things 1 2 3 4 5 33. Understands whole numbers and place values 1 2 3 4 5 34. Can analyze a problem to identify its important elements 1 2 3 4 5 35. Watches animals to see what they will do 1 2 3 4 5 36. Is an unselfish person 1 2 3 4 5 37. Organizes ideas and information satisfactorily 1 2 3 4 5 38. Is friendly and easy to get along with 1 2 3 4 5 39. Is a risk taker; willing to undertake an activity that may not succeed 1 2 3 4 5 40. Likes to explore (e.g., woods, old trunks, rivers) 1 2 3 4 5 41. Obtains satisfactory tactile information through the fingers and hands 1 2 3 4 5 42. Shows poise and self-confidence 1 2 3 4 5 43. Is not easily distracted by unimportant events in the environment 1 2 3 4 5 44. Can classify information presented in a written passage 1 2 3 4 5 45. Would find a way to survive if left on a desert island 1 2 3 4 5 46. Recalls facts and details from a written passage 1 2 3 4 5 47. Can find the main idea in a story 1 2 3 4 5 48. Gets excited about doing things he or she hasn't done before 1 2 3 4 5 49. Can predict the outcome of a partially completed story 1 2 3 4 5 50. Is not afraid of snakes, spiders, etc. 1 2 3 4 5 51. Shows good impulse control 1 2 3 4 5 52. Seldom makes the same mistake over and over 1 2 3 4 5 53. Likes to go places she or he hasn't gone before 1 2 3 4 5 54. Shows satisfactory care around dangerous circumstances 1 2 3 4 5 55. Prefers "hands-on" experience to "book learning" 1 2 3 4 5 56. Shows satisfactory empathy for the difficulties of others 1 2 3 4 5 57. Can interpret graphs, charts, maps, and tables accurately 1 2 3 4 5 58. Seldom gives up on a challenging activity
212
1 2 3 4 5 59. Has a good grasp of real numbers (e.g., fractions, proportions) 1 2 3 4 5 60. Generalizes skills from one task situation to another 1 2 3 4 5 61. Always seems to be tinkering with things he or she doesn't understand 1 2 3 4 5 62. Understands complicated figures and arrays 1 2 3 4 5 63. Is attracted to novel situations
The following items represent behavior that is considered undesirable in our society. Use the same code found on page 1 for judging this child's status on each item. Remember, if the child's behavior is about the same as other children his or her age, you should place an 'X' on the '3.' If the child does not display the attribute or behavior at all, you should place an 'X' on the '1.' If the child displays the behavior at a very high rate or degree, you should place an 'X' on the '5.'
1 = The child has never exhibited this behavior or attribute
2 = (Use this number when the choice between '1' and '3' is difficult)
3 = The child displays this behavior or attribute about the same as other children his or her age
4 = (Use this number when the choice between '3' and '5' is difficult)
5 = The child displays this behavior or attribute to a very high degree
This child:
1 2 3 4 5 64. Quits, gives up easily 1 2 3 4 5 65. Is always in the middle when things start to happen 1 2 3 4 5 66. Is fearful and anxious 1 2 3 4 5 67. Sometimes gets so mad that she or he loses control 1 2 3 4 5 68. Has trouble dealing with authority figures 1 2 3 4 5 69. Enjoys breaking the rules 1 2 3 4 5 70. Likes to live on the edge 1 2 3 4 5 71. Knowingly ignores the rights of others 1 2 3 4 5 72. Is afraid of harmless animals, people, or situations 1 2 3 4 5 73. Worries a lot 1 2 3 4 5 74. Is a thrill seeker; quick to take a dare 1 2 3 4 5 75. Is inhibited; shy 1 2 3 4 5 76. Deliberately disobeys rules for behavior 1 2 3 4 5 77. Is nervous 1 2 3 4 5 78. Feels inferior 1 2 3 4 5 79. Lies to others frequently without guilt 1 2 3 4 5 80. Is timid and bashful 1 2 3 4 5 81. Teases and bullies others 1 2 3 4 5 82. Seems coldly indifferent to other's difficulties 1 2 3 4 5 83. Is reckless 1 2 3 4 5 84. Exhibits conduct problems 1 2 3 4 5 85. Is easily embarrassed, self-conscious 1 2 3 4 5 86. Is easily frightened 1 2 3 4 5 87. Doesn't hesitate to cheat others 1 2 3 4 5 88. Is withdrawn 1 2 3 4 5 89. Startles easily 1 2 3 4 5 90. Physically attacks others 1 2 3 4 5 91. Is easily intimidated 1 2 3 4 5 92. Exhibits problems in aggression 1 2 3 4 5 93. Is sensitive; his or her feelings are easily hurt 1 2 3 4 5 94. Lacks confidence