15
An Exploratory Model of Solar Influence on Stratospheric Dynamics Alexander Ruzmaikin John Lawrence & Cristina Cadavid
An Exploratory Model of Solar Influence on Stratospheric
Dynamics
Alexander RuzmaikinJohn Lawrence & Cristina Cadavid

Approach
solar UV variability (4-6% per cycle) ⇒ tropo-stratospheric dynamics
low-dimensional North Annular Mode ⇒ low-dimensional modeling

Stratosphere Influences Troposphere
NAM < 0
NAM > 0
Baldwin & Dunkerton (99)

Waves

Coupled Wind and Planetary Waves
�Ψ �� = F(Ψ U,h,Λ) -potential vorticity eq.
�U�� = G(Ψ U,h,Λ) -mean zonal wind eq
Ψ = X + iY - wave, u - mean zonal windΨ0 = h - wave amplitude at source
Λ = �UR �z - equilibrium gradient (UR = UB+ Λz)
Holton&Mass (74), Yoden (90), Christiansen (00), Ruzmaikin, Lawrence & Cadavid (02)
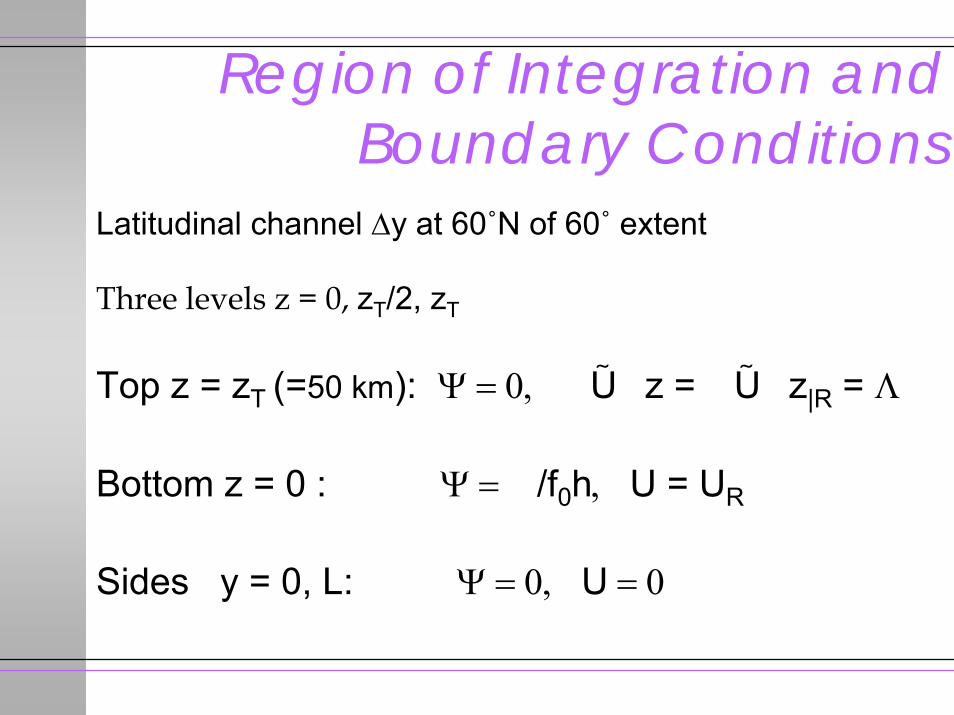
Region of Integration and Boundary Conditions
Latitudinal channel ∆y at 60˚N of 60˚ extent
Three levels z = 0, zT/2, zT
Top z = zT (=50 km): Ψ = 0, �U�z = �U �z|R = Λ
Bottom z = 0 : Ψ = �/f0h, U = UR
Sides y = 0, L: Ψ = 0, U = 0

The Dynamical SystemdX/dt = - X/ τ1 + qX- pY + sUY,
dY/dt = - Y/ τ1 + qY + pX - qUX - ζhU,
dU/dt = - (U - UR (0) - ΛzT)/ τ2 + qU -ηhY.
τ1 = 122 days, τ2 = 30 days, X,Y = [L2/T]; L = a (Earth‘s radius).
p, s, ζ, η = 0.6, 2, 0.2, 87 [1/T, 1/L, L/T2, 1/T ,1/(L2T), L/T, L].
q = 4dy/dt/(∆y)3 QBO (Ruzmaikin, Lawrence & Cadavid, 02)
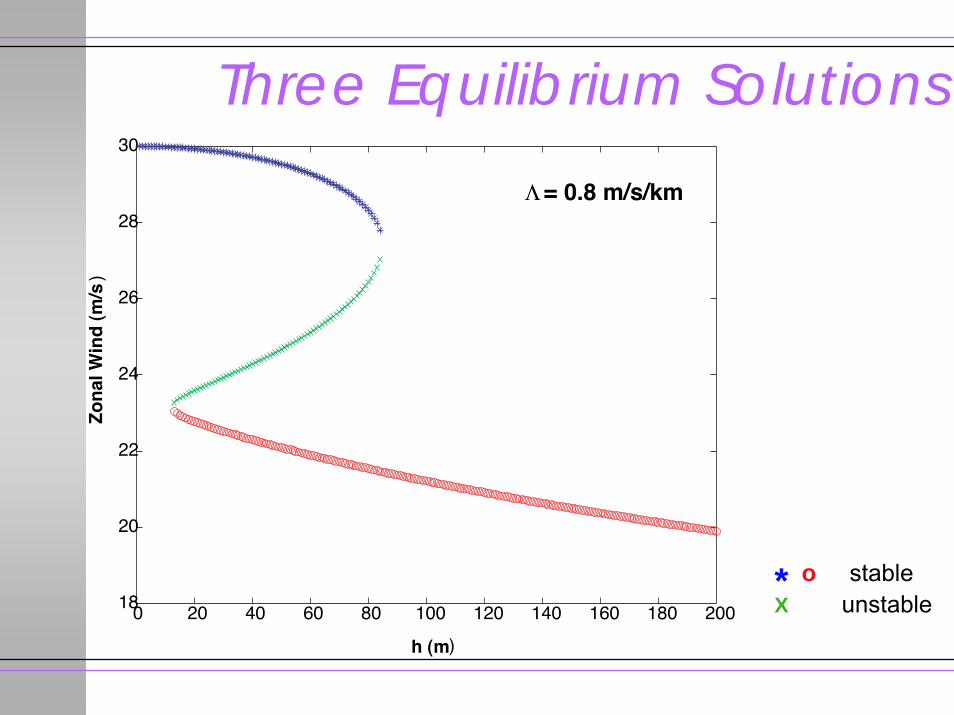
Three Equilibrium Solutions
0 20 40 60 80 100 120 140 160 180 20018
20
22
24
26
28
30
h (m)
Zo
nal
Win
d (
m/s
)
Λ = 0.8 m/s/km
* o stableX unstable
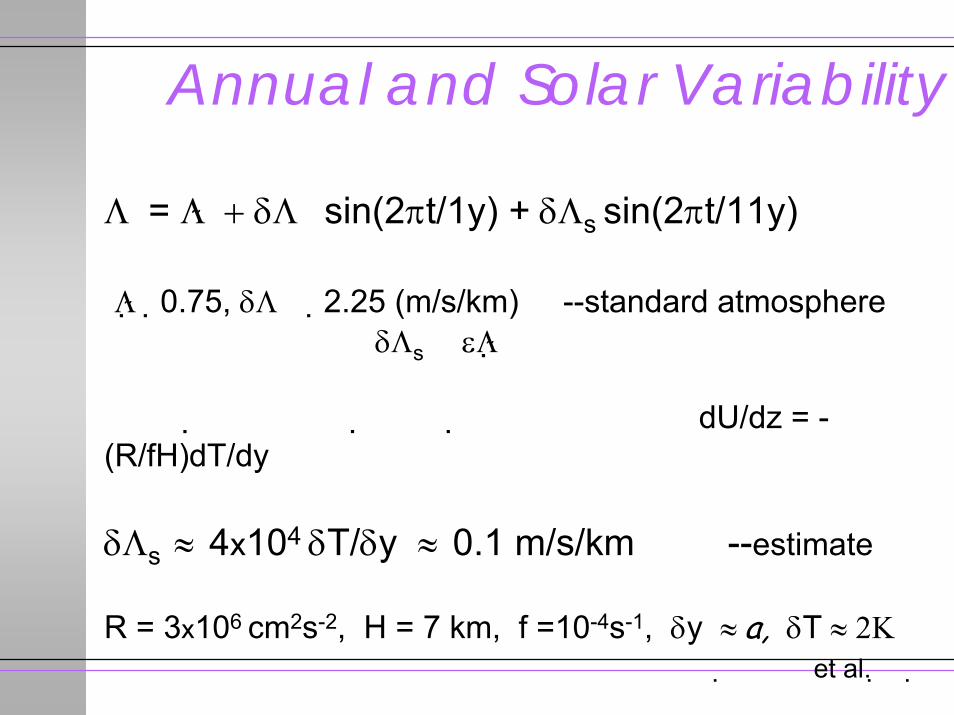
Annual and Solar Variability
Λ = Λ + δΛ� sin(2πt/1y) + δΛs sin(2πt/11y)
Λ�0.75, δΛ� �2.25 (m/s/km) --standard atmosphere δΛs � εΛ
����������������������� dU/dz = -(R/fH)dT/dy
δΛs ≈ 4x10⁴ δT/δy ≈ 0.1 m/s/km --estimate
R = 3x106 cm2s-2, H = 7 km, f =10-4s-1, δy ≈ a, δT ≈ 2Κ ���� et al. ��
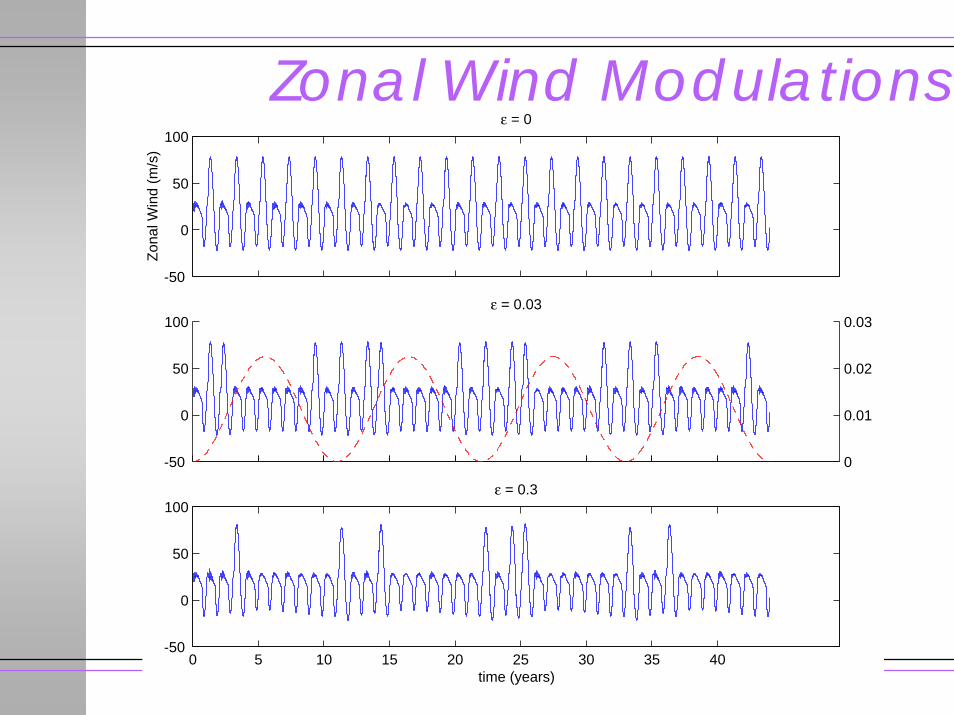
Zonal Wind Modulations
-50
0
50
100ε = 0
Zon
al W
ind
(m/s
)
-50
0
50
100
0
0.01
0.02
0.03ε = 0.03
0 5 10 15 20 25 30 35 40-50
0
50
100
time (years)
ε = 0.3

QBO Influence∆y = ∆y0 [1 + q sin(2π/28)]
W and C winters (low and high U)
q 0 0.1 0.2
West QBO 30 25 11 16 6 21
East QBOHolton&Tan
30 25 21 7 23 5
λο = 0.75, h = 62 m, t = 55 years
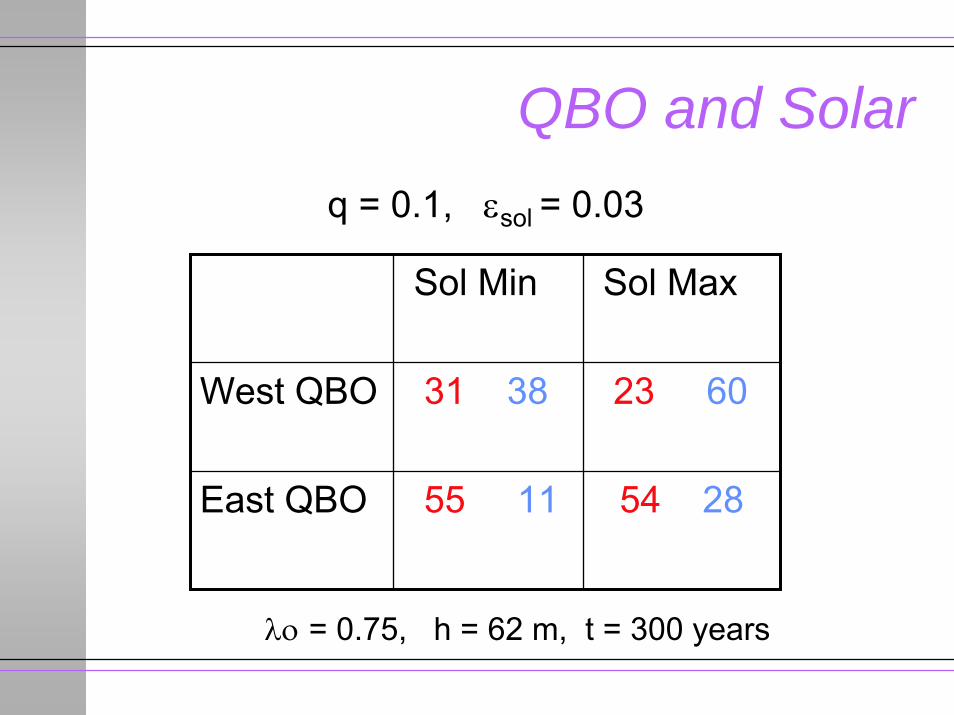
QBO and Solarq = 0.1, εsol = 0.03
Sol Min Sol Max
West QBO 31 38 23 60
East QBO 55 11 54 28
λο = 0.75, h = 62 m, t = 300 years
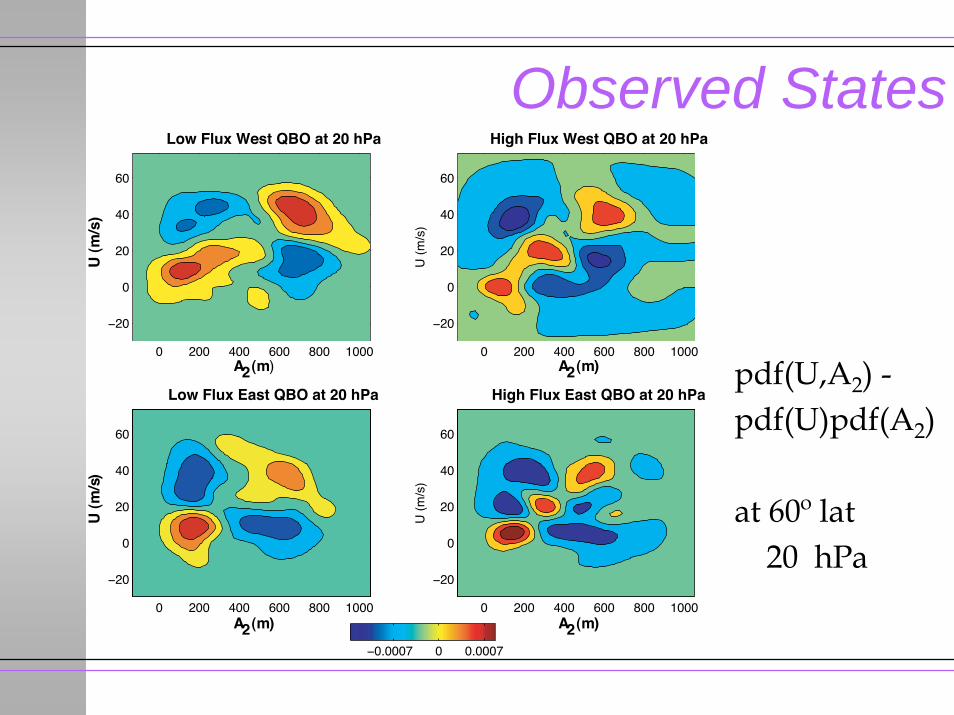
Observed States
0 200 400 600 800 1000
−20
0
20
40
60
Low Flux West QBO at 20 hPa
U (
m/s
)
A2 (m)0 200 400 600 800 1000
−20
0
20
40
60
High Flux West QBO at 20 hPa
U (
m/s
)
A2 (m)
0 200 400 600 800 1000
−20
0
20
40
60
Low Flux East QBO at 20 hPa
U (
m/s
)
A2 (m)0 200 400 600 800 1000
−20
0
20
40
60
High Flux East QBO at 20 hPa
U (
m/s
)
A2 (m)
−0.0007 0 0.0007
pdf(U,A2) -pdf(U)pdf(A2)
at 60º lat20 hPa
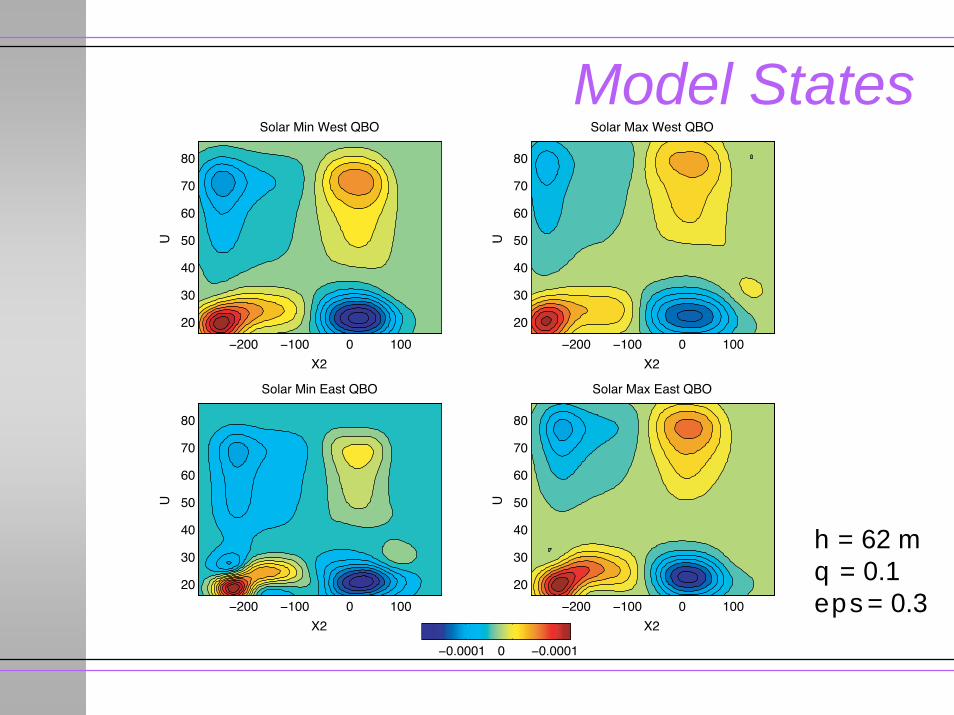
Model States
−200 −100 0 100
20
30
40
50
60
70
80
Solar Max East QBO
X2
U
−200 −100 0 100
20
30
40
50
60
70
80
Solar Min East QBO
X2
U
−200 −100 0 100
20
30
40
50
60
70
80
Solar Max West QBO
X2
U
−200 −100 0 100
20
30
40
50
60
70
80
Solar Min West QBO
X2
U
−0.0001 0 −0.0001
h = 62 mq = 0.1 eps = 0.3
Discussion/Conclusions
Solar variability influences stratosphere-troposphere dynamics -- apparently through UV changes
There are two stable major equilibrium states, possible corresponding to two states of NAM
Solar variability and QBO influence the occupation frequency of the two states


