1 An IEEE 802.11 protocol test-bed in industrial environments using personal computing devices J. Vales-Alonso * , F. J. P´ erez-Mart´ ınez, A. S. Mart´ ınez-Sala, E. Egea-L´ opez, F. Ponce-Mar´ ın, J. Garc´ ıa-Haro Departament of Information Technologies and Communications, Polytechnic University of Cartagena, Spain. * Corresponding author. Address: Campus Muralla del Mar, 30202, Cartagena, Spain. phone: +34 968 326 588, fax: +34 968 325 973, e-mail: [email protected]Abstract— IEEE 802.11 is being currently condisered to de- velop telecommunications infraestructures in industrial environ- ments. However, in such environments there may be exist a high level of Electromagnetic Fields (EMF) contamination, due to the machinery in use. WLANs are sensitive to this kind of hazard, and therefore the performance of the protocols may be affected inside industrial facilities. In this paper we carried out a study of the wireless link performance in these environments, using personal computing devices. Such equipments will be likely used by employees rather than conventional computers. Since results do not characterize the environment itself, but the set environment-hardware, a proper measurement test-bed must include direct measures with these devices. Besides, due to limitations in these devices, a specific protocol to measure pairs of packet error probability and latency was developed. Results show a significant linear dependency between both magnitudes, and a large correlation coefficient in the measurements under high EMF activity at mid-large ranges (distances greater than 5 meters). Index Terms— IEEE 802.11, Industrial environments I. I NTRODUCTION Wireless networking have driven significant advances in information technologies during the last decade. For instance, the Global Mobile System (GSM), the Universal Mobile Telecommunication System (UMTS) and the Wireless Local Area Networks (WLAN) have achieved a high penetration in the market, both in domestic and offimatic use. Currently, the IEEE 802.11 protocol, and its versions a, b and g, stand out among the WLAN proposals. IEEE 802.11 allows fast and economic network deployment than conventional wired LANs. Indeed, in industrial enviroments, where it is sometimes quite difficult to setup a wired installation, wireless ones allow development of handy facilities. However, in this type of environments there may exist a high level of Electromagnetic Fields (EMF) contamination, due to the machinery in use. WLANs are sensitive to this kind of hazard, and therefore the performance of the protocols may be affected inside in- dustrial facilities. Thus, a systematic study of the wireless link performance in these environments is mandatory to establish the limits in the protocol operation. Additionally, the devices that are being installed in these facilities are also different from those employed for common use: employees demand mobility, this requirement is meet with Personal Computing Devices (PCD), e.g. Personal Digital Assistant (PDA) or Tablet PCs. Besides, new applications are being envisioned based in the Wireless Sensor Network (WSN) paradigm, that will allow distributed data collection and actuation on specific points. The radio transceivers and hardware of both kind of devices (PCDs and WSNs) have different characteristics and properties (e.g. antenna design, processing speed, memory) than conventional ones. Indeed, measurements are not independent from the hardware used to take them. That is, results do not characterize the en- vironment itself, but the set environment-hardware. Then, a proper measurement test-bed must include direct measures with these specific devices. In addition, most studies only take into consideration the Packet Error Probability (PEP) or the bit error rate. However, a characterization for a specific environment and hardware should also include measurements of the end-to-end delay, the latency. Both magnitudes, the PEP and the latency characterizes the communication system from the MAC layer perspective. Nevertheless, both magnitudes are not, a priori, independent. Therefore, the measurement software must compute pairs of the random bivariate variable (PEP, latency) to characterize the environment. In this paper we have measured the influence of EMF in industrial noisy environments in a wireless IEEE 802.11b link. In several experiments we have computed the packet error probability and the latency. Similar studies have been already conducted in other works (see [10]), however authors used common wireless devices and only measure the PEP. In our test-bed, we have used commercial PDAs to take into account the variations introduced by these equipments, and we have measure the latency and the PEP in each sample. This requirement force us to develop a specific measurement protocol, since we have not direct access to the staticitis and network facilities at the MAC layer in this computers. The rest of this paper is organized as follows, section II contains related works and a concise description of the IEEE 802.11b protocol. Section III describes the protocol developed to measure the statistics. Section IV shows the results obtained in the testbeds, and points out their most significant properties. Finally, section V concludes and describes possible future works.
Transcript
1
An IEEE 802.11 protocol test-bed in industrialenvironments using personal computing devices
J. Vales-Alonso∗, F. J. Perez-Martınez, A. S. Martınez-Sala,E. Egea-Lopez, F. Ponce-Marın, J. Garcıa-Haro
Departament of Information Technologies and Communications,Polytechnic University of Cartagena, Spain.
Abstract— IEEE 802.11 is being currently condisered to de-velop telecommunications infraestructures in industrialenviron-ments. However, in such environments there may be exist ahigh level of Electromagnetic Fields (EMF) contamination,dueto the machinery in use. WLANs are sensitive to this kind ofhazard, and therefore the performance of the protocols may beaffected inside industrial facilities. In this paper we carried outa study of the wireless link performance in these environments,using personal computing devices. Such equipments will belikely used by employees rather than conventional computers.Since results do not characterize the environment itself, butthe set environment-hardware, a proper measurement test-bedmust include direct measures with these devices. Besides, due tolimitations in these devices, a specific protocol to measurepairsof packet error probability and latency was developed. Resultsshow a significant linear dependency between both magnitudes,and a large correlation coefficient in the measurements underhigh EMF activity at mid-large ranges (distances greater than 5meters).
Index Terms— IEEE 802.11, Industrial environments
I. I NTRODUCTION
Wireless networking have driven significant advances ininformation technologies during the last decade. For instance,the Global Mobile System (GSM), the Universal MobileTelecommunication System (UMTS) and the Wireless LocalArea Networks (WLAN) have achieved a high penetrationin the market, both in domestic and offimatic use. Currently,the IEEE 802.11 protocol, and its versionsa, b and g, standout among the WLAN proposals. IEEE 802.11 allows fastand economic network deployment than conventional wiredLANs. Indeed, in industrial enviroments, where it is sometimesquite difficult to setup a wired installation, wireless onesallowdevelopment of handy facilities. However, in this type ofenvironments there may exist a high level of ElectromagneticFields (EMF) contamination, due to the machinery in use.WLANs are sensitive to this kind of hazard, and thereforethe performance of the protocols may be affected inside in-dustrial facilities. Thus, a systematic study of the wireless linkperformance in these environments is mandatory to establishthe limits in the protocol operation.
Additionally, the devices that are being installed in thesefacilities are also different from those employed for commonuse: employees demandmobility, this requirement is meetwith Personal Computing Devices (PCD), e.g. Personal Digital
Assistant (PDA) or Tablet PCs. Besides, new applicationsare being envisioned based in the Wireless Sensor Network(WSN) paradigm, that will allow distributed data collectionand actuation on specific points. The radio transceivers andhardware of both kind of devices (PCDs and WSNs) havedifferent characteristics and properties (e.g. antenna design,processing speed, memory) than conventional ones. Indeed,measurements are not independent from the hardware usedto take them. That is, results do not characterize the en-vironment itself, but the set environment-hardware. Then,aproper measurement test-bed must include direct measureswith these specific devices. In addition, most studies onlytake into consideration the Packet Error Probability (PEP)orthe bit error rate. However, a characterization for a specificenvironment and hardware should also include measurementsof the end-to-end delay, the latency. Both magnitudes, the PEPand the latency characterizes the communication system fromthe MAC layer perspective. Nevertheless, both magnitudesare not, a priori, independent. Therefore, the measurementsoftware must compute pairs of the random bivariate variable(PEP, latency) to characterize the environment.
In this paper we have measured the influence of EMF inindustrial noisy environments in a wireless IEEE 802.11blink. In several experiments we have computed the packeterror probability and the latency. Similar studies have beenalready conducted in other works (see [10]), however authorsused common wireless devices and only measure the PEP.In our test-bed, we have used commercial PDAs to take intoaccount the variations introduced by these equipments, andwe have measure the latency and the PEP in each sample.This requirement force us to develop a specific measurementprotocol, since we have not direct access to the staticitis andnetwork facilities at the MAC layer in this computers.
The rest of this paper is organized as follows, section IIcontains related works and a concise description of the IEEE802.11b protocol. Section III describes the protocol developedto measure the statistics. Section IV shows the results obtainedin the testbeds, and points out their most significant properties.Finally, section V concludes and describes possible futureworks.
2
II. RELATED WORK
Wireless communication has been used for long in indus-try, however its use has been limited to solve very specificproblems, rarely as the main communication infrastructure.Currently, emerging wireless technologies, like IEEE 802.11,have an increasing potential to solve general problems and toserve as the basis of new telecommunications infraestructureto the industry. The key of wireless success in the industrialmarket will be that these systems match the industrial require-ments of security, safety and robustness (see [1]). Such issuesrequire a sound channel characterization and the adaptation ofhigh-level protocols. Probably, the IEEE 802.11 is the mostpromising solution in this field. IEEE 802.11 is based in theCSMA/CA protocol. That is, it uses the collision avoidanceRTS/CTS handsake before actual packet transmission, to avoidthe hidden node issue. In addition, packet reception is directlyacknowledged at the MAC layer, due to the error-prone media.If ACK is not received, the protocol uses the Automatic RepeatreQuest (ARQ) mechanism to recover from this error. Thenumber of the ARQ retransmissions can be configured duringoperation time in the wireless interface. The 802.11b versionof the standard establishes the 2.4 GHz Industrial Scientificand Medical (ISM) Band as the operation band.
Besides, a number of works have analyzed the perfor-mance of IEEE 802.11b under different working scenarios.For instance, in [6] authors study experimentally the effect ofsimultaneous devices (Bluetooth) in the same ISM spectrumthan 802.11b. They conclude that the throughput is consid-erabily affected if both systems share the same coberturearea. In [10] authors measure the bit error rate directly atthe MAC layer in an industrial environment using a specialwireless Network Interface Card (NIC) compliant with theIEEE 802.11 standard. They remark the great time variabilityin the experiments, and conclude that altough results are notrepresentative in all industrial environments, there are commoneffects: large error burst mixed with large error free burstand tendency to burst errors. Finally, the project [11] is agreat effort testbed that indents to collect a comprehensive setof data recording to research on the behavior of operationalwireless networks.
III. M EASUREMENT PROCEDURE
A. Measurement protocol
Measurements were performed using commercial PDAs HPiPAQ Pocket PC h5500. These devices do not allow to usea direct programming interface with the MAC layer, nor thecollection of statistics at the MAC interface. This problemforce us to develop an specific protocol to measure the packeterror probability and the latency (as seen by the IP layer).This protocol was developed directly on the UDP/IP stack. Thepseudo-code description of the proposed protocol is providedin Table I. The measurement algorithm is composed by twoprocesses, a packet server, that just sends packets withoutbreak, and a measurement client, that captures pairs of packeterror probability and latency. For each measurement point theclient averages 100 samples of latency, and computes theassociated PEP as the number of erroneus packets divided
Packet server:
N=0Repeat:
Create packet N with random payloadSend packet NN = N + 1
Measurement client:
For each measurement point,
Receive packet IErrors = 0Packets = 0Samples = 0
Repeat while Samples < 100:Receive packet Jif (seq_number(J) = seq_number(I) + 1 ) then
Packet I = Packet JPackets += Seq_number(J) - Seq_number(I)
end
Compute average latency from Latency SamplesCompute packet error probability (Errors/Packets)
TABLE I
MEASUREMENT PROTOCOL
by the total number of received packets. Notice that latencysamples are only computed if two sequential packets arereceived. Therefore, the total numer of received packets canbe larger than 100. Additionally, as can be seen in the sectionIV this measurement protocol discretises the sampling spacein the PEP axis. The accuracy is around 0.01.
The protocol was implemented in C, and cross compiled forstrongARM using a conventional Intel P-IV PC. The code wasrun on the iPAQ usign the Linux Familiar1 0.8.2 distribution,running Linux kernel version 2.4.18.
B. Post-processing
After each measurement experiment, a set of pairs (PEP,latency) is obtained. These set have been post-processed toease the interpretation of the results. For instance, Fig. 1shows a planar representation of all the points measured inone experiment in the industrial environment described inthe next section. This kind of representation is not clearif many points are concentrated in a small area. To avoidthis issue we have computed a 2D histogram based on themeasured points, and linearly interpolated it. These histogramsare then represented as colormaps where red colors denotesa great probability density, and blue ones a less probabilitydensity. Therefore, we obtain a graphical representation of theprobability density. For instance, 2 corresponds to the data setof Fig. 1). In addition, the line of regression of Latency onPEP (Latency = mPEP + b) for the measured set of pointsis also computed and shown in the corresponding figure. Thecorrelation coefficient,ρ, is also calculed for each data set.
1http://familiar.handhelds.org/
3
0
0.001
0.002
0.003
0.004
0.005
0.006
0.007
0 0.2 0.4 0.6 0.8 1
Pac
ket l
aten
cy
Packet error probability
Industrial Environment (4 m)
Fig. 1. Example of raw data
Industrial environment (4 m)
Packet error probability
Pac
ket l
aten
cy
0 0.1 0.2 0.3 0.4 0.5 0.6 0.7 0.8 0.9
3
3.5
4
4.5
5
5.5
6
6.5
x 10−3
Fig. 2. Example of post-processed data
IV. RESULTS
In this section the experimental results obtained are pre-sented. Table II shows the main configuration parameters usedfor all the experiments. In each test two stations were situatedat a staic distanced. In this position 4,000 points were captured(about 400,000 samples)2. The tests were performed in twoscenarios:
1) IT-6 laboratory of the Polytechnic University of Carta-gena, Spain (see Fig. 3). It is composed of severalworkstations. This environment is similar to offimaticconfigurations. In this scenario, we performed severaltest to adjust the measurement protocol. These testsare also used to compare with the results from theindustrial environment. For instance, Fig. 5 shows theresults obtained in this environment for distance d =19 m. Results indicate a high and puntual probabilityconcentration around the mean value of the pair PEP,latency; e.g. (0.0022, 0.0030) in the previous example.Figure 5 also shows a zoom of the [0, 0.02]x[2.8, 3.4]area. In this zoom the effect of discretization in the PEPaxis -due to the measurement protocol- is noticeable.Additionally, the measured correlation coefficient was
2In all the experiments, but in the industrial configurationsof d = 32 mand d = 48 m, where only 2,000 points were captured due to safety reasons.
Fig. 3. IT-6 Laboratory, Polytechnic University of Cartagena, Spain
less than 0.5 in all the experiments performed, and equalto ρ = 0.1508 for the scenario of Fig. 5.
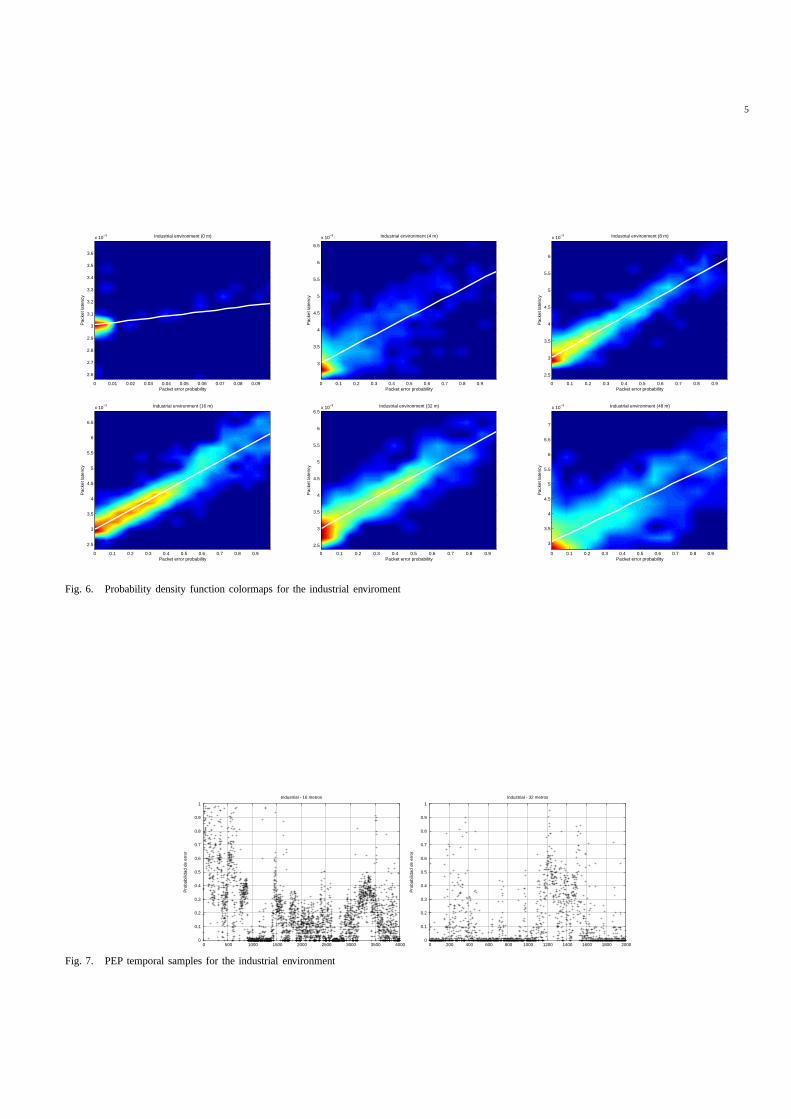
2) Industrial facilities of the Estructuras del Mar Menorfactory, in Cartagena, Spain (see Fig. 4). This is a typicalfactory floor, with several moving employees performingsoldiering and working with heavy machinery. Fig. 6shows the probability density representations measuredfor the distances d = 0, 4, 8, 16, 32 and 48 meters.The correlation coefficients measured wereρ = 0.3982,0.8336, 0.9588, 0.9634, 0.9532 and 0.8448, respectively.Results show a clear linear dependency of both mag-nitudes, PEP and latency, for distances d≥ 8 m. Onthe opposite, for tests performed at a less distance, theshapes of the probability density function are similarto the punctual distributions obtained for the offimaticenvironment. Besides, in the trial of d = 16 m there was asoldiering activity peak, this effect has been captured inthe corresponding probability density function, as can beobserved in Fig. 6. The probabity is more spread alongthe line of regression. The correlation coefficient was,indeed, maximum in this trial.In addition, the ordered PEP samples are depicted inFig. 7 for d = 16 m and d = 32 m. A high burstinesscan be observed in these figures. This property is alsopresent in the rest of the tests.
A. Discussion
Based on the previous results we can conclude that,
1) There is a very significant change between industrialand offimatic environment, for distances in the mid-largerange (d ¿ 5 m). Besides, in industrial environment thecorrelation coefficient is large (ρ ≥ 0.8) than in offimaticenvironments (ρ ≤ 0.5).
4
Fig. 4. Industrial facilities of Estructuras Mar Menor, Spain
Fig. 5. IT-6 Laboratory, 19 m test
2) As the distance grows, the probability density is dis-tributed along the line of regression of Latency on PEP.Therefore, there is a stressed linear dependency of PEPand latency in industrial environments.
3) Peaks of EMF activity cause higher correlation coeffi-cients (ρ ≈ 0.95), and a noticeable probability densityspread.
4) As in [10] a high burtstiness was observed in theexperiments.
V. CONCLUSIONS AND FUTURE WORK
In this paper we have developed a measurement tool tocompute the probability density function associated to thebivariate random variable (Packet error probability, Latency).Using this tool we perform several tests in offimatic andindustrial environments. Results show that there is a cleardependency among both random variables in the industrialenvironment, and that the dispersion of the probability issmall if transmitter and receiver are closer. If distance betweenthem is larger or there are EMF activity, the dispersion isgreater. These results have been computed using personalcomputing devices, rather than conventional computers, totakeinto account the effect of the hardware.
In our future work we aim to develop a simulator basedin the previous measurements, considering also the stochastic
nature of the system. This simulador will enable us to computethe reliability and performance of applications in an industrialfacility, without the need of direct test (at least in the firststages of the application development). In addition, we willextend the measurements obtained performing new tests withdifferent hardware (e.g. Mica2 motes commonly employed inWSN) and with different configuration parameters, to studytheir effect in the results.
REFERENCES
[1] E. Egea-Lopez, A. Martinez-Sala, J. Vales-Alonso, J. Garcia-Haro,J. Malgosa-Sanahuja Wireless Communications Deployment inIndustry: A Review of Issues, Options and TechnologiesComput.Ind., 56(1): 29–53.
[6] J. del Prado Pavn y S. Choi (2001).Experimental Study on Co-existence of 802.11b with Alien Devices. Wireless Communicationand Networking Philips Research USA.
[9] D. Aguayo, J. Bicket, S. Biswas, G. Judd y R. Morris (2004). Link-Level Measurements from an 802.11b Mesh Network. CarnegieMellon University.
[10] A. Willing, M. Kubisch, C. Hoene y A. Wolisz, Diciembre 2002.Measurements of a Wireless Link in an Industrial EnvironmentUsing an IEEE 802.11-Compliant Physical Layer. IEEE Trans.of Industrial Electronics, vol. 49, no. 6, Diciembre 2002.
[11] http://uluru.ee.unsw.edu.au/ tim/measure.11IEEE 802.11 Measure-ments Project. Tim Moors, Robert Malaney. Mahbub Hassan.
5
Industrial environment (0 m)
Packet error probability
Pac
ket l
aten
cy
0 0.01 0.02 0.03 0.04 0.05 0.06 0.07 0.08 0.09
2.6
2.7
2.8
2.9
3
3.1
3.2
3.3
3.4
3.5
3.6
x 10−3 Industrial environment (4 m)
Packet error probability
Pac
ket l
aten
cy
0 0.1 0.2 0.3 0.4 0.5 0.6 0.7 0.8 0.9
3
3.5
4
4.5
5
5.5
6
6.5
x 10−3 Industrial environment (8 m)
Packet error probability
Pac
ket l
aten
cy
0 0.1 0.2 0.3 0.4 0.5 0.6 0.7 0.8 0.9
2.5
3
3.5
4
4.5
5
5.5
6
x 10−3
Industrial environment (16 m)
Packet error probability
Pac
ket l
aten
cy
0 0.1 0.2 0.3 0.4 0.5 0.6 0.7 0.8 0.9
2.5
3
3.5
4
4.5
5
5.5
6
6.5
x 10−3 Industrial environment (32 m)
Packet error probability
Pac
ket l
aten
cy
0 0.1 0.2 0.3 0.4 0.5 0.6 0.7 0.8 0.9
2.5
3
3.5
4
4.5
5
5.5
6
6.5x 10
−3 Industrial environment (48 m)
Packet error probability
Pac
ket l
aten
cy
0 0.1 0.2 0.3 0.4 0.5 0.6 0.7 0.8 0.9
3
3.5
4
4.5
5
5.5
6
6.5
7
x 10−3
Fig. 6. Probability density function colormaps for the industrial enviroment
0
0.1
0.2
0.3
0.4
0.5
0.6
0.7
0.8
0.9
1
0 500 1000 1500 2000 2500 3000 3500 4000
Pro
babi
lidad
de
erro
r
Industrial - 16 metros
0
0.1
0.2
0.3
0.4
0.5
0.6
0.7
0.8
0.9
1
0 200 400 600 800 1000 1200 1400 1600 1800 2000
Pro
babi
lidad
de
erro
r
Industrial - 32 metros
Fig. 7. PEP temporal samples for the industrial environment