VOL. 51, N0.2, CAN. PLANT DIS. SURV. JUNE, 7977 39 AN ILLUSTRATED SERIES OF ASSESSMENT KEYS FOR PLANT DISEASES, THEIR PREPARATION AND USAGE ' W. CIive James Abstract The percentage scale was exclusively used to define different disease severities in an illustrated series of disease assessment keys for cereal, forage, and field crops. The standard area diagrams were accurately prepared with an electronic scanner. Procedures for assessing the different diseases are outlined in order t o achieve some degree of standardization in disease assessment methods. Introduction The main reason for measuring plant diseases is to obtain quantitative data on the Occurrence and development of diseases. Such data are a vital requirement in most aspects of plant pa&ology and are used to assess the relative importance of different diseases by comparing their incidence and intensity on agricultural crops. These measurements are also used in con junction with yield or quality data to determine the relationship between disease intensity and crop loss so t h a t economic losses can be calculated from surveys conducted to assess the importance of diseases. Under certain circumstances disease measurements provide a critical tool for distinguishing treatment differences that cannot be detected by measuring yield or quality; hence use is made of disease measurements in trials conducted to test the relative efficacy of fungicides and their respective formulations, and in variety trials designed to detect small differences in disease resistance between varieties. Diagnosis and measurement of plant diseases represent two of the basic principles practised in plant pathology. With a few exceptions, methods for identifying pathogens are standardized throughout the world as a result of taxonomic classifications which are universally accepted. However the measurement of plant diseases has received less attention and even the published methods lack consistency. The Food and Agriculture Organization of the United Nations has prepared a manual (4) in an effort to publicize and standardize methods for estimating crop losses, and since this inevitably involves disease assessment some degree of standardization will result. Large (21) reviewed many of the methods used for measuring disease that have appeared as isolated examples in the literature. However, to the author's knowledge there has been no attempt t o develop or publish a Contribution No. 277, Research Station, Canada Department of Agriculture, Ottawa, Ontario series of disease assessment keys using the sane guiding principles throughout. The objective of this paper is to present such a series of keys for various crops so that pathologists can use them and report on their merits and faults with a view t o producing better keys for the future. The work reported here is particularly concerned with developing disease assessment methods t h a t can subsequently be used in connection with estimates of crop loss. Methods and discussion Disease assessment methods fall into two categories. The f i r s t is represented by the general descriptive type of key (1, 19) in which plants with varying amounts of disease are described. Probably the best known key in this category is the one used (1) for assessing late blight of potato caused by Phytophthora infestans (M0nt.i de Bary (see Key No. 3.1.2). The second category of assessment methods utilizes standard -area diagrams; the first example was published in 1892 by Nathan Cobb (3), and it illustrated different severities of rust with five standard area diagrams. These standard area diagrams typified the pattern of the disease on wheat leaves where 1,5,10,20, and 50% of the leaf area was occupied by rust pustules. The assessment keys presented here are also based on standard area diagrams, although guidance notes are provided with some of the keys. The specifications of a successful disease assessment key are very demanding; however, there are two major requirements. The f i r s t is that observers using the key on a particular group of diseased plants must be able to arrive at similar assessments consistently, and the second is that assessment be achieved simply and quickly. The keys preseqted in this paper are based on a percentage scale because of the many advantages that such a scale offers. The upper and lower limits of a percentage scale are always uniquely defined, and the
AN ILLUSTRATED SERIES OF ASSESSMENT KEYS FOR PLANT DISEASES, THEIR PREPARATION AND USAGE'
W. CIive James
Abstract
The percentage sca l e was exclus ive ly used t o define d i f f e r e n t d isease s e v e r i t i e s i n an i l l u s t r a t e d series of d isease assessment keys f o r ce rea l , forage, and f i e l d crops. The standard area diagrams were accura te ly prepared with an e l e c t r o n i c scanner. Procedures f o r assess ing t h e d i f f e r e n t d iseases a r e out l ined i n order t o achieve some degree of s tandardiza t ion i n d isease assessment methods.
Introduction The main reason f o r measuring p l a n t
d iseases is to obta in quan t i t a t i ve d a t a on the Occurrence and development of diseases. Such da t a a r e a v i t a l requirement i n most aspects of p l a n t pa&ology and are used to assess t h e r e l a t i v e importance of d i f f e r e n t d i s eases by comparing t h e i r incidence and i n t e n s i t y on a g r i c u l t u r a l crops. These measurements are a l so used i n con junction with y i e l d o r q u a l i t y da t a t o determine the r e l a t i onsh ip between d i sease i n t e n s i t y and crop l o s s so t h a t economic lo s se s can be ca l cu l a t ed from surveys conducted t o assess t h e importance of diseases. Under c e r t a i n circumstances d i sease measurements provide a cri t ical t o o l f o r d i s t i ngu i sh ing treatment d i f f e r ences t h a t cannot be de tec ted by measuring y i e l d o r qua l i t y ; hence use is made o f d i s ease measurements i n tr ials conducted t o test t h e r e l a t i v e e f f i cacy of fungicides and t h e i r r e spec t ive formulations, and i n va r i e ty t r i a l s designed t o d e t e c t small d i f f e r ences i n d i sease r e s i s t ance between v a r i e t i e s .
Diagnosis and measurement of p l a n t d iseases represent t w o of the b a s i c p r inc ip l e s p rac t i s ed i n p l an t pathology. With a few exceptions, methods f o r i den t i fy ing pathogens a r e standardized throughout t h e world as a r e s u l t of taxonomic c l a s s i f i c a t i o n s which are universa l ly accepted. However t h e measurement of p l a n t d iseases has received less a t t en t ion and even the published methods lack consistency. The Food and Agr icul ture Organization of t h e United Nations has prepared a manual (4) i n an e f f o r t t o pub l i c i ze and s tandardize methods f o r es t imat ing crop losses , and s ince t h i s i nev i t ab ly involves d isease assessment some degree of s tandardiza t ion w i l l r e su l t . Large (21) reviewed many of t he methods used f o r measuring d i sease t h a t have appeared as i s o l a t e d examples i n t he l i t e r a t u r e . However, t o the au tho r ' s knowledge the re has been no attempt t o develop o r publish a
Contribution No. 277, Research S t a t i on , Canada Department of Agriculture, Ottawa, Ontario
series of d i s ease assessment keys using the sane guiding p r inc ip l e s throughout. The objec t ive of t h i s paper is t o present such a series of keys f o r various crops so t h a t pa thologis t s can use them and r e p o r t on t h e i r merits and f a u l t s with a view t o producing b e t t e r keys f o r t h e fu ture . The work reported here is p a r t i c u l a r l y concerned with developing d isease assessment methods t h a t can subsequently be used i n connection with estimates of crop loss.
Methods and discussion
Disease assessment methods f a l l i n t o two categories. The f i r s t i s represented by the general desc r ip t ive type of key ( 1 , 19) i n which p l a n t s with varying amounts of d isease are described. Probably the bes t known key i n t h i s category is t h e one used ( 1 ) f o r assess ing l a t e b l i g h t of po t a to caused by Phytophthora i n fe s t ans (M0nt.i de Bary (see Key No. 3.1.2). The second category of assessment methods u t i l i z e s s tandard - a r e a diagrams; t he f i r s t example w a s published i n 1892 by Nathan Cobb ( 3 ) , and it i l l u s t r a t e d d i f f e r e n t s e v e r i t i e s of rust with f i v e standard area diagrams. These standard a r ea diagrams t y p i f i e d t h e p a t t e r n of t he d i sease on wheat leaves where 1,5,10,20, and 50% of t h e l ea f a rea w a s occupied by r u s t pustules. The assessment keys presented here are a l so based on standard area diagrams, although guidance notes a r e provided with some of t h e keys.
The spec i f i ca t ions of a successfu l d isease assessment key are very demanding; however, t h e r e are t w o major requirements. The f i r s t i s t h a t observers using t h e key on a p a r t i c u l a r group of diseased p l an t s must be able t o a r r i v e a t s i m i l a r assessments cons is ten t ly , and the second is t h a t assessment be achieved simply and quickly.
The keys preseqted i n t h i s paper a r e based on a percentage s c a l e because of t h e many advantages t h a t such a scale o f f e r s . The upper and lower l i m i t s of a percentage s c a l e a r e always uniquely defined, and t h e
s c a l e is f l e x i b l e i n t h a t it can be conveniently divided and subdivided, e.g. SO%, l o%, 176, 0.1%. Another advantage is t h a t it is universa l ly known and accepted. It can be used to record t h e proport ion of p l an t s infec ted , t h e a r ea damaged by a fo l i age o r root pathogen, or t h e number of roots o r f r u i t s a f f ec t ed expressed as a percentage of t he t o t a l number present . Although only a few degrees of i n f ec t ion a r e shown i n t h e keys presented here, e.g. 1,10,20, and 50%, in t e rpo la t i ons can be made when assessments a r e recorded, e.g. 3,15,40%. The ex t en t of i n t e rpo la t i on should be d i c t a t ed by t h e a b i l i t y of t he observer t o d e t e c t d i f f e r ences i n l eve l of infec t ion .
In t h i s paper, the percentage of i n f ec t ion noted represents the ac tua l a rea covered by t h e pus tu les o r les ions i l l u s t r a t e d ; f o r example, i n the key f o r l ea f r u s t of ce rea l s 1% represents t h e ac tua l a rea of t h e lamina covered by the black spots (which represent pus tu les) expressed as a percentage of t h e area of the l ea f i l l u s t r a t e d . ~n add i t i ona l assessment is made of y y ch lo ro t i c o r dead t i s s u e associa ted with t h e pus tu les and i s added t o t h e pus tu le o r l e s ion assessment to provide an estimate of t he " v i s i b l e a rea af fec ted" ; f o r example i f t h e pus tu le a rea i s 1% and chloros is 4% , t he d isease percentage recorded is 5%. Simi lar ly , i f a hypersensi t ive reac t ion i s observed, such as t he development of n e c r o t i c a reas r a t h e r than sporing pus tu les when ce r t a in v a r i e t i e s of wheat a r e infec ted wi th s t r i p e r u s t (23) , t he percentage of v i s i b l e a rea a f f ec t ed i s equiva lent to t h a t of t h e n e c r o t i c area. Also i f it i s known t h a t a p a r t i c u l a r les ion w i l l i ncapac i t a t e a l a rge r area than t h a t occupied by the les ion , f o r example a p e t i o l e l e s ion may incapaci ta te t he whole lamina , then t h e percentage recorded i s t h a t of t he l a r g e r area. It w i l l be appreciated t h a t it i s n o t poss ib le to i l l u s t r a t e areas of ch lo ro t i c o r dead t i s s u e i n t h e keys because the v a r i a b i l i t y is SO grea t . This technique f o r recording. d i s ease by assess ing percentage l ea f a rea af fec ted i s j u s t i f i a b l e i f t he aim i s t o r e l a t e d isease levels to losses i n p l a n t production because a measure of t h e pus tu le a rea p lus t h a t of any associa ted damage is probably a b e t t e r indica t ion of t he damage caused by the d isease than a measure of t h e pus tu le area alone. However, t h i s approach could not be j u s t i f i e d i f the objec t ive w a s d i f f e r e n t , f o r example i n an epidemiological s tudy designed to measure t he number of spores i n a diseased p l an t population. I f t h e keys a r e used as suggested, it i s q u i t e poss ib le t h a t , i n p rac t i ce , l eve l s of 100% in fec t ion may never be encountered, but t h i s i s not considered t o be a disadvantage. When d isease l e v e l i s r e l a t ed t o y i e l d l o s s t he re is no reason why t h e maximum l eve l of disease should be recorded as 100%. In t h i s connection Melchers and Parker (24) modified the o r i g i n a l Cobb Scale (3) so t h a t t h e maximum area covered by r u s t , which was a r b i t r a r i l y
chosen as 37% of the l ea f or stem cover, w a s l abe l l ed 100%. The modified Cobb Scale was expanded by Peterson e t a l . (26) t o represent addi t ional l e v e l s of i n f ec t ion , but an ac tua l a f fec ted area cover of 37% was a l s o l abe l l ed 1001, as i n t he modified Cobb Scale.
The degree of accuracy des i r ed i n d i sease assessment va r i e s according to t he p a r t i c u l a r objec t ives of a research program. Consequently, t he usage of a p a r t i c u l a r d isease assessment method. w i l l n o t be t h e same i n a l l s i t ua t ions . This i s p a r t i c u l a r l y t r u e i n r e l a t i o n t o sample s i z e , which v a r i e s enormously , depending upon t h e ob jec t ives of the experiment o r survey. However, it may be he lp fu l t o note some of the guiding p r inc ip l e s t h a t should be followed i n making d isease assessments, bearing i n mind t h a t each s i t u a t i o n demands spec i a l cons ide r a t i o n leading t o modificat ion of t h e spec i f ica t ions .
Whenever d i sease assessments a r e recorded, t he growth s t age should be noted, according to a published key (171, i f possible. S imi lar ly , i f the assessment r e f e r s to any p a r t i c u l a r p l an t component, f o r example p a r t i c u l a r leaves, t h i s f a c t should be recorded so t h a t meaningful comparisons can be made a t a later date. The method of s e l e c t i n g the sample f o r assessment should a l s o be recorded, i.e. random o r sys temat ic sampling of s i n g l e leaves , indiv idual p l a n t s , groups of p l an t s , length of row, a r e a of crop, o r o ther un i t s . The average in fec t ion should be ca lcula ted by d iv id ing t h e t o t a l d isease recorded by the number of u n i t s i n t h e sample; t he average is therefore based on the healthy and in fec t ed u n i t s i n t h e sample (see example f o r cereal l ea f rust). An exception to t h i s r u l e occurs when the average in fec t ion within f o c i is ca lcula ted (see t h e example f o r late b l i g h t of po t a to ) . Lack of time sometimes precludes t h e assessment of indiv idual leaves o r root systems, but f o r some diseases indiv idual p l a n t s must be examined c lose ly .
The simplest technique is usual ly t he one l e a s t prone t o e r ro r . The assessment of d isease on indiv idual ce rea l leaves is an example of a simple e f f e c t i v e method. Each d isease present is assessed ind iv idua l ly and, because t h e observer i s assess ing one d i sease on one l ea f a t one t i m e , t h e e r r o r a t tached to an observation is small. Addit ional readings a r e made f o r t he percentage of green t i s s u e remaining and t h e percentage of dead t i s s u e not v i sua l ly a t t r i b u t a b l e t o d isease . When seve ra l leaves have been assessed, t h e information recorded can be used t o ca l cu l a t e the mean and i t s standard e r r o r ; t h e d a t a may a l s o be used t o es t imate the number of leaves required to give a d i sease mean w i t h a des i red standard e r r o r . The p r i n c i p l e s involved i n sampling techniques have been reviewed recent ly by Church ( 2 ) .
The notes t h a t accompany the d i sease assessment keys i n t h i s paper a r e intended
VOL.51, N0 .2 , CAN. PLANT D/S..SURV. JUNE, 1977
for general guidance and can be modified t o s u i t indiv idual requirements. The standard area diagrams presented here have been incorporated i n t o a d isease assessment manual designed f o r use i n the f i e l d . The manual cons i s t s of a series of d isease assessment keys and growth s t age diagrams of hos t p lants . The keys have been pr in ted on durable p l a s t i c material so t h a t they can be used r e p e t i t i v e l y under rigorous f i e l d conditions. Each key i s p r in t ed as a separa te 7 x 4 inch (17.8 x 10.2 cm) pocket- s i z e sheet , so t h a t it can be taken ou t of the loose l ea f fo lde r f o r use; when new keys are ava i l ab le they w i l l be d i s t r ibu ted f o r inc lus ion i n t h e manual. The manual has been prepared i n an attempt t o standardize d isease assessment methods, and it is therefore complementary t o the FA0 Manual on Crop Loss Assessment Methods ( 4 ) , i n which only proven methods f o r assessing losses due t o disease, r a t h e r than d isease assessment keys, are published. Copies of t h e publ ica t ion , A planual of Assessment Keys f o r Plant Diseases, are avai lable from t h e author.
Preparation of keys
The preparation of standard area diagrams can be laborious, e spec ia l ly when v e r i f i c a t i o n is needed t h a t t he 1% i n fec t ion represented ac tua l ly occupies 1% of t h e area on t h e standard area diagram. By using conventional apparatus such as a planimeter, it is very d i f f i c u l t t o measure a small a rea accurately; f o r example, 1% on t h e key f o r l ea f r u s t of cereals is made up of 20 u n i t areas. This problem w a s solved by using an IBM drum scanner which measures areas t o within 1/62,500 sq inch. A l l t h e keys were drawn approximately 4 times l a rge r than the s i z e shown, thus simplifying the task of drawing t h e les ions , which w e r e copied from diseased leaves. The drawings were made on 24 x 36 inch "Cronaflex" sheets , and t h e necessary areas w e r e measured on the scanner.
The scanner system consis ts of a scan head containing a photoelec t r ic cel l t h a t records black areas i n un i t s of 1/62,500 sq inch. The recorded information w a s s to red on magnetic tape and then processed t o determine the measurement of t h e area. For example, f o r t h e l ea f r u s t of cerea ls key the l ea f area out l ined w a s shaded black, and t h e total area of t h e l ea f measured. Similarly, t h e to ta l area of t h e les ions representing 1% w a s measured ( apa r t from t h e l ea f ou t l i ne ) and expressed as a percentage of t he t o t a l l ea f area. Af ter t h e f i r s t scan w a s completed, t h e area designated a s 1% w a s increased or decreased as required, and rescanned t o ve r i fy t h a t t h e correc t ion produced t h e des i red e f f ec t . A 2 4 x 36 inch sheet can be scanned i n approximately 10 minutes.
41
Use of disease assessment keys A. Cereal crops (wheat, barley, oats)
Growth Stages. U s e the growth s t age key (17) t o i nd ica t e t h e s tage of crop growth.
Samplinq. Se lec t a random sample of f e r t i l e tillers. For p l o t s up t o 0.01 of an acre (0.004 hectare) select 10 primary fer t i le t i l lers. For l a rge r p l o t s and f i e l d s select up t o 50 t i l lers a t random along one d,iagonal o r o the r appropriate area. Sample s i z e is determined by t h e v a r i a b i l i t y of d isease and by t h e accuracy desired.
Assessin Disease. Assess t h e percentage d a r e n f e c t e d by d isease on individual laminae, sheaths, or spikes. Make separa te assessments i f t he re is more than one d isease present and assess the percentage area remaining green; t h e percentage dead t i s s u e not associa ted with d isease can be ca lcula ted l a t e r by subt rac t ion , v iz . 100% - ( t o t a l percentage d isease) - (percentage green t i s sue ) = percentage dead t i s sue .
Calculate average in fec t ions f o r each s p e c i f i c group of leaves (see example).
Make estimates a t various growth s t ages and note l ea f pos i t i on so t h a t meaningful comparisons can be made f o r various leaves.
These keys have been s p e c i f i c a l l y developed f o r assess ing cereal d iseases bu t they may be used f o r d iseases of grasses i f t h e symptoms are similar.
EXAMPLE - Assessment of cerea1, leaf rust .
Determine percentage l ea f area a f f ec t ed by leaf r u s t of ce rea l s , based on 10 f e r t i l e t i l lers from a plo t . Data f o r o the r diseases, green t i s s u e , and dead t i s s u e 'can be t r e a t e d i n a similar way.
One shoot (number of leaves can be added) = "brairding" ,
Beginning of t i l l e r i n g T i l l e r s formed, leaves of ten
twisted s p i r a l l y . In some v a r i e t i e s of winter wheats, p lan ts may be "creeping" o r p r o s t r a t e
the pseudo-stem, l e a f sheaths beginning t o lengthen
Pseudo-stem (formed by sheaths of leaves) s trongly erected
F i r s t node of stem v i s i b l e a t base of shoot
Second node of stem formed, next- to- last l e a f j u s t v i s i b l e
r o l l e d up, spike beginning t o swell
Ligule of l a s t l ea f j u s t v i s i b l e
Sheath of l as t l e a f completely grown out , spike swollen bu t n o t y e t v i s i b l e
F i r s t spikes j u s t v i s i b l e (awns j u s t showing i n barley, spike escaping through s p l i t of sheath i n wheat o r o a t s )
Beginning of the e rec t ion of
L a s t l e a f v i s i b l e , b u t s t i l l
10.2 Quarter of heading
10.3 Half of heading process
10.4 Three-quarters of heading
10.5 All spikes out of sheath 10.5.1 Beginning of flowering
(wheat) 10.5.2 Flowering complete to
top of spike 10.5.3 Flowering over a t base
of spike 10.5.4 Flowering over, kernel
watery r i p e Milky r i p e Mealy r i p e , contents of kernel
s o f t b u t dry Kernel hard ( d i f f i c u l t t o
divide by thumb-nail) Ripe f o r cu t t ing . Straw dead
process completed
completed
process completed
GROWTH STAGES IN CEREALS
T I LLERING
STAGE I STAGE S I
STAGE ST?' 3 rtrong
sheaths e rec t2 lengthen tlllerlng formed
STEM EXTENSION
In boot
( A f t e r E.C. Large. 1954. P l a n t P a t h o l . 3:128-129)
--."-- --- I
VOL.51, N0 .2 , CAN. PLANT DIS. SURV. JUNE, 1971
B. Forage crops (alfalfa, clover)
Growth stages. Use the growth s tage key t o i n d i c a t e t h e s tage of crop growth.
Samplin . Se lec t a random sample of p l an t units f z r d isease assessment. The units may cons i s t of indiv idual leaves , plants , groups of p l an t s , o r a l l p l an t s i n a p a r t i c u l a r quadrat o r a rea , e.g. f t 2 . yd2 . o r m 2 . Calculate t he average infec t ion f o r t he sample u n i t s employed.
$s"fesing Disease. Some diseases may cause e o i a t i o n when only a small percentage of
the l ea f area i s affected. For these p l an t s es t imate the area of leaves lost by de fo l i a t ion and add t h i s t o t h e percentage in fec t ion on t h e remaining leaves t o obtain the required es t imate of percentage leaf a rea af fec ted by disease.
Growth stage key for legumes
The growth and development of legumes have been divided i n f i v e major stages, which have been numbered consecutively. Each major s tage has been divided i n t o two o r more substages. I f f u r t h e r refinement is required more substages can be added i f they are adequately described.
The recording of a stage requi res the use of a two d i g i t number; f o r ekample, e a r l y bud i n legumes = 21; 2 = bud, 1 = ear ly .
This system of c l a s s i f i c a t i o n requi res t h a t ha l f t h e stems i n each p l o t must be i n the s t age so described.
43
Stages of development of legumes
Major s tages Substages
1 Vegetative
2 Bud
3 Flower
4 Full flower
5 Seed
1 Early - 2 Medium -
3 Late -
1 Early -
2 Medium -
3 Late -
4-6 inches high
over 6 inches high (before any buds a r e
pre-bud (a few stems may be i n early bud stage)
buds minute, may be f e l t as an enlargement i n apex of stem
buds well formed and vis ib le
buds v is ib le , swollen; e a r l i e s t buds showing some color a t t i p s
detectable)
10% bloom
25% bloom
50% bloom
75% bloom
100% bloom
Flowers dying
Early - green seed pods
Medium - seed i n dough stage
Mature - seed mature
(After a system developed by D r . J. E. Winch, University of Guelph)
C. Field crops (potatoes, beans)
Samplinq. assessment.
Assessing Disease. Choose a un i t length of row f o r r o w crops, or a small quadrat o r area f o r o the r crops and assess the percentage l e a f area affected. I f appropriate, s ing le leaves o r p l an t s may be assessed. Calculate average infec t ions f o r t h e sample un i t s employed.
I f t h e primary s tages of d isease develop as foc i , determine t h e average area of t h e foc i and the number/acre o r hectare and express as percentage acreage af fec ted . Calculate percentage l ea f a rea af fec ted within t h e in fec t ed area , as i n the following example.
Se lec t a random sample f o r d isease
EXAMPLE - Assessment of l a t e b l igh t of potatoes
(a) Primary s tages of epidemic - When in fec t ion is present i n l imi ted f o c i
Average number of foc i /acre 5 Average area of foc i Average percentage l ea f a rea
infec ted within f o c i 1%
Percentage acreage af fec ted = 15/4840
Therefore 0.3% of acreage i s a f f ec t ed , with an average infec t ion of 1% within t h e foc i .
3 yd2
=I 0.31
(b) Later stages of epidemic - Se lec t 10 sample areas a t random in t h e f i e l d and assess percentage l ea f a r ea af fec ted . Calculate average infec t ions as f o r ce rea l disease assessments .
EACH DIVISION REPRESENTS 10% OF THE AREA OF EACH LEAF
THE BLACK AREAS REPRESENT 1, 2, & 5% OF EACH LEAF
Use for: Leaf blotch or scald (Rhynchosporium
secalis (Oud.) Davis) of barley
Procedure: Select a random sample of fertile tillers.
Growth stages: Assess the percentage area affected by rhynchosporium on the upper side of the laminae of the flag and second leaves, at growth stage 1 1 . 1 . The key can also be used for recording the disease at earlier growth stages, but the growth stage and leaf position (top leaf = leaf 1) should be carefully noted, so that valid comparisions can be made between crops.
Match the leaf to one of the diagrams and use the black areas (representing 1%, 2%. and 5% of each leaf) as a guide in assessing the percentage leaf (lamina) area covered by small isolated lesions, and the 10% sections for the larger lesions that have coalesced. For the purpose of this key, affected area includes the lesions and any yellowing that appears to be associated with a lesion. Differences in disease incidence will be reflected in comparisons of either flag leaf or second leaf values, depending on the level of the infection.
Assessing severity:
References: 8, 9, 10
VOL.51, N0.2, CAN. PLANT DIS. SURV. JUNE, 1971 45
LEAF RUST OF CEREALS
Key No. 1.2
Use for: Crown rust of oats (Puccinia coronata
Leaf rust of wheat (Puccinia triticina
Leaf rust of barley (Puccinia recondita Rob.
(Corda) Erikss. & Henn.)
Erikss.)
ex Desm.)
Procedure: Select a random sample of fertile tillers.
Growth stages: Assess at growth stages 10.5 and either 1 1.1 or 1 1.2 or both. The key can also be used for recording the disease at earlier growth stages, but the growth stage and leaf position (top leaf = leaf 1) should be carefully noted, so that valid comparisons can be made between crops.
Assessing severity: Assess percentage leaf (lamina) area affected by disease on individual top leaves.
Pers. f. sp. tritici Erikss. & Henn.) Stem rust of oats (Puccinia graminis Pers.
f. sp. avenae Erikss. & Henn.) Stem rust of barley (Puccinia graminis
Pers. f. sp. secalis Erikss. & Henn.)
Procedure: Select a random sample of fertile tillers.
Growth stages: Assess at growth stages 1 1.1 or 1 1.2. The key can also be used for recording the disease at earlier growth stages, but the growth stage and leaf position (top leaf = leaf 1) should be carefully noted, so that valid comparisions can be made between crops.
Assessing severity: Assess percentage leaf (sheath) area affected by disease on individual top leaves.
References: 6, 27
VOL. 51, NO.2, CAN. PLANT DIS. SURV. JUNE, 1971
POWDERY MILDEW OF CEREALS
Key No, 1.4
47
1 50
Use for: Powdery mildew of wheat (Erysiphe
graminis DC. ex Marat f. sp. tritici Marchal)
Powdery mildew of barley (Erysiphe graminis f. sp. hordei Marchal)
Powdery mildew of oats (Erysiphe graminis DC. ex W a t )
Procedure: Select a random sample of fertile tillers.
Growth Stages: Assess at growth stage 10.5. The key can also be used for recording the disease at earlier growth stages, but the growth stage and leaf position (top leaf = leaf 1) should be caretully noted, so that valid comparisons can be made between crops.
Assessing severity: Assess percentage leaf (lamina) area affected by disease on individual top leaves.
Growth stages: Assess at growth stages 10.5 and either 11.1 or 11.2 or both.
Assessing severity: Assess percentage spike area affected by disease.
Reference: 15
PERCENTAGE SPIKE AREA COVERED
VOL.51, N0.2. CAN. PLANT DIS. SURV. JUNE, 1971
SEPTORIA LEAF BLOTCH OF CEREALS (Leaf symptoms)
Key No. 1.6.1
49
Use for: Glume blotch of wheat (Septoria nodorum
Speckled leaf blotch of wheat (Septoria
Leaf blotch of wheat (Septoria avenae
Leaf blotch and black stem of oats
Speckled leaf blotch of barley (Septoria
Berk.)
tritici Rob. ex Desm.)
Frank f. sp. friticea T. Johnson)
(Septoria avenae Frank f. sp. avenae)
passerinii Sacc.)
Procedure: Select a random sample of fertile tillers.
Growth stages: Assess at growth stages 10.5 and either 1 1.1 or 1 1.2 or both. The key can also be used for recording disease at earlier growth stages, but the growth stage and leaf position ( top leaf = leaf 1) should be carefully noted, so that valid comparisons can be made between crops.
Assessing severity: Assess percentage leaf (lamina) area affected by disease on individual top leaves.
Reference. 15
PERCENTAGE LEAF AREA COVERED
50
-
VOL.57, N0.2, CAN. PLANT DIS. SURV. JUNE, 7977
SEPTORIA LEAF BLOTCH OF CEREALS (Stem symptoms)
Key No. 1.6.2
- 1 5 15
I I 1 50
Use for: Glume blotch of wheat (Septoria nodorum
Speckled leaf blotch of wheat (Septoria
Leaf blotch of wheat (septoria avenae
Leaf blotch and black stem of oats
Speckled leaf blotch of barley (Sepforia
Berk.)
tritici Rob. ex Desm.)
Frank f. sp. triticea T. Johnson)
(Septoria avenae Frank f. sp. avenae)
passerinii Sacc.)
Procedure: Select a random sample of fertile tillers.
Growth stages: Assess at growth stages 10.5 and either 1 1.1 or 1 1.2 or both. The key can also be used for recording the disease at earlier growth stages, but the growth stage and leaf position (top leaf = leaf 1) should be carefully noted, so that valid comparisons can be made between crops.
Assessing severity: Assess percentage leaf (sheath) area affected by disease on individual top leaves.
Reference: 15
PERCENTAGE STEM AREA COVERED
VOL. 51, N0.2, CAN. PLANT DIS. SURV. JUNE, 7977
DRECHSLERA LEAF BLOTCH OR STRIPE OF CEREALS
Key No. 1.7
25 PERCENTAGE LEAF AREA COVERED
50
51
Use for: Leaf blotch or stripe of oats (Drechslera
avenacea (Curt. ex Cke.) Shoem. (Helminthosporium avenae Eidam; stat. perf. Pyrenophora chaetomioides Speg., P. avenae Ito & Kurib.))
tritici-repentis (Died.) Shoem. (Helminthosporium t. -r. Died.))
Leaf blotch of wheat (Drechslera
Procedure: Select a random sample of fertile tillers.
Growth stages: Assess at growth stages 10.5 and either 11.1 or 11.2 or both. The key can also be used for recording the disease at earlier growth stages, but the growth stage and leaf position (top leaf = leaf 1) should be carefully noted, so that valid comparisons can be made between crops.
Assessing severity: Assess percentage leaf (lamina) area affected on individual top leaves.
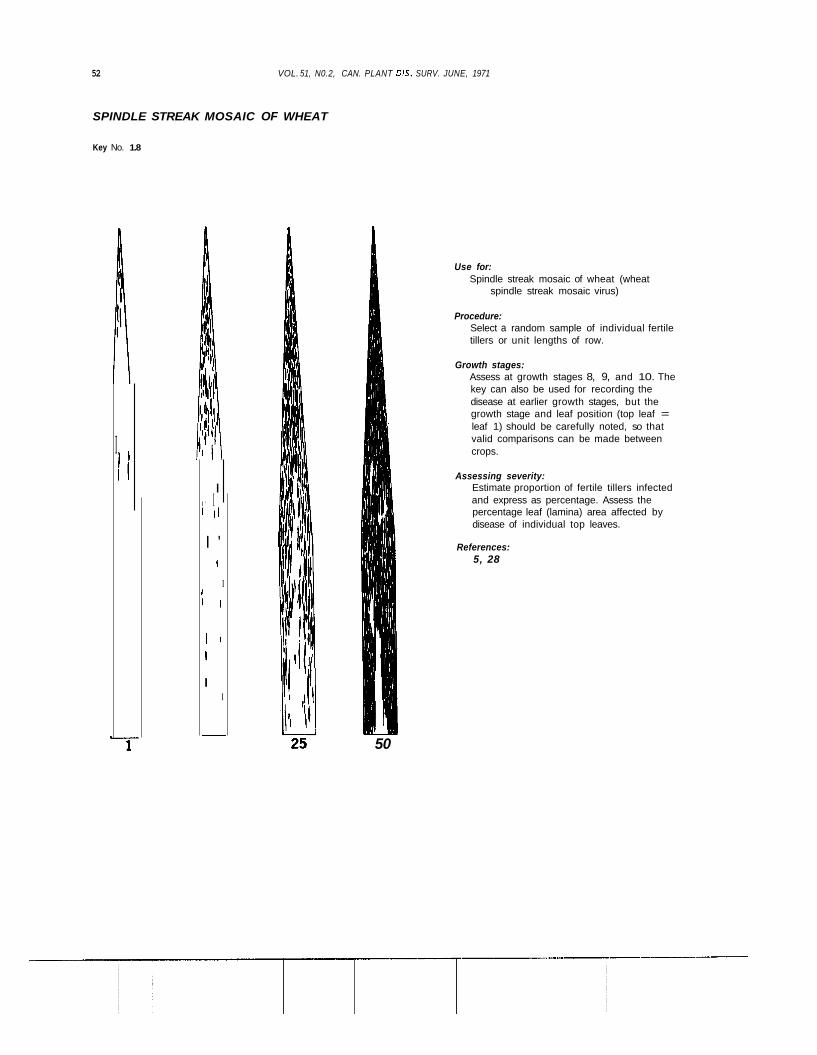
Procedure: Select a random sample of individual fertile tillers or unit lengths of row.
Growth stages: Assess at growth stages 8, 9, and 10. The key can also be used for recording the disease at earlier growth stages, but the growth stage and leaf position (top leaf = leaf 1) should be carefully noted, so that valid comparisons can be made between crops.
Assessing severity: Estimate proportion of fertile tillers infected and express as percentage. Assess the percentage leaf (lamina) area affected by disease of individual top leaves.
References: 5, 28
50
VOL.57, NO..?, CAN. PLANT DIS. SURV. JUNE, 7971
1 1
53
I
- 5
BACTERIAL BLACK CHAFF OF WHEAT
Key No. 1.9
Use for: Bacterial black chaff of wheat
(Xanthomones translucens (Jones, Johnson & Reddy) Dowson)
Procedure: Select a random sample of fertile tillers.
Growth stages: Assess at growth stages 10.5 and either 1 1 .I or 11.2 or both. The key can also be used for recordinq the disease at earlier growth stages, out the growth stage and leaf position (top leaf = leaf 1) should be carefully noted, so that valid comparisons can be made between crops.
Assessing severity: Assess percentage leaf (lamina) area affected on individual top leaves.
Procedure: Use Key No. 3.1.1 when infection is limited to foci in the primary stages ,of the epidemic. Survey the crop for foci of infection. A special effort should be made to record the date of initial infection and the early part of the disease progress curve. Use Key No. 3.1.2 for the later stages of the epidemic when infection is widespread.
AREA COVERED
Assessing severity: 1 Survey the crop and estimate the
average number of foci per acre or hectare.
2 Determine the average area of the foci. 3 Express (1) and (2) as percentage
acreage affected (see example for late blight of potatoes).
4 Use Key No. 3.1.1 to assess percentage leaf area affected within the foci.
References: 1, 12, 13, 14, 16, 25
Growth stages: Assess at regular intervals (such as one week) after the epidemic has started.
60 VOL.51, NO.2. CAN. PLANT DIS. SURV. JUNE, 1971
LATE BLIGHT OF POTATOES
Key No. 3.1.2
Blight (%) Nature of infection
0.0 0.1
1 .o
5.0
2 5
50
75
95
100
Use for:
No disease observed A few scattered plants blighted;
no more than 1 or 2 spots in 1 2 -yard radius
Up to 10 spots per plant; or general light infection
About 50 spots per plant; up to 1 in 10 leaflets infected
Nearly every leaflet infected, but plants retain normal form; plants may smell of blight; field looks green although every plant is affected.
Every plant affected and about 50% of leaf area destroyed; field appears green, flecked with brown
destroyed; field appears neither predominantly brown nor green
Only a few leaves on plants, but stems green
All leaves dead, stems dead or dying
About 75% of leaf area
(After British Mycological Society, 1947)
Growth stages: Late blight of potatoes (Phytophthora
infestans (Mont.) de Bary) Assess at regular intervals (such as one week) after the epidemic has started.
Procedure: Assessing severity: Use the key when the disease is widespread in the plot or crop. Select random sample areas along a diagonal or in accordance with other sampling schemes. 1, 12, 13, 14, 16, 25
Assess percentage leaf area affected by blight.
References:
COMMON SCAB OF POTATOES
Key No. 3.2
VOL.51, NO.2, CAN. PLANT DIS. SURV. JUNE, 1971
u 1
25
10
50
61
Use for: Common scab of potatoes (Streptomyces
scabies (Thaxt.) Waksm. & Henrici)
Procedure: Assess percentage surface area covered by scab on samples of tubers.
References: 18, 22
PERCENTAGE TUBER AREA COVERED
62 VOL.51, NO.2, CAN. PLANT DIS. SURV. JUNE, 1971
I
I
COMMON BACTERIAL BLIGHT OF BEANS (Leaf symptoms)
Key No. 3.3.1
1 10
25 50
PERCENTAGE LEAF AREA COVERED
Use for: Common bacterial blight (Xanthomonas
phaseoli (E.F.Sm.) Dowson) of beans (Phaseolus vulgaris L.)
Procedure:
Primary stages (infection in foci) 1 Survey the crop for foci. 2 Estimate average number of foci per
acre or hectare. 3 Determine average area of foci. 4 Express (2) and (3) as percentage
acreage affected (see instructions). 5 Use the key to estimate the
percentage leaf area affected.
Later stages (infection widespread) 1 Select 1 0 random samples along a
diagonal, each sample constituting two adjacent rows with 25 plants in each row (total of 50).
2 Use the key to assess percentage leaf area affected and calculate average for the 10 samples.
Growth stages: Make the assessment when plants are fully mature but still green. In southern Ontario this stage generally occurs between August 1 5 and 20.
VOL. 51, N0.2, CAN. PLANT DIS. SURV. JUNE, 1971
9
0
COMMON BACTERIAL BLIGHT OF BEANS (Pod symptoms)
Key No. 3.3.2
I 1
PERCENTAGE POD AREA COVERED
J
Use for: Common bacterial blight (Xanthomonas
phaseoli (E.F.Sm.) Dowson) of beans (Phaseolus vulgaris L.)
63
Procedure:
Primary stages (infection in foci) 1 Survey the crop for foci. 2 Estimate average number of foci per
acre or hectare. 3 Determine average area of foci. 4 Express (2) and (3) as percentage
acreage affected (see instructions for late blight of potatoes).
5 Use the key to estimate the average percentage pod area affected.
Later stages (infdction widespread) 1 Select 1 0 random samples along a
diagonal, each sample constituting two ad- jacent rows with 2 5 plants in each row (total of 50)
area affected and calculate average for the 10 samples
2 Use the key to assess percentage pod
Growth stages: Make the assessment when plants are fully mature but still green. In southern Ontario this stage generally occurs between August 15 and 20.
Drawings by N.J.E. Brown and Mary Klyne; scann ing by cour tesy o f Geo-Information System, Canada Land Inventory, Department o f Regional Economic Expansion, and Cartography S e c t i o n , S o i l Research I n s t i t u t e . I a m g r a t e f u l t o D r s . C.S. Sh ih , W.L. Seaman, and S.J. Hughes f o r checking t h e manuscript.
Literature cited
1 . Anonymous. 1947. The measurement o f potato b l i g h t . T r a n s . B r i t . Mycol.
2 . Church, B.M. 1970. The p l a c e of sample survey i n c rop loss e s t i m a t i o n . I n Crop loss assessment methods, S e c t i o n 2 . 2 , p. 1-12. Food and A g r i c u l t u r e Organ iza t ion of t h e United Nat ions Publ. AGP: CP/22.
3. Cobb, N.A. 1892. Cont r ibu t ion t o an economic knowledge o f t h e Aus t ra l i a r r rusts (Uredineae) . Agr. Gaz. New South Males 3:60-68.
4 . Food and A g r i c u l t u r a l Organ iza t ion of t h e United Nations. 1970. Crop loss assessment methods; FA0 manual on t h e e v a l u a t i o n and preven t ion of losses by p e s t s , d i s e a s e s and weeds. Publ. AGP: CP/22. Rome. Looseleaf .
5 . Gates, L.F. 1969. Incidence and e f f e c t s o f wheat s p i n d l e s t r e a k mosaic i n Essex and Kent counties, Onta r io , 1967- 68. Can. P l a n t D i s . Surv. 49:58-59.
6 . Grqaney, F.J. 1933. Method o f e s t i m a t i n g 1.osses of cereal r u s t s . Proc. World's Grain Exhib. and Conf., Canada 3:224- 36 .
7 . Harding, Howard. 1970. F o l i a g e d i s e a s e s o f a l f a l f a i n Northern Saskatchewan i n 1970. C a n . P l a n t D i s . Surv. 50:126- 129.
SOC. 31: 140-1 41.
8. James, W.C. 1967. Assessment of b a r l e y l e a f b l o t c h and i ts e f f e c t on s p r i n g b a r l e y y i e l d . Proc. 4th B r . I n s e c t i c i d e and Fungicide Conf. 1 : 1 1 1 - 114.
9 . James, N.C., J.E.E. Jenk ins , and J.L. Jemmett. 1968. The r e l a t i o n s h i p between l e a f b l o t c h caused by lih nchos orium secalis and losses i n c p i i n y i g l d of ba r ley . Ann. Appl. B i o l . 62:273-288.
10. James, W.C. 1969. A survey of f o l i a r d i s e a s e s o f s p r i n g b a r l e y i n England and Wales i n 1967. Ann. Appl. Biol. 6 3 :253-263.
1 1 . James, W.C. 1971. Importance of f o l i a r d i s e a s e s on w i n t e r wheat i n Onta r io i n
1969 and 1970. 51 :24-31.
12. James, W.C., L.C. and C.S. Shih.
Can. P l a n t D i s . Surv.
Ca l lbeck , W. A. Hodgson, Eva lua t ion o f a method
used t o estimate loss i n y i e l d of p o t a t o e s caused by la te b l i g h t . Phytopathology ( I n p r e s s )
13. James, W.C., C.S. Shih, W.A. Hodgson, and L.C. Callbeck. The q u a n t i t a t i v e r e l a t i o n s h i p between late b l i g h t o f p o t a t o and loss i n t u b e r y i e l d . Phytopathology ( I n P r e s s )
14. James, W.C., C.S. Sh ih , L.C. Ca l lbeck , and W.A. Hodgson. A p r e d i c t i o n method f o r e s t i m a t i n g t h e percen tage loss i n t u b e r y i e l d caused by late b l i g h t of po ta to . (Submitted fox p u b l i c a t i o n )
15. J e n k i n s , J.E.E., and W. Morgan. 1969. The e f f e c t o f S e p t o r i a d i s e a s e s on y i e l d o f w i n t e r wheat. P l a n t Pa tho l . 18:152-156.
16. Large, E.C. 1952. The i n t e r p r e t a t i o n o f p r o g r e s s curves f o r p o t a t o b l i g h t and o t h e r p l a n t d i s e a s e s , P l a n t Pa tho l . 1:109-117.
17 . Large, E.C. 1954. Growth stages i n cereals: i l l u s t r a t i o n o f t h e Feekes scale. P l a n t Pathol . 3:128-29.
18. Large, E.C., and J.K. Honey. 1955. Survey o f common scab o f p o t a t o e s i n Great Br i t a in , i n 1952 and 1953. P l a n t Pa tho l . 4: 1-8.
19. Large, E.C., and D.A. Doling. 1962. The measurement' o f cereal mildew and i ts e f f e c t on y i e l d . P l a n t Pa tho l . 11:47- 5 7 .
2 0 . Large, E.C., and D.A. Doling. 1963. E f f e c t of mildew on y i e l d o f w i n t e r wheat. P l a n t Pathol . 12: 12 8-1 30.
21. Large, E.C. 1966. Measuring p l a n t d i sease . Annu. Rev. Phytopathol . 4:9- 2 8 .
22 . Lowings, P., and W . Ridgman. 1959. A spot, sampling method f o r the es t imat ion o f common scab on potato t u b e r s . P l a n t Pa tho l . 8: 125-126.
2 3 . Manners, J .G . 1950. S t u d i e s on t h e p h y s i o l o g i c a l s p e c i a l i z a t i o n o f yel low rust (Pucc in ia glumaryn (Schm) E r i k s s . E Henn.) i n Great B r i t a i n . Ann. Appl. B i o l . 37: 187-21 4.
24 . Melchers, L.E., and J .H. Parker . 1922. Rust r e s i s t a n c e i n w i n t e r wheat v a r i e t i e s . U.S. Dep. Agr. Bul l . 1046.
25. Olofsson, B. 1968. Determinat ion of t h e c r i t ica l i n j u r y t h r e s h o l d f o r p o t a t o b l i g h t (Phytophthora i n f e s t a n s ) . Medd.
26. Pete rson , R.F., A.B. Campbell, and A.E. Hannah. 1948. A diagrammatic scale f o r es t imat inq r u s t i n t e n s i t y on stems and leaves a f - c e r e a l s . Can.-J. R e s . C. 26:496-500.
27. Romig, H . W . , and L. Calpouzos. 1970. The r e l a t i a n s h i p between stem r u s t and loss i n y i e l d o f s p r i n g wheat. Phytopathology 60:1801-1805.
28. Slykhuis , J.T. 1969. F a c t o r s determining t h e development o f wheat s p i n d l e s t r e a k mosaic caused by a soi l - borne v i r u s i n Ontar io . Phytopathology 60:319-331.
29. W i l l i s , W.G., D.L. S t u t e v i l l e , and E.L. Sorenson. 1969. E f f e c t s o f l e a f and stem d i s e a s e s on y i e l d and q u a l i t y o f a l f a l f a fo rage . Crop Sc i . 9:637-640.