TRANSPORTATION RESEARCH RECORD 1119 91 An Improved California Bearing Ratio Test Procedure COLIN A. FRANCO AND K. WAYNE LEE The California bearing ratio (CBR) test is one of the most common strength tests conducted to evaluate subgrade quality of soils and the suitability of soils for sub base and base courses in pavements. Yet there are variations in the procedures used by various transportation agencies; this results in confusion among highway engineers. To Improve the existing CBR pro- cedures, an alternative method has been employed successfully to obtain CBR-values of soil and to evaluate the moisture susceptibility of soils. This method is not only easier to perform but also requires less effort because only four samples need be compacted and tested. There are also fewer sources of error in that obtaining the "correct" optimum moisture content for compaction is not required because the test Is considered an extension of the compaction tests (i.e., AASHTO T99 and Tl80). This method has been used successfully on various soil types as well as on soil-cement mixtures. The possibilities of, and the potential for obtaining additional data by, this im- proved procedure should make It an attractive alternative option and possibly the standard method for determining CBR. Finally, It could be used as a tool in evaluating the frost susceptibility of subgrade soils and subbase and base course materials, studies of which are presently being pursued by the authors. The California bearing ratio (CBR) test was originally de- veloped by the California Division of Highways (1). This test has been further developed by others and is the most commonly used strength test for evaluating the subgrade quality of soils (ASTM D 1883 and AASHTO T193-81). Yet there are varia- tions in the procedure used by various transportation agencies, which result in confusion among highway engineers. One sig- nificant observation is that the CBR test procedures prescribed by the American Society for Testing and Materials (ASTM) and the American Association of State Highway and Transpor- tation Officials (AASHTO) are different. ASTM D 1883 al- lows for the preparation of specimens using a 5.5-lb rarnmer with a 12-in. drop and a 10-lb rarnmer with an 18-in. drop; only the former compactive effort is used in AASHTO T193. Recently the Rhode Island Department of Transportation (RI DOT) and the University of Rhode Island (URI) have engaged in a cooperative effort to improve the existing CBR procedure. The objectives of the study were threefold: (a) to examine the conditions that led to the development of the CBR procedure, (b) to improve existing procedures, and (c) to study the effect of test variables. C. A. Franco, Construction Section, Public Works Division, Rhode Island Department of Transportation, 229 State Office Building, Provi- dence, R.I. 02903. K. W. Lee, Department of Civil Engineering, University of Rhode Island, Kingston, R.I. 02881. BACKGROUND A statewide investigation at the California Division of High- ways was conducted to determine local drainage conditions and other factors that affect the stability of pavement during 1928 and 1929. The study indicated that pavement failures could be ·. traced directly to poor compaction during construction or was brought about by insufficient thickness of pavement and by the existence of a base course over soils inherently weak in shear strength. Therefore a static field load test was first tried for establishing the density that should be used in the construction of subgrades and the shear strength that was required. However, it was practically impossible to moisten the soil properly in the field to the depth affected by the load test, and, as a consequence, the results of such tests could represent a test condition that was unrelated to the ultimate condition and did not simulate the subgrade reaction during the service life of the pavement. The CBR test was devised in 1929 in an attempt to eliminate some of the deficiencies of field loading tests and to provide a quick method for comparing local base and subbase materials available for reinforcing the subgrade (1). In this study, sam- ples of the material were first thoroughly consolidated to the density obtainable with good construction methods or to ap- proximately the density of good subgrade materials ultimately produced by traffic. This procedure eliminated, to a large de- gree, most of the inelastic and consolidation deformation that often influences static load tests made in the field. The com- pacted specimen was next soaked for 4 days under a surcharge representing the weight of the pavement, which permitted the specimen to swell and absorb moisture, with consequent loss of strength. The CBR test was made on the specimen to determine the resistance to lateral displacement, thus measuring the com- bined influence of cohesion and internal friction. Figure 1 shows the penetration and the expansion (soaking) parts of the CBR test. The resistance to penetration in the test is expressed as a percentage of the resistance of a standard crushed stone of a CBR-value of 100 percent. The specimen was compacted under a static pressure of 2,000 psi using a standard laboratory compression machine. The static pressure of 2,000 psi was adopted after it was found that this pressure was necessary to produce a density equivalent to that present under old highways that had been subjected to traffic for a period of years. For field control, where a compres- sion machine was not available, an impact method of compac- tion using 20 blows of a 10-lb tamper with an 18-in. drop on each 1-in. layer was adopted. Investigations in California between 1928 and 1942, on both
Transcript
TRANSPORTATION RESEARCH RECORD 1119 91
An Improved California Bearing Ratio Test Procedure
COLIN A. FRANCO AND K. WAYNE LEE
The California bearing ratio (CBR) test is one of the most common strength tests conducted to evaluate subgrade quality of soils and the suitability of soils for sub base and base courses in pavements. Yet there are variations in the procedures used by various transportation agencies; this results in confusion among highway engineers. To Improve the existing CBR procedures, an alternative method has been employed successfully to obtain CBR-values of soil and to evaluate the moisture susceptibility of soils. This method is not only easier to perform but also requires less effort because only four samples need be compacted and tested. There are also fewer sources of error in that obtaining the "correct" optimum moisture content for compaction is not required because the test Is considered an extension of the compaction tests (i.e., AASHTO T99 and Tl80). This method has been used successfully on various soil types as well as on soil-cement mixtures. The possibilities of, and the potential for obtaining additional data by, this improved procedure should make It an attractive alternative option and possibly the standard method for determining CBR. Finally, It could be used as a tool in evaluating the frost susceptibility of subgrade soils and subbase and base course materials, studies of which are presently being pursued by the authors.
The California bearing ratio (CBR) test was originally developed by the California Division of Highways (1). This test has been further developed by others and is the most commonly used strength test for evaluating the subgrade quality of soils (ASTM D 1883 and AASHTO T193-81). Yet there are variations in the procedure used by various transportation agencies, which result in confusion among highway engineers. One significant observation is that the CBR test procedures prescribed by the American Society for Testing and Materials (ASTM) and the American Association of State Highway and Transportation Officials (AASHTO) are different. ASTM D 1883 allows for the preparation of specimens using a 5.5-lb rarnmer with a 12-in. drop and a 10-lb rarnmer with an 18-in. drop; only the former compactive effort is used in AASHTO T193.
Recently the Rhode Island Department of Transportation (RI DOT) and the University of Rhode Island (URI) have engaged in a cooperative effort to improve the existing CBR procedure. The objectives of the study were threefold: (a) to examine the conditions that led to the development of the CBR procedure, (b) to improve existing procedures, and (c) to study the effect of test variables.
C. A. Franco, Construction Section, Public Works Division, Rhode Island Department of Transportation, 229 State Office Building, Providence, R.I. 02903. K. W. Lee, Department of Civil Engineering, University of Rhode Island, Kingston, R.I. 02881.
BACKGROUND
A statewide investigation at the California Division of Highways was conducted to determine local drainage conditions and other factors that affect the stability of pavement during 1928 and 1929. The study indicated that pavement failures could be
·. traced directly to poor compaction during construction or was brought about by insufficient thickness of pavement and by the existence of a base course over soils inherently weak in shear strength. Therefore a static field load test was first tried for establishing the density that should be used in the construction of subgrades and the shear strength that was required. However, it was practically impossible to moisten the soil properly in the field to the depth affected by the load test, and, as a consequence, the results of such tests could represent a test condition that was unrelated to the ultimate condition and did not simulate the subgrade reaction during the service life of the pavement.
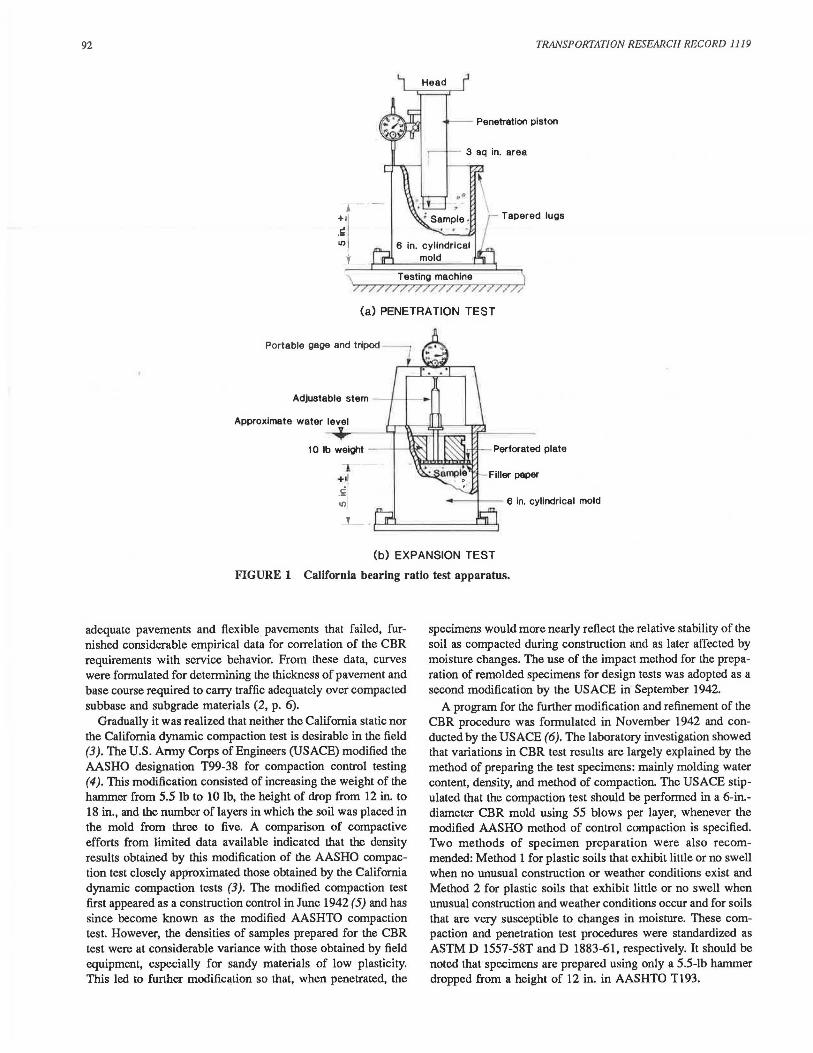
The CBR test was devised in 1929 in an attempt to eliminate some of the deficiencies of field loading tests and to provide a quick method for comparing local base and subbase materials available for reinforcing the subgrade (1). In this study, samples of the material were first thoroughly consolidated to the density obtainable with good construction methods or to approximately the density of good subgrade materials ultimately produced by traffic. This procedure eliminated, to a large degree, most of the inelastic and consolidation deformation that often influences static load tests made in the field. The compacted specimen was next soaked for 4 days under a surcharge representing the weight of the pavement, which permitted the specimen to swell and absorb moisture, with consequent loss of strength. The CBR test was made on the specimen to determine the resistance to lateral displacement, thus measuring the combined influence of cohesion and internal friction. Figure 1 shows the penetration and the expansion (soaking) parts of the CBR test. The resistance to penetration in the test is expressed as a percentage of the resistance of a standard crushed stone of a CBR-value of 100 percent.
The specimen was compacted under a static pressure of 2,000 psi using a standard laboratory compression machine. The static pressure of 2,000 psi was adopted after it was found that this pressure was necessary to produce a density equivalent to that present under old highways that had been subjected to traffic for a period of years. For field control, where a compression machine was not available, an impact method of compaction using 20 blows of a 10-lb tamper with an 18-in. drop on each 1-in. layer was adopted.
Investigations in California between 1928 and 1942, on both
92 TRANSPORTATION RESEARCH RECORD 1119
Head
Penetration piston
Tapered lugs
(a) PENETRATION TEST
Portable gage and tripod
Approximate water level
Perforated plate
(b) EXPANSION TEST
FIGURE 1 California bearing ratio test apparatus.
adequate pavements and flexible pavements that failed, furnished considerable empirical data for correlation of the CBR requirements with service behavior. From these data, curves were formulated for determining the thickness of pavement and base course required to carry traffic adequately over compacted subbase and subgrade materi1;1ls (2, p. 6).
Gradually it was realized that neither the California static nor the California dynamic compaction test is desirable in the field (3). The U.S. Army Corps ofEngineers (USACE) modified the AASHO designation T99-38 for compaction control testing (4 ). This modification consisted of increasing the weight of the hammer from 5.5 lb to 10 lb, the height of drop from 12 in. to 18 in., and Lbe number of layers in which the soil was placed in the mold from three to five. A comparison of compactive efforts from limited data available indicated that the density results obtained by this modification of the AASHO compaction test closely approximated lhose obtained by lhe California dynamic compaction tests (3 ). The modified compaction test first appeared as a construction control in June 1942 (5) and has since become known as the modified AASHTO compaction test. However, the densities of samples prepared for the CBR test were at considerable variance with those obtained by field equipment, especially for sandy materials of low plasticity. This led to further modification so that, when penetrated, the
specimens would more nearly reflect the relative stability of Lbe soil as compacted during construction and as later affected by moisture changes. The use of the impact method for the preparation of remolded specimens for design tests was adopted as a second modification by the USACE in September 1942.
A program for the further modification and refinement of the CBR procedure was formulated in November 1942 and conducted by the USACE (6). The laboratory investigation showed that variations in CBR test results are largely explained by the method of preparing the test specimens: mainly molding water content, density, and method of compaction. The USACE stipulated that the compaction test should be performed in a 6-in.diameter CBR mold using 55 blows per layer, whenever the modified AASHO method of control compaction is specified. Two methods of specimen preparation were also recommended: Method 1 for plastic soils that exhibit little or no swell when no unusual construction or weather conditions exist and Method 2 for plastic soils lhat exhibit little or no swell when unusual construction and weather conditions occur and for soils that are very susceptible to changes in moisture. These compaction and penetration test procedures were standardized as ASTM D 1557-58T and D 1883-61, respectively. It should be noted that specimens are prepared using only a 5.5-lb hammer dropped from a height of 12 in. in AASHTO T193.
Franco and Lee
IMPROVED CBR PROCEDURE
The new procedure was conceived by the authors who had worked in Africa and the Middle East where an expedient method that used less ph1sical effort was required. As in the traditional method specified in ASTM D 1883 and AASHTO T193, the objective of this improved procedure is to determine the CBR value of a soil. In addition to the CBR the following information is also obtained:
• Variation of CBR with moisture content and • Comparison of dry CBR- versus soaked CBR-values,
which gives a measure of CBR moisture susceptibility.
Sample Preparation
In this method, a 30-kg sample is dried and pretreated for compaction per AASHTO T99 or T180 depending on the use that the soil is to be put to. The soil is split into four portions of approximately 6 kg each. To each portion, a definite quantity of water is added such that each of the portions of soil has a gradually increasing moisture content that ranges around the optimum moisture content. The individual portions are then compacted (the moisture content samples are taken at the beginning and end of the individual compactions; 100 g for fine-grained soils and 500 g for coarse-grained soils). The compacted soil in the mold is trimmed even with the top surface, and the specimen and mold are weighed to determine wet density and finally dry density.
Penetration Test
The CBR of a material is obtained for the dry and the soaked condition. For the dry condition, the penetration test is performed directly on one side of the specimen in the mold (i.e., either top or bottom). For the soaked condition, the soaking procedure of AASHTO T193 or ASTM D 1883 is followed. After the percent swell has been determined, the penetration test is run on the other side.
Calculations
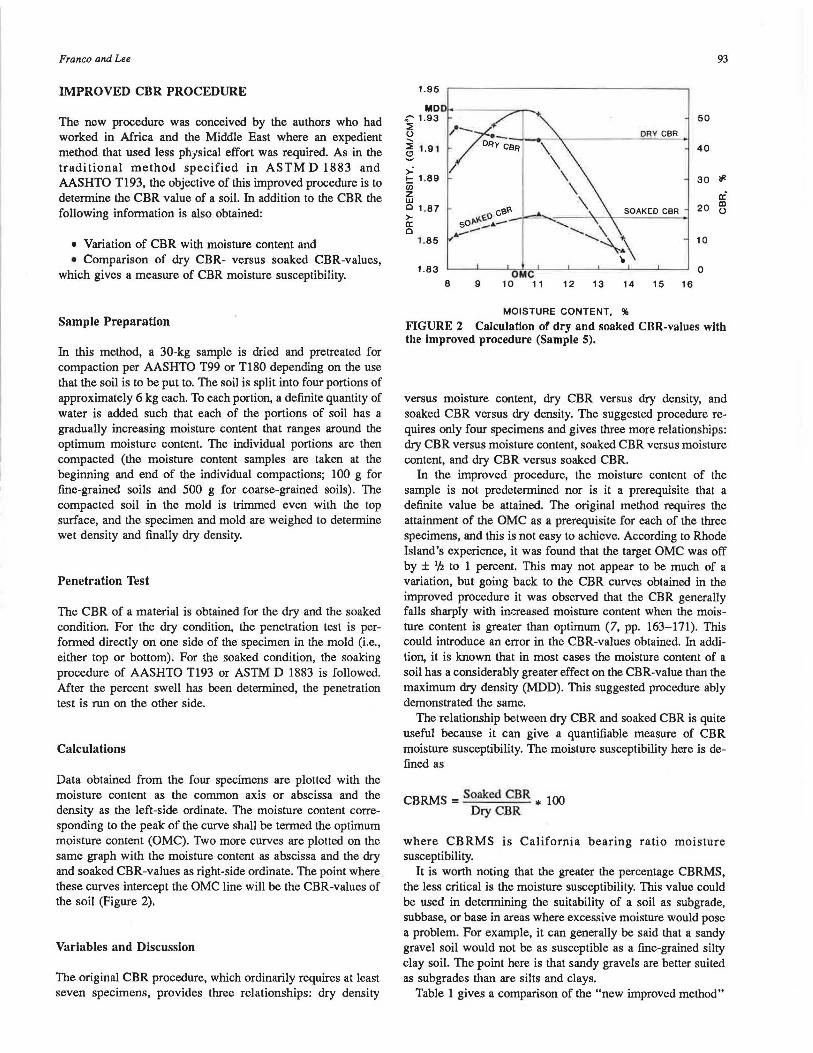
Data obtained from the four specimens are plotted with the moisture content as the common axis or abscissa and the density as the left-side ordinate. The moisture content corresponding to the peak of the curve shall be termed the optimum moisture content (OMC). Two more curves are plotted on the same graph with the moisture content as abscissa and the dry and soaked CBR-values as right-side ordinate. The point where these curves intercept the OMC line will be the CBR-values of the soil (Figure 2).
Variables and Discussion
The original CBR procedure, which ordinarily requires at least seven specimens, provides three relationships: dry density
FIGURE 2 Calculation of dry and soaked CBR-values with the Improved procedure (Sample 5).
versus moisture content, dry CBR versus dry density, and soaked CBR versus dry density. The suggested procedure requires only four specimens and gives three more relationships: dry CBR versus moisture content, soaked CBR versus moisture content, and dry CBR versus soaked CBR.
In the improved procedure, the moisture content of the sample is not predetermined nor is it a prerequisite that a definite value be attained. The original method requires the attainment of the OMC as a prerequisite for each of the three specimens, and this is not easy to achieve. According to Rhode Island's experience, it was found that the target OMC was off by ± 1/2 to 1 percent. This may not appear to be much of a variation, but going back to the CBR curves obtained in the improved procedure it was observed that the CBR generally falls sharply with increased moisture content when the moisture content is greater than optimum (7, pp. 163-171). This could introduce an error in the CBR-values obtained. In addition, it is known that in most cases the moisture content of a soil has a considerably greater effect on the CBR-value than the maximum dry density (MDD). This suggested procedure ably demonstrated the same.
The relationship between dry CBR and soaked CBR is quite useful because it can give a quantifiable measure of CBR moisture susceptibility. The moisture susceptibility here is defined as
CBRMS =Soaked CBR * lOO Dry CBR
where CBRMS is California bearing ratio moisture susceptibility.
It is worth noting that the greater the percentage CBRMS, the less critical is the moisture susceptibility. This value could be used in determining the suitability of a soil as subgrade, subbase, or base in areas where excessive moisture would pose a problem. For example, it can generally be said that a sandy gravel soil would not be as susceptible as a fine-grained silty clay soil. The point here is that sandy gravels are better suited as subgrades than are silts and clays.
Table 1 gives a comparison of the "new improved method"
94 TRANSPORTATION RESEARCH RECORD 1119
TABLE 1 COMPARISON OF CURRENT AASHTO T193 AND NEW METHOD
AASHTO Method (T-193)
1. Sample size approximately 35 kg
2. Pretreat sample as for ASTM/AASHTO procedure for compaction test
3. Divide the pretreated soil from 2 into one portion weighing 12 kg for obtaining the compaction curve (f 99{f 180) and three portions weighing 6 kg each for CBR testing
4a. Perform compaction test according to standard procedure (T 99{f 180) using either four or five points
4b. Moisture determination made for each point by sampling material from the mixing bowl before and after completing compaction of the mold
5. Plotting of compaction curve: compaction curve plotted from where MDD and OMC are then detennined
6a. The three portions of soils are molded using exact amounts of mixing water (to obtain OMC-value); the three samples are compacted with different compactive efforts to obtain three different dry densities
6b. The dry density is calculated for the three samples
7. CBR test performed on the three specimens from 6 for dry CBR-value, soaked CBR-value, and swell test
8. Plot CBR curves for each of the three specimens for both the dry and the soaked cases and find the 0.1- and 0.2-in. CBRvalues for dry and soaked specimens using curve corrections where necessary
9. Plotting of results: plot CBR-values versus the dry density for each of the three molds for the dry and the soaked case; the CBR-values for the soil are then the CBR-values at the MOD obtained from the compaction test
with the AASHTO Tl93 method. It is assumed that testing is generally carried out by a team of two persons, a materials technician and an assistant. The data in Table 2 further highlight significant differences and improvements, and Table 3 is a summary of the time (or cost) saving and benefits to be had if the new procedure is used.
In addition, two observations have been made that call for further investigation:
• The CBR-values obtained by the original method are not as consistent as those obtained with the improved method and
New Improved CBR Method
1. Sample size approximately 30 kg
2. Pretreat sample as for ASTM/AASHTO procedure for compaction test
3. Divide the pretreated soil from 2 into four portions weighing 6 kg each
4a. Perform compaction test per T 99/Tl80 on the four portions to make four molded specimens (similar to 3 of AASHTO method except that the soil used in the previous compaction is not reused)
4b. Moisture determination made for each point by sampling material for the mixing bowl before and after completing compaction of the mold
5. Plotting of compaction curve: compaction curve plotted with dry density as ordinate and MC as abscissa from where MOD and OMC are found
6a. Not necessary
6b. Not necessary
7. CBR test performed on four specimens for dry CBR-value, soaked CBR-value, and swell test
8. Plot CBR curves for each of the four specimens for both the dry and the soaked cases and find the 0.1- and 0.2-in. CBRvalues using curve correction where necessary
9. Plotting of results: on the plot of the compaction curve (already plotted in 5) plot CBR versus an MC for each of the four molds for the dry and the soaked case; the CBR-values for the soil are then obtained by finding the intercept of the OMC ordinate with the CBR curves
• CBR-values at 55 blows are not always greater than those at 45 blows or less than those at 65 blows in all cases as is expected.
IMPLEMENTATION OF IMPROVED PROCEDURE
Gravel base course material from Post Road (US-1), Westerly, Rhode Island, consisting of cohesionless material (sandy gravel with silt) was tested and the results are summarized in Table 4 and Figures 2 and 3.
TABLE 2 SUMMARY OF SIGNIFICANT DIFFERENCES OR IMPROVEMENTS
AASHTO Method (T-193)
1. From Steps 4 and 6 (Table 1) a total of seven compacted specimens are made in this method
2. Lag time is needed to calculate OMC before preparing and compacting the three specimens for CBR testing
3. CBR penetration test performed on three specimens for the dry and the soaked cases, respectively
4. 1\vo plots are required for each of the cases (dry and soaked) for the three specimens
New Improved Method
1. A total of four compacted specimens are made in this method
2. Not required
3. CBR penetration test performed on four specimens for the dry and the soaked cases, respectively
4. 1\vo plots are required for each of the cases (dry and soaked) for the four specimens
Franco and Lee 95
TABLE 3 TIME STUDY COMPARISONS FOR EACH OF THE METHODS
AASHTO Method (T-193) New Improved Method
1. Preparation of sample and compaction test (four specimens): 2 1. Preparation of sample for compaction of four molds: 2 hr hr 30 min
2. Calculate and plot compaction curve: 30 min 2. Calculate and plot compaction curve: 30 min
3. Prepare and compact three specimens for compaction test: 2 hr 4a. Testing CBR dry specimens at 20 min each: 1 hr 4a. Testing CBR dry specimens at 20 min each: 1 hr 20 min
4b. Testing CBR soaked specimens at 20 min each: 1 hr 4b. Testing CBR soaked specimens at 20 min each: 1 hr 20 min
5. Plotting CBR results and determining CBR for each specimen: 5. Plotting CBR results and determining CBR for each specimen: 30 min 40 min
6. Plotting CBR versus dry density curve: calculate dry density 6. Plotting CBR-values on compaction curve (already plotted in of each of three molded specimens: 20 min; plot CBR versus 2): 10 min dry density: 10 min (total = 30 min)
Total time = 8 hr Total time = 6 hr
Testing Procedures and Assumptions AASHTO TISO. The CBR penetration test was also performed per AASHTO Tl93 to determine the dry and soaked (96 hr)
The material was sampled from the sides and median of the CBR of the soils. existing road. The majority of the samples tested belonged to the A-1-b soil group, with the remainder in the A-1-a, A-2-4, Results and Observations and A-3 groups. Because 15 percent of material was retained on the 3/4-in . sieve, compaction was carried out per Most soils from the A-1-b group indicated a relatively high AASHTO T180. The CBR penetration test was performed per MOD and lower OMC for those samples that had little fines
TABLE 4 CBR TEST RESULTS ON MATERIAL FROM POST ROAD (US-1)
Dry Soaked Soaked Saniple AASHTO MDD OMC MC Densiry Dry CBR Dry CBR CBR CBR No. Soil Class (g/cm3
) (%) (%) (g/cm3) at 0.1 in. at 0.2 in. at 0.1 in. at 0.2 in.
FIGURE 3 Calculation of dry and soaked CBR-values with the improved procedure (Sample 3A).
(i.e., the amount passing the No. 200 sieve is less than 10 percent and that passing the No. 40 sieve is less than 35 percent). It appears that there should be further research efforts to study the effect of the amount passing the No. 200 sieve versus CBR.
Another unusual observation was that, in all cases, the 0.1-in. CBR-value was less than the 0.2-in. value. It was observed that the higher the MDD of the soils the lower was the OMC. This lower OMC contributed to the higher CBR-values of the soil. It is also apparent that the greater the amount of fines the higher the OMC and subsequently the lower the CBR.
The new improved method had been initially implemented by the author with lateritic soils (A-2-6 or A-2-7) in the tropical areas of Africa. The method was routinely used to evaluate (a) the CBR of subgrade soils in earth cuts for pavement design and the suitability of materials for subgrades and (b) the CBR of materials from prospective borrow pits for use as subbase and base course material. From the hundreds of CBR test results obtained, it has been observed that the CBR curves for the lateritic soils have shapes that arc similar to those of the curves for the soils in Rhode Island; notably,
• The dry CBR curve has higher values and peaks to the left of the OMC point and
• The soaked CBR curve follows a similar pattern as shown in the Figures 2-4.
As a broad generalization, it may be said that the CBRvalues of soils are relatively higher when the MC is less than optimum. For the case in which the compaction of a subbase or base course is specified to be 95 percent minimum, it will be observed from Figure 4 that the strength of the layer varies
TRANSPORTATION RESEARCH RECORD 1119
100% MOD COMPACTION
CURVE
95% / A
/ I ~
~ I u \ ~ I \ 8
I \
>- \ 'If/.
I-
~ I r:i al
UJ ~ DRY u c J~-- CBR >- I
\ a: '-
\ CURVE c / " / "J '\.
/
" / " " (.) SOAKED~
::E " 0 CBR CURVE
" -....._
4 6 8 10 12
MOISTURE CONTENT, %
FIGURE 4 Typical curve shape for the new improved CBR procedure. ··
substantially from Point A to Point B. If a moisture specification is included (generally OMC ± 2 percent), it will again be seen that the CBR-value on the dry side (less than optimum moisture) will be greater than that on the wet side (greater than optimum). This could have a significant impact on the performance of a soil as a subbase or base course.
Finally, it should be noted that if the specimen is prepared in either too dry condition (low moisture content) or two specimens are not prepared with moisture contents greater than the OMC, then the shape of the curve may not be as shown in Figure 4. Because most materials engineers and technicians have a relatively good feel for "guestimating" the OMC, the foregoing should not be a major obstacle in implementing the new procedure.
CONCLUSIONS
This alternative method has been employed successfully to obtain CBR-values of soil and to evaluate the moisture susceptibility of soils. This method is not only easier to perform but also requires less effort because only four samples need be compacted and tested. There are also fewer sources of error because obtaining the "correct" optimum moisture content for compaction is not required (the test is considered an "extension" of the AASHTO T99 and T180 compaction tests). This method also has been used successfully on soil-cement mixtures.
The possibilities of, and potential for obtaining additional data by, this alternative method should make it an attractive option and possibly the standard method for determining CBR. Currently, RI DOT and URI are conducting experiments in a CBR versus freeze-thaw study, which it is hoped will shed some light on the influence of temperature on frost susceptibility of various pavement subgrade, subbase, and base materials.
Franco and Lee
ACKNOWLEDGMENTS
The authors wish to thank William Carcieri, Chief Engineer, RI DOT, for his encouragement and the materials section at RI DOT for their help in performing required tests. Special appreciation is extended to William D. Kovacs for his suggestions in preparing this manuscript. Finally, the authors would like to express their thanks to the Department of Civil Engineering, University of Rhode Island, which provided the typing and drafting support required for this paper.
REFERENCES
1. 0 . J. Porter. Development of the Original Method for Highway Design. Transactions, ASCE, Vol. 115, 1950, pp. 461-467.
2. F. J. Grumm Designing Foundation Courses for Highway Pave-
97
ments and Surfaces. California Highways and Public Works, Sacramento, March 1942.
3. W. H. Jervis and J. B. Eustis. Accepted Procedure for the CBR Test. Transactions, ASCE, Vol. 115, 1950, pp. 472-484.
4. Standard Specifications for Highway Materials. AASHO, Washington, D.C., 1947, Test T99-38.
5. Airfield Pavement Design. In Engineering Manual for War Department Construction. Office of Chief of Engineers, U.S. Army, Washington, D.C., June 1942, Part II, Chapter XX.
6. The California Bearing Ratio Test as Applied to the Design of Flexible Pavements for Airports. Technical Memorandum 213-1. U.S. Waterways Experiment Station, Vicksburg, Miss., July 1945.
7. Soil Mechanics for Road Engineers. Road Research Laboratory, London, United Kingdom, 1954.
Publication of this paper sponsored by Committee on Exploration and Classification of Earth Materials.