Vol. 14: 91-108.1998 AQUATIC MICROBIAL ECOLOGY Aquat Microb Ecol Published January 2 An improved model of carbon and nutrient dynamics in the microbial food web in marine enclosures 'Ecological Modelling Centre, Joint Department of Danish Hydraulic Institute and VKI, Agern Alle 5, DK-2970 Harsholrn, Denmark 'VKI, Agern All6 11, DK-2970 Harsholrn, Denmark 3National Environmental Research Institute, PO Box 358, Frederiksborgvej 399, DK-4000 Roskilde, Denmark ABSTRACT: A description of an improved dynamic simulation model of a marine enclosure 1s given. New features In the model are the inclusion of picoalgae and rnixotrophs; the ability of bacteria to take up dissolved inorganic nutrients directly; and, for the phytoplankton functional groups, the inclusion of luxury uptake and the decoupling of the nutrient uptake dynamics from carbon-assimilat~on dynamics. This last feature implies dynamically variable phosphorus/carbon and nitrogedcarbon ratios. The model was calibrated with experimental results from enclosure experiments carried out in Knebel Vig, a shallow microtidal land-locked fjord in Denmark, and verified with results from enclosure experi- ments in Hylsfjord, a deep and salinity-stratified Norwegian fjord. Both observations and model simu- lation~ showed dominance of a microbial food web in control enclosures with low productivity. In N- and P-enriched enclosures a classical food web developed, while an intermediate system was found in N-, P- and Si-enriched enclosures. Mixotrophic flagellates were most important in the nutrient-limited control enclosures where they accounted for 49% of the pigmented biomass and about 48% of the primary production. Lumping the mixotrophs in the simulation model with either the autotrophic or the heterotrophic functional groups reduced total primary production by 74 %. Model-derived, time- averaged phosphorus budgets suggested that bacteria competed with algae for orthophosphate in the control enclosure, but not in the enclosure to which N and P had been added, where bacteria func- tioned as net mineralisers of phosphate. In the N, P and Si enclosure, bacteria took up only 10% of the amount of orthophosphate taken up by the primary producers, passing most of the organic phosphorus on to their grazers, the heterotrophic nanoflagellates, and mineralising only a small fraction directly. Inclusion of luxury nutrient uptake affected the simulation of the nutrient-enriched enclosures, while the decoupling of carbon and nutrient dynamics affected the simulation of the control enclosure. With- out these 2 processes it was not possible to simulate the carbon and nutrient dynamics in the different enclosures adequately with the same parameterisation. KEY WORDS: Microbial food web . Luxury uptake . Nutrient uptake . Nutrient cycles - Ecosystem model . Mesocosm The INTRODUCTION construction of an ecological model able to adapt its internal channelling of the C, N, P and Si flows in the pelagic food web in response to perturba- tions in the availability and the partitioning of the nutrients is one of the holy grails in ecological model- ling. However, as easy as it is to construct a conceptual 0 Inter-Research 1998 model, making a dynamic simulation model that faith- fully reproduces the shifting pathways of carbon and nutrients in the pelagic system while obeying the mass conservation law is a complex affair, especially as the bulk of the information on carbon and nutrient fluxes is indirect, in the form of biomass distributions and nutri- ent concentrations which by themselves are singularly uninformative with regard to the underlying fluxes, of which the standing stocks and concentrations are the end product.
Transcript
Vol. 14: 91-108.1998 AQUATIC MICROBIAL ECOLOGY
Aquat Microb Ecol Published January 2
An improved model of carbon and nutrient dynamics in the microbial food web in
marine enclosures
'Ecological Modelling Centre, Joint Department of Danish Hydraulic Institute and VKI, Agern Alle 5, DK-2970 Harsholrn, Denmark
'VKI, Agern All6 11, DK-2970 Harsholrn, Denmark 3National Environmental Research Institute, PO Box 358, Frederiksborgvej 399, DK-4000 Roskilde, Denmark
ABSTRACT: A description of an improved dynamic simulation model of a marine enclosure 1s given. New features In the model are the inclusion of picoalgae and rnixotrophs; the ability of bacteria to take up dissolved inorganic nutrients directly; and, for the phytoplankton functional groups, the inclusion of luxury uptake and the decoupling of the nutrient uptake dynamics from carbon-assimilat~on dynamics. This last feature implies dynamically variable phosphorus/carbon and nitrogedcarbon ratios. The model was calibrated with experimental results from enclosure experiments carried out in Knebel Vig, a shallow microtidal land-locked fjord in Denmark, and verified with results from enclosure experi- ments in Hylsfjord, a deep and salinity-stratified Norwegian fjord. Both observations and model simu- la t ion~ showed dominance of a microbial food web in control enclosures with low productivity. In N- and P-enriched enclosures a classical food web developed, while an intermediate system was found in N-, P- and Si-enriched enclosures. Mixotrophic flagellates were most important in the nutrient-limited control enclosures where they accounted for 49% of the pigmented biomass and about 48% of the primary production. Lumping the mixotrophs in the simulation model with either the autotrophic or the heterotrophic functional groups reduced total primary production by 74 %. Model-derived, time- averaged phosphorus budgets suggested that bacteria competed with algae for orthophosphate in the control enclosure, but not in the enclosure to which N and P had been added, where bacteria func- tioned as net mineralisers of phosphate. In the N, P and Si enclosure, bacteria took up only 10% of the amount of orthophosphate taken up by the primary producers, passing most of the organic phosphorus on to their grazers, the heterotrophic nanoflagellates, and mineralising only a small fraction directly. Inclusion of luxury nutrient uptake affected the simulation of the nutrient-enriched enclosures, while the decoupling of carbon and nutrient dynamics affected the simulation of the control enclosure. With- out these 2 processes it was not possible to simulate the carbon and nutrient dynamics in the different enclosures adequately with the same parameterisation.
KEY WORDS: Microbial food web . Luxury uptake . Nutrient uptake . Nutrient cycles - Ecosystem model . Mesocosm
The
INTRODUCTION
construction of an ecological model able to adapt its internal channelling of the C, N, P and Si flows in the pelagic food web in response to perturba- tions in the availability and the partitioning of the nutrients is one of the holy grails in ecological model- ling. However, as easy as it is to construct a conceptual
0 Inter-Research 1998
model, making a dynamic simulation model that faith- fully reproduces the shifting pathways of carbon and nutrients in the pelagic system while obeying the mass conservation law is a complex affair, especially as the bulk of the information on carbon and nutrient fluxes is indirect, in the form of biomass distributions and nutri- ent concentrations which by themselves are singularly uninformative with regard to the underlying fluxes, of which the standing stocks and concentrations are the end product.
92 Aquat Slicrob E
I t is for these reasons that experimental setups and mesocosm experiments are invaluable for the testing and improvement of ecological models (Baretta- Bekker et al. 1994, Escaravage et al. 1995, 1996, Black- burn et al. 1996, Zweifel et al. 1996). Conclusions based on the results of the simulations of marine enclo- sures described by Baretta-Bekker et al. (1994) were that (1) the biological resolution of the model, with phytoplankton only comprising diatom and auto- trophic flagellate functional groups, was too coarse, as it included neither a mixotrophic functional group nor picoalgae (Baretta-Bekker et al. 1994) and (2) the use of Michaelis-Menten nutrient kinetics in the model, which does not allow for intracellular nutrient storage or luxury uptake of nutrients (Droop 1974, Nyholm 1977), was a probable cause of discrepancies between observed and model-predicted concentrations of nitro- gen and phosphorus.
Mixotrophic nanoflagellates are commonly found in many different environments, and in some cases these pigmented organisms contribute significantly to the grazing of bacteria in lakes (Bird 91 Kalff 1986, Bennett et al. 1990) and in coastal marine environments (Hav- skum & Riemann 1996).
In recent years, the topic of rnixotrophic nutrition in pelagic protists (flagellates and ciliates) has received increasing attention. In particular, the use of fluores- cently labelled particles as tracers for uptake has improved the understanding of the role of phago- trophic phytoflagellates (Sanders 1991, Riemann et al. 1995). The combination of autotrophic and hetero- trophic nutrition in some protists provides an alterna- tive route of material between microbial compartments in addition to the ones included in the more traditional concept of the microbial loop (e.g. Fenchel 1988).
The fact that mixotrophs do not rely on just 1 mode of nutrition gives them a competitive a.dvantage, espe- cially under limiting conditions (e.g. low light or low prey density), compared to strictly autotrophic or het- erotrophic protists. The relative importance of the 2 nutrition modes, however, is largely unknown, since it tends to be species-specific and dependent on the environment (Sanders 1991). It has therefore been dif- ficult to generalise the importance of mixotrophs and i i~e factors controlling riatuia! populatio~s. As a conse- quence, there is a need for suitable models to predict the conditions under which mixotrophs may become significant (Riemann et al. 1995, Thingstad et al. 1996) and to examine their ecological role in microbial assemblages.
The complex structure of the marine planktonic food web allows for the dominance of strongly different components of the pelaglc community In interaction with changes in the chemical and physical environ- ment. Legendre & Rassoulzadegan (1995) dscerned a
range of 4 different pathways in the marine planktonic food web, from dominance by the herbivorous web, coinciding with the classical food chain sensu Cushing (1989), through a multivorous web where microbial grazing is as significant as herbivorous grazing, to food webs increasingly dominated by grazing and recycling within the microbial components. In effect Legendre &
Rassoulzadegan (1995) proposed the existence of a generic pelagic food web with the different pathways expanding or contracting in response to modulations in the nutrient and light-energy supply.
In the present study the main objective was to improve the earlier model of mesocosm experiments described by Baretta-Bekker et al. (1994) into a model that is capable of predicting the time evolution of the biological constituents and the nutrient concentrations as observed in short-term mesocosm experiments by simulating the carbon and nutrient dynamics in nutri- ent-enriched as well as in nutrient-poor conditions.
The model described is based on a subset of the ERSEM model, version 11. An overview of ERSEM is given in Baretta et al. (1995). See Varela et al. (1995) and Ebenhoh et al. (1997) for descriptions of the pri- mary production module, Baretta-Bekker et al. (1995) for the description of the microzooplankton module and Broekhuizen et al. (1995) for the mesozooplankton module.
The model runs in the software environment SESAME (Ruardij et al. 1995), on UNIX machines under Solaris. The conceptual time step is 1 d, thus all rate parameters have the unit d-l. SESAME uses adap- tive time-stepping, reducing the time step whenever any rate of change exceeds 0.5, thus minimising the numerical inaccuracy inherent in the used Eulerian integration method. The minimum value the time step can attain is set at 1 X 10⁻⁶ d, which is about 0.09 S.
The model is calibrated with data from mesocosm experiments carried out in a small fjord in northeastern Denmark and verified with independent measure- ments from other mesocosm experiments carried out in the upper bracklsh layer of a fjord in southwestern Norway.
MATERIAL AND METHODS
Mesocosm experiments. The model is calibrated with data from mesocosm experiments carried out In Knebel Vig, Denmark (56" 14' N, 10" 29' E), in the period from 26 June to 8 July 1994. Basically, the experiments, performed m cylindl-ical enclosures with a diameter of 1.75 m and a depth of 3 m, are the same as those in 1991, described in Baretta-Bekker et al. (1994). The model was applied to 3 of the enclosures: 1 control and 2 of the nutrient-enriched ones, to which
Baretta-Bekkei- et al.. An lmproved nlodel of carbon and nutrlent dynamics 93
-- - - --p
N and P or N, P and Si had been added. Table 1 details the enrichment regimes. Initial values for the state variables were measured only In the control and were applied here to all 3 enclosures.
The model was validated with measurements from other mesocosm experiments carried out in the upper brackish layer of Hylsfjord (59" 30' N, Go 30' E) , which 1s part of the Sandsfjord fjord system on the southwest- ern coast of Norway, in the period from G to 13 July 1995. Data were used from 4 enclosures which, with a diameter of 1 m and a depth of 2 m, were somewhat smaller than those in Knebel Vig, enriched with nitrate, phosphate and glycine in different combina- tions according to Table 2. For a more detailed descrip- tlon of the experimental setup, see Havskum & Hansen (1997).
The model. The model describes the carbon, phos- phorus, nitrogen and silicon cycles in nlesocosms which consist of a well-mixed water column, without sediment underneath. The model is physically forced by time series of daily irradiance and temperature as measured during the experiments. The biological con- stituents can be divided into the primary producers, the secondary producers and the decomposers, while in addition, mixotrophic flagellates are included as a state variable.
The non-biological state variables in the model are the nutrients phosphorus, nitrogen and silicate, oxy- gen, dissolved organic carbon, phosphorus and nitro- gen and particulate carbon, phosphorus and nitrogen.
Fig 1 and Table 3 give an overview of the food web structure as incorporated in the model.
Primary producers: The primary producers in the model consist of 3 functionally different groups, which are operationally defined as: (1) picoalgae, phyto- plankton in the size class 0.2 to 2 pm ESD (equivalent spherical diameter), grazed by heterotrophic nano- flagellates and rnixotrophic flagellates; (2) autotrophic flagellates, mostly from 2 to 20 pm ESD, grazed by heterotrophic nanoflagellates, mixotrophic flagellates, micro- and mesozooplanton; (3) diatoms, roughly from 20 to 200 pm ESD, grazed by micro- and mesozoo- plankton. All groups are modelled in the same way and differ in the parameterisation only. An exception is the silicate dependence of diatoms. The standing stocks are described as densities of the carbon, nitro- gen, phosphorus and, in the case of diatoms, silicate components of the biomass: Pc, Pn, Pp, PS. Carbon is expressed in mg C m-3, while the nutrients are expressed in mm01 m-3.
In this model the inorganic carbon assimilation, i.e. the potential uptake, is dependent on the maximal uptake rate (sump$) , irradiance, water temperature and, in the case of diatoms, on the external concentra- tion of silicate. How much of the carbon assimilated
Table 1. Dally add i t~on of nu t r~en t s In the form of inorganic nitrogen, phosphorus and silicate in mm01 m-3 to 2 enclosures
In the Knebel Vlg (Denmark) experiments, 1994
Date N, P, Si enclosure N, P enclosure N P Si N P p- P p - - - -
26 June 14 2 14 14 2 27 June 14 2 14 14 2 28 June 14 2 14 14 2 29 June 14 2 14 14 2 30 June - - -
1 July - - -
2 July 7 - - -
3 July 35 - - - -
4 July 14 - - - -
5 July 14 - - - -
6 July - - - - -
7 July - - -
8 July - -
that can also be incorporated into biomass depends on the internal phosphorus and nitrogen pools. Thus gross productivity varies with the intracellular nutnent quota for phosphorus and for nitrogen. As the potential pro- ductivity, in periods of nutrient limitation, quickly exceeds the gross productivity, which is defined by the internal nutrient pool, high excretion rates of nutrient- poor dissolved organic carbon can occur. For diatoms the nutrient-stress lysis rate is not only based on the intracellular limitation of phosphorus and nitrogen, but also on the external silicate limitation. Net productivity is determined by how much carbon is respired, a process that in this model is independent of the inter- nal nutrient pools.
The nutrient uptake processes for phosphate, ammo- nia and nitrate thus are decoupled from the carbon assimilation processes, with nutrient uptake being a function of the external nutnent concentration, the affinity of the phytoplankton group for a nutrient and the level of the intracellular nutrient storage.
For the silicate uptake (diatoms only) no storage is assumed, hence, assimilation of diatoms is additionally
Table 2 Daily additions of nutrients to the 4 enclosures of the Hylsfjord experiment in Norway. 6 to 13 July 1995 Addition of inorganic n i t r o g ~ n , phosphorus and the N component of glyclne m mm01 m ' and the addition of the C component of
glyclne in m g C m-'
N NP NG NPG
Nitrogen 2 2 -
Phosphorus - 0.1 - 0.1 Glycine C - - 4 8 48 Glycine N - - 2 2
94 Aquat Microb Ecol 14: 91-108,1998
7- zmplanklon 1 -
DOC 86
phyloplanklon I I
Y., l
156 1M 3 zmplanklon
phytoplankton l l 3 l l
zmplanklon
366.8 mg C
9
dependent on the external SiO, concentra- tion, and the S1 uptake is proportional to car- bon assimilation. In the case of negative net production (respiration exceeds production, in winter, on dark days and in deeper layers) nutrient release may occur. All processes are temperature dependent with the same Q,,, value.
In the previous version of the model (Baretta-Bekker et al. 1994, 1995) gross pro- duction was dependent on the external nutri- ent concentrations of N and P, using classical Michaelis-Menten functions. As a conse- quence net productivity was always in step with external supply and excretion rates were low, as there could never be excess assimilate. In Table 4 the rates and their dependencies for both models are given.
A more extensive description of the decou- pling of carbon and nutrient dynamics is given in Baretta-Bekker et al. (1997). Para- meters used in the primary production mod- ule are given in Table 5.
Consumers: The consumers in this model consist of microzooplankton, heterotrophic flagellates and mesozooplankton. In Table 6 the parameters used in these modules are given.
Microzooplankton is defined as hetero- trophic planktonic organisms from 20 to 200 pm in size, excluding heterotrophic nanoflagellates, nauplii of mesozooplankton and benthic larvae. The microzooplankton consists mainly of suspension-feeding cili- ates, which feed on phytoplankton, consist- ing of diatoms, autotrophic flagellates and picoalgae, on heterotrophic flagellates, bac- teria and - because the microzooplankton itself is a large and diverse group - they also indulge in cannibalism. They 'are grazed by omnivorous mesozooplankton.
The heterotrophic flagellates feed on bac- teria, on autotrophic phytoplankton, consist- ing of autotrophic flagellates and picoalgae,
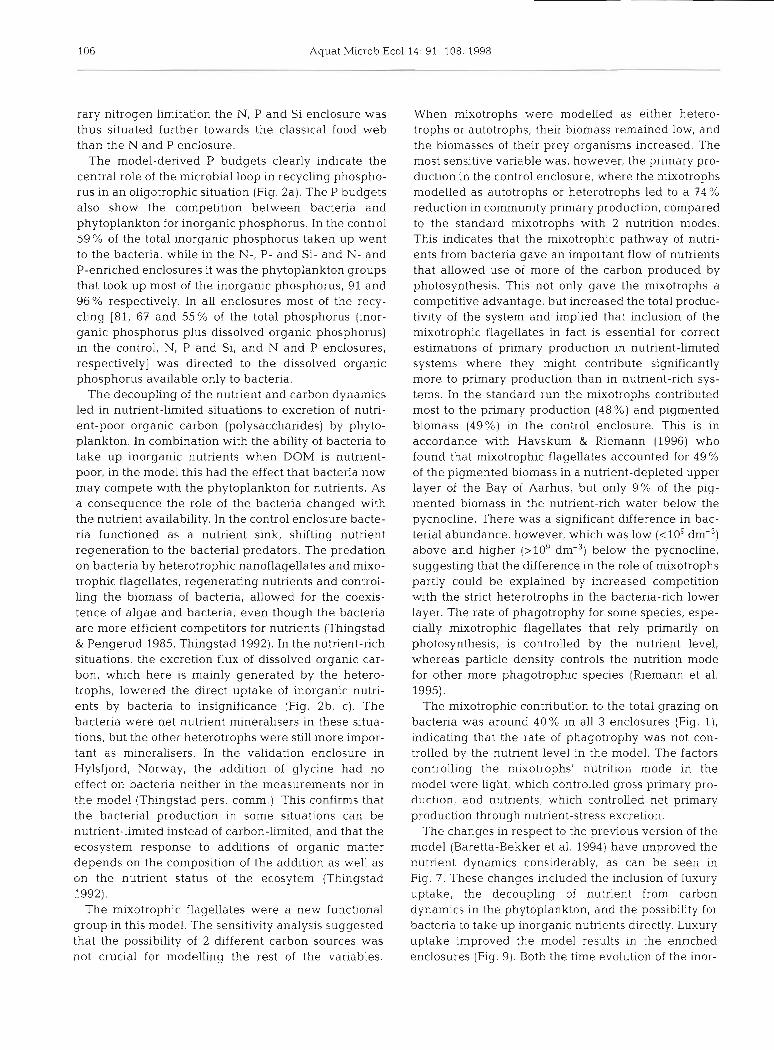
Fig. 1. Normalised carbon flows through the sys- tem in (a.) the control enclosure, (b) the N-, P- and Si-enriched enclosure and (c) the N- and P- enriched enclosure. The calculated carbon flows are given as percentages of the daily average gross carbon assimilation of phytoplankton. Calculated average standlng stocks are given In mg C m-3 and printed in the upper right corner of the boxes, with the experimentally derived values given in the left
corner
Baretta-Bekker et al.: An improved model of carbon and nutrient dynamics 95
Table 3. Uptake/feeding relations as incorporated in the model. +: trophic interaction exists
Substrate/prey Code - Producers - Decomposers Consumers - P 1 P2 P3 B 1 P6 Z6 Z5 2 4
and on themselves. They are grazed in turn by micro- Broekhuizen et al. (1995). In this model only omnivo- zooplankton and potentially by mesozooplankton. rous zooplankton is distinguished. In order to effect a
Microzooplankton and the heterotrophic nanoflagel- proper biomass of mesozooplankton over the short lates are modelled according to the concept detailed in duration of the modelling experiment the measured Baretta-Bekker et al. (1995), while mesozooplankton is biomass of the eggs produced was subtracted from the modelled according to another concept, as described in simulated mesozooplankton biomass, shunting the
Table 4. Specific rates determining the carbon dynamics in the model in comparison with the older version of the model. See Table 5 for explanation of the parameters. Bold-printed terms indicate nutrient limitation. All terms with Si refer to diatoms only
and are printed in parentheses
Specific rate Old model version New model version dependent on dependent on
Max. potential uptake sump$ sump$ Temperature Temperature Light Light External nutrient concentration (External Si concentration)
Gross uptake Max. potential uptake Max. potential uptake External nutrient concentration Total excretion and lysis
Lysis, nutrient stress Max. potential uptake Internal nutrient pool External nutrient concentration sdoP$ pum-eoP$ (External Si concentration)
eggs produced to detrital carbon. Including the egg biomass into the mesozooplankton biomass would in effect mean that the egg biomass would have the same physiological rates as the rest of the mesozooplankton population. This would cause an unrealistically high grazing pressure.
Concerning the consumers in this model there is 1 essential change in comparison with the older version. The parameter minfood$ acquired a different mean- ing. In the older model (Baretta-Bekker et al. 1994, 1995) this parameter defined the threshold value of food concentration below which the heterotrophic nanoflagellates could not graze. In the model de- scribed in this study, minfood$ is used in the micro- zooplankton and in the heterotrophic nanoflagellates module to apportion the food sources such that the grazers will eat relatively more from the more abun- dant sources, according to the following equation:
qZ$, is excreted as inorganic phosphorus and as ammonium, respectively.
The carbon excretion products are taken to be organic carbon, partly in dissolved form and partly in particulate form, of which the dissolved form is avail- able for bacteria at the same tirnestep.
Mixotrophic flagellates: The mixotrophic flagellates are defined as protists of a size between 2 and 20 pm that are able to photosynthesise and feed heterotroph- ically at the same time. The model description of this group is a combination of the code for the primary pro- ducers and the code for heterotrophic nanoflagellates. Nutrient availability and food concentrations deter- mine the degree to which they behave autotrophically or heterotrophically. They feed on bacteria, on pico- algae, on autotrophic and heterotrophic flagellates and on themselves.
With regard to the nutrient dynamics it is assumed that the mixotrophic flagellates can take up nutrients osmotrophically as well as phagotrophically. The excre-
where Z = consumers; ST, = state variable i, in this case tion of nutrients is different from that of microzooplank- a food source i for Z; suSTl-Z$ = parameter for the ton and heterotrophic nanoflagellates: in the calcula- availability of ST, for Z; ruST,-Z = uptake rate. tion of the autotrophic phosphate uptake according to:
The nutrient dynamics in these groups is modelled as follows: at every timestep the excess of phosphorus and nitrogen relative to the fixed nutrient/carbon ratio, where rumlPp = runPc. qpmP + (qpmP- qpP) . Pc
Table 5. Parameters of the primary producers and of the autotrophic part of the mixotrophic flagellates, as used in the model. PI: diatoms; P2: autotrophic flagellates; P3: picoalgae; P6: mixotrophic flagellates. Naming convention: P: one of the phytoplankton groups; S: specific; U: uptake; r: respiration; d: mortality; e: excretion; g: grazing (when it is the second character) or gross (when it is the third character); q: ratio; t : total; m: maximal; c, n, p, S (as last character): carbon, nitrogen, phosphorus, silicate; $denotes
Uptake Max. specific uptake rate at 10°C sump$ 2.5 1.85 2.7 1 .5
Loss rates Excreted fraction of the uptake pu-eaP$ 0.05 0.05 0.05 0.05 Nutrient-lysis rate sdoP$ 0.01 0.01 0.01 0.01
Respiration Rest respiration at 10°C srsP$ 0.15 0.1 0.1 0.1 Activity respiration p U-ra P$ 0.4 0.4 0.4 0.4
Nuirient dynamics Min. N'/C ratio (m01 g-' C) qnlP$ 0.00687 0.0687 0.00687 0.00687 Min. P/C ratio q ~ l p $ 0.4288 X 1 0 . ~ 0.4288 X 10.' 0.4288 X IO-' 0.4288 X 10." Redfield N/C ratio qnRP$ 0.0126 0.0126 0.0126 0.0126 Redfield P/C ratio ~ P R P S 0.7862 X 1 0 - 9 . 7 8 6 2 X 10-.' 0.7862 X 10.' 0.7862 X 10.' Multiplica.tlon factor max. N/C ratio xqnP$ 2 2 2 2 Multiplication factor max. P/C ratio x ~ P P $ 2 2 2 2 \tax. Si /C ratio qsPc$ 0.03 Affinity for NO3 qurPn3$ 0.005 0.005 0.0 0.0025 Aff~nity for NH, quPn4$ 0.02 0.02 0.10 0.0025 Aff~nitv for P qurPp$ 0.0025 0.0025 0.09 0.0025 Half value of SiO, limitation chPs$ 1.0 - -
Baretta-Bekker et al.. An improved model of carbon and nutrient dynamics 97
Table 6. Parameters of the microzooplankton functional groups, ot the bacteria and of the heterotrophic part of the mixotrophic flagellates, as used in the MEICE model. ST stands for state variable and can be substituted by one of the following: 25: micro- zooplankton; Z6: heterotrophic flagellates; P6: mixotrophic flagellates; B1. bacteria. Other symbols and naming convention as in
Uptake Half saturation value chuSTc$ 80 300 300 - Max speclflc uptake rate 10°C sumST$ 1 2 7.0 7.0 8.38 Availability of P1 for ST suP1-ST$ 0.1 - - - Availability of P2 for ST suP2-ST$ 1.0 0.5 0.0 - Availability of P3 for ST suP3_ST$ 0 1 .O 1.0 - Availability of P6 for ST suP6-ST$ 1 . O 0.5 0.0 - Availability of Z5 for ST suZ5-ST$ 1.0 - - - Availability of Z6 for ST suZ6-ST$ 0.2 0.2 0.0 - Availability of B1 for ST suB1-ST$ 0.1 0.1 0.1 Selectivity minfoodST$ 200 100 100 -
Loss rates Assimilation efficiency puST$ 0.5 0.25 0.4 0.5 Assimilation efficiency at low temperature puSTo$ - - - 0.2 Excreted fraction of uptake pu_eaST$ 0.5 0.5 0.5 -
Excretion Fraction of excretion production to DOM pe-R1STS 0.5 0.5 0.5 -
Nutrient dynamics Max. N/C ratio qnSTc$ 0.0167 0.0167 0.0167 0.02084 Max. P/C ratio qpS Tc$ 0.00185 0.00185 0.00185 0.002083
Other parameters C/N ratio in fresh detritus (Redfield ratio) pRGcR6n$ 6 625 Temperature dependency q1 ON4N3.S 2.367 Relative nitrification rates sN4n3$ 0 01
and rum2Pp = quPp$. POr . Pc l
the term (qpmP - qpP) . Pc can become negative if qpP > qpmP. In that case there is a negative phosphate uptake, which is in fact a phosphate release. Nitrogen excretion is treated identically. The nitrogen released is added to the pool of NH,.
Bacterioplankton: Bacteria take up dissolved or- ganic matter (DOM) at the same timestep as DOM is produced. Depending on the amount of nutrients in this DOM the bacteria will either take up or excrete nutnents. The actual intracellular nutrient/carbon ratio determines the size and the direction of the nutrient flux. If the difference between the actual nutrient/car- bon ratio qB1 and the maximum value qB1$ is positive, the bacteria will excrete nutrients. When the differ- ence is negative they will take up inorganic nutnents, limited by a Michaelis-Menten ratio, according to the following formulae:
then release = (qpB1c- qpBlc$f . B l c
else
uptake = (qpBlc$- q p B l c ) . B l c P04/(P04 + chBlp$)
In the model the functional group of bacteria includes picobacteria and a population of filamentous bacteria, which was observed during the experiments in increasing numbers (Havskum pers. comm.). Because ciliates can prey on filamentous bacteria (Havskum & Hansen 1997), the food web structure has been adapted so that the bacteria can be eaten by microzooplankton.
Apart from the ability to take up inorganic nutrients and the change in the food web interactions the formu- lation is the same as described in Baretta-Bekker et al. (1995).
98 Aquat Microb Ecol 14: 91-108, 1998
t
phytoplankton
Flg. 2. Normalised phosphorus flows through the system in (a) the control enclosures; (b) the N-, P- and Si- enriched enclosure and (c) the N- and P-enriched enclosure. The cal- culated phosphorus flows are given as percentages of the sum of the daily average phosphorus uptake by
phytoplankton and bacteria
Baretta-Bekker et al.: An improved model of carbon and nutrient dynamics 99
Date Control N-, P-, Si-enriched N-, P-enriched Data Model Data Model Data h4odel
27 June 18.6 56.9 84.0 - 90.3 28 June 18.6 28.9 44 323.6 5.1 297.6 30 June 3.85 9.1 9.5 439.5 5.8 286.7 2 July 2.86 7.0 13.7 427.7 3.4 121.9 4 July 4.38 7.0 3.2 625.9 5.7 296.4
Table 7. Turnover times for phosphorus in h for each enclosure, calcu- phosphorus taken up daily by the phyto- lated with the standard version of the model and measured (Thingstad plankton groups and bacterioplankton, and
unpubl data) PO, is the concentration of phosphorus. In the same way the turnovcr tlmes t, for nitro- gen ( N o 3 + NH4) can be calculated.
Control enclosure
RESULTS
The preferred method of calibrating and verifying a model with data of several experimental setups is to use the data of one of the setups for calibration and those of the other enclosures for validation (Jsrgensen 1995). Because the objective was to make the model formulation as generic as possible, because each of the mesocosms evolves in a different direction and none of them is in steady state, we considered it more impor- tant to arrive at 1 parameter set that was able to repro- duce the different experiments qualitatively, instead of parameterising for a quantitative reproduction of 1 particular experiment.
As will be clear from the model-derived budgets of carbon and phosphorus (Figs. 1 & 2) for the 3 enclo- sures, different processes dominated in each enclo- sure, implying that the sensitivity of the model to particular parameters control
Model results together with measurements of standing stocks and some of the fluxes are given in Figs. 3a-d to 6a-d. The model reproduced the time evolution of the stand-
ing stocks of diatoms and autotrophic flagellates in the control enclosure quite well (Fig. 3a, b). The simulated biomass of the smaller picoalgae (Fig. 3c), however, did not reach the observed levels and not the right time evolution. Of all the loss fluxes from picoalgae calcu- lated in the model, measurements for 2 of the grazing fluxes were available: the flux to the mixotrophic fla- gellates and the flux to heterotrophic flagellates (Fig. 4a, b). The simulated flux to the heterotrophic fla- gellates was overestimated in the beginning, but was correct in the second part of the experiment, while the simulated flux to the mixotrophs did not have the right form. The simulation of the mixotroph biomass (Fig. 3d) was of the right order of magnitude, but failed in the time evolution. The bacterial biomass (Fig. 5a) was also of the right order, while the flux from bacteria to mixotrophic flagellates (Fig. 4c) was too high and to
should be different in each case. For example, in a condition of nutrient enrichment, the parameters defining 1
+ a + + + + incipient nutrient limitation cannot be o
calibrated, as nutrient limitation does 177 185 177 185 177 185 177 185
not play a role there. Therefore all 3 enclosures were used in calibrating N. t? %enriched e f h
the model, and data of mesocosm $ I A p&, ;p !gp: experiments carried out in the sum- - + + 0, + +
mer of 1995 in Norway were used for 2 - .- + + S
0 a + +
the validation (Havskum & Hansen 2 0 o 177 1 85 177 185 177 185 177
E O
1997). 185
Except for standing stocks, nutrient N. P-enriched i
concentrations and those fluxes that I
could be compared directly to mea- g surements, turnover times for phos- 3
sh izb - L - + + .- o a phorus and nitrogen were also used to - + 2 0 o + E o
calibrate the model. The turnover 177 185 177 185 177 185 177 185
time tp (Table 7) is expressed in hours day number day number day number day number
and defined as: Fig. 3. Simulation output and measurements of standing stocks in mg C m-3 of
t, = 24/(runPTp/PO,) the primary producers and of the mixotrophic flagellates in (a to d) the control enclosure, (e to h) the N-, P- and Si-enriched enclosure and (i to 1) the N- and P-
where runPTp is the total amount of enriched enclosure
100 Aquat Microb Ecol 14 : 91-108, 1998 p-
heterotrophic nanoflagellates too low [Fig. 4d). this flux back into CO2 again, while the heterotrophic Because this was similar to the picoalgal fluxes nanoflagellates and mixotrophs recovered the other (Fig. 4a, b), it indicates that the position and the role of half through grazing on the bacterioplankton. The the mixotrophs in this oligotrophic situation, especially transfer fluxes into ~nicrozooplankton and mesozoo- with regard to their interactions with the heterotrophic plankton from both phytoplankton and nanoflagellates nanoflagellates and bacteria, are not completely cap- were all less than 10%. tured by the model. The time evolution of hetero- The phosphorus flows in the control were nor- trophic flagellates, micro- and mesozooplankton malised to the sum of the phosphorus uptake fluxes by (Fig. 5b-d) and the nutrient concentrations (Fig. 6a-d) phytoplankton, rnixotrophic flagellates and bacteria was reproduced correctly, although at the end of the (Fig. 2a). The DOM excreted by the primary producers experiment the silicate concentration remained higher was nutrient-poor, leading to a direct inorganic nutri- than the measurements. This indicates that the nutri- ent uptake by bacteria (Fig. 2a), which exceeded that ent uptake and regeneration processes in toto were of the phytoplankton, but was quickly regenerated, captured correctly, that the balance between auto- mainly by the heterotrophic nanoflagellates and the trophs, heterotrophs and decomposers in the nutrient mesozooplankton. cycling was correct, but that the grazing interactions in the microbial food web between the mixotrophic and heterotrophic flagellates, the picoalgae and the bacte- N-, P- and Si-enriched enclosure ria were not fully resolved.
The model-derived carbon flows in the control enclo- Model results and measurements from the N-, P- and sure are given in Fig. la. The fluxes are expressed as Si-enriched enclosure are given in Figs. 3e-h to 6e-h. percentages of the total gross primary production by The model failed to reproduce the observed time evo- phytoplankton and the mixotrophic flagellates. The lution of the N-, P- and Si-enriched enclosure without major carbon fluxes were the flux from phytoplankton an extra lysis rate dependent on the external silicate into DOC at 63%, followed by the excretionAysis concentration. From the measurements it was clear fluxes from the heterotrophic components at 23%, that halfway through the experiment, around 1 July, together 86% of the primary production. This DOC 'something' happened in the N. P and Si enclosure. was quickly recycled by bacteria, indicating the cen- Although there was still silicate (Fig. 6h) the diatom tral role of the bacterioplankton which respired half biomass (Fig. 3e) stopped increasing. The nitrate con-
centration (Fig. 6f) on that day was very low (1.17 mm01 m-". From 2 July
conlrol a b C . d nitrogen was added again which cn m d, - g - :;K, ph isn, igb+ caused a small biomass increase for
:: .- autotrophic flagellates, but not for the E + + + + -
U f b + + + f + + - U
diatoms. Grazing by mesozooplank- .- a + + g + + D
a + + 2 X 0 X 0
+ + ton, roughly calculated to be 35 mg C 5 0 - 4 0
- 177 185 = 177 185 - 177 185 = 177 185 m-3 on 2 July, or other grazing pro- cesses, was insufficient to explain the
o, N. F! SI en:~ched e l . g 0 h m 0 - - collapse of the diatom biomass. - izwb pp pp+ i8v The diatom biomass (Fig. 3e) in the
E model increased somewhat too long b U - .- a U
L) + 0 as nutrient limitation occurred only a X + + + 2 0 X 3 4 0 + 5 0 + + + - c later. Thereafter Si limitation caused a
177 185 = 177 185 177 185 ' l77 185 strong decline in biomass. The auto-
N. P ewched i m i , trophic fl.agellates (Fig. 3f) were un- m derpredicted in the second part of the
experiment. The picoalgae (Fig. 39) E 0
L were slightly overpredicted. The
+ mixotrophs (Fig. 3h) and the bacteria - - 177 185 = 177 185 ' 177 185 1 1 7 7 18s (Fig. 5e) were simulated correctly by
day number day number day number day number the model. The grazing fluxes on bac- teria predicted by the model (Fig. 4g,
Fly. 4. Simulation output and measurements of fluxes In mg C m - ' d- ' from the bacteria and from the picoalgae to the heterotrophic nanoflagellates and to thc: h) were of the right order of magnl-
mixotrophic f la~el la tes in (a to d) the control enclosure. (e to h) the N-, P- and SI- tude l but did the time 'enriched enc1osu;e and (i to 1) the N- and P-enhched'enclosure variability in the observations. Both
Baretta-Bekker et al.: An ~mproved model of carbon and nutnent dynamics
control a b C d rectly, as well as the simulated fluxes. C
0
; y- Here again nitrate, phosphate (Fig. 6i, j ) and ammonium (Fig. 6k; data: H.
U - Kaas pers. comm.) were overpre- D
+ m ?I I E 0 I--++ g o , - , dicted towards the end of the simula-
177 185 177 185 177 185 177 185 tion. The carbon fluxes (Fig. l c ) were
q u ~ t e different from those in the con- N. P, SI-enrlched e h trol (Fig. l a ) . According to the model
;gb 1 : ~ : 1 : ~ most directly of from the assimilated the primary carbon producers went to m C c + the consumers, where the hetero-
0 + 0 E O E 0 177 185 177 185 177 185 177 185 trophic nanoflagellates occupied a
key position, generating 43% of the
N. P-enr~ched i incoming carbon into DOC, produc-
I p/ 1 : ~ ing almost half of the total DOC formed. All the DOC produced was -
0 m consumed by bacteria, providing n -
Q,
0 + = 0 0 a, E 0
food for mixotrophic and hetero- 177 185 177 185 177 185 177 185 trophic flagellates. From the hetero-
day number day number clay number day number trophic nanoflagellates only a small
Fig. 5 Simulation output and measurements of the standing stocks in mg C m-3 fraction was higher of the bacteria, the consumers and the m~xotrophic flagellates In ( a to d ) the con- trophic levels. trol enclosure, ( e to h) the N-, P- and Si-enriched enclosure and (i to 1) the N- and Fig. 2c, with the phosphate fluxes,
P-ennched enclosure shows that the dissolved organic mat- ter flux from the consumers con-
micro- and mesozooplankton standing stocks (Fig. 5g, tained sufficient phosphorus for the bacteria not to h) were overpredicted in the second half of the experi- take up orthophosphate. In this situation the bacteria ment. and the primary producers did not compete for nutri-
The simulated nutrient concentrations (Fig. 6e-h) ents, but bacteria regenerated nutrients from dissolved were very close to the measurements, except for the last organic matter. The budgets indicated the phosphate few days, when the modelled concentrations remained storage in bacteria. higher than the measured ones.
N- and P-enriched enclosure
Figs. 3i-1 to 6i-1 give the simulated functional group biomasses, some of the fluxes and the nutrient concentra- tions with the measured values. Al- though the prediction of both particu- late and dissolved primary production was much lower than the measure- ments (not shown), the time evolution of the standing stocks of the primary producers (Fig. 3i, k) was reproduced correctly, except for the autotrophic flagellates (Fig. 3j), which were not in accordance with the measurements. This is the same discrepancy as was appearing in the N-, P- and Si- enriched enclosure. The mixotrophic flagellates (Fig. 31), the microzoo- plankton (Fig. 5k) and the mesozoo- plankton (Fig. 51) were simulated cor-
control
day number day number day number day number
Fig 6. Slmulat~on output and measurements of the concentrations in mm01 m-3 of inorganic phosphate, nitrate, silicate and ammonium. (a to d ) Control enclosure; ( e to h) N-, P- and Si-enriched enclosure; (1 to 1) N- and P-ennched enclosure
102 Aquat Microb Ecol 14: 91-108, 1998
SENSITIVITY ANALYSIS
The new features in the model described here in comparison with the earlier model (Baretta-Bekker et al. 1994) are (1) the inclusion of the picoalgae and the mixotrophs; (2) the ability of bacteria to take up dis- solved inorganic nutrients, instead of only dissolved organic nutrients; (3) the inclusion of luxury uptake, i.e. the ability of the phytoplankters to fill their cells with more nutrients than according to the Redfield ratio; and (4) the decoupling of the nutrient dynamics from the carbon dynamics for the phytoplankton func- tidnal groups.
For some of the variables the combined effects of these changes are illustrated in Fig. 7 , by comparing results of the standard run of the model described with results of the older model. To test whether the changes in this model were also improvements several tests were carried out.
Inclusion of picoalgae
The inclusion of picoalgae as an explicit component in the system led to slightly higher regeneration fluxes in all the food web components that are directly or indirectly related to the picoalgae, as well as to slightly
control standard - old version --------
higher biomasses of bactena and their grazers In gen- eral the mean turnover times (Table 8) for P and N were lower in the run including picoalgae, indicating that the system runs faster in the presence of pico- algae.
Inclusion of rnixotrophic flagellates
In the standard run the mixotrophs as a functional group were most dominant in the control enclosure, accounting for 49% of the pigmented biomass and 48 % of the primary production, compared to 11 and 14 %, respectively, in the N-, P- and Si-enriched enclo- sure and 32 and 26%, respectively, in the N- and P- enriched enclosure. A comparison was made between the standard run and 2 runs where the mixotrophic fla- gellates were modelled either as exclusively auto- trophic or as exclusively heterotrophic. In both sensi- tivity analyses other functional groups were almost unaffected, except for the picoaIgae and the bacteria that reached higher biomasses presumably because of lower grazing pressure. The mixotrophs themselves had lower biomasses than with both nutrition modes, but were doing significantly better as purely auto- trophs than as purely heterotrophs. In both cases the primary production stayed almost the same in the
nutrient-enriched enclosures, but reached much lower levels in the control enclosure, leading to a 74 % reduction of the total net primary pro-
d duction. Thus the oligotrophic system was the most sensitive to changes in
:+ .- mixotrophic nutrition mode.
.- - + V)
D 0 0
N. P. Si-enr~ched standaro - old version --------
e
F?, P enriched standard - 0'0 verrlon --------
177 185 177 185 177 185
Ability of bacteria to take up inorganic nutrients
h
The main effects of switching off the
a capability for inorganic nutrient up-
0 L a take by bacteria could be seen in the a o o primary producers and especially in
177 185 177 185 177 185 the picoalgae. The producers bene- fited from the absence of competitors if bacteria were not taking up nutri-
I ents. In the nutrient-enriched enclo- sures only a small effect on picoalgae
0 could be seen. Considerable effects
L a occurred in the fluxes from picoalgae 0
177 185 177 185 177 185 177 185 to mixotrophic and heterotrophic fla- aay number day number day number day numoer gellates (Table 9) during the period
where the picoalgae could realise a
Flg. 7 Simulation output and measurements of the standard model (MEICE) higher growth because the lack compared to an earlier model version (Baretta-Bekker et al. 1994) (old version) competition for nutrients.
Baretta-Bekker et al.: An improved model of carbon and nutrient dynamics
Table 8 Normalised turnover tlmes ( t for phosphorus and t, for nitrogen) for the sensltlvlty analysis carried out For the normal- ~ s a t ~ o n the value of the turnover times for the standard version is set to 1 The different runs are indicated min-P3, ~vi thout p ~ c o - algae, PG-aut, mlxotrophs modelled as autotrophs PG-het, in~xotiophs modelled as heterotrophs, min-P3P6, without p~coa lgae and mlxotrophs, nonutB1, without Inorganic nutrlent uptake by bactena, nolux, w ~ t h o u t luxury uptake, nolux-minP3P6, w ~ t h o u t
luxury uptake and without p~coalgae and mixotrophs, old vcraiun (Barettd-Bekker e t a1 1994)
Enclosure Standard inln-P3 PG-aut PG-het min-P3P6 nonutBl nolux nolux- Old mlnP3P6 verslon
P P P P P ~ P
t, Control 1 1.6 1 . O 1.3 2 3 3 2 1.2 2.4 232 t, N , P , S l 1 1.3 0 .8 1.0 1 4 1 1 1 7 1.9 3.4 t,, N , P 1 1 5 0.8 1 .O 1.8 1 0 2.2 3.6 4.8 t, Control 1 0 8 1.6 0.9 1 .O 1.5 1 .O 1 .O 31.7 t, N, P, Si 1 1.5 0.4 0.9 0.7 0.4 1.1 1.4 1.2 t, N , P 1 1.5 0.9 1.2 2.0 1.0 2.7 4.5 4.0
In the nutrient-enriched enclosures the ability of bacteria to take up inorganic nutrients had no influ- ence on the turnover times of phosphorus (Table 8). In the control enclosure the model system ran consider- ably slower when the bacteria could obtain their nutri- ents only from organic sources.
Inclusion of luxury uptake
The effect of including luxury uptake was tested by comparing the standard run in which the maximal intracellular ratio for all phytoplankton groups was set to twice the Redfield ratio, with a run where the maxi- mal intracellular ratio was halved (equal to the Red- field ratio). No effect could be seen in the control enclosure, but luxury uptake in the nutrient-ennched enclosures resulted in much closer correspondences between the simulated and the observed nutrient con- centrations (Fig. 8). With regard to the time evolution of picoalgae with and without luxury uptake the stan- dard value for the capacity for luxury uptake of pico- algae in the model was apparently too high.
The turnover times for phosphorus in the control were not affected by the inclusion of luxury uptake as there could not be luxury uptake under those circum- stances. In the nutrient-enriched enclosure the model system with luxury uptake ran much faster than with- out (Table 8).
Decoupling the nutrient and carbon dynamics in the phytoplankton groups
To test the effect of decoupling the nutrient uptake from the carbon growth dynamics in the phytoplankton functional groups the output of a run with the old for- mulation for the phytoplankton module (Varela et al. 1995) and the new one was compared. Because the dif- ference between the old formulation and the new one is not just the decoupling, but the fact that the old one is also without picoalgae and mixotrophic flagellates, and without luxury uptake, the comparison was done between the old primary production module and a run with the new primary production module, without picoalgae and mixotrophs, and without luxury uptake.
The role of the decoupling was most evident in the nutrient concentrations in the control enclosure (Fig. 9). In the nutrient-enriched enclosure only small effects could be seen.
In the control decoupling the nutrient from the car- bon dynamics made the phosphorus dynamics faster by a factor of 200 and the nitrogen dynamics faster by a factor of 30 (Table 8).
VALIDATION OF THE MODEL
From the mesocosm experiments carried out in the upper brackish layer of Hylsfjord, Norway, used for the
Table 9. Fluxes from picoalgae to mixotrophic and to heterotrophic nanoflagellates (in n ~ g C n1r3 d-l), averaged over the duration of the experiments, in the 3 enclosures for 2 different runs: the standard run and and a run where the bacteria were not able to
take u p inorganic nutrients (nonutB1)
Run Flux from picoalgae to heterotrophic flagellates Flux from picoalgae to mixotrophic flagellates Control N, P N , P, Si Control N, P N, P, S1
The model, using the local initial conditions and physical forcing, but
a without any reparameterisation or 0 L + a recalibration, satisfactorily simulated
0 0 0
177 185 177 185 1 77 185 the enclosures to which nitrogen and phosphate (NP, NPG) had been added, especially when taking into
f g h account the qualitative differences between these systems and those
0 - + + c "'------. used for calibration (Knebel Vig, Den- ------,".-. g .a + + + + 2 a C + mark). o Q a 1 0 In the phosphate-limited enclosures
177 185 177 185 177 185 177 185 the model did not reproduce the data N. P-enriched standard - s."o~"x
well. The phosphate concentration and reqeneration were underesti- -
l mated and therefore also the phyto- plankton biomass and production.
m were too low (Fig. 10). 8 E a
0 0 0 0
177 185 177 185 177 185 177 185 day number day number day number day number DISCUSSION
Fig. 8. Simulation output and measurements of the standard model compared to the model with no luxury uptake (sa-nolux) There is a continuous flux from dis-
solved inorganic carbon to particulate organic matter in the pelagic environ-
validation of the model, 4 enclosures to which nitrogen (N) and/or phos- phate (NP) and/or glycine (NG, NPG) control
sa-nolux-minp3p6 - had been added were simulated (see old verston
Table 2) . Nitrogen was added to all d
enclosures to avoid a shift to nitrogen -'h ;'L limitation under the assumption that 5 'f + - - ,++t+; the experimental system was phos- " L .- --_ _ a
0 0 0
phate-limited. Glycine was added to 177 185 ITI 185 177 185 177 185
test whether bacteria were carbon- N. P. S!-enriched limited. sa-nolux-m#np3p6 -
old verslcn - - - - - -. The validation could be done only h
partly, because in the Hylsfjord there were no unmanipulated enclosures to g use as control. Using the open fjord as ,z
0 0 0 control was not realistic because of the 177 185 1 77 185 177 185 177 185
very different hydrodynamic condi- tions in :he er,c!osures and the open fjord. The mixotrophic flagellates could not be included as an active functional group since no bacterivo- rous mixotrophic flagellates were identified in the enclosures.
The data did not show any signifi- cant difference between enclosures to which glycine (NG, NPG) had been added and those without glycine (N, NP) (Havskum & Hansen 1997). This
day number day number day number day number
Fig. 9. Simulation output and measurements of the standard model without luxury uptake, without picoalgae and without mixotrophs (sa-nolux-minp3p6) compared to an earlier model version (Baretta-Bekker et al. 1994) (old version)
Baretta-Bekker et al . : An improved model of carbon and nutrient dynamics 105
W I I ~ P through the smallest components in +2 X 4 the model to be far larger than
a b C d through the micro- and mesozoo- plankton .in all enrlosurps. The absolute sizes of the fluxes were
m D
0 0 0 0 different in all enclosures, but also
186 192 186 192 186 192 186 192 the normalised fluxes, which were
wilnout P directly comparable, gave different patterns in the control enclosure and
h the nutrient-enriched enclosures. In the control enclosure respiratory pro- cesses dominated the trophic transfer
a fluxes, with the exception of DOC
0 0 0
186 uptake by bacteria. In the nutrient-
192 ' 186 192 186 192 enriched enclosures, especially in the N- and P-enriched one (Fig. lc) , the trophic transfer fluxes, especially from
i I phytoplankton, were much higher '
"l ~°~ and the DOC recycling by bacteria
m - - relatively lower. L - --g' * 0 * - 3 0 S 0 E
Calculating the ratios between the 186 192 186 192 186 192 time-averaged total grazing flux from
the autotrophs (including the auto- trophic part of the mixotrophs) and the grazing flux from bacteria to the heterotrophs (including the hetero- trophic part of the mixotrophs) gave 0 .4 , 1.0 and 2.0 for the control, the N,
0 E 0 P and S1 enclosure and the N and P
186 192 186 192 186 192 186 192 day number day number day number aay number enclosure, respectively. This Suggests
that the relative importance of the Fig 10. Simulation output and measurements of the Norway mesocosms, with fluxes through the bacteria was phosphate (2, 4) and without phosphate (1, 3). (+) With glycine. ( * ) without in the control, and that the rel-
glycine ative importance of the direct fluxes from the phytoplankton groups to the
ment. The trophic pathways of this material vary heterotrophic groups was largest in the N and P enclo- widely, ranging from the traditional food web (Cushing sure. The N, P and Si enclosure occupied an interme- 1989) with organic matter going from large phyto- diate position. The time-averaged carbon budgets put plankton, mainly diatoms, to zooplankton to fish to top the control enclosure close to one end of the food-web predators, to a microbial loop at the other end. These continuum and the N- and P-enriched enclosure close disparate food webs are often seen as discontinuous to the other extreme. In the N, P and Si enclosure and mutually exclusive. Legendre & Rassoulzadegan halfway through the experiment there was a shift from (1995), however, argued that the traditional food web a nutrient-enriched to a nitrogen-limited situation for a at the one end and the microbial loop at the other are few days, modifying this enclosure from a system with unstable extremes on a trophic continuum. complete nutrient availability to a system with unbal-
A major difference between the systems is in the rel- anced nutrient availability. These changing conditions ative contribution of the biological components to car- changed the position of this enclosure on the contin- bon and nutrient cycling which in turn is dependent on uum, resulting in a time-averaged situation that was a set of interacting physical and biological conditions somewhere between the control and the N- and P- (Fig. 1 in Legendre & Rassoulzadegan 1995). enriched situation. Calculating the ratio between the
The model described here reproduced different time-averaged sum of the fluxes from autotrophs to instances of this food-web continuum. The time-aver- heterotrophs and the fluxes via bacteria to het- aged carbon and phosphorus budgets (Figs. 1 & 2) for erotrophs averaged over the first part of the experi- the different enclosures extracted from the model ment (Days 1 to 7 ) gave a value of 3.25 for the N, P and results showed the carbon and phosphorus fluxes Si enclosure. Until the sudden occurrence of a tenipo-
106 Aquat Microb Ecc
rary nitrogen limitation the N, P and Si enclosure was thus situated further towards the classical food web than the N and P enclosure.
The model-derived P budgets clearly indicate the central role of the microbial loop in recycling phospho- rus in an oligotrophic situation (Fig. 2a). The P budgets also show the competition between bacteria and phytoplankton for inorganic phosphorus. In the control 59% of the total inorganic phosphorus taken up went to the bacteria, while in the N-, P- and Si- and N- and P-enriched enclosures it was the phytoplankton groups that took up most of the inorganic phosphorus, 91 and 96% respectively. In all enclosures most of the recy- cling [81, 67 and 55% of the total phosphorus (inor- ganic phosphorus plus dissolved organic phosphorus) in the control, N, P and Si, and N and P enclosures, respectively] was directed to the dissolved organic phosphorus available only to bacteria.
The decoupling of the nutrient and carbon dynamics led in nutrient-limited situations to excretion of nutri- ent-poor organic carbon (polysaccharides) by phyto- plankton. In combination with the ability of bacteria to take up inorganic nutrients when DOM is nutrient- poor, in the model this had the effect that bacteria now may compete with the phytoplankton for nutrients. As a consequence the role of the bacteria changed with the nutrient availability. In the control enclosure bacte- ria functioned as a nutrient sink, shifting nutrient regeneration to the bacterial predators. The predation on bacteria by heterotrophic nanoflagellates and mixo- trophic flagellates, regenerating nutrients and control- ling the biomass of bacteria, allowed for the coexis- tence of algae and bacteria, even though the bacteria are more efficient competitors for nutrients (Thingstad & Pengerud 1985, Thingstad 1992). In the nutrient-rich situations, the excretion flux of dissolved organic car- bon, which here is mainly generated by the hetero- trophs, lowered the direct uptake of inorganic nutri- ents by bacteria to insignificance (Fig. 2b, c). The bacteria were net nutrient mineralisers in these situa- tions, but the other heterotrophs were still more impor- tant as mineralisers. In the validation enclosure in Hylsfjord, Norway, the addition of glycine had no effect on bacteria neither in the measurements nor in the mode! (Thingstad pers. cornm.) This confirms that the bacterial production in some situations can be nutrient-limited instead of carbon-limited, and that the ecosystem response to additions of organic matter depends on the composition of the addition as well as on the nutrient status of the ecosytem (Thingstad 1992).
The mixotrophic flagellates were a new functional group in this model. The sensitivity analysis suggested that the possibility of 2 different carbon sources was not crucial for modelling the rest of the variables.
When mixotrophs were modelled as elther hetero- trophs or autotrophs, their biomass remalned low, and the biomasses of their prey organisms increased. The most sensitive variable was, however, the primary pro- duction in the control enclosure, where the mixotrophs modelled as autotrophs or heterotrophs led to a 74% reduction in community primary production, compared to the standard mixotrophs with 2 nutrition modes. This indicates that the mixotrophic pathway of nutri- ents from bacteria gave an important flow of nutrients that allowed use of more of the carbon produced by photosynthesis. This not only gave the mixotrophs a competitive advantage, but increased the total produc- tivity of the system and implied that inclusion of the mixotrophic flagellates in fact is essential for correct estimations of primary production in nutrient-limited systems where they might contribute significantly more to primary production than in nutrient-rich sys- tems. In the standard run the mixotrophs contributed most to the primary production (48%) and pigmented biomass (49%) in the control enclosure. This is in accordance with Havskum & Riemann (1996) who found that mixotrophic flagellates accounted for 49% of the pigmented biomass in a nutrient-depleted upper layer of the Bay of Aarhus, but only 9% of the pig- mented biomass in the nutrient-rich water below the pycnocline. There was a significant difference in bac- terial abundance, however, which was low (<log dm-3) above and higher (>log dm-3) below the pycnocline, suggesting that the difference in the role of mixotrophs partly could be explained by increased competition with the strict heterotrophs in the bacteria-rich lower layer. The rate of phagotrophy for some species, espe- cially mixotrophic flagellates that rely primarily on photosynthesis, is controlled by the nutrient level, whereas particle density controls the nutrition mode for other more phagotrophic species (Riemann et al. 1995).
The mixotrophic contribution to the total grazing on bacteria was around 40% in all 3 enclosures (Fig. l ) , indicating that the rate of phagotrophy was not con- trolled by the nutrient level in the model. The factors controlling the mixotrophs' nutrition mode in the model were light, which controlled gross primary pro- r l~~ct inn; and nutrients, which controlled net primary production through nutrient-stress excretion.
The changes in respect to the previous version of the model (Baretta-Bekker et al. 1994) have improved the nutrient dynamics considerably, as can be seen in Fig. 7. These changes included the inclusion of luxury uptake, the decoupling of nutrient from carbon dynamics in the phytoplankton, and the possibility for bacteria to take up inorganic nutrients directly. Luxury uptake improved the model results in the enriched enclosures (Fig. 9). Both the time evolution of the inor-
Baretta-Bekker et al.: An improved model of carbon and nutrient dynamlcs 107
ganic nutrients and the nutrient turnover times came much closer to the observations. The decoupling of nutrient and carbon dynamics in the primary produc- ers was the mechanism responsible for the improve- ments in the control enclosure (Fig. 10). The effect of this mechanism is that the dissolved organic carbon excreted under nutrient stress (the control enclosure) now is nutrient-poor, driving the bacteria into direct nutrient uptake and thus into competing for nutrients with the phytoplankton, shifting the role of net miner- alisers to the bacterial grazers.
The validation with enclosures from Hylsfjord, Norway, indicated that the evolution of a nutrient- enriched system is well captured by the model. The addition of an organic carbonhitrogen source (gly- cine) which was not added in Knebel Vig gave model results in accordance with the experiments (Thingstad pers. comm.). The strongly phosphate-depleted enclo- sures were, however, not predicted well by the model, indicating that this situation was more nutrient-limited than the control in Knebel Vig. Thus there seems to be a lack of understanding of the dynamics in strongly limited systems, which leaves room for further improvements of the description of the nutrient dynamics in planktonic food webs. Important aspects to be tested are the description of a bacterial nutrient limitation and bacterial death by viral lysis (Bratbak et al. 1992, Thingstad pers. comm.).
An overall problem in the model described is the grazing interactions dependent on the nutrient condi- tion of the system. In particular, the consequences of grazers not being able to handle all forms (e.g. fila- mentous bacteria) in which their prey may occur equally well, which may lead to rapid increases in abundance of 'inedible' forms, cannot be accounted for by present models.
CONCLUSIONS
Dynamic simulation models, like the one used here, are far from perfect, reflecting our incomplete under- standing of the nutrient dynamics in strongly nutrient- limited environments and of the grazing interactions in the small food web and their consequences to food web structure and dynamics. Major biomass compartments in planktonic food webs and fluxes of carbon and nutri- ents can nevertheless be predicted. The decoupling of carbon and nutrient dynamics and the inclusion of nutrient luxury uptake into the modified model approach presented here gave a better model descrip- tion of the nutrient fluxes than previous versions (Baretta-Bekker et al. 1994). In addition, the idea that rnixotrophy is a proper feeding strategy in strongly nutrient-depleted environments and that it also allows
for the coexistence of pigmented organisms with bac- teria was confirmed. Both the model predictions pre- sented here and experimental results (Havskum et al. pers. comm.) demonstrated that mixotrophic flagel- lates, in the environments examined here, constituted a significant link in the carbon and phosphorus bud- gets. Mixotrophic flagellates were responsible for more than 40 % of the grazing of bacteria in the model, and model predictions suggested that mixotrophy leads to increased primary production in the nutrient- limited enclosures compared to a situation with a strict photoautotrophic nutrition mode. The model success- fully described a generic pelagic food web with dynamically changing pathways of carbon and nutri- ents which expanded or contracted in response to changes in the nutrient regimes, changing the relative importance of the classical food web and the microbial food web.
Acknowledgements. This study was partly funded by the European Union through MAST I1 contract MAS2-CT92-0031 for J.G.B.-B. and B.R. For J.W.B. t h ~ s study was supported by the EU MAST 11 program, contract MAS2-CT92-0032. The authors thank all the participants of the MEICE project, who made available data from the mesocosm experiments to be used in this model: Torkel Gissel Nielsen for the mesozoo- plankton and microzooplankton data; Hanne Kaas for the nutrient data and the data on NH, regeneration; Harry Havskum and Winnie Martinsen for bacteria and phytoplank- ton data; Frede Thingstad for the phosphorus turnover times and for his helpful comments on an earlier version of the man- uscript.
LITERATURE CITED
Baretta JW, Ebenhoh W, Ruardij P (1995) The European Regional Seas Ecosystem Model, a con~plex marine eco- system model. Neth J Sea Res 33:261-270
Baretta-Bekker JG, Baretta JW, Ebenhoh W (1997) The microbial food web in the European Regional Seas Ecosys- tem Model with decoupled carbon and nutrient dynamics. Neth J Sea Res 38(3/4) (in press)
Baretta-Bekker JG, Baretta JW, Rasmussen EK (1995) The microbial food web in the European Regional Seas Ecosys- tem Model. Neth J Sea Res 33:363-379
Baretta-Bekker JG, Riemann B, Baretta JW, Rasmussen EK (1994) Testing the microbial loop concept by comparing mesocosm data with results from a dynamical simulation model. Mar Ecol Prog Ser 106:187-198
Bennett SJ, Sanders RW, Parker KG (1990) Heterotrophic, autotrophic, and mixotrophic nanoflagellates: seasonal abundances and bacterivory in a eutrophic lake. Linlnol Oceanogr 35:1821-1832
Bird DF, Kalff J (1986) Bacterial grazing by planktonic lake algae. Science 231:493-495
Blackburn N, Zweifel UL, Hagstram %1. (1996) Cycling of marine dissolved organic matter 11. A model analysis. Aquat Microb Ecol 11:79-90
Bratbak G, Heldal M, Thingstad FT, Riemann B, Haslund OH (1992) Incorporation of viruses into the budget of microbial C-transfer. A first approach. Mar Ecol Prog Ser 83: 233-280
Aquat Microb Ecol 14: 91-108, 1998
Broekhuizen N, Heath MR, Hay SJ, Gurney WSC (1995) Mod- elling the dynamics of the North Sea's mesozooplankton. Neth J Sea Res 33:381-406
Cushing DH (1989) A difference in structure between ecosys- tems in strongly stratified waters and in those that are only weakly stratified. J Plankton Res 11:l-13
Droop MR (1974) The nutrient status of algal cells in continu- ous culture. J Mar Biol Assoc UK 54:825-855
Ebenhoh W, Baretta-Bekker JG, Baretta J W (1997) The pri- mary producer module in the marine ecosystem model ERSEM. J Sea Res 38(3/4) (in press)
Escaravage V, Peperzak L , Prlns TC, Peeters JCH, Joordens JCA (1995) The development of a Phaeocystis bloom in a mesocosm experiment in relation to nutnents, irradiance and coexisting algae. Ophelia 42:55-74
Escaravage V, Prins TC, Smaal AC, Peeters JCH (1996) The response of phytoplankton communities to phosphorus input reduction in mesocosm experiments. J Exp Mar Biol Ec01 19855-79
Fenchel T (1988) Marine plankton food chains. Ann Rev Ecol Syst 19:19-38
Havskum H, Hansen AS (1997) Importance of pigmented and colourless nano-sized protists as grazers on nanoplankton in a phosphate-depleted Norwegian fjord and in enclo- sures. Aquat Microb Ecol 12:139-151
Havskum H, Riemann B (1996) Ecological importance of bac- terivorous, pigmented flagellates (mixotrophs) in the Bay of Aarhus, Denmark. Mar Ecol Prog Ser 137 251-263
Jsrgensen SE (1995) State of the art of ecological modelling in lirnnology. Ecol Model 78:lOl-115
Legendre L. Rassoulzadegan F (1995) Plankton and nutrient dynamics in marine waters. Ophelia 41:153-172
Nyholm N (1977) Kinetics of nitrogen-limlted algal growth. Water Quality Institute, Denmark, p 347-358
Riemann B, Havskum H, Thingstad F, Bernard C (1995) The role of rnixotrophy in pelagic environments. In: Joint I (ed) Molecular ecology of aquatic microbes. NATO AS1 Series G38. Springer-Verlag. Berlin/Heidelberg, p 87-1 14
Ruardij P, Baretta JW, Baretta-Bekker JG (1995) SESAME, Software Environment for Simulation and Analysis of Marine Ecosystems in general and for spatially resolved ecosystems in particular. Neth J Sea Res 33:261-270
Sanders RW (1991) Mixotrophic protists in marine and fresh- water ecosystems. J Protozool 38:76-81
Thingstad TF (1992) Modelling the microbial food web struc- ture in pelagic ecosystems. Arch Hydrobiol Beih 37: 111-119
Thingstad TF, Havskum H, Garde K, Riemann B (1996) On the strategy of 'eating your competitor' A mathematical analysis of algal mixotrophy. Ecology 77(7):39-49
Thingstad TF, Pengerud B (1985) Fate and effect of allochthonous organic material in aquatic microbial eco- systems. An analysis based on chernostat theory. Mar Ecol Prog Ser 21:47-62
Varela RA, Cruzado A, Gabaldon JE (1995) Primary produc- tion. Neth J Sea Res 33:33?-361
Zweifel UL, Blackburn N, Hagstrom A (1996) Cychng of marine dissolved organic matter. 1. An experimental sys- tem. Aquat Microb Ecol 11:65-77
Submitted: November 1 , 1996; Accepted: July 30, 1997 Proofs received from author(s). November 18, 1997