Missouri University of Science and Technology Missouri University of Science and Technology Scholars' Mine Scholars' Mine International Specialty Conference on Cold- Formed Steel Structures Wei-Wen Yu International Specialty Conference on Cold-Formed Steel Structures 2016 Nov 10th, 12:00 AM - 12:00 AM An Improved Two-Stage Seismic Analysis Procedure for Mid-Rise An Improved Two-Stage Seismic Analysis Procedure for Mid-Rise Buildings with Vertical Combination of Cold-Formed Steel and Buildings with Vertical Combination of Cold-Formed Steel and Concrete Framing Concrete Framing X. Yuan L. Xu Follow this and additional works at: https://scholarsmine.mst.edu/isccss Part of the Structural Engineering Commons Recommended Citation Recommended Citation Yuan, X. and Xu, L., "An Improved Two-Stage Seismic Analysis Procedure for Mid-Rise Buildings with Vertical Combination of Cold-Formed Steel and Concrete Framing" (2016). International Specialty Conference on Cold-Formed Steel Structures. 3. https://scholarsmine.mst.edu/isccss/23iccfss/session11/3 This Article - Conference proceedings is brought to you for free and open access by Scholars' Mine. It has been accepted for inclusion in International Specialty Conference on Cold-Formed Steel Structures by an authorized administrator of Scholars' Mine. This work is protected by U. S. Copyright Law. Unauthorized use including reproduction for redistribution requires the permission of the copyright holder. For more information, please contact [email protected].
Transcript
Missouri University of Science and Technology Missouri University of Science and Technology
Scholars' Mine Scholars' Mine
International Specialty Conference on Cold-Formed Steel Structures
Wei-Wen Yu International Specialty Conference on Cold-Formed Steel Structures 2016
Nov 10th, 12:00 AM - 12:00 AM
An Improved Two-Stage Seismic Analysis Procedure for Mid-Rise An Improved Two-Stage Seismic Analysis Procedure for Mid-Rise
Buildings with Vertical Combination of Cold-Formed Steel and Buildings with Vertical Combination of Cold-Formed Steel and
Concrete Framing Concrete Framing
X. Yuan
L. Xu
Follow this and additional works at: https://scholarsmine.mst.edu/isccss
Part of the Structural Engineering Commons
Recommended Citation Recommended Citation Yuan, X. and Xu, L., "An Improved Two-Stage Seismic Analysis Procedure for Mid-Rise Buildings with Vertical Combination of Cold-Formed Steel and Concrete Framing" (2016). International Specialty Conference on Cold-Formed Steel Structures. 3. https://scholarsmine.mst.edu/isccss/23iccfss/session11/3
This Article - Conference proceedings is brought to you for free and open access by Scholars' Mine. It has been accepted for inclusion in International Specialty Conference on Cold-Formed Steel Structures by an authorized administrator of Scholars' Mine. This work is protected by U. S. Copyright Law. Unauthorized use including reproduction for redistribution requires the permission of the copyright holder. For more information, please contact [email protected].
An Improved Two-stage Seismic Analysis Procedure for Mid-Rise Buildings with Vertical Combination of
Cold-Formed Steel and Concrete Framing
X. Yuan1 and L. Xu 2
University of Waterloo, Waterloo, ON, Canada, N2L 3G1
Abstract: Presented in this paper is an improved two-stage analysis procedure for evaluating the seismic load of the mid-rise buildings with vertical combination of cold-formed steel and concrete framing. By comparing the improved procedure to the one prescribed in ASCE 7, it is found the stiffness requirement of the two-stage analysis procedure stated in ASCE 7 may be over-relaxed, which may consequently result in the underestimation of the base shear of the upper structure in certain cases. Furthermore, the lateral load at the top storey of the upper structure evaluated by ASCE 7 two-stage analysis procedure may also be considerably underestimated. Therefore, an additional amount of lateral load is proposed to be applied to the top of the upper structure. The results of the improved and the existing ASCE 7 two-stage analysis procedures are compared to those of the elastic modal response spectrum analysis, respectively. Comparing to the one prescribed in ASCE 7, the proposed improved two-stage analysis procedure yields more accurate results.
1. Introduction Mid-rise buildings with vertical combination of cold-formed steel (CFS) and concrete framing adopt a structural system in which the upper structure uses a lightweight CFS frame while the lower one is a reinforced concrete (RC) framed
1 Research Assistant, Department of Civil and Environmental Engineering, University of Waterloo, Waterloo, ON Canada, N2L 3G1 2 Corresponding author: Professor, Department of Civil and Environmental Engineering, University of Waterloo, Waterloo, ON, Canada N2L 3G1; Email:<[email protected]>
Wei-Wen Yu International Specialty Conference on Cold-Formed Steel Structures Baltimore, Maryland, U.S.A, November 9 & 10, 2016
853
structure. Due to the presence of vertical irregularities on both mass and stiffness in such system, the traditional equivalent lateral force (ELF) procedure which is normally applied to “regular” structures in practice is no longer applicable (Xiong et.al, 2008). The ASCE 7 (ASCE, 2006; 2010) prescribed a simplified approach, i.e., the two-stage ELF procedure (two-stage analysis procedure), to approximate the seismic load of the combined framing systems if: (a) the stiffness of the lower structure is at least 10 times the stiffness of the upper structure, and (b) the period of the entire structure is not greater than 1.1 times the period of the upper structure considered as a separate structure fixed at the base. The two-stage analsyis procedure allows the lower and upper structures to be analyzed by the ELF procedure separately, and is adopted in current practice because of its simplicity (Allen et.al, 2013).
The two-stage analysis procedure has been introduced into building codes of United States for almost forty years (ATC, 1978). Nevertheless, its applicable requirement and seismic load distribution method have not been systematically evaluated. Traditionally, the two-stage analysis procedure is applied primarily to the building in which the storey number of the lower structure is one, two or three (Allen et.al, 2013), while for other cases it is rarely applied and its accuracy is questionable. In fact, recent research suggested that the two-stage analysis procedure prescribed in ASCE 7 (ASCE, 2006) may underestimate the seismic load of the upper CFS structure for certain cases (Xu et.al, 2015; Yuan & Xu, 2014). The research related to the evaluation and improvement of the two-stage analysis procedure prescribed in ASCE 7 is of great importance for engineering practice. Presented in this paper is an improved two-stage analysis procedure as well as the systematic evaluation on the procedure prescribed in ASCE 7 (ASCE, 2006; 2010). Two examples are presented to illustrate the possible errors related to the existing ASCE procedure and the efficiency of the proposed improved procedure.
2. Scope and assumption For a mid-rise building with an NL-storey lower RC and an NU-storey upper CFS structure, the idealized analytical model of such building is shown in Figure 1 (a) with the following assumptions: (1) the total number of storeys of the buildings is not greater than ten, i.e., (NL+NU)≤10, since only the mid-rise building is accounted for in this study; (2) the storey-mass and lateral storey-stiffness associated with the lower and upper structures, designated respectively by (mL and kL) and (mU and kU), are uniformly distributed; (3) storey-mass ratio rm and storey-stiffness ratio rk of the lower and upper structures are limited to 1≤rm≤3 and 1≤rk≤20, respectively (Xu et.al, 2015), where rm=mL/mU and rk=kL/kU; (4) single storey-periods of the practical lower and upper structures, denoted as TsingL and TsingU, are both limited to the range between 0.2TS and 1.1TS
854
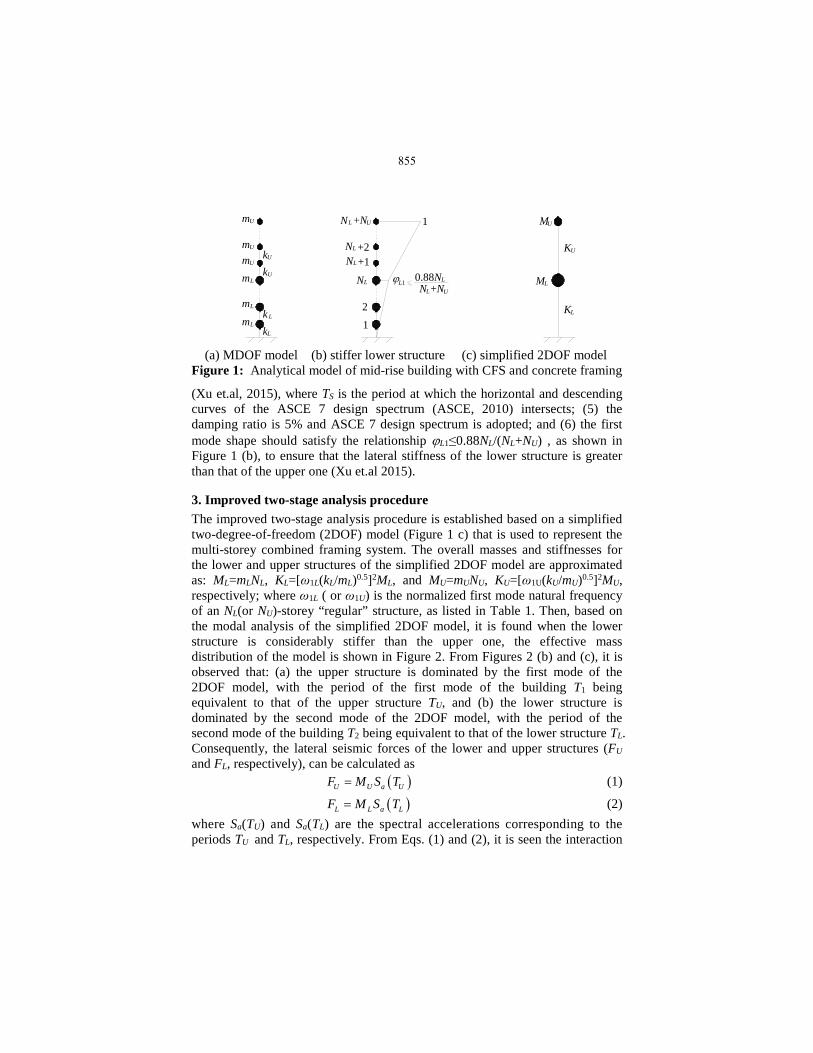
(a) MDOF model (b) stiffer lower structure (c) simplified 2DOF model
Figure 1: Analytical model of mid-rise building with CFS and concrete framing
(Xu et.al, 2015), where TS is the period at which the horizontal and descending curves of the ASCE 7 design spectrum (ASCE, 2010) intersects; (5) the damping ratio is 5% and ASCE 7 design spectrum is adopted; and (6) the first mode shape should satisfy the relationship ϕL1≤0.88NL/(NL+NU) , as shown in Figure 1 (b), to ensure that the lateral stiffness of the lower structure is greater than that of the upper one (Xu et.al 2015).
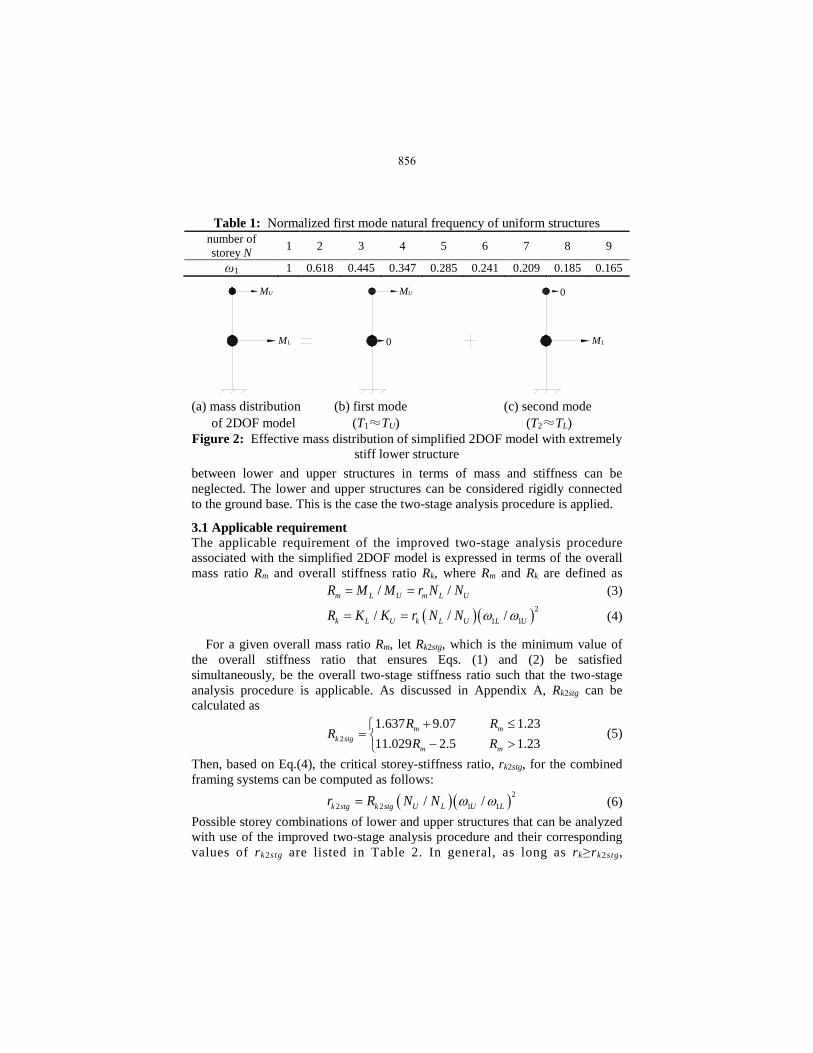
3. Improved two-stage analysis procedure The improved two-stage analysis procedure is established based on a simplified two-degree-of-freedom (2DOF) model (Figure 1 c) that is used to represent the multi-storey combined framing system. The overall masses and stiffnesses for the lower and upper structures of the simplified 2DOF model are approximated as: ML=mLNL, KL=[ω1L(kL/mL)0.5]2ML, and MU=mUNU, KU=[ω1U(kU/mU)0.5]2MU, respectively; where ω1L ( or ω1U) is the normalized first mode natural frequency of an NL(or NU)-storey “regular” structure, as listed in Table 1. Then, based on the modal analysis of the simplified 2DOF model, it is found when the lower structure is considerably stiffer than the upper one, the effective mass distribution of the model is shown in Figure 2. From Figures 2 (b) and (c), it is observed that: (a) the upper structure is dominated by the first mode of the 2DOF model, with the period of the first mode of the building T1 being equivalent to that of the upper structure TU, and (b) the lower structure is dominated by the second mode of the 2DOF model, with the period of the second mode of the building T2 being equivalent to that of the lower structure TL. Consequently, the lateral seismic forces of the lower and upper structures (FU and FL, respectively), can be calculated as ( )U U a UF M S T= (1)
( )L L a LF M S T= (2) where Sa(TU) and Sa(TL) are the spectral accelerations corresponding to the periods TU and TL, respectively. From Eqs. (1) and (2), it is seen the interaction
LmUmUm
Um
LkLk
UkUk
12
LN
+1+2
+NU 1
N +NL U
LN
Lm
Lm
L1ϕLNLN
LN
0.88LM
UM
LK
UK
855
Table 1: Normalized first mode natural frequency of uniform structures number of storey N 1 2 3 4 5 6 7 8 9
(a) mass distribution (b) first mode (c) second mode
of 2DOF model (T1≈TU) (T2≈TL) Figure 2: Effective mass distribution of simplified 2DOF model with extremely
stiff lower structure between lower and upper structures in terms of mass and stiffness can be neglected. The lower and upper structures can be considered rigidly connected to the ground base. This is the case the two-stage analysis procedure is applied.
3.1 Applicable requirement The applicable requirement of the improved two-stage analysis procedure associated with the simplified 2DOF model is expressed in terms of the overall mass ratio Rm and overall stiffness ratio Rk, where Rm and Rk are defined as / /m L U m L UR M M r N N= = (3)
( )( )21 1/ / /k L U k L U L UR K K r N N ω ω= = (4)
For a given overall mass ratio Rm, let Rk2stg, which is the minimum value of the overall stiffness ratio that ensures Eqs. (1) and (2) be satisfied simultaneously, be the overall two-stage stiffness ratio such that the two-stage analysis procedure is applicable. As discussed in Appendix A, Rk2stg can be calculated as
2
1.637 9.07 1.2311.029 2.5 1.23
m mk stg
m m
R RR
R R+ ≤
= − > (5)
Then, based on Eq.(4), the critical storey-stiffness ratio, rk2stg, for the combined framing systems can be computed as follows:
( )( )22 2 1 1/ /k stg k stg U L U Lr R N N ω ω= (6)
Possible storey combinations of lower and upper structures that can be analyzed with use of the improved two-stage analysis procedure and their corresponding values of rk2stg are listed in Table 2. In general, as long as rk≥rk2stg,
Note: N/A indicates the improved two-stage analysis procedure is not applicable.
the improved two-stage analysis procedure is applicable. From Table 2, it is seen the improved procedure is usually applicable to the mid-rise buildings in which the number of the storey of the lower structure is less than that of the upper one. For example, for the case where NL=1 and NU =9, the value of rk2stg is considerably small regardless of the magnitude of the storey-mass ratio rm. In fact, when the number of the storey of the lower structure is considerably less than that of the upper one, the lower structure can be treated as a “podium” to the upper one, and the upper structure usually behaves as it is rigidly connected to the ground base directly.
3.2 Seismic load distribution The lateral seismic forces at the ith-storey of the upper and lower structures,
857
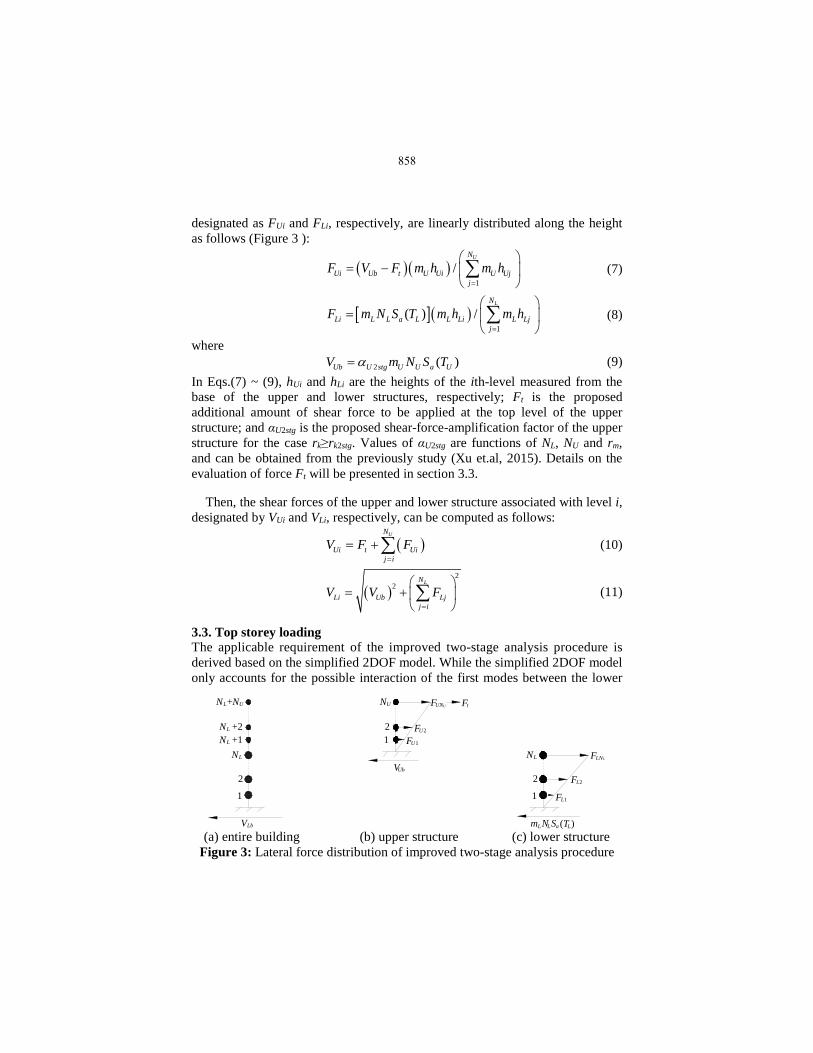
designated as FUi and FLi, respectively, are linearly distributed along the height as follows (Figure 3 ):
( )( )1
/UN
Ui Ub t U Ui U Ujj
F V F m h m h=
= −
∑ (7)
[ ]( )1
( ) /LN
Li L L a L L Li L Ljj
F m N S T m h m h=
=
∑ (8)
where 2 ( )Ub U stg U U a UV m N S Tα= (9) In Eqs.(7) ~ (9), hUi and hLi are the heights of the ith-level measured from the base of the upper and lower structures, respectively; Ft is the proposed additional amount of shear force to be applied at the top level of the upper structure; and αU2stg is the proposed shear-force-amplification factor of the upper structure for the case rk≥rk2stg. Values of αU2stg are functions of NL, NU and rm, and can be obtained from the previously study (Xu et.al, 2015). Details on the evaluation of force Ft will be presented in section 3.3.
Then, the shear forces of the upper and lower structure associated with level i, designated by VUi and VLi, respectively, can be computed as follows:
( )UN
Ui t Uij i
V F F=
= +∑ (10)
( )2
2 LN
Li Ub Ljj i
V V F=
= +
∑ (11)
3.3. Top storey loading The applicable requirement of the improved two-stage analysis procedure is derived based on the simplified 2DOF model. While the simplified 2DOF model only accounts for the possible interaction of the first modes between the lower
(a) entire building (b) upper structure (c) lower structure
Figure 3: Lateral force distribution of improved two-stage analysis procedure
1
LN
2
LN +1LN +2
LN + UN
12
UN
U1FU2F
UNF U
UbV
1
LN
2
L1F
L2F
LNF L
Lm LN aS (TL)
tF
LbV
858
and upper structures (first mode interaction), the interaction of other possible vibration modes between the lower and upper structures (higher vibration mode interaction), may not be ignored for the MDOF model shown in Figure 1 (a). In fact, the effect of the higher vibration mode interaction on the base shear force of the upper structure has been accounted for in the proposed two-stage amplification factor αU2stg shown in Eq. (9). Theoretically, the value of αU2stg should be unity. Nevertheless, to account for the effect of higher vibration mode interaction associated with the MDOF model, the previous study (Xu et.al, 2015) proposed to increase the magnitude of αU2stg rather than by setting it be unity. Furthermore, the amplification effect of such interaction on the shear force associated with the top storey of the upper structure is far more significant than that on the base shear force of the upper structure. Consequently, an additional shear force, Ft, as shown in Figure 3 (b), is proposed to be applied to the top storey and it is calculated as follows:
t UbF Vγ= (12) in which
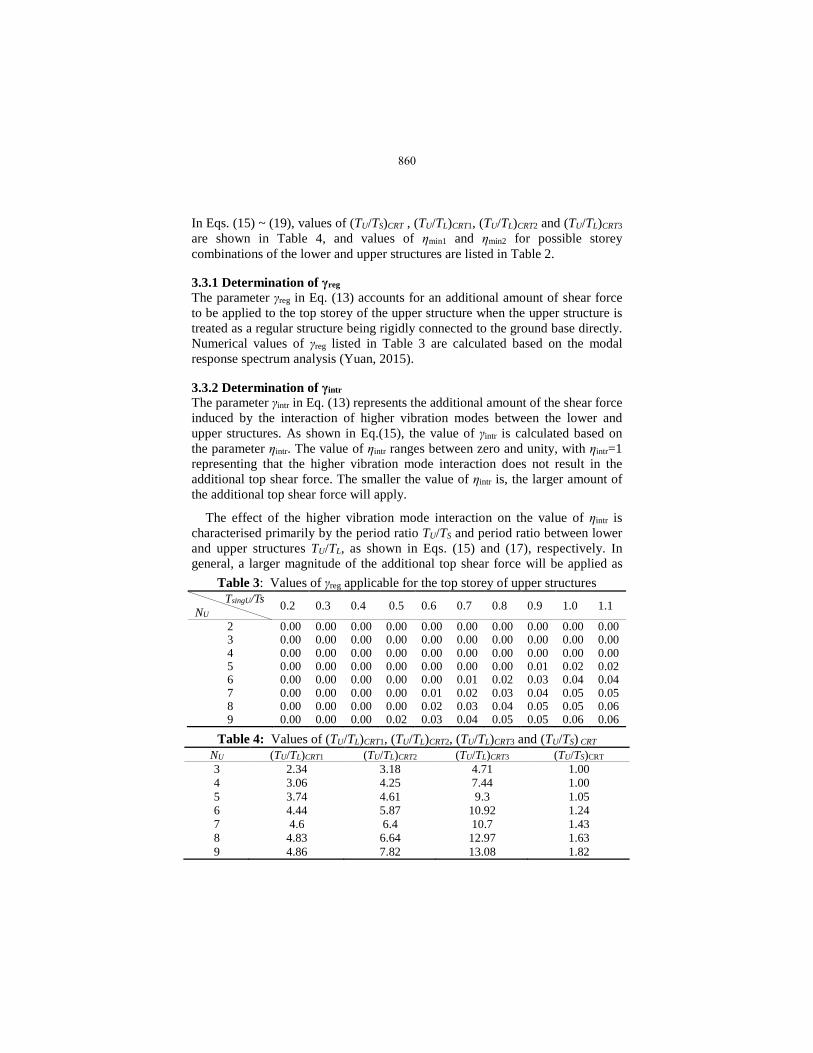
reg intrγ γ γ= + (13) where γ accounts for the additional portion of the base shear force associated with the upper structure to be applied to the top storey. Values of γreg for different number of stories of upper structures are listed in Table 3, and the corresponding values of γintr are calculated as follows:
intr intr1γ η= − (14) where
( )( ) ( ) ( )5
intr min
min
1 / /
/ / / / < / /
/ /
U S U S CRTx
U S U L U S U S U LCRT
U S U L
T T T T
T T T T T T T T T T
T T T T
η η
η
≤= < ≥
(15)
( ) ( ) ( )5 minln / ln / / /U L U S CRTx T T T Tη = (16)
( ) ( ) ( )( ) ( )
( ) ( ) ( ) ( )
6
7
min1 2 1
min 2 1 2min
min 2 2 2 3
/ / / / /
/ / /
/ / / / / /
1
x
U L k stg m U L U L CRT
U L U L U LCRT CRTx
U L U L U L U L U LCRT CRT CRT
T T R R T T T T
T T T T T T
T T T T T T T T T T
η
ηη
η
< ≤ ≤
= < <
( ) 3 / /U L U L CRT
T T T T
≥
(17)
( ) ( )6 min 2 min1 21ln / / ln / / /U L k stg mCRTx T T R Rη η = (18)
( ) ( ) ( )7 min 2 2 3ln / ln / / /U L U LCRT CRTx T T T Tη = (19)
859
In Eqs. (15) ~ (19), values of (TU/TS)CRT , (TU/TL)CRT1, (TU/TL)CRT2 and (TU/TL)CRT3 are shown in Table 4, and values of ηmin1 and ηmin2 for possible storey combinations of the lower and upper structures are listed in Table 2.
3.3.1 Determination of γreg The parameter γreg in Eq. (13) accounts for an additional amount of shear force to be applied to the top storey of the upper structure when the upper structure is treated as a regular structure being rigidly connected to the ground base directly. Numerical values of γreg listed in Table 3 are calculated based on the modal response spectrum analysis (Yuan, 2015).
3.3.2 Determination of γintr The parameter γintr in Eq. (13) represents the additional amount of the shear force induced by the interaction of higher vibration modes between the lower and upper structures. As shown in Eq.(15), the value of γintr is calculated based on the parameter ηintr. The value of ηintr ranges between zero and unity, with ηintr=1 representing that the higher vibration mode interaction does not result in the additional top shear force. The smaller the value of ηintr is, the larger amount of the additional top shear force will apply.
The effect of the higher vibration mode interaction on the value of ηintr is characterised primarily by the period ratio TU/TS and period ratio between lower and upper structures TU/TL, as shown in Eqs. (15) and (17), respectively. In general, a larger magnitude of the additional top shear force will be applied as
Table 3: Values of γreg applicable for the top storey of upper structures TsingU/Ts
the period elongates, i.e., the value of ηintr decreases as the period ratio TU/TS increases, as shown in Eq. (15). This is similar to that occurs in the “regular” buildings. In addition, the value of TU/TL determines which mode of the upper structure will be interacted with the first mode of the lower structure. For example, for the case where NL=2, NU=8 and rm=3, if TU/TL =4.83, the first mode period of the lower structure is close to the third mode period of the upper structure, and the interaction is primarily associated with first mode of the lower structure and the third mode of the upper structure. When the first mode of the lower structure interacts with different vibration modes of the upper structure, the resulted magnitude of the additional top shear force is different. Therefore, the force Ft is affected by the value of the period ratio TU/TL, as shown in Eq.(17) (Yuan, 2015).
3.4 Error analysis The shear forces for each storey of the upper and lower structures calculated from the proposed improved two-stage analysis procedure are compared to those from the elastic modal response spectrum analysis of the MDOF model (Chopra, 2007). For all possible storey combinations listed in Table 2, errors of the shear forces resulted from the improved procedure for the upper structure are in the range between -0.9% ~ 38.0%, with the positive and negative errors representing that the improved two-stage analysis procedure overestimates and underestimates the shear force, respectively. Such magnitude of errors associated with the improved procedure is comparable to that of the conventional ELF procedure (ASCE, 2010) for “regular” structures, which can be as large as 35% (Xu et.al, 2015). The improved procedure may overestimate the shear forces of the lower structure considerably in some cases. Such overestimation is induced by the neglect of the effect of the higher vibration mode interaction between the lower and upper structures on the lower structure (Yuan, 2015). However, compared to the two-stage analysis procedure prescribed in ASCE 7 (ASCE, 2006), which will be discussed in section 4.2, the results obtained from the proposed procedure is more accurate.
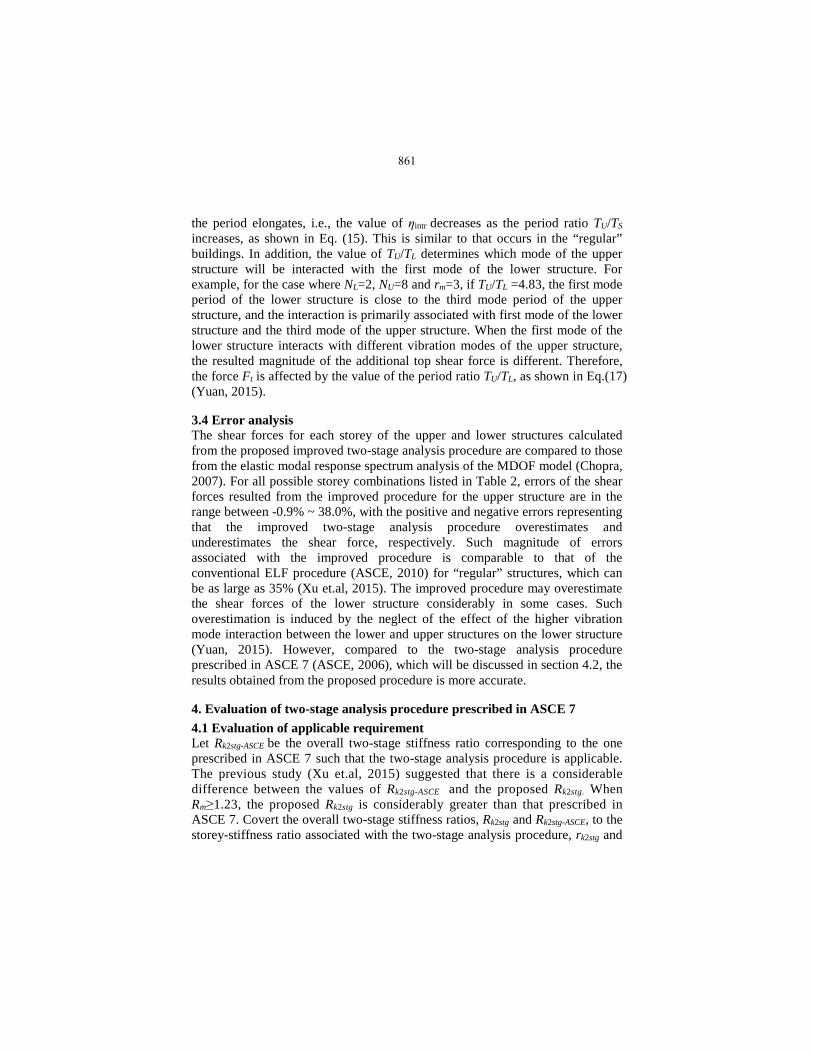
4. Evaluation of two-stage analysis procedure prescribed in ASCE 7 4.1 Evaluation of applicable requirement Let Rk2stg-ASCE be the overall two-stage stiffness ratio corresponding to the one prescribed in ASCE 7 such that the two-stage analysis procedure is applicable. The previous study (Xu et.al, 2015) suggested that there is a considerable difference between the values of Rk2stg-ASCE and the proposed Rk2stg. When Rm≥1.23, the proposed Rk2stg is considerably greater than that prescribed in ASCE 7. Covert the overall two-stage stiffness ratios, Rk2stg and Rk2stg-ASCE, to the storey-stiffness ratio associated with the two-stage analysis procedure, rk2stg and
rk2stg-ASCE, respectively. The comparison of rk2stg-ASCE and rk2stg is show in Table 5. From the table it can be seen for the possible storey combinations of the lower and upper structures that may result in the overall mass ratio Rm >1.23, considerable difference exists between the values of rk2stg-ASCE and rk2stg, such as the case where NL=4, NU=3 and rm=3. Nevertheless, for the traditional “podium” building, in which the number of storey of the lower structure is considerably less than that of the upper one, there is not much difference between values of rk2stg-ASCE and rk2stg, such as the case where NL=1 and NU=9.
4.2 Evaluation of seismic load distribution 4.2.1 Base shear forces of lower and upper structures As prescribed in ASCE 7 (ASCE, 2006; 2010), the peak base shear forces of the lower structure associated with the first and second modes are combined by the absolute sum (ABSSUM) rule as follows: ( ) ( )7Lb ASCE U a U L a LV M S T M S T− = + (20) However, the improved procedure adopts the SRSS (square-root-of-sum-of-square) rule to combine the modal responses, as shown in Eq. (11). Compared to the ABSSUM rule, the SRSS rule can yield to a more accurate result, which will be demonstrated in section 5.1. In fact, as discussed in section 3.4, by means of Eq. (11), the proposed procedure may overestimate the seismic load of the lower structure considerably in some cases. The two-stage procedure prescribed in ASCE-7, may significantly overestimate the base shear force of the lower structure due to the adoption of the ABSSUM rule (Yuan, 2015).
On the other hand, as it will be demonstrated in section 5.2, previous research (Xu et.al, 2015) suggested that the two-stage analysis procedure prescribed in
862
ASCE 7 may underestimate the base shear force of the upper structure due to the underestimation of the storey-stiffness ratio associated with the two-stage analysis procedure.
4.2.2 Seismic load distribution The two-stage analysis procedure prescribed in ASCE-7 may underestimate the seismic load of the top storey of the upper structure since no additional top shear force is applied to account for the higher vibration mode interaction between the lower and upper structures. In addition, due to the overly conservative estimation for the base shear force of the lower structure as discussed in section 4.2.1, shear forces for other stories of the lower structure may also be significantly overestimated by the procedure as discussed in section 5.1.
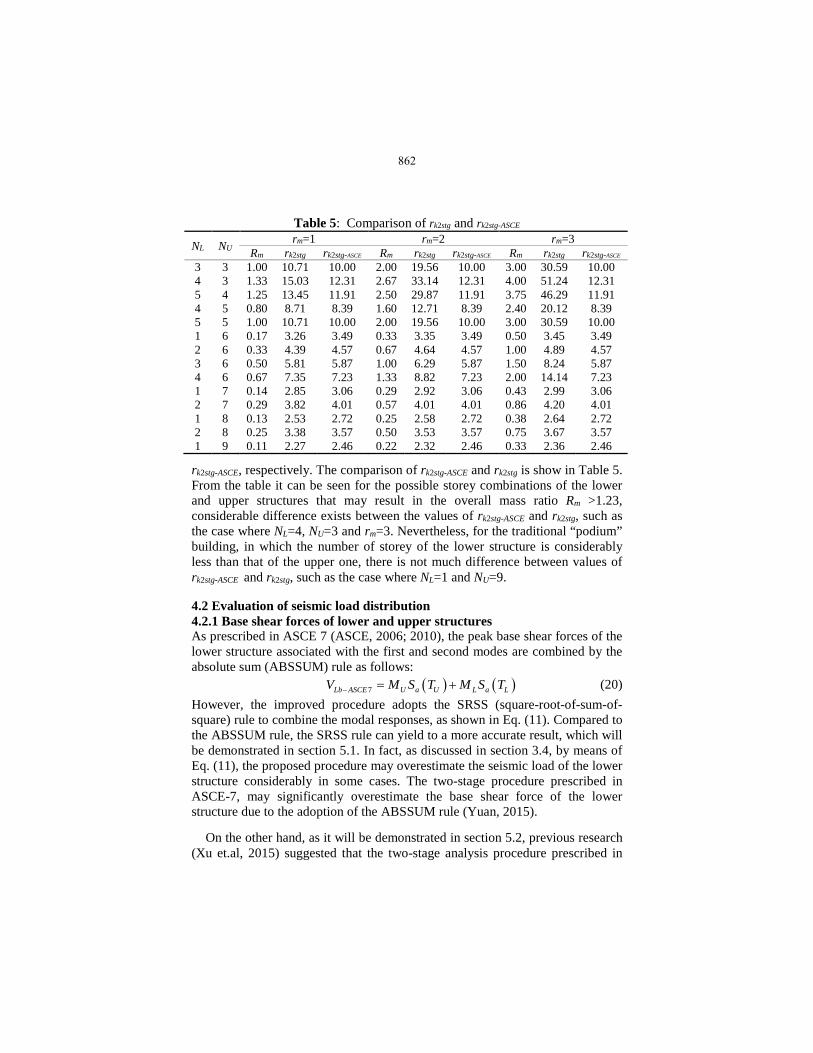
5. Examples 5.1 Example 1 Shown in Figure 4 is the floor plan of the lower structure of an eight-storey combined framing systems. The two-storey lower structure is constructed with the special RC moment frame while the six-storey upper structure is to be built with CFS framing. The storey-heights of the lower and upper structure are 10.8ft (3.3m) and 10 ft (3.06m), respectively. The specified dead loads associated with the upper and lower structures are taken as 0.416 psi (2.87kPa) and 0.949psi (6.55 kPa), respectively. Therefore, the effective seismic weights of each storey for the upper and lower structures are mU=2.16×10⁵lb (96,113kg) and mL=4.92×10⁵ lb (219,352kg), respectively, which result in rm=mL/mU=4.92/2.16=2.28.
Assume the elastic modulus of the concrete is 4.351×10⁶ psi (3×10⁷ kPa). The column size of the RC concrete frame is 23.6 in×23.6 in (600mm×600mm). All the columns in Figure 4 are connected to beams with moment connections. The lateral storey-stiffness of the lower structures is then calculated as kL=5.93×10⁴
kip/ft (8.66×10⁵ kN/m). The upper structure adopts a total length of 141.70 ft (43.2 m) CFS shear walls, which are sheathed with the double-sided 11mm OSB panel and of which the screw spacing is 4/12 in (100/300mm). The initial stiffness of the CFS shear wall can be approximated as 80.117 kip/ft per feet (3836 kN/m per meter) (Branston, 2004). Therefore, the storey-stiffness of the upper structure is kU=1.14×10⁴
kip/ft (1.66×10⁵ kN/m). The storey-stiffness ratio rk=kL/kU=5.93/1.14=5.20.
The building is located in Washington D.C and the soil condition for the building is assumed as Class B, with the building risk category being II. From Table 5, it is seen rk2stg=4.71 and rk2stg_ASCE=4.57. As rk>rk2stg and rk>rk2stg_ASCE, both the proposed improved and the code-specified two-stage analysis
863
Figure 4: Floor plan of lower RC structure
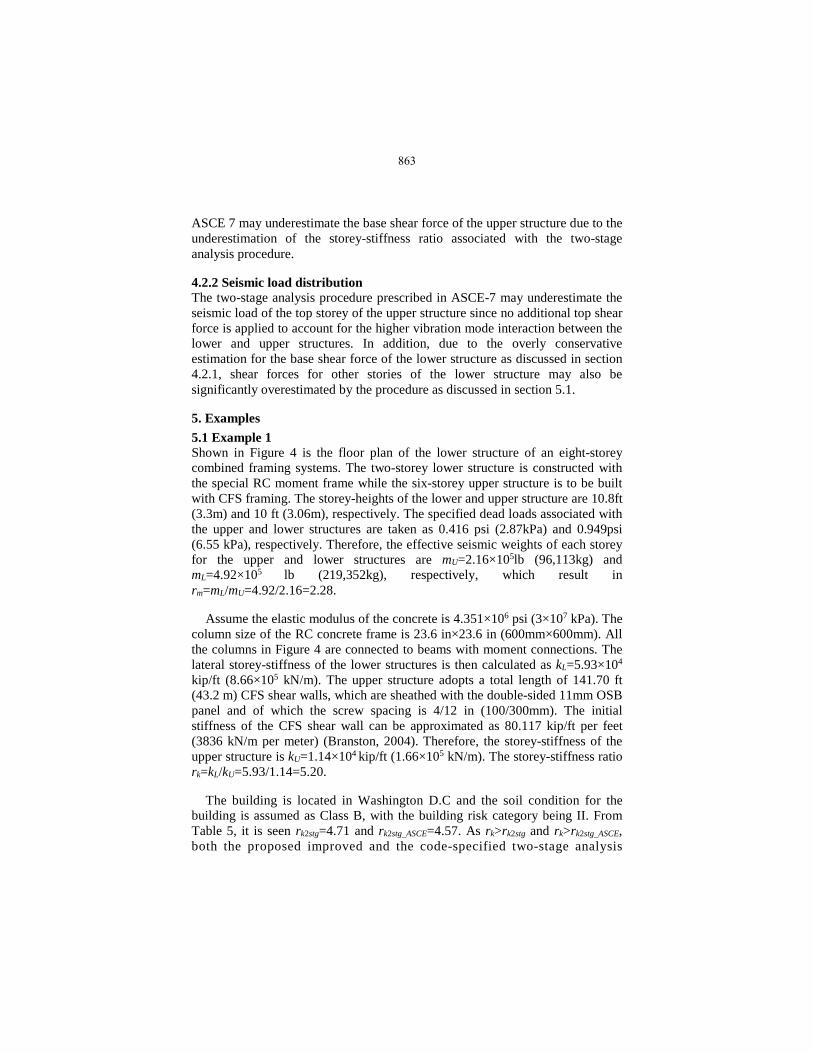
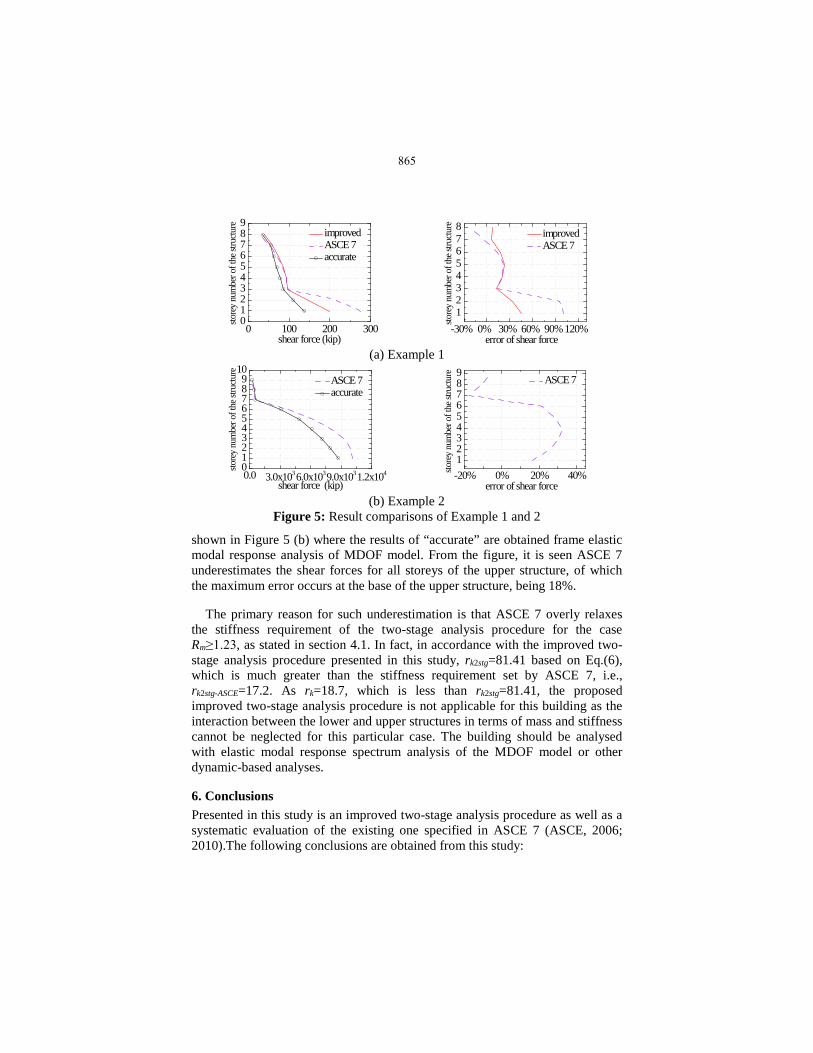
procedures can be applied. The shear forces for each storey of the combined framing system calculated by the both procedures are shown in Figure 5 (a). From the figure, it is seen the shear force of the upper structure evaluated by the improve procedure is a good approximation to the accurate one which is obtained from elastic modal response spectrum analysis of the MDOF model. However, the two-stage analysis procedure prescribed in ASCE 7 underestimates the shear force of the top storey by almost 20%. The main reason for such underestimation is that the procedure prescribed in ASCE 7 does not account for the amplification effect associated with the higher vibration mode interaction between the lower and upper structures. Based on the improved procedure, the additional amount shear force to be applied to the top storey Ft is about 18% of the base shear force of the upper structure obtained from elastic modal response spectrum analysis of the MDOF model. Without applying such a large magnitude of the additional top shear force, the procedure prescribed in ASCE 7 underestimates the top storey shear force considerably. In addition, since the ASCE 7 procedure adopts the ABSSUM rule to combine the peak modal responses, compared to results of the elastic modal response spectrum analysis of the MDOF model, the ASCE 7 overly estimated the shear forces for the first and second storeys of the lower structure by 100.2% and 95.1%, respectively, as shown in Figure 5 (a).
5.2 Example 2 The building in this example is the same as that of Example 1, except that this is a nine-storey building. The lateral load resisting system of the lower six-storey structure is the special RC moment frame whereas that of the upper three-storey is the CFS shear wall. The total length of CFS shear wall is 39.4 ft (12.0 m), which results in kU=3.17×10³
kip/ft (4.60×10⁴ kN/m) and rk= 5.93/0.317=18.7.
Assume the building is located in Log Angels, California. It is calculated that the critical storey-stiffness ratio prescribed in ASCE 7 is rk2stg-ASCE=17.2. As rk>17.2, ASCE 7 permits the two-stage analysis procedure to be applied to evaluate the seismic load of the building, and the corresponding results are
20 ft 20 ft
20 ft
20 ft
20 ft
20 ft
864
0 100 200 3000123456789
-30% 0% 30% 60% 90%120%12345678
store
y nu
mbe
r of t
he st
ructu
re
shear force (kip)
improved ASCE 7 accurate
store
y nu
mbe
r of t
he st
ructu
re
error of shear force
improved ASCE 7
(a) Example 1
0.0 3.0x1036.0x1039.0x1031.2x1040123456789
10
-20% 0% 20% 40%123456789
store
y nu
mbe
r of t
he st
ructu
re
ASCE 7
store
y nu
mbe
r of t
he st
ructu
re
shear force (kip)
ASCE 7 accurate
error of shear force (b) Example 2
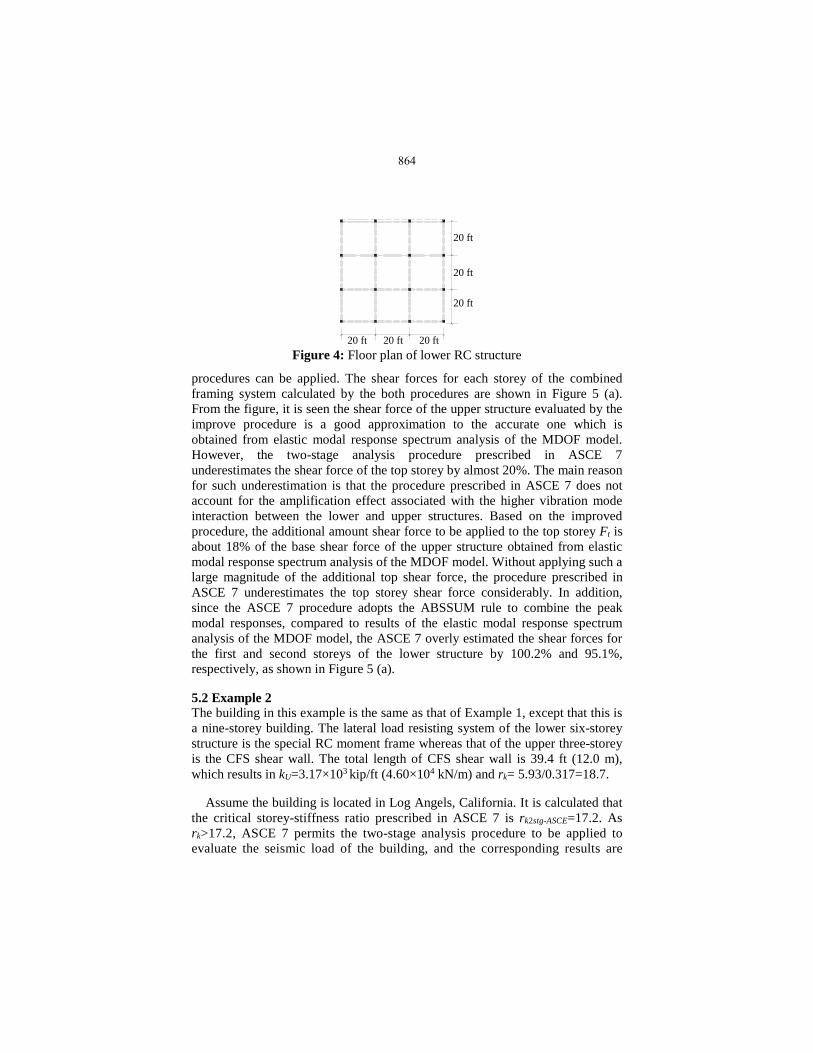
Figure 5: Result comparisons of Example 1 and 2
shown in Figure 5 (b) where the results of “accurate” are obtained frame elastic modal response analysis of MDOF model. From the figure, it is seen ASCE 7 underestimates the shear forces for all storeys of the upper structure, of which the maximum error occurs at the base of the upper structure, being 18%.
The primary reason for such underestimation is that ASCE 7 overly relaxes the stiffness requirement of the two-stage analysis procedure for the case Rm≥1.23, as stated in section 4.1. In fact, in accordance with the improved two-stage analysis procedure presented in this study, rk2stg=81.41 based on Eq.(6), which is much greater than the stiffness requirement set by ASCE 7, i.e., rk2stg-ASCE=17.2. As rk=18.7, which is less than rk2stg=81.41, the proposed improved two-stage analysis procedure is not applicable for this building as the interaction between the lower and upper structures in terms of mass and stiffness cannot be neglected for this particular case. The building should be analysed with elastic modal response spectrum analysis of the MDOF model or other dynamic-based analyses.
6. Conclusions Presented in this study is an improved two-stage analysis procedure as well as a systematic evaluation of the existing one specified in ASCE 7 (ASCE, 2006; 2010).The following conclusions are obtained from this study:
865
(1) For buildings that the applicable requirement of the proposed improved two-stage analysis procedure is satisfied, an additional top shear force should be applied to the top of upper structure to account for the higher vibration mode interaction between the lower and upper structures. Equations to compute the additional top shear force are provided.
(2) Since the stiffness requirement of the code-specified two-stage analysis procedure may be overly-relaxed, ASCE 7 may underestimate the base shear force of the upper structure.
(3) Compared to the two-stage analysis procedure prescribed in ASCE 7 (ASCE, 2006; 2010), the proposed improved two-stage analysis procedure yields more accurate results.
References Allen, M., Chung, N., Tran, A., & Zepeda, D. (2013). Two stage analysis:
implementation challenges. Structures Congress 2013, (pp. 2192-2202). Pittsburgh.
American Society of Civil Engineers (ASCE). (2006). Minimum design loads for buildings and other structures. Reston,Virginia: ASCE.
American Society of Civil Engineers (ASCE). (2010). Minimum design loads for buildings and other structures. Reston,Virginia: ASCE.
Applied Technology Council (ATC). (1978). Tentative provisions for the development of seismic regulartions for buildings. Washington, D.C: ATC.
Branston, A. E. (2004). Development of a design methodology for steel/wood panel shear walls. Thesis, McGill University, Montreal,QC.
Chopra, A. K. (2007). Dynamics of structures:theory and applications to earthquake engineering (3rd ed.). Upper Saddle River, New Jersey: Prentice Hall.
Xiong, H. B., & Jia, G. C. (2008). Research on sesimic behavior of wood-concrete hybrid structure. Proceedings of the 10th World Conference on Timber Engineering. Miyazaki, Japan.
Xiong, H. B., Ni, C., Lv, X. L., & Jia, G. C. (2008). Shake table tests on 3-storey wood hybrid structures. Proceedings of the 10th World Conference on Timber Engineering. Miyazaki, Japan.
Xu, L., & Yuan, X. (2015). A simplified seismic design approach for mid-rise buildings with vertical combination of framing systems. Engineering Structures, 99, 568-581.
Yuan, X. (2015). Simplified seismic design for mid-rise buildings with vertical combination of framing systems. Doctor Dissertation, University of Waterloo, Department of Civil and Environmental Engineering, Waterloo, ON, Canada.
Yuan, X., & Xu, L. (2014). Simplified seismic design for mid-rise buildings with vertical combinaiton of cold-formed steel and concrete framing. Twenty-
866
second international speciality conference on cold-formed steel structures, (pp. 617-631). St. Louis, Missouri.
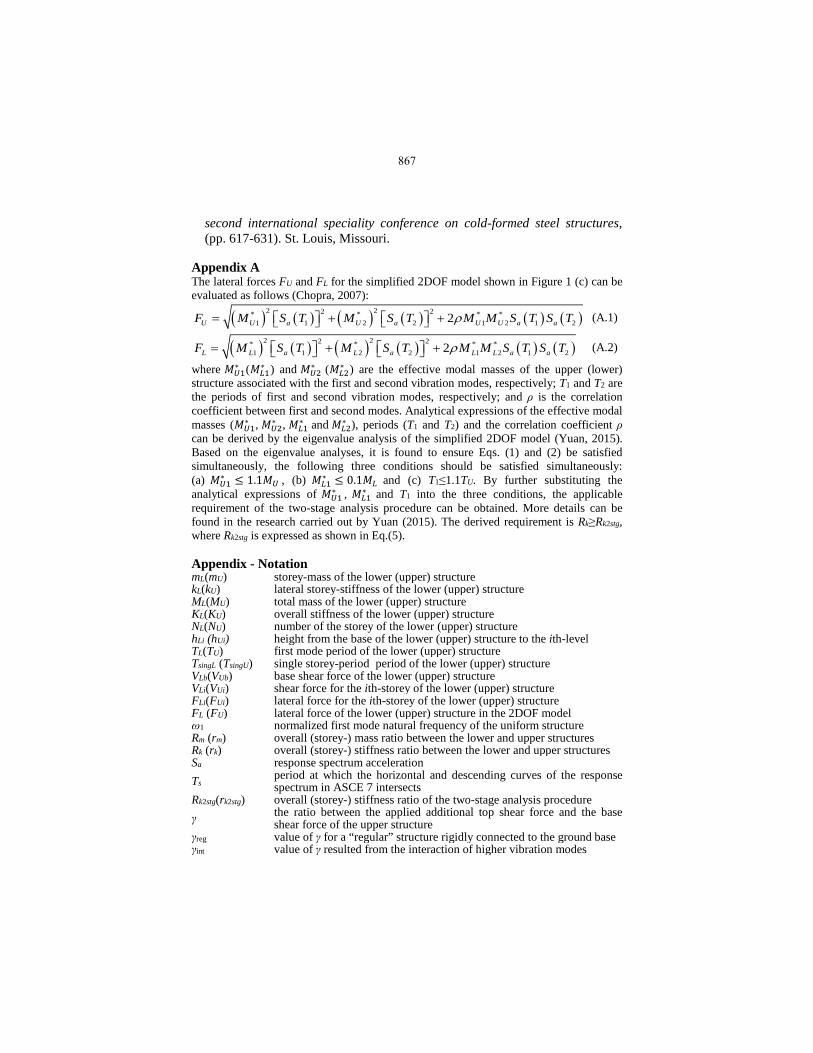
Appendix A The lateral forces FU and FL for the simplified 2DOF model shown in Figure 1 (c) can be evaluated as follows (Chopra, 2007):
( ) ( ) ( ) ( ) ( ) ( )2 22 2* * * *1 1 2 2 1 2 1 22U U a U a U U a aF M S T M S T M M S T S Tρ= + + (A.1)
( ) ( ) ( ) ( ) ( ) ( )2 22 2* * * *1 1 2 2 1 2 1 22L L a L a L L a aF M S T M S T M M S T S Tρ= + + (A.2)
where 𝑀𝑀𝑈𝑈1∗ (𝑀𝑀𝐿𝐿1
∗ ) and 𝑀𝑀𝑈𝑈2∗ (𝑀𝑀𝐿𝐿2
∗ ) are the effective modal masses of the upper (lower) structure associated with the first and second vibration modes, respectively; T1 and T2 are the periods of first and second vibration modes, respectively; and ρ is the correlation coefficient between first and second modes. Analytical expressions of the effective modal masses (𝑀𝑀𝑈𝑈1
∗ , 𝑀𝑀𝑈𝑈2∗ , 𝑀𝑀𝐿𝐿1
∗ and 𝑀𝑀𝐿𝐿2∗ ), periods (T1 and T2) and the correlation coefficient ρ
can be derived by the eigenvalue analysis of the simplified 2DOF model (Yuan, 2015). Based on the eigenvalue analyses, it is found to ensure Eqs. (1) and (2) be satisfied simultaneously, the following three conditions should be satisfied simultaneously: (a) 𝑀𝑀𝑈𝑈1
∗ ≤ 1.1𝑀𝑀𝑈𝑈 , (b) 𝑀𝑀𝐿𝐿1∗ ≤ 0.1𝑀𝑀𝐿𝐿 and (c) T1≤1.1TU. By further substituting the
analytical expressions of 𝑀𝑀𝑈𝑈1∗ , 𝑀𝑀𝐿𝐿1
∗ and T1 into the three conditions, the applicable requirement of the two-stage analysis procedure can be obtained. More details can be found in the research carried out by Yuan (2015). The derived requirement is Rk≥Rk2stg, where Rk2stg is expressed as shown in Eq.(5).
Appendix - Notation mL(mU) storey-mass of the lower (upper) structure kL(kU) lateral storey-stiffness of the lower (upper) structure ML(MU) total mass of the lower (upper) structure KL(KU) overall stiffness of the lower (upper) structure NL(NU) number of the storey of the lower (upper) structure hLi (hUi) height from the base of the lower (upper) structure to the ith-level TL(TU) first mode period of the lower (upper) structure TsingL (TsingU) single storey-period period of the lower (upper) structure VLb(VUb) base shear force of the lower (upper) structure VLi(VUi) shear force for the ith-storey of the lower (upper) structure FLi(FUi) lateral force for the ith-storey of the lower (upper) structure FL (FU) lateral force of the lower (upper) structure in the 2DOF model ω1 normalized first mode natural frequency of the uniform structure Rm (rm) overall (storey-) mass ratio between the lower and upper structures Rk (rk) overall (storey-) stiffness ratio between the lower and upper structures Sa response spectrum acceleration Ts period at which the horizontal and descending curves of the response
spectrum in ASCE 7 intersects Rk2stg(rk2stg) overall (storey-) stiffness ratio of the two-stage analysis procedure γ the ratio between the applied additional top shear force and the base
shear force of the upper structure γreg value of γ for a “regular” structure rigidly connected to the ground base γint value of γ resulted from the interaction of higher vibration modes