An Improved Version of the CO 2 Line-mixing Database and Software: Update and Extension ANNE L. LARAIA , JULIEN LAMOUROUX, ROBERT R. GAMACHE University of Massachusetts School of Marine Sciences, Department of Environmental, Earth, and Atmospheric Sciences, One University Avenue, University of Massachusetts Lowell, Lowell, MA 01854-5045, USA HA TRAN, JEAN-MICHEL HARTMANN Université Paris 12, Lab. Interuniversitaire des Systèmes Atmosphériques, Créteil, FRANCE LAWRENCE S. ROTHMAN, IOULI E. GORDON Harvard-Smithsonian Center for Astrophysics, Atomic and Molecular Physics Division, Cambridge MA, USA. Joint meeting of the 11 th HITRAN Database Conference and 10 th ASA conference June 16-18, 2010
Transcript
An Improved Version of the CO2 Line-mixing Database and Software: Update and Extension
ANNE L. LARAIA, JULIEN LAMOUROUX, ROBERT R. GAMACHEUniversity of Massachusetts School of Marine Sciences, Department of Environmental, Earth, and Atmospheric Sciences, One University Avenue, University of Massachusetts
Lowell, Lowell, MA 01854-5045, USA
HA TRAN, JEAN-MICHEL HARTMANNUniversité Paris 12, Lab. Interuniversitaire des Systèmes Atmosphériques, Créteil,
FRANCE
LAWRENCE S. ROTHMAN, IOULI E. GORDONHarvard-Smithsonian Center for Astrophysics, Atomic and Molecular Physics Division,
Cambridge MA, USA.
Joint meeting of the 11th HITRAN Database Conference and 10th ASA conference June 16-18, 2010
The importance line-mixing for CO2
From Hartmann et al. (2009). Residuals obtained from fits of ground-based atmospheric solar-absorption spectra in the region from 4765 to 4915 cm−1 for various airmasses.
Previous work
• In a previous study, Niro et al. (2005) presented a database and software package which provided for the calculation of the absorption coefficients of CO2 that included the effects of line-mixing.
• J.-M. Hartmann et al. (2009) concluded that the CO2 database and software of Niro et al. needed to be updated and improved. The present work provides this update.
The present work was driven by the need for a line-mixing database consistent with the CO2 database on HITRAN. The new database being presented goes hand-in-hand with HITRAN2008.
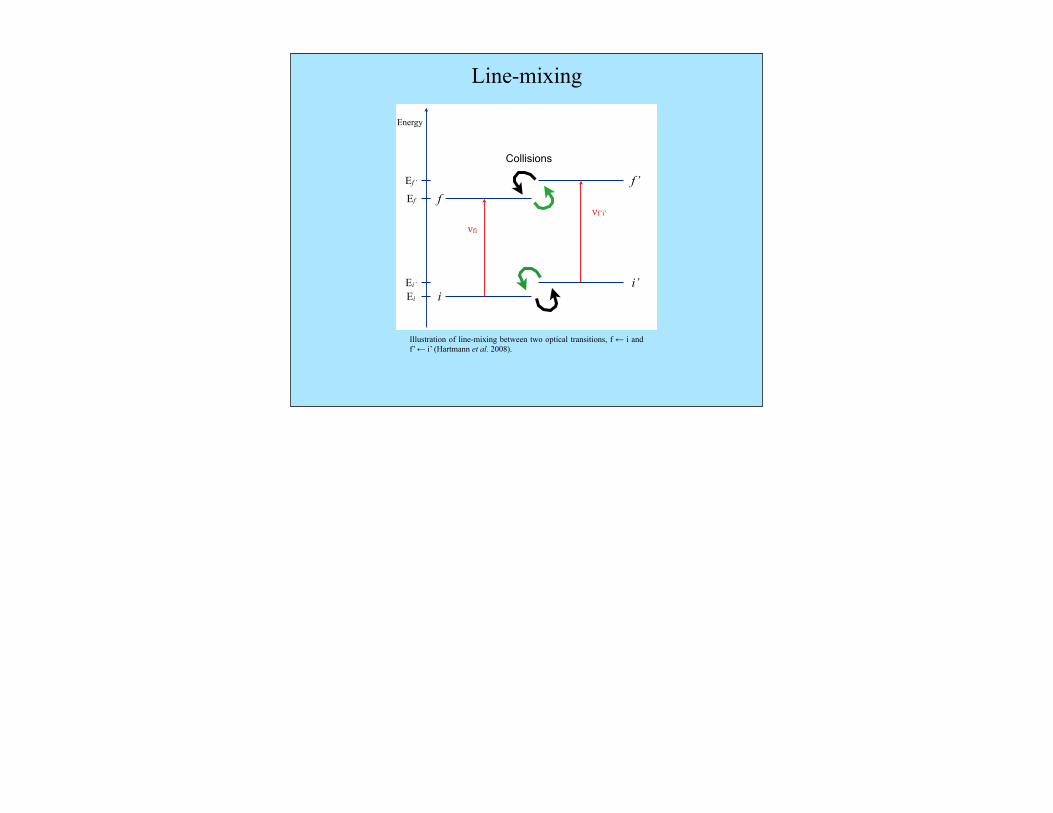
Line-mixing
Illustration of line-mixing between two optical transitions, f ← i and f’ ← i’ (Hartmann et al. 2008).
i
f
i’
f’
Energy
EiEi’
Ef
Ef’
Collisions
!fi
!f’i’Optical
Transitions
The previous database
Spectroscopic files – data files for each bandBandinfo – statistical information for each bandSoftware – computes the absorption coefficients
The off-diagonal elements of the relaxation matrices, W(T), are computed, and from the W’s the line-mixing coefficients, Yk, are calculated. The Y’s are then used to calculate absorption coefficients.
• Took HITRAN2008, CDSD-296 and CDSD-1000 and separated into files by isotopologue and by vibrational band.
• Checked for Jmax ≥ 70 in HITRAN, if not then checked for the missing transitions in CDSD-296, and in CDSD-1000 (if not in CDSD-296).
• For bands where the Jmax ≥ 70 condition could not be met with the inclusion of the 3 databases, line-mixing effects were not included in the calculation of absorption coefficients. Note that these bands are weak bands and are for minor isotopologues.
• For each band with Jmax ≥ 70, the same procedure from the previous model is used to calculate absorption coefficients.
Procedure for the construction of the new database
The new line-mixing databasePrevious version (Niro et al., 2005) Updated version (Lamouroux et al., 2010)
HITRAN 2000 (Rothman et al., 2003)HITRAN 2008 (Rothman et al., 2009)
CDSD-296 (Tashkun et al., 2003)CDSD-1000 (Tashkun et al., 2008)
• Database files (like above) and a file with information on each band• Software to process these files (i.e. calculate absorption coefficients via W
and Yk)
File name: S10001100001.dat
Comparison between measured and calculated CO2 absorption coefficients in the 3ν3 band. The black line is measured values, red and blue are calculated values from the new version of the database and software taking line mixing into account and neglecting line-mixing, respectively. (Lamouroux et al., 2010)
⎯ Measurement⎯ Calc no LM
⎯ Calc with LM
72.3 atm
29.2 atm
Comparison with measured laboratory spectra
CO2-N2
Absorption coefficients and measured-calculated residuals for 1% CO2 in seven pressures (from 19 to 76.0 atm) of N2 at 295.15 K in the region of the (2ν1 + ν3) triad. The top panel displays the measured absorptions normalized to unity area through integration over σ. The middle and lower panels display the residuals (meas-calc) obtained from calculations with our new database, respectively, neglecting line-mixing and taking this process into account (Lamouroux et al., 2010).
3.3.1. ‘‘Obvious’’ bandsFrom previous studies [23,24] and examination of the
spectra, two collision induced absorption features havebeen unambiguously identified, centered near 3010 and4680 cm!1. The first, recorded with pure CO2 for measuredpressures between 10 and 43atm is displayed in Fig. 3showing (Fig. 3b) that absorption is, as expected for a pureCIA process, proportional to the squared CO2 density. Thesecond CIA feature, which we measured for CO2+N2
mixtures, is a double transition near 4680cm!1. Forthese two CIA bands, the integrated intensities and peakabsorption values are given in Table 2 where they can be(successfully) compared with previous determinations.
3.3.2. ‘‘Hidden’’ bands?The question of (weak) CIA ‘‘hidden’’ below the
(strong) allowed dipole bands, as observed in the O2
A-band region [25] is still open at this step. Indeed, asexemplified by Fig. 2, the integrated intensities obtainedfrom the measurements in the allowed bands showremarkably linear behaviors vs the CO2 density indicatingthat CIA contributions are small. In order to go further, wehave carefully examined the upper bound value for this
process. We thus write, as in Ref. [25]
AMeas"PCO2,PTot,sMin,sMax
PeqCO2
# $ S0"sMin,sMax#%PeqTotS
CIA"sMin,sMax#,
"1#
where SCIA (in cm!2/atm2) is the (eventual) densitynormalized integrated intensity due to CIA in the con-sidered region, S0 (cf. Section 3.2) being the valueassociated with the allowed dipole. From the scatter ofvalues of the first term in Eq. (1) obtained from ourmeasurements, upper limits for SCIA have been deter-mined, which are reported in Table 2. In order to evaluatethe consequences for atmospheric spectra, one must knowthe peak absorption. Assuming that all CIA bands have thesame shape, the measured values in Table 2 show that themaximum absorption (in cm!1/atm2) is about 1% of theintegrated intensity (in cm!2/atm2). Hence, for all regionsin Table 2, the density normalized CIA peak absorption islower than a few 10!6 cm!1/atm2. Assuming that the peakabsorption (in cm!1/amagat!2) is independent on tem-perature, the overall atmospheric absorbance has beencalculated for a standard atmosphere. The value obtainedis lower than a few 10!4 for an air mass of 1. Hence, evenfor large airmasses, CIA would make a contribution toatmospheric spectra below a fraction of a percent.
ARTICLE IN PRESS
-0.04
-0.02
0.00
0.02
0.04
Obs
-LM
! (cm-1)
-0.6
-0.3
0.0
0.3
Obs
-Lor
entz
48000.0
0.5
1.0
1.5
2.0
Nor
mal
ized
Abs
(10-2
cm
-1)
4900 5000 5100
4800 4900 5000 5100
4800 4900 5000 5100
Fig. 6. Absorption coefficients and meas-calc residuals for 1% CO2 in seven pressures (from 19 to 76.0 atm) of N2 at 295.15K in the region of the (2n1+n3)triad. The top panel displays the measured absorptions normalized to unity area through integration over s. The middle and lower panels display theresiduals (meas-calc) obtained from calculations with our new database, respectively, neglecting line-mixing and taking this process into account.
Please cite this article as: Lamouroux J, et al. Updated database plus software for line-mixing in CO2 infrared spectra andtheir test using laboratory spectra in the 1.5–2.3mm region. JQSRT (2010), doi:10.1016/j.jqsrt.2010.03.006
J. Lamouroux et al. / Journal of Quantitative Spectroscopy & Radiative Transfer ] (]]]]) ]]]–]]] 7
Conclusions
• The new line-mixing database includes the best available data for CO2 line-mixing calculations.
• It includes many more lines than the previous Niro et al. 2005 database.
• More parameters are included such H2O-broadening parameters of CO2.
• The new database is consistent with HITRAN2008.• The calculated absorption coefficients agree very well with
measurement. • Important for GOSAT, OCO-2, ACE-FTS, and any other high-
precision remote sensing measurements.
Future research
• Software is being tested on atmospheric spectra simulations.
• Procedure for creating future CO2 line-mixing database has been somewhat automated so that updates corresponding to future HITRAN editions can be easily done.
• Go from the empirically determined values of half-width and line shift used in this work to experimental/calculated values.
Acknowledgements
J. Lamouroux, A. L. Laraia, and R. R. Gamache are pleased to acknowledge support of this research by the National Science Foundation through Grant no. ATM-0803135. Any opinions, findings, and conclusions or recommendations expressed in this material are those of the author(s) and do not necessarily reflect the views of the National Science Foundation.
The authors from LISA acknowledge support by the TOSCA program of the Centre National d’Etudes Spatiales.


![thesis.ceri.go.jpthesis.ceri.go.jp/center/doc/geppou/jiban/00054040501.pdf(Behavair of peat ground improved by deep mixing method with low improvement ratio)] 29 . Coffee Break & Lunch](https://static.documents.pub/doc/80x56/5abb03837f8b9a441d8c5377/behavair-of-peat-ground-improved-by-deep-mixing-method-with-low-improvement-ratio.jpg)


