16
An Increasingly Urban World – Needs and Opportunities for Partnerships? Dr. Walter Dabberdt Vaisala Chief Science Officer President, American Meteorological Society AMS-PPP: April 22, 2008
| Date post: | 14-Dec-2015 |
| Category: |
Documents |
| Upload: | camille-hobbins |
| View: | 213 times |
| Download: | 0 times |

An Increasingly Urban World – Needs and Opportunities for Partnerships?
Dr. Walter Dabberdt
Vaisala Chief Science Officer
President, American Meteorological Society
AMS-PPP: April 22, 2008
©Vaisala | 04-22-2008 | Dabberdt- AMS PPP Forum | Page 2
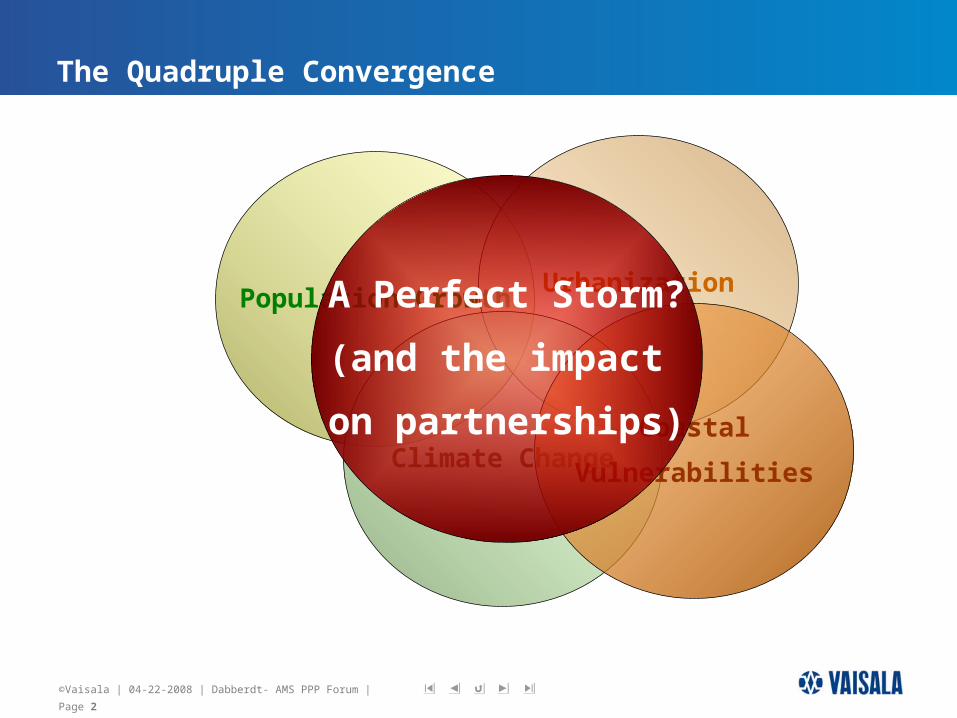
The Quadruple Convergence
Population GrowthUrbanization
Climate ChangeCoastal
Vulnerabilities
A Perfect Storm?
(and the impact
on partnerships)

©Vaisala | 04-22-2008 | Dabberdt- AMS PPP Forum | Page 3
Ten(10) Largest Cities in 1000A.D. (M-Inhabitants)
Cordova Spain 0.450
Kaifeng China 0.400
Constantinople Turkey 0.300
Angkor Cambodia 0.200
Kyoto Japan 0.175
Cairo Egypt 0.135
Baghdad Iraq 0.125 (1.25???)
Nishapur Iran 0.125
Al-Hasa Saudi Arabia 0.110
Patan India 0.100
Source: Tertius Chandler: “4,000 Years of Urban Growth” (1987)
Sum - CY1000 (i=1,10) =
2.12M

©Vaisala | 04-22-2008 | Dabberdt- AMS PPP Forum | Page 4
Growth of Mega-Cities
City-1975 Population
TokyoNew YorkShanghaiMexico CitySao Paulo
19.815.911.411.210.0
City-2000 Population
TokyoMexico CityMumbaiSao PauloShanghaiNew YorkLagosLos AngelesKolkataBuenos AiresDhakaKarachiDelhiJakartaOsakaMetro ManilaBeijingRio de JaneiroCairo
26.418.118.117.817.016.613.413.112.912.612.311.811.711.011.010.910.810.610.6
City-2015 PopulationTokyoMumbaiLagosDhakaSao PauloKarachiMexico CityShanghaiNew YorkJakartaKolkataDelhiMetro ManilaLos AngelesBuenos AiresCairoIstanbulBeijingRio de JaneiroOsakaTianjinHyderabadBangkok
26.426.123.221.120.419.219.219.117.417.317.316.814.814.114.113.812.512.311.911.010.710.510.1
68.3 (5)
266.7 (19)
379.3 (23)Source: UN Population Division, March 2000
blue = coastal city (18)
green = inland city (5)
Sum – CY2000 (i=1,10) = 166.0M
Sum – CY2015 (i=1,10) = 209.4M

©Vaisala | 04-22-2008 | Dabberdt- AMS PPP Forum | Page 5
The March of Urbanization in the World (% global population)
Year World MDR LDR
1950 29.8 54.9 17.8
1975 37.9 70.0 26.8
2000 47.2 75.4 40.4
2030 60.2 82.6 56.4
MDR = more developed regions
LDR = less developed regions source: UNPD, 2001
Today, 50% of the world’s population live
in the cities and 1.3 million people move to the cities every week!

©Vaisala | 04-22-2008 | Dabberdt- AMS PPP Forum | Page 6
Squatter Cities
Kibera (Nairobi)
One billion now live in squatter cities (1/6 of global population)
Two billion more expected

©Vaisala | 04-22-2008 | Dabberdt- AMS PPP Forum | Page 8
City-Atmosphere Interactions
atmosphere impacts the city
city impacts the
atmosphere

©Vaisala | 04-22-2008 | Dabberdt- AMS PPP Forum | Page 9
Tornado – Ft. Worth, TX (March 28, 2000)
Source: North Central Texas Council of Governmentssimulation
March 28, 2000
Path Length: Approximately 3 miles Path Width: 1/4 mileF-Scale: F1 (73-112mph) to F2 (113-157mph)

©Vaisala | 04-22-2008 | Dabberdt- AMS PPP Forum | Page 10
France -- Heat Wave (August 13-28, 2003 )
Source: Zaitchik et al., 2006
Vegetation index anomaly Surface temperature anomaly
Solid lines demarcate conventional climate zones.
• 15,000 excess deaths in France
• 30,000 excess deaths in N. Europe
• Most in the cities
MODIS Imagery

©Vaisala | 04-22-2008 | Dabberdt- AMS PPP Forum | Page 11
Hurricane Katrina (2005) – Coastal Vulnerability
Courtesy of James
Franklin, NHC

©Vaisala | 04-22-2008 | Dabberdt- AMS PPP Forum | Page 12
Beijing -- Mega-City Smog

©Vaisala | 04-22-2008 | Dabberdt- AMS PPP Forum | Page 13
Coastal Vulnerabilities
High-impact coastal zone
• 53% U.S. population lives in coastal zone
• 10 of 15 largest U.S. cities are coastal
• Visitors swell coastal populations
Global Low-Level Coastal Zone:
• ≤ 10m msl
• 10% world population
• 6% world urban population
• 200M live ≤ 1m msl

©Vaisala | 04-22-2008 | Dabberdt- AMS PPP Forum | Page 14
Climate Change Impacts & the CitiesIPCC (FAR, 2007)
Phenomena and TrendsPost-1960 Likelihood that Trend Occurred
21st-Century Likelihood that Trend Will Occur
Warmer & less frequent cold days & nights over most land areas
Very likely
(90-99% probability)
Virtually certain
(>99% probability)
Warmer & more frequent hot days & nights over most land areas
Very likely Virtually certain
Warm spells/heat waves: frequency increases over most land areas
Likely
(66-90% probability)
Very likely
Heavy precipitation events: Frequency (or % of total from heavy rainfalls) increases over most areas
Likely Very likely
Area affected by droughts increases Likely in many regions since 1970
Likely
Intense tropical cyclone activity increases
Likely in some regions since 1970
Likely
Increased incidence of extreme high sea level (excludes tsunamis)
Likely Likely

©Vaisala | 04-22-2008 | Dabberdt- AMS PPP Forum | Page 16
Scale-Dependence of Weather Information Needs
• Analysis/description of current atmospheric state
• Nowcasting/very short-range forecasting (0+ to ~2 hrs)
• Short-range mesoscale prediction (~3 to 48 hrs)
Site of interest
Are
a (r
el.)
analysis
mesoscale prediction
nowcasting
Schematic
illustrationSchematic
illustration
Time (rel.)
As the timescale of the prediction decreases -- toward analysis and short- term nowcasting – the observing and forecasting requirements become more application-specific
As the timescale of the prediction decreases -- toward analysis and short- term nowcasting – the observing and forecasting requirements become more application-specific

©Vaisala | 04-22-2008 | Dabberdt- AMS PPP Forum | Page 17
Urban Needs for Environmental Information
Urban dwellers have different weather information needs than their rural counterparts, due to the diversity of user groups and population sectors, which include:• the general public• air quality management agencies• water supply and sewage providers• electric power industry• fuel suppliers – natural gas, fuel oil, coal, gasoline• transportation sectors – aviation, marine, and surface• emergency response agencies• public safety agencies• insurance companies and underwriters• health care providers• recreation facility providers.
The disparate groups of urban users
and their weather information needs
are a driving force for stronger
partnerships among the public,
private and academic sectors


