60
Cerillion plc Annual Report and Accounts 2016 An innovator in billing, charging and customer management software

Cerillion plc 125 Shaftesbury Avenue London WC2H 8AD United Kingdom
Tel: +44 20 7927 6000 Fax: +44 20 7927 6006
Email: [email protected] Web: www.cerillion.com
Cerillion plcAnnual Report and Accounts 2016
An innovator in billing, charging and customer management software

Cerillion plc Annual Report and Accounts 2016
Company Information
Company registration number: 09472870
Registered office: 125 Shaftesbury Avenue
London
WC2H 8AD
Directors: O C R Gilchrist
L T Hall
G J O’Connor
A M Howarth
M Dee
Secretary: O C R Gilchrist
Bankers: HSBC Jersey
HSBC House
St Helier
Jersey
JE1 1HS
Solicitors: Orrick, Herrington & Sutcliffe (Europe) LLP
107 Cheapside
London
EC2V 6DN
Nominated Adviser: Shore Capital and Corporate Limited
Bond Street House
14 Clifford Street
London
W1S 4JU
Auditor: Grant Thornton UK LLP
Registered Auditor
Chartered Accountants
Grant Thornton House
Melton Street
Euston Square
London
NW1 2EP

Cerillion plc Annual Report and Accounts 2016 | 1
Contents
Overview 2
Highlights 3
Chairman and Chief Executive Officer’s report 4
Strategic report 8
Corporate governance report 12
Board of Directors 14
Report of the Remuneration Committee 15
Report of the Audit Committee 17
Directors’ report 18
Independent auditor's report 20
Principal accounting policies 22
Consolidated statement of comprehensive income 31
Consolidated statement of financial position 32
Company statement of financial position 33
Consolidated statement of cash flows 34
Company statement of cash flows 35
Consolidated statement of changes in equity 36
Company statement of changes in equity 37
Notes to the financial statements 38

2 | Cerillion plc Annual Report and Accounts 2016
Overview
About CerillionCerillion is a leading provider of mission critical software for billing, charging and CRM, with a 17 year track record in providing
comprehensive revenue and customer management solutions. The Company has 79 customer installations across 42 countries,
principally serving the telecommunications market but also utilities and financial services.
Led by a highly experienced management team, the Company is headquartered in London and also has operations in Pune, India,
where its Global Solutions Centre is located. Cerillion’s CEO, Louis Hall, led the management buyout from Logica plc in 1999.
Cerillion plcCerillion plc acquired Cerillion Technologies Limited on 18 March 2016 in conjunction with the completion of its IPO on AIM. The table
below shows the highlights for Cerillion plc, reflecting trading from 18 March 2016 to 30 September 2016. Prior to 18 March 2016,
Cerillion plc had no trading activity. In addition, the full year trading highlights for Cerillion Technologies Limited, Cerillion (India) pvt and
Cerillion Inc (CTL Group) are detailed to give a clearer picture of the year-on-year trading activity of the underlying Group.
Cerillion plc CTL Group 2016 2015 2016 2015 Audited Audited Unaudited Unaudited £’000 £’000 £’000 £’000
Revenue 8,365 - 14,810 14,016
Key revenue streams6:
Services 5,359 - 8,688 8,585
Software & Software-as-a-Service 2,615 - 5,315 4,394
Recurring revenue 2,196 - 4,059 3,816
New orders 6,478 - 10,797 11,116
Back order book 9,285 - 9,285 10,992
Profit/(loss) before tax 239 (581) 2,083 2,144
Adjusted profit before tax7 1,603 - 2,284 2,191
Employee numbers:
Onshore 81 - 79 81
India 79 - 78 76
Total 160 - 157 157

Cerillion plc Annual Report and Accounts 2016 | 3
Highlights
Cerillion plc, the billing, charging and customer relationship management software solutions provider, presents its maiden annual results
for the 12 months ended 30 September 20161.
Financial:• Encouraging results – in line with management expectations
• Annualised revenue up by 6% to £14.8m (2015: £14.0m)
– software revenue2 up by 21% to £5.3m
– services revenue up by 1% to £8.7m
• Annualised recurring revenue3 up by 6% to £4.1m – c. 27% of total revenue
• Back order book4 stood at £9.3m (2015: £11.0m)
• Annualised EBITDA up by 7% to £3.1m (2015: £2.9m)
• Annualised adjusted profit before tax up by 4% to £2.3m (2015: £2.2m)
• Adjusted earnings per share of 6.8p5
• Proposed final dividend of 2.6p per share, bringing the total dividend for the year to 3.9p per share (2015: nil)
Operational:• Successful admission to trading on AIM on 18 March 2016 and acquisition of Cerillion Technologies Limited
• Continued progress in core enterprise software business:
– a further three customers went live with the real-time Convergent Charging System (“CCC”)
– a further five new customers were signed for Skyline, Cerillion’s new cloud billing solution
• Senior Vice President Asia Pacific appointed in Australia in August
• Board continues to view prospects very positively
Louis Hall, CEO of Cerillion, commented:“I am pleased to present our maiden full year results following the Company’s successful admission to AIM in March 2016. Cerillion
made pleasing progress over the period, delivering encouraging profit growth, in line with management expectations. We secured
significant new orders in the period and a further three customers went live with our new Convergent Charging System, which continues
to drive our pipeline. We also made encouraging progress with our new Software-as-a-Service billing product, Skyline, which is opening
up new markets to us. On 28 November, we are pleased to announce a $2.8m follow-on contract with an existing customer in the
Americas. This represents the second phase of a $4.1m licence expansion and services contract, the first $1.3m of which relates to
services and was closed prior to year-end. Looking ahead, the Board continues to view prospects very positively.”
NotesNote 1 Cerillion plc acquired Cerillion Technologies Limited on 18 March 2016 in conjunction with the completion of its IPO on AIM. Prior to 18 March
2016, Cerillion plc had no trading activity. Consequently, save for the dividend, earnings per share and net assets information, the results reported in these highlights and in the Chairman and Chief Executive Officer’s Report are based on the unaudited CTL Group proforma consolidated figures which include Cerillion Technologies Limited and its subsidiaries (Cerillion (India) pvt and Cerillion Inc).
Note 2 Revenue derived from software licence, support and maintenance, SaaS and managed services sales.
Note 3 Recurring revenue includes annualised support and maintenance, managed service and Skyline revenue.
Note 4 Back order book consists of £5.2m of sales contracted but not yet recognised at the end of the reporting period plus £4.1m of annualised support and maintenance revenue. It is anticipated that 75% of the £5.2m of sales contracted but not yet recognised as at the end of the reporting period will be recognised within the next 4 to 5 quarters.
Note 5 Based on earnings for Cerillion Technologies Limited for the reporting period and the total number of Cerillion plc shares in issue as at 30 September 2016.
Note 6 Full analysis of the revenue streams for Cerillion plc can be found in the segmental reporting disclosure note 3.
Note 7 Adjusted profit before tax is calculated after adding back IPO costs, unrealised fair value movement on forward exchange contracts and amortisation of acquired intangible assets.

4 | Cerillion plc Annual Report and Accounts 2016
Chairman and Chief Executive Officer’s report
IntroductionCerillion plc was admitted to trading on AIM on 18 March 2016, towards the end of the first half of its financial year, and we are now very
pleased to report the Group’s first full year’s results as a publicly quoted company.
The CTL Group business is well established, with a 17 year track record of providing mission critical software for billing, charging and
customer relationship management (“CRM”) predominantly to the telecommunications market but also to the utilities and financial
services sectors. Our decision to join AIM and acquire Cerillion Technologies Limited was taken with the intention of using this platform
to support the next phase of the Group’s growth.
As we have previously reported, we intend to continue to drive our growth in our core telecoms market, where demand for billing and
charging solutions is growing, driven by technological and regulatory change. We are also seeking to develop in new market sectors,
supported by our new Software-as-a-Service (“SaaS”) billing product, Cerillion Skyline, which facilitates billing and the collection of
payments from any type of subscription or usage-based service.
We are pleased to report that Cerillion has continued to make good progress over the second half of its financial year and that results are in
line with market expectations. Revenue has increased year-on-year by 6% to £14.8m and adjusted profit before tax is up by 4% to £2.3m.
These encouraging results have been supported by good demand from our established customer base and include a major, multi-site
project implementation in the Americas. In addition, we won a significant contract for our core enterprise billing, charging and CRM
solution with a new telecommunications customer, in the EMEA region, after a global tender process.
Financial OverviewCTL Group proforma consolidated results are included on page 7. The following commentary is based on these results as they are
considered to provide a clearer picture of year-on-year trading activity of the underlying Group. Total CTL Group revenue for the year to
30 September 2016 rose by 6% to £14.8m (2015: £14.0m). Our existing customer base typically drives a very high proportion of total
annual income and established customers (those acquired at least 12 months before the beginning of the reporting period) generated
93% of total revenue in the year (2015: 73%). Our major implementation in the Americas, commissioned by an existing customer, is a
major component of revenues in this reporting period.
A significant proportion of the Group’s revenues continues to be underpinned by recurring income, which is derived from support and
maintenance and managed service contracts. Recurring revenues accounted for 27% of the Group’s income (2015: 27%), having risen
by 6% year-on-year to £4.1m (2015: £3.8m).
Our income streams are broadly divided into three segments: software revenue (which principally comprises software licence sales
and support and maintenance sales); services revenue, which is generated by software implementations and other services work, and
revenues from other activities, mainly the reselling of third party products.
• Software revenue rose by 21% to £5.3m (2015: £4.4m), helped by strong licence sales, and accounted for 36% of total revenues (2015: 31%).
• Services revenue rose slightly to £8.7m (2015: £8.6m) and continues to constitute the largest element of total revenue at 59% (2015: 61%).
• Third party income decreased to £0.8m (2015: £1.0m) and comprised 5% of total revenue (2015: 7%).
Administrative expenses increased slightly to £7.7m (2015: £7.5m) and included personnel costs at £4.5m (2015: £4.4m).
Adjusted operating profit increased by 4% to £2.3m (2015: £2.2m) mainly driven by the increase in total revenue. The charge for
amortisation of R&D costs was £0.5m (2015: £0.4m). The increase was due to additional investment in our convergent charging
platform, a new module which went into service with three additional customers during the period. Expenditure on fixed assets was
£0.3m (2015: £0.3m).
Adjusted profit before tax rose by 4% to £2.28m (2015: £2.19m) and adjusted earnings per share was 6.8p5.

Cerillion plc Annual Report and Accounts 2016 | 5
Cash Flow and Banking Net cash as at 30 September 2016 stood at £0.4m, with total Group cash at £5.0m and total debt at £4.6m (2015: nil), reflecting the
£5m term loan taken up by Cerillion plc in conjunction with the AIM IPO and repayments made over the period.
DividendIn line with the Company‘s dividend policy of paying out between a third to half of the Group’s free cash flow each year, subject to the
Group’s performance, the Board is pleased to propose a maiden final dividend of 2.6p per share. Together with the interim dividend of
1.3p per share, this brings the total dividend for the year to 3.9p per share.
The dividend will become payable on 6 February 2017 to those shareholders on the Company’s register as at the close of business on
the record date of 6 January 2017. The ex-dividend date is 5 January 2016.
Operational OverviewWe continued to make good progress with our core solution, the Group’s pre-integrated Enterprise BSS/OSS suite, which now includes
our new, real-time, Convergent Charging System (“CCS”). Across our product suite, we secured new orders totalling £10.8m over
the year (2015: £11.1m) and all of these new projects are now under way. These new orders will help to build visibility of work as we
progress through the new financial year and beyond.
Typically, because our implementation projects are governed by long term and high value contracts, the business enjoys a high level
of revenue visibility through both its back order book and its annualised support revenue. At the year end, the combined value of
annualised support revenue and the back order book - which consists of unperformed, contracted work under purchase orders and
contracted work that is still subject to the receipt of purchase order - stood at £9.3m (2015: £11.0m).
We completed a number of customer installation projects over the year. These included a new 4G/LTE launch for rapidly developing
telecoms service provider SWAN, a.s.. SWAN, a.s. is using our solution, including CCS, to underpin its new services, which are sold
through the Slovakian Post Office’s 1,600 plus branch offices. Our system is supporting SWAN’s online and offline charging and the
project’s successful completion represents a further important proof point for our new CCS architecture. In another important proof
point, CCS was also rolled out across all of Manx Telecom plc’s prepaid and postpaid, mobile, fixed and data services.
CCS continues to be a key driver for new sales as it enables communications service providers (CSPs) to converge prepaid and
postpaid charging and billing on the same software platform. This provides significant cost savings and performance-related benefits
to customers, as well as the flexibility to support multiple service types, such as fixed, mobile, data and IPTV. CCS can be deployed
in many ways too, including as a standalone charging engine, as a replacement for legacy prepaid systems, or as an integral part of
Cerillion’s core end-to-end billing and CRM solution.
Four customers are now live on the CCS platform while a fifth customer is in implementation and we expect that CCS will to continue
to be important in enabling us to capture new wins in prepaid mobile and “quad-play” (the term used to describe combined broadband
internet access, television, telephone and mobile services in the same product bundle) convergent billing.
We also completed a new 4G/LTE launch in the US, using a full managed service delivery model, and completed the implementation of
a replacement billing system for a European TETRA operator, supporting a national emergency services network.

6 | Cerillion plc Annual Report and Accounts 2016
We have won five new customers for Cerillion Skyline, our completely new cloud billing solution. Skyline can bill and collect recurring
revenue for any type of service and so is helping us break into new industry verticals. It offers customers significant business benefits,
including: faster time to implement compared with a traditional solution; lower cost with a ‘pay-as-you-grow’ model; no infrastructure
requirement; secure data storage and the ability to support customers’ B2B and B2C service offerings. The new customers we have
signed include a digital marketing company, an online services business and two publishers. In October, we appointed a Head of Cloud
and SaaS to help drive increased market traction for our Skyline solution now that the product’s market testing is fully completed.
We made good progress in our targeted global expansion plans during the period. Having opened an office in Miami during the first
half of the year, we are now in the process of building our team at that location. We also made significant progress in expanding our
presence in Asia Pacific and in August appointed a Senior Vice President Asia Pacific for this region.
We continue to invest across our solutions, making further improvements to Cerillion Skyline, CCS and our other modules. In addition to
this, in FY2017 we will bring a new Enterprise Product Catalogue module to the market.
On 17 October 2016 we were delighted to be designated in the “Visionaries” quadrant of Gartner’s newly published report, “Magic
Quadrant for Integrated Revenue and Customer Management (“IRCM”) for CSPs”. Cerillion has moved from Niche Players designation
in 2015 and this is the third consecutive year that Cerillion has been included in this annual review of IRCM vendors. Gartner’s Magic
Quadrant report evaluates vendors across a broad range of criteria including product strategy, sales & marketing strategies, innovation
and client references, and companies are positioned according to “completeness of vision” and “ability to execute”. Gartner evaluated
both Cerillion Enterprise and Cerillion Skyline, and we believe our new designation reflects the Company’s growing stature and
reputation as a leading IRCM vendor8.
OutlookWe continue to remain very positive about prospects for the Group and our sales team is pursuing a strong pipeline of prospects. On
28 November, we are delighted to report that Cerillion has signed a major follow-on contract worth $2.8m with an existing customer in
the Americas. This represents the second phase of a $4.1m licence expansion and services contract, the first $1.3m of which relates to
services and was closed prior to year-end.
Chairman and Chief Executive Officer’s reportContinued
NotesNote 8 Gartner does not endorse any vendor, product or service depicted in its research publications, and does not advise
technology users to select only those vendors with the highest ratings or other designation. Gartner research publications
consist of the opinions of Gartner’s research organization and should not be construed as statements of fact. Gartner disclaims
all warranties, expressed or implied, with respect to this research, including any warranties of merchantability or fitness for a
particular purpose.
The Gartner Report(s) described herein, (the “Gartner Report(s)”) represent(s) research opinion or viewpoints published, as
part of a syndicated subscription service, by Gartner, Inc. (“Gartner”), and are not representations of fact. Each Gartner Report
speaks as of its original publication date (and not as of the date of these Accounts) and the opinions expressed in the Gartner
Report(s) are subject to change without notice.

Cerillion plc Annual Report and Accounts 2016 | 7
CTL Group Proforma Consolidated Income Statement - for the year ended 30 September 2016
Year to Year to 30 September 2016 30 September 2015 Unaudited Unaudited £ £
Revenue 14,809,939 14,016,095
Cost of sales (4,018,614) (3,635,959)
Gross profit 10,791,325 10,380,136
Administrative expenses (7,719,324) (7,501,942)
EBITDA 3,072,001 2,878,194
Depreciation and amortisation (871,805) (737,858)
Operating profit 2,200,196 2,140,336
Finance costs (123,320) (1,496)
Finance income 5,862 5,070
Profit before taxation 2,082,738 2,143,910
Taxation (74,343) (87,900)
Profit for the year 2,008,395 2,056,010
Year to Year to 30 September 2016 30 September 2015 Unaudited Unaudited £ £
Profit before taxation 2,082,738 2,143,910
Add back:
Amortisation of acquired intangibles 80,004 46,700
Unrealised fair value movement on forward exchange contracts 121,410 -
Adjusted profit before taxation 2,284,152 2,190,610
Adjusted operating profit: £ £
Operating profit 2,200,196 2,140,336
Add back:
Amortisation of acquired intangibles 80,004 46,700
Adjusted operating profit 2,280,200 2,187,036
A M HowarthNon-executive Chairman
25 November 2016
L T HallChief Executive Officer
25 November 2016

8 | Cerillion plc Annual Report and Accounts 2016
The Directors present their strategic report for the year ended 30 September 2016.
Financial overviewThe Group’s results for the year comprise the additional costs incurred since 30 September 2015 in relation to the IPO on AIM plus the
post-acquisition trade of the Cerillion Technologies Limited Group. The post acquisition revenue totalled £8,364,774, generating a gross
profit of £6,102,075. The Group generated a profit after tax of £306,968 (2015: loss £580,500).
In order to better understand the underlying trade of the Group the Chairman and Chief Executive Officer’s report includes a proforma
consolidated CTL Group income statement.
Business reviewThe review of the year-on-year trade relating to CTL Group is covered within the Chairman and Chief Executive Officer’s report, along
with a review of the cash flows.
Future outlook of the businessThis section of the Strategic Report is covered within the Chairman and Chief Executive Officer’s report.
Summary of key performance indicatorsThe Directors have monitored the performance of the Group with particular reference to the following key performance indicators. The
key performance indicators are monitored against budget and reviewed by the Board:
Cerillion plc CTL Group 2016 2015 2016 2015 Audited Audited Unaudited Unaudited £’000 £’000 £’000 £’000
Revenue 8,365 - 14,810 14,016
Key revenue streams*:
Services 5,359 - 8,688 8,585
Software & Software-as-a-Service 2,615 - 5,315 4,394
Recurring revenue 2,196 - 4,059 3,816
New orders 6,478 - 10,797 11,116
Back order book 9,285 - 9,285 10,992
Profit/(loss) before tax 239 (581) 2,083 2,144
Adjusted profit before tax** 1,603 - 2,284 2,191
Employee numbers:
Onshore 81 - 79 81
India 79 - 78 76
Total 160 - 157 157
* Full analysis of the revenue streams for Cerillion plc can be found in the segmental reporting disclosure note 3. ** Adjusted profit before tax is calculated after adding back IPO costs, unrealised fair value movement on forward exchange contracts and amortisation of acquired intangible assets.
Strategic report

Cerillion plc Annual Report and Accounts 2016 | 9
Principal risks and uncertaintiesEffectively managing risks is an integral part of Cerillion’s business. The Group has identified its main risks and is taking appropriate
action to manage and mitigate these risks. The Group’s multinational operations expose it to financial risks that include market risk,
credit risk, operational risk and liquidity risk. The Directors have split the risks into those relating to the Group and its business operations
and those relating to the industry and markets where the Group operates. The Directors review and agree policies for managing each of
these risks. These policies are detailed in Note 20 to the accounts.
The key risk factors affecting the Group’s performance are expected to include the following:
The success of the Group’s business is partly dependent on key personnel.The Group’s future growth and success depends, in part, upon the leadership and performance of its management team, many of
whom have significant experience in the technology sector and would be difficult to replace. In particular, the Group is highly dependent
on the continued services of the Directors, the senior management team and other key employees, including technical personnel.
Competition for employees with the particular skill sets the Group requires is intense. The loss of executive officers, any members of
the senior management team or other key employees, the inability to recruit sufficiently qualified personnel, or the inability to replace
departing employees in a timely manner could have a material adverse effect on the Group’s business, financial condition and results
of operations.
Fluctuations or devaluations in foreign currencies could adversely affect the Group’s financial condition.The Group services customers in 42 countries and, in the year ended 30 September 2016, 83 per cent. of the Group’s revenues were
generated outside of the UK, some of which were transacted in foreign currencies. To the extent that the Group’s business transactions
are not denominated in the same currency, the Group is exposed to foreign currency exchange rate risk. The Group continually reviews
contract denominations and exchange rates and enters into hedging currency contracts, where deemed appropriate. Movements in
foreign exchange rates on transactions outside of those hedged items could have an adverse effect on the Group’s business, financial
condition and results of operations.
Changes in demands in the telecoms industry market are expected to impact the Group’s customers.The Group generates a large proportion of its revenues from the telecoms industry. Prices for many telecoms products have declined
consistently in recent years, through a combination of regulatory intervention and market competition and these declining price trends
are expected to continue. It is possible that the pricing environment could become more difficult than currently anticipated by the
Group’s customers. Consequently, the Group’s customers may become less financially viable.
Any downturn in the global economy may affect the growth of the telecoms industry or result in reductions in telecoms expenditure. If
economic conditions were to deteriorate, or do not materially improve, the Group’s existing and potential customers may reduce their
expenditure with the Group as a result of their end customers’ reduction in demand for telecoms services. Any reduction in customer
expenditure could have an adverse effect on the Group’s business, financial condition and results of operations.
Furthermore, call volume reductions in the fixed line and mobile telephony sector have resulted from consumers being able
to communicate more readily by means of the internet. The Group has traditionally been dependent on the fixed line, mobile
telecommunications, broadband and TV industries and on fixed line/mobile, broadband and TV volumes and revenues, which may fall
generally in the future.

10 | Cerillion plc Annual Report and Accounts 2016
Additionally, it is expected that there will be a trend for the Group’s customers to move towards managed service agreements. The
Group will need to invest in further resources including staff and servers to service this demand. There is no guarantee that the Group
will have the resources to respond to this demand at the necessary time.
The Group’s potential inability to adapt to changing customer demands could have an adverse effect on the Group’s business, financial
condition and results of operations.
The telecommunications industry is characterised by rapid technological change and continually evolving industry standards,
which could harm the Group’s competitive position, render its products obsolete and cause it to incur substantial costs to
replace its products or implement new technologies.
The telecommunications industry is characterised by rapid technological change and frequent new service introductions. Significant
technological changes could render the Group’s technology and services obsolete. If the Group does not adapt to rapid technological
change, it could lose customers or market share. The Group’s success depends in part on its ability to adapt to the rapidly changing
market by continually improving the features, functionality, reliability and responsiveness of the Group’s existing services and by
successfully developing, introducing and marketing new features, services and applications to meet changing customer needs.
There can be no assurance that any of the Group’s technological developments will be successful. The Group may encounter delays
and incur additional development and production costs and expenses, over and above those expected by the Directors, in order to
develop technologies.
Additionally, the Group may require additional third party licences to supplement new technology in order to remain competitive, and
it may not be able to acquire such licences on reasonable terms or at all. The Group cannot assure any investor that it will be able to
adapt to these challenges or respond successfully or in a cost effective way to adequately meet them. The Group’s failure to do so could
adversely affect its ability to compete, retain customers or maintain its financial performance.
The Group is reliant on a relatively small number of customers and the loss or deterioration of business from any one of the top
five customers could materially affect the Group’s financial condition.
The Group is reliant on a relatively small number of customers and expects this reliance to increase in the short to medium term.
Revenue/customer concentration
Customers by size: 2016 2015 2014
Number 1 28.8% 13.1% 14.9%
Top 5 60.5% 53.0% 54.6%
Top 10 81.7% 79.4% 79.1%
Top 20 96.0% 96.2% 96.9%
Any deterioration of the Group’s relationship with any one of its top five customers could have a material adverse effect on the Group’s
business, financial condition, results of operations, future prospects and/or the price of the Ordinary Shares.
Any one of the Group’s customers may experience financial difficulties and may cease to trade, may decide not to renew their support
contracts or may be unable to continue to conduct business with the Group, which could materially affect the Group’s business,
financial condition and results of operations.
Strategic reportContinued

Cerillion plc Annual Report and Accounts 2016 | 11
The Group’s cash receipts are driven by project milestones (plus payment terms), resulting in volatility over any given year. Revenue is
recognised alongside effort (services and licence) or term (support), resulting in comparably low volatility across any one year. Relatively
large levels of accrued income have built up in the past, whereby the Group has incurred considerable effort and expense in relation to
certain projects that it is yet to receive payment for. In addition certain customers have historically been offered longer payment terms,
based on instalments over a number of years. As a result a number of the Group’s customers have in the past and are likely in the future
to be in a position where they will in effect be significant debtors.
Shareholder informationThe Group’s website at www.cerillion.com contains a wide range of information about our activities and visitors can download copies of
the report and accounts in addition to newsletters and other articles of interest.
This report is approved by the Board on 25 November 2016 and signed on its behalf by:
L T HallChief Executive Officer

12 | Cerillion plc Annual Report and Accounts 2016
Corporate governance report
The Company’s Ordinary Shares are traded on AIM, therefore the Company is not required to and does not comply with all aspects
of the UK Corporate Governance Code. Nonetheless, the Directors recognise that it is in the best interests of the Company and its
Shareholders to follow the UK Corporate Governance Code’s principles of corporate governance and to have in place risk controls
appropriate for a company of its size along with the NAPF Corporate Governance Policy and Voting Guidelines for AIM Companies.
The UK Corporate Governance Code provides that the board of directors of a UK public company should include an appropriate
combination of executive and non-executive directors. Except in the case of smaller companies, at least half the board, excluding the
chairman should comprise independent non-executive directors. The board should determine whether a director is independent in
character and judgment and whether there are relationships or circumstances which are likely to affect, or could appear to affect, the
director’s judgment taking into account the criteria of independence defined in the UK Corporate Governance Code and the guidance in
the NAPF AIM Policy.
The Directors support high standards of corporate governance. The Company’s Board currently comprises three Executive Directors
and two Non-executive Directors. The Chairman and the other Non-executive Director are considered by the Board to be independent
of management and free of any relationship which could materially interfere with the exercise of their independent judgment.
The Directors have adopted terms of reference for and have formed an audit committee, a nominations committee and a remuneration
committee. In accordance with the NAPF AIM Policy a majority of the members of the audit committee, remuneration committee and
nominations committee are independent Non-executive Directors. The UK Corporate Governance Code requires that a majority of the
members of the nominations committee should be independent non-executive directors. It also requires that the audit committee and
the remuneration committee comprise at least three (or in the case of small companies, two) independent non-executive directors. The
Company fully complies with these requirements.
The UK Corporate Governance Code recommends that the board should appoint one of its independent non-executive directors to
be the Senior Independent Director (“SID”) to provide a sounding board for the chairman and to serve as an intermediary for the other
directors when necessary. The SID should be available to shareholders if they have concerns that contact through the normal channels
of chairman, chief executive or other executive directors has failed to resolve or for which such contact is inappropriate. The Company’s
SID is Mike Dee.
The Audit Committee comprises Alan Howarth and Mike Dee, both independent Non-executive Directors and will be chaired by Mike
Dee. In compliance with the UK Corporate Governance Code, Mike Dee has relevant financial experience. The audit committee will
normally meet not less than twice a year and has responsibility for, amongst other things, the planning and review of the Group’s annual
report and accounts and half-yearly reports and the involvement of the Group’s auditors in that process. The committee will focus in
particular on compliance with legal requirements, accounting standards and on ensuring that an effective system of internal financial
control is maintained. The ultimate responsibility for reviewing and approving the annual report and accounts and the half-yearly reports
remains with the Board.
The terms of reference of the Audit Committee cover such issues as membership and the frequency of meetings, as mentioned above,
together with the role of the secretary and the requirements of notice of and quorum for the right to attend meetings. The duties
of the Audit Committee covered in the terms of reference are: financial reporting, internal controls and risk management systems,
whistleblowing internal audit, external audit and reporting responsibilities. The terms of reference also set out the authority of the
committee to exercise its duties.

Cerillion plc Annual Report and Accounts 2016 | 13
The Nominations Committee comprises Alan Howarth and Mike Dee, both of whom are independent Non-executive Directors, and
will be chaired by Alan Howarth. The Nominations Committee meets when appropriate and considers the composition of the Board,
retirements and appointments of additional and replacement directors and make appropriate recommendations to the Board.
The Remuneration Committee comprises Alan Howarth and Mike Dee, both of whom are independent Non-executive Directors, and is
chaired by Alan Howarth. The Remuneration Committee will normally meet not less than twice a year and has responsibility for making
recommendations to the Board on the Group’s policy on the remuneration of certain senior executives (including senior management),
including annual bonuses, the eligibility requirements for benefits under long-term incentive schemes and for the determination, within
agreed terms of reference, of specific remuneration packages for each of the Executive Directors, including pension rights, contracts of
employment and any compensation payments.
The terms of reference of the Remuneration Committee cover such issues as membership and frequency of meetings, as mentioned
above, together with the role of secretary and the requirements of notice of and quorum for and the right to attend meetings. The duties
of the Remuneration Committee covered in the terms of reference relate to the following: determining and monitoring policy on and
setting levels of remuneration, contracts of employment, early termination, performance-related pay, pension arrangements, authorising
claims for expenses from the Executive Directors, reporting and disclosure, and remuneration consultants. The terms of reference also
set out the reporting responsibilities and the authority of the committee to exercise its duties.

14 | Cerillion plc Annual Report and Accounts 2016
The Group is run by its Board of Directors, which currently has five members, including two Non-executive Directors, and meets
regularly. The Non-executive Directors make a valuable contribution by bringing a breadth of business and relevant professional
experience to the Board.
The Board has overall responsibility for the Group and there is a formal schedule of matters specifically reserved for decision by the
Board. It is responsible for the overall Group strategy, acquisition and divestment policy, corporate policies, approval of major capital
expenditure and consideration of significant capital matters.
Alan Miles Howarth, Non-executive Chairman (aged 71 years)Alan Howarth has extensive senior executive experience in a range of national and international organisations in both the public and
private sector. At Ernst & Young he was one of the founding partners of the UK Management Consulting practice. For the last 15 years,
he has managed a portfolio of non-executive appointments, as chairman of both public and private companies primarily in the UK and
US Technology and Health sectors. He is Chairman of Essentia Trading Limited and MPL Systems Limited as well as a Non-executive
Director of Premier Technical Services Group plc (AIM: PTSG).
Louis Tancred Hall, Chief Executive Officer (aged 52 years)Louis Hall is the CEO and founder of Cerillion, having led the management buyout of the original business from Logica in 1999. Louis
has worked in the enterprise software industry for over 25 years and prior to forming Cerillion held a number of product, sales and
management positions at Logica.
Oliver Radnor Gilchrist, Chief Financial Officer (aged 52 years)Oliver Gilchrist joined Cerillion in 2001 as CFO. He has over 30 years’ experience in finance, training as a chartered accountant at
Coopers & Lybrand (now part of PWC). He left Coopers & Lybrand for industry in 1995, joining Parallax plc as CFO, prior to its sale to
Keane Inc. in 1999 for $25m. Following this he acted as interim CFO to Apama Inc., managing a second round interim fundraise of $10
million in 2001. The company was subsequently sold to the Carlyle Group.
Guy Jason O’Connor, Business Development Director (aged 53 years)Guy O’Connor is a co-founder of Cerillion and has led business development at Cerillion since the management buyout. Prior to joining
Cerillion, Guy was Group Director for Matheson Investment International, a subsidiary of Jardine Matheson Group.
Mike Dee, Non-executive Director (aged 61 years)Mike Dee is a qualified accountant (CIMA). Until July 2015, he was CEO of Manx Telecom plc and led its successful AIM IPO in February
2014. Before becoming CEO in April 2011, he was Director of Finance and had been part of the British Telecom plc team which set up
Manx Telecom plc in 1987. Prior to his 29 years at Manx Telecom plc, Mike spent four years at British Telecom plc. Before that, Mike
held accounting and company secretary positions with the Dowty Group, Iloman Engineering and Castle Industries. Mike holds a BA
(Hons) degree in Business Studies and a CIMA qualification.
Board of Directors

Cerillion plc Annual Report and Accounts 2016 | 15
Report of the Remuneration Committee
Companies quoted on AIM are not required to provide a formal remuneration report. Therefore this report is provided for information
purposes to give greater transparency to the way Directors and key management are remunerated.
Composition and role of the Remuneration CommitteeThe Board has established a Remuneration Committee, which currently consists of Alan Howarth, Non-executive Director, who chairs
the committee and Mike Dee, Non-executive Director. The committee determines the specific remuneration packages for each of the
Executive Directors and key management. No Director is involved in any decisions as to his own remuneration.
Framework and policy on Executive Directors’ remunerationThe Group’s remuneration policy is designed to provide competitive rewards for its Executive Directors and key management, taking into
account the performance of the Group and individual Executives, together with comparisons of pay conditions throughout the markets
in which the Group operates. It is the aim of the committee to attract, retain and motivate high calibre individuals with a competitive
remuneration package. It is common practice in the industry for total remuneration to be influenced by bonuses and long-term
incentives.
The remuneration packages are constructed to provide a balance between fixed and variable rewards. Therefore remuneration
packages for Executive Directors normally include basic salary, discretionary bonuses, long-term incentive awards and benefits in kind.
In agreeing the level of basic salaries and annual bonuses, the committee takes into consideration the total remuneration that Executive
Directors could receive.
Basic salaryBasic salaries are reviewed on an annual basis. The committee seeks to establish a basic salary for each position, determined by
individual responsibilities and performance taking into account comparable salaries for similar positions in companies of a similar size in
the same market.
Incentive arrangementsAnnual discretionary bonusesThese are designed to reflect the Group’s performance taking into account the performance of its peers, the markets in which the Group
operates and the Executive Directors’ contribution to that performance.
Long-term incentive awardsThe Group does not currently operate any long-term incentive awards, but are reviewing options for a Save As You Earn (“SAYE”)
scheme for employees and a Long-Term Incentive Plan (“LTIP”) for senior management.
Other benefitsDepending on the terms of their contracts, Executive Directors are entitled to contributions to pension plans, private medical insurance,
permanent health insurance and life assurance.
Service contracts and notice periodsAll Executive Directors have employment contracts which are subject to between three and twelve months’ notice from either the
Executive or the Group, given at any time.

16 | Cerillion plc Annual Report and Accounts 2016
Non-executive DirectorsAll Non-executive Directors have a remuneration agreement for an initial period of twelve months and thereafter on a rolling basis
subject to three months’ notice by either the Non-executive Director or the Group, given at any time. In the event of termination of their
appointment, they are not entitled to any compensation.
Non-executive Directors’ fees are determined by the Executive Directors having regard to the need to attract high calibre individuals with
the right experience, the time and responsibilities entailed, and comparative fees paid in the market in which the Group operates. They
are not eligible for pensions. They may be invited to participate in the Group’s share option scheme.
Directors’ emolumentsThe remuneration of each Director during the year ended 30 September 2016 is detailed in the table below:
Pension Total Salary* Benefits* Bonus** contribution* 2016 £ £ £ £ £
Executive
L T Hall 145,451 2,439 124,000 17,454 289,344
O C R Gilchrist 96,374 2,703 38,750 10,443 148,270
G J O’Connor 121,120 2,555 - 13,770 137,445
Non-executive
A M Howarth 13,320 - - - 13,320
M Dee 13,320 - - - 13,320
Total 389,585 7,697 162,750 41,667 601,699
* The Salary, Benefits and Pension contribution represents the amounts in relation to the period from acquisition on 18 March 2016 to 30 September 2016. ** The bonus determination is made at the year-end, but relates to performance for the full year, so the above figure is a reward for the 12 months to 30 September 2016.
No Directors salaries were paid through Cerillion plc for the year ended 30 September 2015.
A M HowarthChairman of the Remuneration Committee
25 November 2016
Report of the Remuneration CommitteeContinued

Cerillion plc Annual Report and Accounts 2016 | 17
Membership and meetings of the Audit CommitteeThe Audit Committee is a committee of the Board and is composed entirely of Non-executive Directors, whom the Board considers to
be independent. The Audit Committee invites the Executive Directors and other senior managers to attend its meetings as appropriate.
During the year the Audit Committee was chaired by Mike Dee. The Audit Committee is considered to have sufficient, recent and
relevant financial experience to discharge its functions. The Audit Committee invites others, including the external auditor, to attend its
meetings as appropriate.
Role, responsibilities and terms of referenceThe Audit Committee’s role is to assist the Board in the effective discharge of its responsibilities for financial reporting and internal control.
The Audit Committee’s responsibilities include:
• reviewing the integrity of the annual and interim financial statements of the Group, ensuring they comply with legal requirements,
accounting standards, the AIM Rules and any other formal announcements relating to the Group’s financial performance;
• reviewing the Group’s internal financial control and risk management systems;
• monitoring and reviewing the requirement for an internal audit function; and
• overseeing the relationship with the external auditor, including approval of its remuneration, reviewing the scope of the audit
engagement, assessing its independence, monitoring the provision of non-audit services and considering its reports on the Group’s
financial statements.
Independence of external auditorThe Audit Committee keeps under review the relationship with the external auditor including:
• the independence and objectivity of the external auditor, taking into account the relevant UK professional and regulatory requirements
and the relationship with the auditor as a whole, including the provision of non-audit services;
• recommending to the Board and shareholders the re-appointment or otherwise of the external auditor for the following financial
period; and
• the consideration of audit fees and any fees for non-audit services.
The Audit Committee develops and recommends to the Board the Company’s policy in relation to the provision of non-audit services by
the auditor and ensures that the provision of such services does not impair the external auditor’s independence.
M DeeChairman of the Audit Committee
25 November 2016
Report of the Audit Committee

18 | Cerillion plc Annual Report and Accounts 2016
The Directors present their report, the strategic report and the audited financial statements of the Group for the year ended
30 September 2016.
DirectorsThe present membership of the Board is set out below. All Directors served throughout the year unless indicated:
L T Hall
G J O’Connor
O C R Gilchrist
A M Howarth (appointed 2 November 2015)
M Dee (appointed 11 March 2016)
Directors’ Responsibilities StatementThe Directors are responsible for preparing the Strategic Report, the Directors’ Report and the financial statements in accordance with
applicable law and regulations.
Company law requires the Directors to prepare financial statements for each financial year. Under that law the Directors have prepared
the Group and Parent Company financial statements in accordance with International Financial Reporting Standards as adopted by the
European Union (IFRSs). Under company law the Directors must not approve the financial statements unless they are satisfied that they
give a true and fair view of the state of affairs of the Group and Company and of the profit or loss of the Group and Company for that
period. In preparing these financial statements, the Directors are required to:
• select suitable accounting policies and then apply them consistently;
• make judgments and accounting estimates that are reasonable and prudent;
• state whether applicable IFRSs for Group and Company have been followed, subject to any material departures disclosed and
explained in the financial statements; and
• prepare the financial statements on the going concern basis unless it is inappropriate to presume that the Group will continue in business.
The Directors are responsible for keeping adequate accounting records that are sufficient to show and explain the Company’s
transactions and disclose with reasonable accuracy at any time the financial position of the Company and enable them to ensure that
the financial statements comply with the Companies Act 2006. They are also responsible for safeguarding the assets of the Company
and hence for taking reasonable steps for the prevention and detection of fraud and other irregularities.
The Directors confirm that:
• so far as each Director is aware, there is no relevant audit information of which the Company’s auditor is unaware; and
• the Directors have taken all the steps that they ought to have taken as directors in order to make themselves aware of any relevant
audit information and to establish that the auditors are aware of that information.
The Directors are responsible for the maintenance and integrity of the corporate and financial information included on the Company’s
website. Legislation in the United Kingdom governing the preparation and dissemination of financial statements may differ from
legislation in other jurisdictions.
Directors’ report

Cerillion plc Annual Report and Accounts 2016 | 19
Going concernThe Directors have assessed the current financial position of the Group, along with future cash flow requirements for a period in excess
of 12 months from the date of signing the financial statements, to determine if the Group has the financial resources to continue as a
going concern for the foreseeable future.
The conclusion of this assessment is that it is appropriate that the Group be considered a going concern, based on forecast profitability
and positive cash inflows. For this reason the Directors continue to adopt the going concern basis in preparing the financial statements.
Financial risk managementInformation relating to the Group’s financial risk management is detailed in Note 20 to the financial statements.
Research and development activitiesResearch and development expenditure incurred on the Group’s suite of products has been capitalised in line with the Group’s
accounting policy in the relevant period. Research and development comprises analysis, design, programming and testing of software
solutions. The Group will continue to invest in solutions to address new customer requirements as they arise and to take advantage
of technological advances in the underlying software platforms. Amounts not capitalised have been expensed to the consolidated
statement of comprehensive income.
The Group has incurred £172,978 (2015: £nil) of research and development expenditure through the consolidated statement of
comprehensive income during the year and has capitalised software development costs of £601,111 (2015: £nil).
Strategic reportInformation in respect of the Business Review, Future Outlook of the Business and Principal Risks and Uncertainties are not shown in
the Report of the Directors because they are presented in the Strategic Report in accordance with s414c(ii) of the Companies Act 2006.
Post balance sheet eventsThere are no post balance sheet events requiring adjustment or disclosure within the financial statements.
AuditorsGrant Thornton UK LLP has expressed willingness to continue in office. In accordance with section 489(4) of the Companies Act 2006, a
resolution proposing the reappointment of Grant Thornton UK LLP will be put to the members at the forthcoming Annual General Meeting.
ON BEHALF OF THE BOARD
L T HallDirector
25 November 2016

20 | Cerillion plc Annual Report and Accounts 2016
Independent auditor’s report to the members of Cerillion plc
We have audited the financial statements of Cerillion plc for the year ended 30 September 2016 which comprise the principal
accounting policies, consolidated statement of comprehensive income, the consolidated and company statements of financial position,
the consolidated and company statements of cash flows, the consolidated and company statements of changes in equity and the
related notes. The financial reporting framework that has been applied in their preparation is applicable law and International Financial
Reporting Standards as adopted by the European Union (IFRSs) and as regards the parent company financial statements has been
applied in accordance with the provisions of the Companies Act 2006.
This report is made solely to the Company’s members, as a body, in accordance with Chapter 3 of Part 16 of the Companies Act 2006.
Our audit work has been undertaken so that we might state to the Company’s members those matters we are required to state to them in
an auditor’s report and for no other purpose. To the fullest extent permitted by law, we do not accept or assume responsibility to anyone
other than the Company and the Company’s members as a body, for our audit work, for this report, or for the opinions we have formed.
Respective responsibilities of directors and auditorsAs explained more fully in the Directors’ Responsibilities Statement set out on page 18, the Directors are responsible for the preparation
of the financial statements and for being satisfied that they give a true and fair view. Our responsibility is to audit and express an opinion
on the financial statements in accordance with applicable law and International Standards on Auditing (UK and Ireland). Those standards
require us to comply with the Auditing Practices Board’s (APB’s) Ethical Standards for Auditors.
Scope of the audit of the financial statementsA description of the scope of an audit of financial statements is provided on the Financial Reporting Council’s website at
www.frc.org.uk/auditscopeukprivate.
Opinion on financial statementsIn our opinion:
• the financial statements give a true and fair view of the state of the Group’s and Parent Company’s affairs as at 30 September 2016
and of the Group’s profit for the year then ended;
• the Group financial statements have been properly prepared in accordance with IFRSs as adopted by the European Union;
• the Parent Company financial statements have been properly prepared in accordance with IFRSs as adopted by the European Union
and as applied in accordance with the provisions of the Companies Act 2006; and
• the financial statements have been prepared in accordance with the requirements of the Companies Act 2006.
Opinion on other matter prescribed by the Companies Act 2006In our opinion, the information given in the Strategic Report and the Directors’ Report for the financial period for which the financial
statements are prepared is consistent with the financial statements.

Cerillion plc Annual Report and Accounts 2016 | 21
Matters on which we are required to report by exceptionWe have nothing to report in respect of the following matters where the Companies Act 2006 requires us to report to you if, in our opinion:
• adequate accounting records have not been kept by the Parent Company, or returns adequate for our audit have not been received
from branches not visited by us; or
• the Parent Company financial statements are not in agreement with the accounting records and returns; or
• certain disclosures of Directors’ remuneration specified by law are not made; or
• we have not received all the information and explanations we require for our audit.
Marc Summers, FCASenior Statutory Auditor
for and on behalf of Grant Thornton UK LLP,
Statutory Auditor, Chartered Accountants
London
25 November 2016

22 | Cerillion plc Annual Report and Accounts 2016
Principal accounting polices
The principal accounting policies applied in the preparation of these financial statements are set out below.
Basis of preparationThe Company is a public limited company, which was incorporated in England and Wales on 5 March 2015. The address of its
registered office is 125 Shaftesbury Avenue, London, WC2H 8AD. The principal activity of the Group is a supplier and developer of
telecommunication software solutions and equipment. In the prior year the principal activity was to act as a platform to acquire the
entire issued share capital of Cerillion Technologies Limited for the purpose of admission to AIM. These financial statements have
been prepared in accordance with International Financial Reporting Standards as adopted by the European Union (IFRSs) and IFRIC
interpretations endorsed by the European Union (EU). The financial statements have been prepared under the historical cost convention,
except for derivative financial instruments which are held at fair value.
The Company’s Directors are responsible for the preparation of the financial statements.
The preparation of the financial statements in conformity with IFRS requires the use of estimates and assumptions that affect the
reported amounts of assets and liabilities at the date of the financial statements and the reported amounts of revenues and expenses
during the period. Although these estimates are based on management’s best knowledge of the amount, event or actions, actual
results ultimately may differ from those estimates. Further details regarding areas requiring significant assumptions and estimates are
provided in Note 1 to the financial statements.
There is no material difference between the fair value of financial assets and liabilities and their carrying amount.
The functional and presentational currency is UK Sterling. Amounts in the financial statements have been rounded to the nearest pound.
Going concernThe Directors have assessed the current financial position of the Group, along with future cash flow requirements for a period in excess
of 12 months from the date of signing the financial statements, to determine if the Group has the financial resources to continue as a
going concern for the foreseeable future.
The conclusion of this assessment is that it is appropriate that the Group be considered a going concern, based on forecast profitability
and positive cash inflows. For this reason the Directors continue to adopt the going concern basis in preparing the financial statements.
Basis of consolidationThe Group financial statements consolidate those of the Parent Company and all of its subsidiaries as of 30 September 2016. All
subsidiaries have a reporting date of 30 September with the exception of the Indian subsidiary, which has a mandatory reporting date of
31 March. The Indian subsidiary is consolidated using its management accounts through to 30 September 2016.
Subsidiaries are all entities over which the Group has control. The Group controls an entity when the Group is exposed to, or has rights
to, variable returns from its involvement with the subsidiary and has the ability to affect those returns through its power over the entity.
Subsidiaries are fully consolidated from the date on which control is transferred to the Group. They are deconsolidated from the date
that control ceases.
The Group applies the acquisition method to account for business combinations. The consideration transferred for the acquisition of a
subsidiary or a business is the fair values of the assets transferred, the liabilities incurred to former owners of the acquiree and the equity
interests issued to the Group. The consideration transferred includes the fair values of any asset or liability resulting from a contingent
consideration arrangement.

Cerillion plc Annual Report and Accounts 2016 | 23
Identifiable assets acquired and liabilities and contingent liabilities assumed in a business combination are measured initially at their fair
values on the acquisition date.
Acquisition-related costs are expensed as incurred.
Intercompany transactions, unrealised gains and losses on intragroup transactions and balances between Group companies are
eliminated on consolidation.
New and Revised StandardsIFRS in issue but not applied in the current financial statementsThe following IFRS and IFRIC Interpretations have been issued but have not been applied by the Company in preparing these financial
statements as they are not as yet effective. The Company intends to adopt these Standards and Interpretations when they become
effective, rather than adopt them early.
• IFRS 9, ‘Financial instruments’, effective date 1 January 2018 (not yet adopted by the EU, as at 30 September 2016)
• IFRS 15, ‘Revenue from Contracts with Customers’, effective date 1 January 2018 (not yet adopted by the EU, as at
30 September 2016)
• IFRS 16, ‘Leases’, effective date 1 January 2019 (not yet adopted by the EU, as at 30 September 2016).
The above standards are yet to be subject to a detailed review. IFRS 9 will impact both the measurement and disclosure of financial
instruments, IFRS 15 may have an impact on revenue recognition and related disclosures and IFRS 16 will impact the treatment of
leases currently treated as operating leases. Beyond this, it is not practicable to provide a reasonable estimate of the effect of IFRS 9,
IFRS 15 and IFRS 16 until a detailed review has been completed.
A number of IFRS and IFRIC interpretations are also currently in issue which are not relevant for the Company’s activities and which have
not therefore been adopted in preparing these financial statements:
• IFRS 14 “Regulatory Deferral Accounts” (effective: 1 January 2016)
• Amendments to IFRS 11: Accounting for Acquisitions of Interests in Joint Operations (IASB effective date: 1 January 2016)
• Clarification of Acceptable Methods of Depreciation and Amortisation – Amendments to IAS 16 and IAS 38
(IASB effective date: 1 January 2016)
• Annual Improvements to IFRSs 2012-2014 Cycle (effective: 1 January 2016)
• Amendments to IAS 16 and IAS 41: Bearer Plants (effective: 1 January 2016)
• Amendments to IAS 27: Equity Method in Separate Financial Statements (effective: 1 January 2016)
• Amendments to IFRS 10, IFRS 12 and IAS 28: Investment Entities: Applying the Consolidation Exception (effective: 1 January 2016)
• Disclosure Initiative: Amendments to IAS 1: Presentation of Financial Statements (effective: 1 January 2016)
• Disclosure Initiative: Amendments to IAS 7: Statement of Cash Flows (effective: 1 January 2017)
• Sale or Contribution of Assets between an Investor and its Associate or Joint Venture – Amendments to IFRS 10 and IAS 28
(effective: 1 January 2016)
• Amendments to IAS 12: Recognition of Deferred Tax Assets for Unrealised Losses (effective: 1 January 2017).

24 | Cerillion plc Annual Report and Accounts 2016
Segmental reporting In accordance with IFRS 8, segmental information is presented based on the way in which financial information is reported internally
to the chief operating decision-maker. The chief operating decision-maker, who is responsible for allocating resources and assessing
performance of the operating segments, has been identified as the Board which makes strategic decisions.
During the year ended 30 September 2016, since the acquisition of Cerillion Technologies Limited, the Group was organised into four
main business segments for revenue purposes:
• Services: relates to revenue from providing services to customers on new implementation projects and enhancements.
• Software: relates to support and maintenance revenue derived from people using the software as well as the licences to use
the software.
• Software-as-a-Service: relates to monthly subscriptions for a managed service or to use products on a pay as you go service.
• Third Party: relates to revenue derived from third party services or licences, re-billable expenses and pass through of selling
on hardware.
Assets are used across all segments and therefore are not split between segments.
Foreign currency translation(i) Functional and presentation currencyItems included in the Financial Statements are measured using the currency of the primary economic environment in which entities
operate (‘the functional currency’). The Financial Statements are presented in sterling, which is the Parent Company’s functional and
presentation currency. There has been no change in the functional currency during the current or preceding period.
(ii) Transactions and balancesTransactions in foreign currencies are translated into sterling using monthly average exchange rates. This is permissible in this case as
there are no significant fluctuations between the currencies with which the entity operates. Monetary assets and liabilities denominated
in foreign currencies are retranslated at the exchange rates ruling at the balance sheet date and any exchange differences arising are
taken to profit or loss.
Non-monetary items are not retranslated at year-end and are measured at historical cost (translated using the exchange rates at the
transaction date), except for non-monetary items measured at fair value which are translated using the exchange rates at the date when
fair value was determined.
(iii) Foreign operationsIn the Group’s financial statements, all assets, liabilities and transactions of Group entities with a functional currency other than the GBP
are translated into GBP upon consolidation. The functional currency of the entities in the Group has remained unchanged during the
reporting period.
On consolidation, assets and liabilities have been translated into GBP at the closing rate at the reporting date. Goodwill and fair
value adjustments arising on the acquisition of a foreign entity have been treated as assets and liabilities of the foreign entity and
translated into GBP at the closing rate. Income and expenses have been translated into GBP at the average rate over the reporting
period. Exchange differences arising from significant foreign subsidiaries are charged or credited to other comprehensive income and
recognised in the currency translation reserve in equity. On disposal of a foreign operation, the related cumulative translation differences
recognised in equity are reclassified to profit or loss and are recognised as part of the gain or loss on disposal.
Principal accounting policesContinued

Cerillion plc Annual Report and Accounts 2016 | 25
Revenue recognitionRevenue is measured at the fair value of the consideration received or receivable net of sales related taxes.
The Group follows the principals of IAS 18 “Revenue” in determining appropriate revenue recognition policies. In principle revenue is
recognised to the extent that it is probable that the economic benefits associated with the transaction will flow into the Group.
Revenue is derived from sales of standard licensed products (including installation, implementation, maintenance and support fees),
additional licences, ongoing account development work, third party time and material works.
The excess of amounts invoiced over revenue recognised are included in deferred income. If the amount of revenue recognised exceeds
the amount invoiced the excess is included within accrued income.
In applying the income recognition policies below where there is a requirement for a contract to be signed, income is recognised in
accordance with the policy when the contract has been signed or persuasive evidence of an arrangement exists.
(i) Sale of standard licensed productsRevenue from standard licensed products comprises two elements, being:
• Initial licence and implementation fees (“inception fees”)
• Ongoing maintenance and support fees
With the contract detailing separately the contract value and payment milestones for each element.
When each element operates independently of the other, the Group will recognise inception fees and ongoing maintenance and support
fees on the following basis.
Revenue for initial licence and implementation fees in relation to products which are not modified to meet the specific requirements of
each customer and follow a straightforward implementation profile is recognised at the point at which the customer has the ability and
right to use all prepaid licences on the installed solution.
Revenue from ongoing maintenance and support fees are recognised on a pro-rated basis over the duration of the contract.
Where a licensed product requires significant customer modifications and implementation is complex, revenue is recognised on applying
the percentage of completion method to total contract value with estimates based on the total number of hours performed on the
project compared to the total number of hours expected to complete the project. Provision is made for any losses on the contract as
soon as they are foreseen.
(ii) Sale of additional licencesRevenue from the sale of additional licences is recognised when the additional licences are delivered to the customer.
(iii) Ongoing account development workOngoing account development work is generally provided on a fixed price basis and as such revenue is recognised based on the
percentage completion or delivery of the relevant project, whichever is most appropriate for the transaction. Where percentage
completion is used it is estimated based on the total number of hours performed on the project compared to the total number of hours
expected to complete the project. Provision is made for any losses as soon as they are foreseen.
(iv) Third party time, material works and re-billable expensesRevenue on contracted third party time and material works is recognised on a time basis using pre-agreed day rates.

26 | Cerillion plc Annual Report and Accounts 2016
Revenue on re-billable expenses is recognised as incurred. In the case of third party time, material works and re-billable expenses the
Group is considered to be acting as principal as it is the primary obligor in the sales transaction, the Group can select the supplier of the
service and the Group holds the credit risk in the transaction.
Cost of salesCosts considered to be directly related to revenue are accounted for as cost of sales. All direct production costs and overheads,
including indirect overheads that can reasonably be allocated, have been classified as cost of sales.
Taxation and deferred taxationThe income tax expense or income for the period is the tax payable on the current period’s taxable income. This is based on the national
income tax rate enacted or substantively enacted for each jurisdiction with any adjustment relating to tax payable in previous years and
changes in deferred tax assets and liabilities attributable to temporary differences between the tax bases of assets and liabilities and
their carrying amounts in the Financial Statements.
Deferred tax assets and liabilities are recognised for temporary differences at the tax rates expected to be applicable when the asset
or liability crystallises based on current tax rates and laws that have been enacted or substantively enacted by the reporting date. The
relevant tax rates are applied to the cumulative amounts of deductible and taxable temporary differences to measure the deferred tax
asset or liability.
A deferred tax asset is regarded as recoverable and therefore recognised only when, on the basis of all available evidence, it can be
regarded as more likely than not that there will be suitable taxable profits against which to recover carried forward tax losses and from
which the future reversal of temporary differences can be deducted. The carrying amount of deferred tax assets are reviewed at each
reporting date.
Deferred tax liabilities are generally recognised in full, although IAS 12 ‘Income Taxes’ specifies limited exemptions. As a result of
these exemptions, the Group does not recognise deferred tax on temporary differences relating to goodwill, or to its investments in
subsidiaries. Temporary differences associated with investments in subsidiaries is not provided if reversal of these temporary differences
can be controlled by the Group and it is probable that reversal will not occur in the foreseeable future.
Operating leasesLeases in which a significant portion of the risks and rewards of ownership are not transferred to the Group as lessee are classified as
operating leases. These are the only types of lease utilised by the entity. Operating lease payments for assets leased from third parties
are charged to profit or loss on a straight line basis over the period of the lease, on an accrued basis.
ImpairmentGoodwill and assets that are subject to amortisation are reviewed for impairment annually or whenever events or changes in
circumstances indicate that the carrying amount may not be recoverable. An impairment loss is recognised for the amount by which
the asset’s carrying amount exceeds its recoverable amount. The recoverable amount is the higher of an asset’s fair value less costs to
sell and value in use. For the purposes of assessing impairment, assets are grouped at the lowest levels for which there are separately
identifiable cash flows (cash generating units).
Cash and cash equivalentsCash and cash equivalents comprise cash at bank and in hand and other short term highly liquid deposits with original maturities of
three months or less.
Principal accounting policesContinued
Cerillion plc Annual Report and Accounts 2016 | 27
Financial instrumentsRecognition, initial measurement and derecognitionFinancial assets and financial liabilities are recognised when the Group becomes a party to the contractual provisions of the financial
instrument and are measured initially at fair value adjusted for transaction costs. Subsequent measurement of financial assets and
financial liabilities is described below.
Financial assets are derecognised when the contractual rights to the cash flows from the financial asset expire, or when the financial
asset and substantially all the risks and rewards are transferred. A financial liability is derecognised when it is extinguished, discharged,
cancelled or expires.
Classification and subsequent measurement of financial assetsFor the purpose of subsequent measurement financial assets are classified into the following categories upon initial recognition:
Derivative financial instrumentsDerivative financial instruments held by the Group comprise forward foreign currency contracts and are recognised at fair value. The
Group has not applied hedge accounting and the gain or loss on remeasurement to fair value is recognised immediately in profit or loss.
Loans and receivablesLoans and receivables are non-derivative financial assets with fixed or determinable payments that are not quoted in an active market.
After initial recognition, these are measured at amortised cost using the effective interest method, less provision for impairment.
Discounting is omitted where the effect of discounting is immaterial. The Company’s cash and cash equivalents, trade and most other
receivables fall into this category of financial instruments.
Trade and other receivablesTrade and other receivables are recognised initially at fair value and subsequently measured at amortised cost using the effective interest
method, less provision for impairment. A provision for impairment of trade and other receivables is established when there is objective
evidence that Cerillion will not be able to collect all amounts due according to the original terms of the receivables. Significant financial
difficulties of the debtors, probability that the debtor will enter bankruptcy or financial reorganisation, and default or delinquency in
payments (more than 90 days overdue) are considered indicators that the trade and other receivables may be impaired. The amount of
the provision is the difference between the asset’s carrying amount and the present value of estimated future cash flows, discounted
at the original effective interest rate. The carrying amount of the asset is reduced through the use of an allowance account, and the
amount of the loss is recognised in the profit or loss within ‘cost of sales’. When a trade or other receivable is uncollectible, it is written
off against the allowance account for trade and other receivables. Subsequent recoveries of amounts previously written off are credited
against ‘cost of sales’ in the profit or loss.
Classification and subsequent measurement of financial liabilitiesThe Group’s financial liabilities include trade and certain other payables. Financial liabilities are measured subsequently at amortised cost
using the effective interest.
Trade payablesTrade payables are recognised initially at fair value and subsequently measured at amortised cost using the effective interest method.
These amounts represent liabilities for goods and services provided to Cerillion prior to the end of the financial period which are unpaid.
BorrowingsBorrowings are recognised initially at fair value, net of transaction costs incurred. Borrowings are subsequently stated at amortised cost;
any difference between the proceeds (net of transaction costs) and the redemption value is recognised in profit or loss over the period of
the borrowings using the effective interest method.

28 | Cerillion plc Annual Report and Accounts 2016
EquityAn equity instrument is any contract that evidences a residual interest in the assets of the Company after deducting all of its liabilities.
Equity instruments issued by the Company are recorded at the proceeds received net of direct issue costs.
The share premium account represents premiums received on the initial issuing of the share capital. Any transaction costs associated
with the issuing of shares are deducted from share premium, net of any related income tax benefits.
The ordinary share capital account represents the amount subscribed for shares at nominal value.
Retained earnings include all results as disclosed in the statement of comprehensive income.
Foreign exchange reserve comprises foreign currency translation differences arising from the translation of financial statements of the
Group’s foreign entities into Sterling.
ProvisionsProvisions are recognised when Cerillion has a present legal or constructive obligation as a result of past events, it is more likely than
not that an outflow of resources will be required to settle the obligation and the amount has been reliably estimated. Provisions are not
recognised for future operating losses.
Provisions are the best estimate of the expenditure required to settle the obligation at the current reporting date.
Property, plant and equipment (PPE)PPE is stated at historical cost less accumulated depreciation. Historical cost includes expenditure that is directly attributable to the
acquisition of the items.
Subsequent costs are included in the asset’s carrying amount or recognised as a separate asset, as appropriate, only when it is
probable that future economic benefits associated with the item will flow to Cerillion and the cost of the item can be measured reliably.
All other repairs and maintenance are charged to profit or loss during the financial period in which they are incurred.
Depreciation on plant and machinery and fixtures and fittings is calculated using the straight line method to allocate their cost or
revalued amounts, net of their residual values, over their estimated useful lives, as follows:
• Leasehold improvements Life of lease
• Fixtures and fittings 3 – 4 years
• Computer equipment 3 years
The assets’ residual values and useful lives are reviewed, and adjusted if appropriate, at each reporting date.
An asset’s carrying amount is written down immediately to its recoverable amount if the asset’s carrying amount is greater than its
estimated recoverable amount. Gains and losses on disposals are determined by comparing proceeds with carrying amount. These are
included in the profit or loss.
Principal accounting policesContinued

Cerillion plc Annual Report and Accounts 2016 | 29
Intangible assets and amortisation(i) SoftwareExpenditure on research is written off in the period in which it is incurred. Development expenditure incurred on specific projects is
capitalised where the Board is satisfied that the following criteria have been met:
• it is technically feasible to complete the software product so that it will be available for use;
• management intends to complete the software product and use or sell it;
• there is an ability to use or sell the software product;
• it can be demonstrated how the software product will generate probable future economic benefits;
• adequate technical, financial and other resources to complete the development and to use or sell the software product
are available; and
• the expenditure attributable to the software product during its development can be reliably measured.
Directly attributable costs that are capitalised as part of the software product include the software development employee costs and an
appropriate portion of relevant overheads.
Other development expenditures that do not meet these criteria are recognised as an expense as incurred. Development costs
previously recognised as an expense are not recognised as an asset in a subsequent period.
Computer software development costs recognised as assets are amortised over their estimated useful lives, which does not
exceed five years.
(ii) GoodwillGoodwill represents the excess of the cost of an acquisition over the fair value of the assets and liabilities assumed at the date of
acquisition. Goodwill acquired in business combinations is not amortised. Instead, goodwill is tested for impairment annually or more
frequently if events or changes in circumstances indicate that it might be impaired, and is carried at cost less accumulated impairment
losses. Impairment testing is carried out by assessing the recoverable amount of the cash-generating unit to which the goodwill relates.
(iii) Purchased customer contractsPurchased customer contracts acquired as part of a business combination are recognised at fair value if they are project specific and
there is a level of certainty that there will be future recovery. Customer contracts are amortised over the perceived period that they will
generate economic benefits. This is calculated using in depth analysis of future revenue from cash flow forecasts.
The customer contracts acquired as part of the acquisition of Cerillion Technologies Limited are to be amortised over a period
of seven years.
(iv) Intellectual property rightsIntellectual property rights acquired as part of a business combination are recognised at fair value based on an estimate of future profits.
Intellectual property rights are amortised over the perceived period that they will generate economic benefits. This is calculated using in
depth analysis of future revenue from cash flow forecasts.
The intellectual property rights acquired as part of the acquisition of Cerillion Technologies Limited are to be amortised over a period
of seven years.

30 | Cerillion plc Annual Report and Accounts 2016
InterestInterest income and expense are recognised using the effective interest method and comprise amounts receivable and payable on bank
deposits and bank borrowings respectively.
Post retirement benefitsDefined contribution schemesThe defined contribution schemes provide benefits based on the value of contributions made. The amounts charged as expenditure for
the defined contribution scheme represent the contributions payable by Cerillion for the accounting years in respect of the schemes.
Exceptional itemsExceptional items are those significant items, and are one-off items, that are separately disclosed by virtue of their size or incidence
to enable a full understanding of the Group’s financial performance. Transactions that were recorded as exceptional items during the
current and prior year were the costs associated with the IPO of Cerillion plc.
Principal accounting policesContinued

Cerillion plc Annual Report and Accounts 2016 | 31
Period from Year to 5 March 2015 to 30 September 2016 30 September 2015* Notes £ £
Revenue - all from acquisition 3 8,364,774 -
Cost of sales (2,262,699) -
Gross profit 6,102,075 -
Administrative expenses (4,209,334) -
Depreciation and amortisation (714,250) -
Operating profit before exceptional items - all from acquisition 1,178,491 -
Exceptional item - IPO costs (746,055) (580,500)
Operating profit/(loss) 4 432,436 (580,500)
Finance income 6 6,059 -
Finance costs 7 (199,559) -
Profit/(loss) before taxation 238,936 (580,500)
Taxation 8 68,032 -
Profit/(loss) for the year/period 306,968 (580,500)
Other comprehensive income 145,913 - Exchange difference on translating foreign operations
Total comprehensive profit/(loss) for the year/period 452,881 (580,500)
Earnings/(loss) per share Basic and diluted earnings/(loss) per share – continuing and total operations 11 1.3 pence (4.9) pence
Consolidated statement of comprehensive incomeFor the year ended 30 September 2016
All transactions are attributable to the owners of the parent. The Group has no other recognised gains or losses for the current year. * Comprises the plc Parent Company only, as the Group came into existence on 18 March 2016.

32 | Cerillion plc Annual Report and Accounts 2016
Consolidated statement of financial positionFor the year ended 30 September 2016
Group As at As at 30 September 2016 30 September 2015* Notes £ £
ASSETS
Non-current assets
Goodwill 12 2,053,141 -
Intangible assets 12 6,979,370 -
Property, plant and equipment 13 411,505 -
Deferred tax assets 15 320,546 -
9,764,562 -
Current assets
Trade and other receivables 16 9,164,872 44,523
Cash and cash equivalents 5,006,185 14,841
14,171,057 59,364
TOTAL ASSETS 23,935,619 59,364
LIABILITIES
Non-current liabilities
Borrowings 19 (3,572,602) -
Other payables 18 (120,000) -
Deferred tax liabilities 15 (1,280,805) -
(4,973,407) -
Current liabilities
Trade and other payables 17 (5,007,214) (624,204)
Borrowings 17 (1,000,000) -
(6,007,214) (624,204)
TOTAL LIABILITIES (10,980,621) (624,204)
NET ASSETS/ (LIABILITIES) 12,954,998 (564,840)
EQUITY ATTRIBUTABLE TO SHAREHOLDERS
Share capital 22 147,567 15,660
Share premium account 13,318,725 -
Foreign exchange reserve 145,913 -
Retained loss (657,207) (580,500)
TOTAL EQUITY 12,954,998 (564,840)
The financial statements were approved and authorised for issue by the Board of Directors on 25 November 2016. Signed on behalf of the Board of Directors by:
L T HallDirectorCompany Number 09472870
The accompanying accounting policies and notes form an integral part of these financial statements. * Comprises the plc Parent Company only, as the Group came into existence on 18 March 2016.

Cerillion plc Annual Report and Accounts 2016 | 33
Company statement of financial positionFor the year ended 30 September 2016
Company As at As at 30 September 2016 30 September 2015* Notes £ £
ASSETS
Non-current assets
Investments in subsidiaries 14 14,651,571 -
14,651,571 -
Current assets
Trade and other receivables 16 57,490 44,523
Cash and cash equivalents 3,457,157 14,841
3,514,647 59,364
TOTAL ASSETS 18,166,218 59,364
LIABILITIES
Non-current liabilities
Borrowings 19 (3,572,602) -
(3,572,602) -
Current liabilities
Trade and other payables 17 (72,146) (624,204)
Borrowings 17 (1,000,000) -
(1,072,146) (624,204)
TOTAL LIABILITIES (4,644,748) (624,204)
NET ASSETS/ (LIABILITIES) 13,521,470 (564,840)
EQUITY ATTRIBUTABLE TO SHAREHOLDERS
Share capital 22 147,567 15,660
Share premium account 13,318,725 -
Retained profit/(loss) 55,178 (580,500)
TOTAL EQUITY 13,521,470 (564,840)
The financial statements were approved and authorised for issue by the Board of Directors on 25 November 2016. Signed on behalf of the Board of Directors by:
L T HallDirectorCompany Number 09472870
The accompanying accounting policies and notes form an integral part of these financial statements. * Comprises the plc Parent Company only, as the Group came into existence on 18 March 2016.

34 | Cerillion plc Annual Report and Accounts 2016
Consolidated statement of cash flowsFor the year ended 30 September 2016
Group Period from Year to 5 March 2015 to 30 September 2016 30 September 2015* Notes £ £
Cash flows from operating activities
Profit/(loss) for the year/period 306,968 (580,500)
Adjustments for:
Taxation (68,032) -
Finance income (6,059) -
Finance costs 199,559 -
Depreciation 142,695 -
Amortisation 571,555 -
1,146,686 (580,500)
Increase in trade and other receivables (1,765,866) (44,523)
(Decrease)/increase in trade and other payables (101,524) 624,204
Cash used in operations (720,704) (819)
Finance costs (72,981) -
Finance income 6,059 -
Tax paid (30,511) -
NET CASH USED IN OPERATING ACTIVITIES (818,137) (819)
Cash flows from investing activities
Acquisition of subsidiary undertakings, net of cash and overdrafts acquired 2 (11,129,200) -
Capitalisation of development costs (601,111) -
Purchase of property, plant and equipment (136,993) -
NET CASH USED IN INVESTING ACTIVITIES (11,867,304) -
Cash flows from financing activities
Proceeds from issue of equity shares 13,450,632 15,660
Borrowings repaid (427,398) -
Borrowings received 5,000,000 -
Dividends paid (383,675) -
NET CASH GENERATED FROM FINANCING ACTIVITIES 17,639,559 15,660
NET INCREASE IN CASH AND CASH EQUIVALENTS 4,954,118 14,841
Translation differences 37,226 -
Cash and cash equivalents at beginning of year/period 14,841 -
CASH AND CASH EQUIVALENTS AT END OF YEAR/PERIOD 5,006,185 14,841
The accompanying accounting policies and notes form an integral part of these financial statements. * Comprises the plc Parent Company only, as the Group came into existence on 18 March 2016.

Cerillion plc Annual Report and Accounts 2016 | 35
Company statement of cash flowsFor the year ended 30 September 2016
Company Period from Year to 5 March 2015 to 30 September 2016 30 September 2015* Notes £ £
Cash flows from operating activities
Profit/(loss) for the year/period 1,019,353 (580,500)
Adjustments for:
Finance costs 77,770 -
1,097,123 (580,500)
Increase in trade and other receivables (12,967) (44,523)
(Decrease)/increase in trade and other payables (557,226) 624,204
Cash generated from/(used in) operations 526,930 (819)
Finance costs (72,602) -
NET CASH GENERATED FROM/(USED IN) OPERATING ACTIVITIES 454,328 (819)
Cash flows from investing activities
Acquisition of subsidiary undertakings 2 (14,651,571) -
NET CASH USED IN INVESTING ACTIVITIES (14,651,571) -
Cash flows from financing activities
Proceeds from issue of equity shares 13,450,632 15,660
Borrowings repaid (427,398) -
Borrowings received 5,000,000 -
Dividends paid (383,675) -
NET CASH GENERATED FROM FINANCING ACTIVITIES 17,639,559 15,660
NET INCREASE IN CASH AND CASH EQUIVALENTS 3,442,316 14,841
Cash and cash equivalents at beginning of year/period 14,841 -
CASH AND CASH EQUIVALENTS AT END OF YEAR/PERIOD 3,457,157 14,841

36 | Cerillion plc Annual Report and Accounts 2016
Consolidated statement of changes in equityFor the year ended 30 September 2016
Ordinary Foreign share Share exchange Retained capital premium reserve Earnings Total Group £ £ £ £ £
Balance at 5 March 2015 - - - - -
Loss for the period - - - (580,500) (580,500)
Total comprehensive income* - - - (580,500) (580,500)
Transactions with owners:
Issue of shares on incorporation 15,660 - - - 15,660
Balance as at 30 September 2015* 15,660 - - (580,500) (564,840)
Ordinary Foreign share Share exchange Retained capital premium reserve Earnings Total £ £ £ £ £
Balance at 1 October 2015 15,660 - - (580,500) (564,840)
Profit for the year - - - 306,968 306,968
Other comprehensive income:
Exchange differences on translating - - 145,913 - 145,913 foreign operations
Total comprehensive income - - 145,913 306,968 452,881
Transactions with owners:
Issue of shares 131,907 13,318,725 - - 13,450,632
Dividends - - - (383,675) (383,675)
Total transactions with owners 131,907 13,318,725 - (383,675) 13,066,957
Balance as at 30 September 2016 147,567 13,318,725 145,913 (657,207) 12,954,998
The accompanying accounting policies and notes form an integral part of these financial statements. * Comprises the plc Parent Company only, as the Group came into existence on 18 March 2016.

Cerillion plc Annual Report and Accounts 2016 | 37
Company statement of changes in equityFor the year ended 30 September 2016
Ordinary share Share Retained capital premium Earnings Total Company £ £ £ £
Balance at 5 March 2015 - - - -
Loss for the period - - (580,500) (580,500)
Total comprehensive income - - (580,500) (580,500)
Transactions with owners:
Issue of shares on incorporation 15,660 - - 15,660
Balance as at 30 September 2015 15,660 - (580,500) (564,840)
Ordinary share Share Retained capital premium Earnings Total £ £ £ £
Balance at 1 October 2015 15,660 - (580,500) (564,840)
Profit for the year - - 1,019,353 1,019,353
Total comprehensive income - - 1,019,353 1,019,353
Transactions with owners:
Issue of shares 131,907 13,318,725 - 13,450,632
Dividends - - (383,675) (383,675)
Total transactions with owners 131,907 13,318,725 (383,675) 13,066,957
Balance as at 30 September 2016 147,567 13,318,725 55,178 13,521,470
The accompanying accounting policies and notes form an integral part of these financial statements.

38 | Cerillion plc Annual Report and Accounts 2016
1. Critical accounting estimates and judgmentsThe preparation of Financial Statements under IFRS requires the use of certain critical accounting assumptions, and requires
management to exercise its judgment and to make estimates in the process of applying Cerillion’s accounting policies.
JudgmentsCapitalisation of development costs
Development costs are capitalised only after the technical and commercial feasibility of the asset for sale or use have been
established. This is determined by our intention to complete and/or use the intangible asset. The future economic benefits of the
asset are reviewed using detailed cash flow projections. The key judgment is whether there will be a market for the products once
they are available for sale.
Revenue recognition
Revenue is recognised on the basis of implementation of the project. In respect of long term contracts, the revenue is in line
with percentage completed in terms of effort to date as a percentage of total forecast effort. Total forecast is prepared by project
managers on a monthly basis and reviewed by the project office and senior management team on a monthly basis. The key
judgment is accurately forecasting the effort required to complete the project.
Business combinations
The legal and accounting acquirer is Cerillion plc. Cerillion plc acquired Cerillion Technologies Limited on 18 March 2016 for
£14.6m, which was funded by a new fund raise and bank debt. The acquisition was to facilitate an exit for Cerillion’s previous
venture capital majority shareholders who were bought out in full for cash.
EstimatesBusiness combinations
Management uses valuation techniques in determining the fair values of various elements of a business combination.
On initial recognition, the assets and liabilities of the acquired business are included in the consolidated statement of financial
position at their provisional fair values. In measuring fair value, management uses estimates about future cash flows and discount
rates, however, actual results may vary. See Note 2.
Depreciation and amortisation
Depreciation and amortisation rates are based on estimates of the useful economic lives and residual values of the assets involved.
The assessment of these useful economic lives is made by projecting the economic lifecycle of the asset. The key judgment is
estimating the useful economic life of the development costs capitalised, a review is conducted annually by project. Depreciation
and amortisation rates are changed where economic lives are re-assessed and technically obsolete items written off where
necessary. Refer to Notes 12 and 13.
Notes to the financial statementsFor the year ended 30 September 2016

Cerillion plc Annual Report and Accounts 2016 | 39
2. AcquisitionsThe Company's controlling interest in its directly held subsidiary, Cerillion Technologies Limited, was acquired through a business
combination as defined in IFRS 3 Business Combinations. As such the acquisition method of accounting for this transaction has
been followed.
The details of the business combination are as follows:
Fair value Book value adjustments Fair value £ £ £
Recognised amounts of identifiable net assets
Property, plant and equipment 400,799 400,799
Intangible assets 80,000 6,949,814 7,029,814
Deferred tax 354,054 354,054
Total non-current assets 834,853 6,949,814 7,784,667
Trade and other receivables 7,354,483 - 7,354,483
Cash and cash equivalents 3,522,371 - 3,522,371
Total current assets 10,876,854 - 10,876,854
Other non-current liabilities (120,000) (120,000)
Deferred tax liabilities (70,660) (1,320,465) (1,391,125)
Total non-current liabilities (190,660) (1,320,465) (1,511,125)
Trade and other payables (4,471,966) - (4,471,966)
Total current liabilities (4,471,966) - (4,471,966)
Identifiable net assets 7,049,081 5,629,349 12,678,430
Goodwill arising on acquisition (Note 12) 1,973,141
Fair value of consideration transferred
Amount settled in cash 14,651,571
Total purchase consideration 14,651,571
Analysis of cash flows on acquisition
Purchase consideration transferred settled in cash 14,651,571
Cash and cash equivalents acquired (3,522,371)
Net cash flow on acquisition 11,129,200
Acquisition costs charged to expenses 746,055
The legal and accounting acquirer is Cerillion plc. Cerillion plc acquired Cerillion Technologies Limited on 18 March 2016 for
£14.6m, which was funded by a new fund raise and bank debt. The acquisition was to facilitate an exit for Cerillion’s previous
venture capital majority shareholders who were bought out in full for cash.

40 | Cerillion plc Annual Report and Accounts 2016
Notes to the financial statementsFor the year ended 30 September 2016Continued
2. Acquisitions (Continued)Consideration transferred
Cerillion plc paid £14,651,571 cash on 18 March 2016 for 100% of the share capital and voting rights of Cerillion
Technologies Limited.
IPO costs amounting to £746,055 (2015: £580,500) are not included as part of consideration transferred and have been
recognised as an expense in the consolidated statement of profit or loss and are disclosed as exceptional items on the face of the
income statement.
Identifiable net assets
Net assets excluding intangibles of £5,648,616 and separately identified intangible net assets of £7,029,814 were acquired.
The separately identified intangible net assets were made up of the current fair value of existing support and maintenance
contracts (£4.38m) and IPR (£2.57m). The current fair value was calculated based on an estimate of future profits from these
sources using a Weighted Average Cost of Capital (WACC) of 12.7%.
Goodwill
Goodwill arising on this transaction amounted to £1,973,141, of which £1,320,465 related to deferred tax arising on the
provisional intangible assets recognised on the acquisition. The remaining goodwill of £652,676 is primarily related to growth
expectations, expected future profitability, the substantial skill and expertise of Cerillion Technologies’ workforce and expected cost
synergies.
Goodwill has not been allocated to a particular segment and is not expected to be deductible for tax purposes.
Cerillion Technologies Limited’s contribution to the Group results
In consequence, the consolidated financial statements for Cerillion plc report the result of operations for the period from date of
acquisition being 18 March 2016 to 30 September 2016. Similarly, the consolidated balance sheet and other financial information
have been presented as though the assets and liabilities were acquired on 18 March 2016.
Cerillion Technologies Limited Group generated revenues of £8,364,774 and a profit of £1,578,822 for the period from 18 March
2016 to 30 September 2016. If Cerillion Technologies Limited Group had been acquired on 1 October 2015, revenue of the Group
for 2015 would have been £14,809,939, and profit for the year would have been £2,154,308.

Cerillion plc Annual Report and Accounts 2016 | 41
3. Segment informationDuring the year ended 30 September 2016, the Group was organised into four main business segments for revenue purposes.
Under IFRS 8 there is a requirement to show the profit or loss for each reportable segment and the total assets and total liabilities
for each reportable segment if such amounts are regularly provided to the chief operating decision-maker.
In respect of the profit or loss for each reportable segment, the expenses are not reported by segment and cannot be allocated on
a reasonable basis and, as a result, the analysis is limited to the Group revenue.
Assets and liabilities are used or incurred across all segments and therefore are not split between segments.
Period from Year to 5 March 2015 to 30 September 2016 30 September 2015* £ £
Revenue
Services 5,358,998 -
Software 2,467,507 -
Software-as-a-Service 147,266 -
Third party 391,003 -
Total revenue 8,364,774 -
Geographical informationAs noted above, the internal reporting of the Group’s performance does not require that the statement of financial position
information is gathered on the basis of the business streams. However, the Group operates within discrete geographical markets
such that capital expenditure, total assets and net assets of the Group are split between these locations as follows:
Europe MEA Americas APAC £ £ £ £
Year ended 30 September 2016
Revenue 1,851,745 888,575 4,835,022 789,432
Capital expenditure 686,774 - - 51,330
Total assets 23,392,783 - - 542,836
Net assets 12,397,168 - - 557,830
Cerillion receives greater than 10% of revenue from individual customers in the following geographical regions:
Operating 2016 segment £
Customer
No. 1 Americas 4,239,879
No. 2 MEA 859,256
The Group had no revenue or capital expenditure for the year ended 30 September 2015 and all the assets and liabilities were
within the UK based Parent Company (Europe segment).
* Comprises the plc Parent Company only, as the Group came into existence on 18 March 2016.

42 | Cerillion plc Annual Report and Accounts 2016
Notes to the financial statementsFor the year ended 30 September 2016Continued
4. Operating profit/(loss) Period from Year to 5 March 2015 to 30 September 2016 30 September 2015* £ £
Operating profit/(loss) is stated after (crediting)/charging:
Depreciation 142,695 -
Amortisation of intangibles 571,555 -
Research and development costs 172,978 -
Exceptional item - IPO costs 746,055 580,500
Bad debt expense 495,649 -
Foreign exchange gains (544,389) -
Operating leases 412,852 -
Fees payable to Cerillion’s principal auditor:
- Audit of Cerillion plc’s annual accounts 5,000 5,000
- Audit of subsidiaries 40,000 -
- Non-audit services – tax services 12,400 -
- Non-audit services – corporate finance 145,000 -
- Non-audit services – other 8,000 -
Fees payable to associates of principal auditor:
- Audit of subsidiaries 8,000 -
- Non-audit services – tax services 13,200 -
The Company did not generate revenue during the period to 30 September 2015. Expenses in that period related to professional
fees in relation to the admission of the Company to AIM.
* Comprises the plc Parent Company only, as the Group came into existence on 18 March 2016.
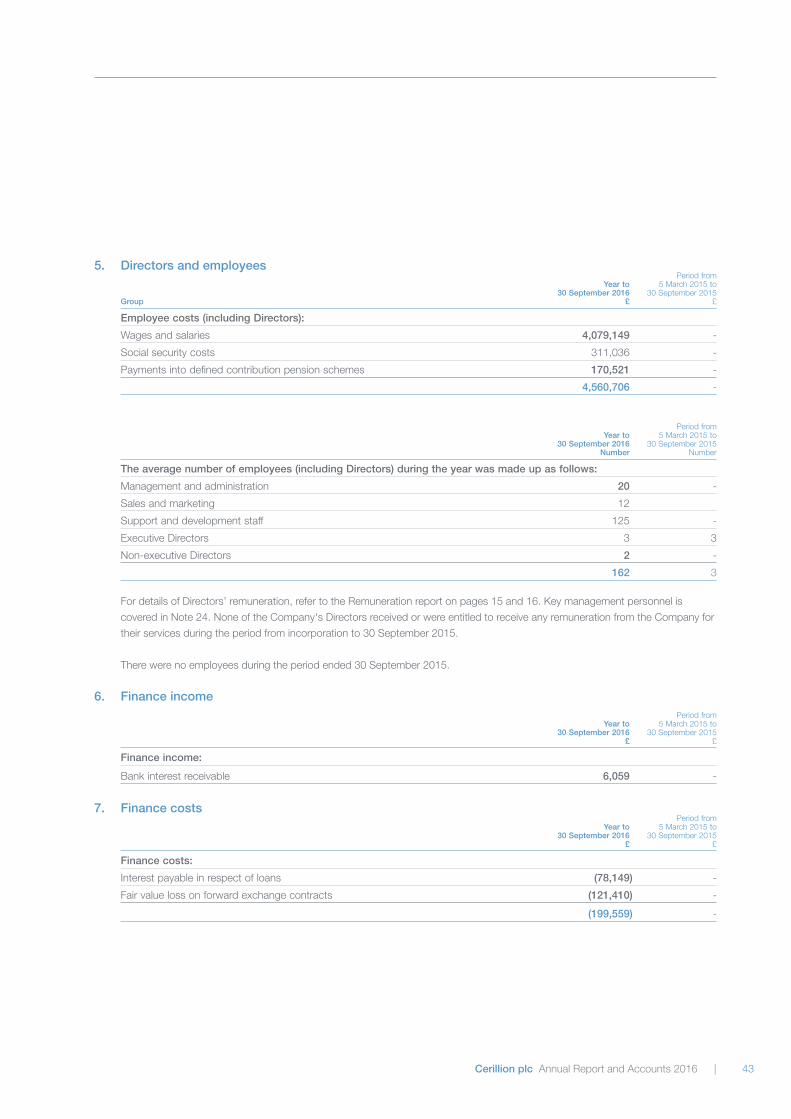
Cerillion plc Annual Report and Accounts 2016 | 43
5. Directors and employees Period from Year to 5 March 2015 to 30 September 2016 30 September 2015 Group £ £
Employee costs (including Directors):
Wages and salaries 4,079,149 -
Social security costs 311,036 -
Payments into defined contribution pension schemes 170,521 -
4,560,706 -
Period from Year to 5 March 2015 to 30 September 2016 30 September 2015 Number Number
The average number of employees (including Directors) during the year was made up as follows:
Management and administration 20 -
Sales and marketing 12
Support and development staff 125 -
Executive Directors 3 3
Non-executive Directors 2 -
162 3
For details of Directors’ remuneration, refer to the Remuneration report on pages 15 and 16. Key management personnel is
covered in Note 24. None of the Company's Directors received or were entitled to receive any remuneration from the Company for
their services during the period from incorporation to 30 September 2015.
There were no employees during the period ended 30 September 2015.
6. Finance income Period from Year to 5 March 2015 to 30 September 2016 30 September 2015 £ £
Finance income:
Bank interest receivable 6,059 -
7. Finance costs Period from Year to 5 March 2015 to 30 September 2016 30 September 2015 £ £
Finance costs:
Interest payable in respect of loans (78,149) -
Fair value loss on forward exchange contracts (121,410) -
(199,559) -

44 | Cerillion plc Annual Report and Accounts 2016
Notes to the financial statementsFor the year ended 30 September 2016Continued
8. TaxationAnalysis of tax charge for the year/periodThe tax charge for the Group is based on the profit/(loss) for the year/period and represents:
Period from Year to 5 March 2015 to 30 September 2016 30 September 2015 £ £
Current tax (credit)/expense (3,804) -
Deferred tax (credit)/charge (64,228) -
Total tax (credit)/charge (68,032) -
Factors affecting total tax for the year/periodThe tax assessed for the year/period differs from the standard rate of corporation tax in the United Kingdom 20.0% (2015: 20.0%).
The differences are explained as follows:
Profit/(loss) on ordinary activities before tax 238,936 (580,500)
Profit/(loss) on ordinary activities multiplied by standard rate of 47,787 (116,100) corporation tax in the United Kingdom of 20.0% (2015: 20.0%)
Effect of:
Expenses not deductible for tax purposes 195,446 116,100
Difference in tax rates 23,506 -
Other temporary differences (120,470) -
Surrender of tax losses 29,113 -
Losses carried forward 26,918 -
R&D tax credit payable (21,107) -
Enhanced relief for research and development (249,225) -
Total tax (credit)/charge (68,032) -
There are currently no deferred tax assets or liabilities recognised within the Parent Company accounts. Taxable losses within
the Parent Company totalling £134,591 (2015: £nil) have been carried forward, but no deferred tax asset has been recognised in
relation to these losses due to the uncertainty surrounding the timing of their recovery.
9. Profit/(loss) attributable to Cerillion plcThe profit/(loss) for the financial year/period of the Parent Company, Cerillion plc was £1,019,353 (2015: loss £580,500).
As permitted by section 408 of the Companies Act 2006, no separate income statement is presented in respect of the
Parent Company.
10. DividendsDividends paid during the reporting periodThe Board declared a maiden interim dividend of 1.3p (2015: nil pence) per share totalling £383,675 (2015: £nil) in line with the
Company’s dividend policy, which was paid on 23 June 2016.
Dividends not recognised at the end of the reporting periodSince the year end, the Directors have proposed the payment of a dividend in respect of the full financial year of 2.6p per fully paid
Ordinary share (2015: £nil). The aggregate amount of the proposed dividend expected to be paid out of retained earnings at 30
September 2016, but not recognised as a liability at the year end, is £767,351 (2015: £nil).

Cerillion plc Annual Report and Accounts 2016 | 45
11. Earnings/(loss) per shareBasic earnings/(loss) per share is calculated by dividing the profit/(loss) attributable to equity holders of the Company by the
weighted average number of Ordinary Shares in issue during the year/period. The A Ordinary Shares in existence as at 30
September 2015 have been classified as a liability and are therefore excluded from the earnings per share calculation.
Period from Year to 5 March 2015 to 30 September 2016 30 September 2015
Profit/(loss) attributable to equity holders of the Company (£) 306,968 (580,500)
Weighted average number of Ordinary Shares in issue (number) 23,425,877 11,872,791
Basic and diluted earnings/(loss) per share (pence per share) 1.3 (4.9)
There were no potentially dilutive equity instruments in issue during the year/period.
12. Intangible assets Purchased Intellectual Software customer property development Goodwill contracts rights costs Total Group £ £ £ £ £
Cost
At incorporation - - - - -
Additions - - - - -
At 30 September 2015 - - - - -
Acquired 80,000 4,382,654 2,567,160 - 7,029,814
Arising on acquisition 1,973,141 - - - 1,973,141
Additions - - - 601,111 601,111
At 30 September 2016 2,053,141 4,382,654 2,567,160 601,111 9,604,066
Amortisation
At incorporation - - - - -
Provided in the year - - - - -
At 30 September 2015 - - - - -
Provided in the year - 313,047 183,369 75,139 571,555
At 30 September 2016 - 313,047 183,369 75,139 571,555
Net book amount at 2,053,141 4,069,607 2,383,791 525,972 9,032,511 30 September 2016
Net book amount at - - - - - 30 September 2015
Amortisation has been included in administrative expenses in the statement of comprehensive income.
The carrying value of goodwill included within the Cerillion plc balance sheet is £2,053,141, which is allocated to the cash-
generating unit (“CGU”) of Cerillion Technologies Limited Group. The CGU's recoverable amount has been determined based on
its fair value less costs to sell. As Cerillion plc was established to purchase the CTL Group, the fair value less costs to sell has been
calculated based on the market capitalisation of Cerillion plc less the estimated costs to sell the CTL Group.

46 | Cerillion plc Annual Report and Accounts 2016
Notes to the financial statementsFor the year ended 30 September 2016Continued
12. Intangible assets (Continued)Using an average market share price of Cerillion plc for the period from listing to 30 September 2016, less an estimate of costs to
sell, there is significant headroom above the carrying value of the cash-generating unit and therefore no impairment exists.
The calculations show that a reasonably possible change in the share price, as assessed by the Directors, would not cause the
carrying amount of the CGU to exceed its recoverable amount.
13. Property plant and equipment
Leasehold Computer Furniture improvements equipment and fittings Total Group £ £ £ £
Cost
At incorporation - - - -
Additions - - - -
Exchange difference - - - -
At 30 September 2015 - - - -
Acquisition 588,807 3,221,908 759,094 4,569,809
Additions - 126,448 10,545 136,993
Exchange difference 16,406 12,910 9,524 38,840
At 30 September 2016 605,213 3,361,266 779,163 4,745,642
Depreciation
At incorporation - - - -
Provided in the year - - - -
Exchange difference - - - -
At 30 September 2015 - - - -
Acquisition 573,895 2,848,847 746,268 4,169,010
Provided in the year 8,916 125,472 8,307 142,695
Exchange difference 11,582 5,064 5,786 22,432
At 30 September 2016 594,393 2,979,383 760,361 4,334,137
Net book amount at 30 September 2016 10,820 381,883 18,802 411,505
Net book amount at 30 September 2015 - - - -
All depreciation charges are included within administrative expenses and no impairment has been charged.
As referred to in Note 19, the Group’s loan is secured over all the assets of the Group (2015: £nil).
There were no property, plant and equipment assets owned by the Parent Company.

Cerillion plc Annual Report and Accounts 2016 | 47
14. Investments in subsidiariesThe GroupAt 30 September 2016, the Company’s subsidiary undertakings, all of which have been included in the Group financial statements,
were:
Country of Percentage of Nature of Name incorporation shares held Year end Business
Cerillion Technologies Limited* UK 100% 30 September Software services
Cerillion Inc USA 100% 30 September Software services
Cerillion Technologies (India) Private Limited India **100% 31 March*** Software services
* Cerillion Technologies Limited is the only subsidiary owned directly by Cerillion plc. Cerillion Technologies Limited is the parent for the other two subsidiaries ** includes holdings held indirectly through Cerillion Inc *** For the purpose of the Group financial statements for the year ended 30 September 2016, management accounts have been drawn up to 30 September 2016.
Investments in subsidiary undertakings The Company £
Cost and net book value:
As at incorporation -
Additions -
As at 30 September 2015 -
Additions 14,651,571
As at 30 September 2016 14,651,571
15. Deferred taxDeferred tax asset Accelerated Other capital temporary allowances differences Total Group £ £ £
1 October 2015 - - -
Deferred tax asset acquired 169,888 184,166 354,054
Foreign exchange movement on opening deferred tax asset - 12,584 12,584
(Charged)/credited to profit or loss (56,242) 10,150 (46,092)
30 September 2016 113,646 206,900 320,546

48 | Cerillion plc Annual Report and Accounts 2016
Notes to the financial statementsFor the year ended 30 September 2016Continued
15. Deferred tax (Continued)Deferred tax liabilityGroup
The deferred tax liability arose in respect of the fair value uplift of intangible assets, with £1,320,465 arising on the acquisition
of Cerillion Technologies Limited in March 2016 and £70,660 relating to the acquisition of “Net Solutions Services” by Cerillion
Technologies Limited in 2015.
Fair value uplift on acquisitions
£
At 1 October 2015 -
Deferred tax liability acquired 70,660
Deferred tax arising on acquisition of Cerillion Technologies Limited 1,320,465
(Credited)/charged to profit or loss (110,320)
As at 30 September 2016 1,280,805
There are no deferred tax assets or deferred tax liabilities recognised within the Parent Company as at 30 September 2016
(2015: £nil).
16. Trade and other receivables
The Group The Company 2016 2015 2016 2015 £ £ £ £
Trade receivables 2,894,015 - - -
Accrued income 5,565,952 - - -
Unpaid share capital (Note 24) - 44,523 - 44,523
Amounts owed by Group undertakings - - 54,238 -
Other receivables 464,500 - - -
Prepayments 240,405 - 3,252 -
9,164,872 44,523 57,490 44,523
For the period ended 30 September 2015, as shown in Note 24, the unpaid share capital is due from the Directors. The amount
shown was expected to be repaid within 12 months from 30 September 2015 and was repaid as part of the Admission to AIM, as
disclosed in Note 22.
Credit quality of receivables
A detailed review of the credit quality of each client is completed before an engagement commences and the concentration of
credit risk is limited as exposure is spread over a large number of clients.
The credit risk relating to trade receivables is analysed as follows:
2016 2015 £ £
Group
Trade receivables 3,598,795 -
Bad debt provision (704,780) -
2,894,015 -

Cerillion plc Annual Report and Accounts 2016 | 49
The Parent Company had no trade receivables in either period. The bad debt provision in the CTL Group on acquisition totalled
£209,131, which has increased by £495,649 during the period post acquisition to give a year end provision of £704,780.
The other classes of assets within trade and other receivables do not contain impaired assets.
The net carrying value is judged to be a reasonable approximation of fair value.
The following is an ageing analysis of those trade receivables that were not past due and those that were past due but not
impaired. These relate to a number of independent customers for whom there is no recent history of default.
2016 2015 £ £
Group
Not past due 983,403 -
Up to three months 973,520 -
Three to six months 291,492 -
Older than six months 645,600 -
2,894,015 -
Of the trade debt older than 6 months as at 30 September 2016, being £645,600, cash of £514,267 has been received since
the year end.
The following is an ageing analysis of those trade receivables that were individually considered to be impaired:
2016 2015 £ £
Group
Not past due 108,206 -
Up to three months 322,086 -
Three to six months 133,913 -
Older than six months 140,575 -
704,780 -
17. Trade and other payables
The Group The Company 2016 2015 2016 2015 £ £ £ £
Trade payables 336,684 - 16,564 -
Taxation 99,714 - - -
Other taxation and social security 255,876 - 41,312 -
Pension contributions 38,653 - - -
Other payables 453,212 - - -
Derivative financial instrument 121,410 - - -
Accruals 1,729,473 580,500 14,270 580,500
Deferred income 1,972,192 - - -
Redeemable A Ordinary Shares - 43,704 - 43,704
Loans (Note 19) 1,000,000 - 1,000,000 -
6,007,214 624,204 1,072,146 624,204
The Directors consider that the carrying amount of trade and other payables approximates to their fair values.

50 | Cerillion plc Annual Report and Accounts 2016
Notes to the financial statementsFor the year ended 30 September 2016Continued
17. Trade and other payables (Continued)In respect of the period ended 30 September 2015:The accruals were for the non-contingent element of professional fees incurred up to the balance sheet date in connection
with the admission of the Company’s shares to trading on AIM and the acquisition of the issued share capital of Cerillion Technologies
Limited.
The A Ordinary Shares have attached to them full voting, dividend and capital distribution rights. The holders of a majority of A
Ordinary Shares may redeem all or any of the A Ordinary Shares at any time. Upon redemption the Company shall pay each holder
of A Ordinary Shares a price per share equal to the amounts subscribed or deemed to be subscribed. These were redeemed as
part of the IPO.
18. Non-current other payables
The Group The Company 2016 2015 2016 2015 £ £ £ £
Other payables 120,000 - - -
120,000 - - -
Other payables comprise the amount outstanding on the purchase of the “Net Solutions Services” business by Cerillion
Technologies Limited during its year ended 30 September 2015. The total balance outstanding at 30 September 2016 is £240,000
and is payable by two further equal instalments of £120,000 each on 2 March 2017 (shown in current liabilities) and 2018. The
amount is unsecured and interest free. The Directors consider the fair value of deferred consideration to be approximately equal to
the carrying amount.
19. Borrowings and financial liabilities
The Group The Company 2016 2015 2016 2015 £ £ £ £
Current liabilities:
Secured loans 1,000,000 - 1,000,000 -
Non-current liabilities:
Secured loans 3,572,602 - 3,572,602 -
4,572,602 - 4,572,602 -
19a Terms and repayment scheduleThe Facility Agreement between the Company and HSBC Bank plc made available a loan of up to £5 million (the “Loan”) for the
purpose of assisting with the payment of the cash element of the Acquisition.
The Loan is secured over the assets of the Group and was drawn down in full in March 2016. The terms and conditions of
outstanding loans are as follows:
a. it bears interest at the rate of 2.5 per cent. per annum over the Bank of England Base Rate as published from time to time;
b. is repayable by the Company by quarterly repayments in the amount of £250,000 inclusive of interest, for the first three years
of the term, and thereafter in an amount of £300,000 inclusive of interest, in accordance with an agreed repayment schedule;
c. is terminable on a change of control of the Company and repayable following an event of default; and
d. is for a term of five years from the date of first drawdown.

Cerillion plc Annual Report and Accounts 2016 | 51
20. Financial instruments and risk management
Group 2016 2015 Financial instruments by category £ £
Financial assets - loans and receivables
Trade and other receivables 3,358,515 -
Accrued income 5,565,952 -
Unpaid share capital - 44,523
Cash and cash equivalents 5,006,185 14,841
13,930,652 59,364
Prepayments are excluded, as this analysis is required only for financial instruments.
Financial liabilities - held at 2016 2015 amortised cost £ £
Non-current
Borrowings 3,572,602 -
Other payables 120,000 -
3,692,602 -
Current
Current borrowings 1,000,000 -
Trade and other payables 1,045,772 -
Pension costs 38,653 -
Accruals 1,729,473 580,500
3,813,898 580,500
Statutory liabilities and deferred income are excluded from the trade payables balance, as this analysis is required only for financial
instruments.
Financial liabilities - at fair value through profit and loss
Derivative financial instruments 121,410 -
121,410 -
There is no material difference between the book value and the fair value of the financial assets and financial liabilities disclosed above.
The Group’s multinational operations expose it to financial risks that include market risk, credit risk, foreign currency risk and
liquidity risk. The Directors review and agree policies for managing each of these risks and they are summarised below. These
policies have remained unchanged from previous years, with the exception of currency risk where forward currency contracts have
been entered into during the year.

52 | Cerillion plc Annual Report and Accounts 2016
Notes to the financial statementsFor the year ended 30 September 2016Continued
20. Financial instruments and risk management (Continued)Credit quality of financial assetsThe credit quality of financial assets that are neither past due nor impaired can be assessed by reference to external credit ratings
(S&P) (if available) or to historical information about counterparty default rates:
2016 2015 £ £
Trade receivables
Group 1 131,788 -
Group 2 2,677,325 -
Group 3 84,902 -
2,894,015 -
Group 1 – new customers (less than six months).
Group 2 – existing customers (more than six months) with no defaults in the past.
Group 3 – existing customers (more than six months) with some defaults in the past.
2016 2015 £ £
Cash at bank and short-term deposits
A1 5,003,700 14,841
Not rated 2,485 -
5,006,185 14,841
A1 rating means that the risk of default for the investors and the policy holder is deemed to be very low.
Not rated balances relate to petty cash amounts.
Market risk – foreign exchange riskExposures to currency exchange rates arise from the Group’s overseas sales and purchases, which are primarily denominated in
US Dollars (USD), Australian Dollars (AUD) and Euros (EUR). There is no foreign exchange exposure within the Parent Company
and there were no foreign currency balances in the period ended 30 September 2015.
To mitigate the Group’s exposure to foreign currency risk, non-GBP cash flows are monitored and forward exchange contracts
are entered into in accordance with the Group’s risk management policies. Generally, the Group’s risk management procedures
distinguish short-term foreign currency cash flows (due within six months) from longer-term cash flows (due after six months).
Where the amounts to be paid and received in a specific currency are expected to largely offset one another, no further hedging
activity is undertaken. Forward exchange contracts are mainly entered into for significant long-term foreign currency exposures
that are not expected to be offset by other same-currency transactions.
As at 30 September 2016 the Group had forward foreign exchange contracts in place to mitigate exchange rate exposure arising
from forecast income in US Dollars, Australian Dollars and Euros. The contracts are considered by management to be part of
economic hedge arrangements but have not been formally designated as hedging instruments, so are treated as held for trading
in accordance with IAS 39. The above contract is short term in nature and is due to be settled within 12 months of the year end.

Cerillion plc Annual Report and Accounts 2016 | 53
Foreign currency denominated financial assets and liabilities which expose the Group to currency risk are disclosed below. The
amounts shown are those reported to key management translated into GBP at the closing rate:
AUD USD EUR INR
30 September 2016
Financial assets 162,863 4,462,267 1,424,000 366,804
Financial liabilities (117,806) (1,259,697) (615,115) (329,079)
Total exposure 45,507 3,202,570 808,885 37,725
The following table illustrates the sensitivity of profit and equity in regards to the Group’s financial assets and financial liabilities and
the US Dollar, Australian Dollar, Euro and Indian Rupee to GBP exchange rate ‘all other things being equal’. It assumes a +/- 10%
change to each of the foreign currency to GBP exchange rates. These percentages have been determined based on the average
market volatility in exchange rates in the previous 12 months. The sensitivity analysis is based on the Group’s foreign currency
financial instruments held at each reporting date and also takes into account forward exchange contracts that offset effects from
changes in currency exchange rates.
If the GBP had strengthened against the foreign currencies by 10% then this would have had the following impact:
30 September 2016 AUD USD EUR INR
Loss for the year (4,096) (291,143) (73,535) (3,430)
Equity total (4,096) (291,143) (73,535) (3,430)
If the GBP had weakened against the foreign currencies by 10% then this would have had the following impact:
30 September 2016 AUD USD EUR INR
Profit for the year 5,006 355,841 89,876 4,192
Equity total 5,006 355,841 89,876 4,192
Exposures to foreign exchange rates vary during the year depending on the volume of overseas transactions. Nonetheless, the
analysis above is considered to be representative of the Group’s exposure to currency risk.
Market Risk – cash flow interest rate riskCerillion had outstanding borrowing within the Group and Company, as disclosed in Note 19.
These were loans taken out with HSBC to facilitate the purchase of shares prior to the Admission on AIM.
The Group’s policy is to minimise interest rate cash flow risk exposures on long-term financing. Longer-term borrowings are
therefore usually at fixed rates. At 30 September 2016, the Group is exposed to changes in market interest rates through bank
borrowings at variable interest rates. Other borrowings are at fixed interest rates. The exposure to interest rates for the Group’s
cash at bank and short-term deposits is considered immaterial.
The following table illustrates the sensitivity of profit and equity to a reasonably possible change in interest rates of +/- 1%. These
changes are considered to be reasonably possible based on observation of current market conditions. The calculations are based
on a change in the average market interest rate for each period, and the financial instruments held at each reporting date that are
sensitive to changes in interest rates. All other variables are held constant.
Profit for the year Equity +1% -1% +1% -1%
30 September 2016 (30,564) 30,499 (30,564) 30,499
30 September 2015 - - - -

54 | Cerillion plc Annual Report and Accounts 2016
Notes to the financial statementsFor the year ended 30 September 2016Continued
20. Financial instruments and risk management (Continued)Liquidity riskCerillion actively maintains cash that is designed to ensure Cerillion has sufficient available funds for operations and planned
expansions. The table below analyses Cerillion’s financial liabilities into relevant maturity groupings based on the remaining period
at the balance sheet date to the contractual maturity date. The amounts disclosed in the table are the contractual undiscounted
cash flows.
Less than Between 1 Between 2 Over 1 year and 2 years and 5 years 5 years
30 September 2016
Borrowings 1,000,000 1,000,000 2,572,602 -
Trade and other payables 5,007,214 120,000 - -
30 September 2015
Trade and other payables 624,204 - - -
Capital risk managementThe Group manages its capital to ensure it will be able to continue as a going concern while maximising the return to shareholders
through optimising the debt and equity balance.
The Group monitors cash balances and prepares regular forecasts, which are reviewed by the Board. Since the year end, the
Directors have proposed the payment of a dividend. In order to maintain or adjust the capital structure, the Group may, in the
future, adjust the amount of dividends paid to shareholders, return capital to shareholders, issue new shares or sell assets to
reduce debt.
21. Fair value measurement of financial instrumentsFinancial assets and financial liabilities measured at fair value are required to be grouped into three Levels of a fair value hierarchy.
The three Levels are defined, based on the observability of significant inputs to the measurement, as follows:
• Level 1: quoted prices (unadjusted) in active markets for identical assets and liabilities;
• Level 2: inputs other than quoted prices included within Level 1 that are observable for the asset or liability, either directly or
indirectly; and
• Level 3: unobservable inputs for the asset or liability.
The following table shows the Levels within the hierarchy of financial assets and liabilities measured at fair value on a recurring
basis at 30 September 2016; there were no financial asset or liabilities measured at fair value as at 30 September 2015:
Level 1 Level 2 Level 3 Total Classes of financial liabilities measured 2016 2016 2016 2016 at fair value – carrying amounts £ £ £ £
Derivative financial instruments - 121,410 - 121,410
There were no transfers between Level 1 and Level 2 in 2016 or 2015 and no derivative financial instruments within the
Parent Company.
Measurement of fair value of financial instrumentsThe Group’s finance team performs valuations of financial items for financial reporting purposes, with valuation techniques selected
based on the characteristics of each instrument, with the overall objective of maximising the use of market-based information. The
Group’s foreign currency forward contracts (Level 2) are not traded in active markets, so have been fair valued using observable
forward exchange rates corresponding to the maturity of the contract. The effects of non-observable inputs are not significant for
foreign currency forward contracts.

Cerillion plc Annual Report and Accounts 2016 | 55
22. Share capital 2016 2015 £ £
Issued, allotted, called up and fully paid (2015: one quarter paid): 29,513,486 (2015: 3,131,969) Ordinary shares of 0.5 pence 147,567 15,660
Nil (2015: 8,740,822 A Ordinary shares of 0.5 pence) - 43,704
The Ordinary Shares have been classified as Equity. The Ordinary Shares have attached to them full voting and capital
distribution rights.
The A Ordinary Shares in existence as at 30 September 2015 have been classified as a liability as disclosed in Note 17.
The Company does not have an authorised share capital.
On 30 September 2015, the issued share capital of the Company was £59,363.955 divided into 8,740,822 A ordinary shares of
£0.005 each with an amount paid up of £0.00125 per share and 3,131,969 ordinary shares of £0.005 each with an amount paid
up of £0.00125 per share.
On 3 November 2015, the amounts outstanding were fully paid up by way of irrevocable undertakings to pay from the shareholders.
Pursuant to a resolution of the Directors on 9 November 2015 and a general meeting of the Shareholders on 9 November 2015,
the 8,740,822 A ordinary shares of £0.005 each in the capital of the Company were redesignated as 8,740,822 Ordinary Shares.
Pursuant to a resolution of the Directors and a general meeting of the Company on 9 November 2015, and a subscription
agreement on the same date, Livingbridge VC LLP, on behalf of funds managed by it, subscribed for 5,263,158 Ordinary Shares
for an aggregate subscription price of £4 million.
By shareholder resolutions passed at the annual general meeting of the Company held on 11 March 2016:
a. the Directors were generally and unconditionally authorised in accordance with section 551 of the Act to exercise all of the
powers of the Company to allot Ordinary Shares up to an aggregate nominal amount of £61,887.69 as follows:
i. 4,482,800 Ordinary Shares pursuant to the Acquisition; and
ii. 7,894,737 Ordinary Shares pursuant to the Placing.
23. Retirement benefitsThe Group operates a Group personal contribution pension scheme for the benefit of the employees. The pension cost charge for
the year represents contributions payable by the Group to the fund and amounted to £170,521 (2015: £nil).

56 | Cerillion plc Annual Report and Accounts 2016
Notes to the financial statementsFor the year ended 30 September 2016Continued
24. Related party transactionsRemuneration of Key Management Personnel
The Group and Company consider that the Directors are their key management personnel and further detail of their remuneration
is disclosed in the Remuneration report for 2016.
No key personnel other than the Directors have been identified in relation to the period ended 30 September 2015 and no Director
remuneration took place in that period.
Related party transactions
As at the year ended 30 September 2015, the Directors owed the following amounts in respect of unpaid share capital:
O C R Gilchrist £2,687
L T Hall £32,778
G J O’Connor £9,058
The amounts were fully paid up on 3 November 2015 by way of an irrevocable undertaking to pay, which took place prior to IPO.
No further related party transactions took place during the period.
The Directors were remunerated by Cerillion Technologies Limited, an associated company, during the period ended
30 September 2015.
25. Future lease paymentsThe Group had commitments under non-cancellable operating leases in respect of land and buildings and plant and machinery.
The Group’s future minimum operating lease payments are as follows:
Period from Year to 5 March 2015 to 30 September 2016 30 September 2015 Group £ £
Within one year 541,268 -
Between one and five years 350,489 -
891,757 -
There are no lease commitments within the Parent Company.
26. Charge over assetsIn providing the Group with banking, credit card and forward currency facilities, the Group's bankers HSBC plc hold:
• a fixed charge over all present freehold and leasehold property;
• a first charge over book and other debts, chattels, goodwill and uncalled capital, both present and future; and
• a first floating charge over all assets, both present and future.
27. Subsequent eventsSince the balance sheet date of 30 September 2016, there have been no subsequent events requiring disclosure.
28. Ultimate controlling party In the opinion of the Directors, there was no ultimate controlling party at 30 September 2016. Louis Tancred Hall was the ultimate
controlling party of the Company as at 30 September 2015.

Cerillion plc Annual Report and Accounts 2016
Company Information
Company registration number: 09472870
Registered office: 125 Shaftesbury Avenue
London
WC2H 8AD
Directors: O C R Gilchrist
L T Hall
G J O’Connor
A M Howarth
M Dee
Secretary: O C R Gilchrist
Bankers: HSBC Jersey
HSBC House
St Helier
Jersey
JE1 1HS
Solicitors: Orrick, Herrington & Sutcliffe (Europe) LLP
107 Cheapside
London
EC2V 6DN
Nominated Adviser: Shore Capital and Corporate Limited
Bond Street House
14 Clifford Street
London
W1S 4JU
Auditor: Grant Thornton UK LLP
Registered Auditor
Chartered Accountants
Grant Thornton House
Melton Street
Euston Square
London
NW1 2EP

Cerillion plc 125 Shaftesbury Avenue London WC2H 8AD United Kingdom
Tel: +44 20 7927 6000 Fax: +44 20 7927 6006
Email: [email protected] Web: www.cerillion.com
Cerillion plcAnnual Report and Accounts 2016
An innovator in billing, charging and customer management software


