An Integrated Approach Utilizing Liquid Separations, Protein Microarrays and Tandem Mass Spectrometry Towards Understanding Phosphorylation, Glycosylation and Humoral Response Changes in Cancer. by Tasneem H. Patwa A dissertation submitted in partial fulfillment of the requirements for the degree of Doctor of Philosophy (Chemistry) in The University of Michigan 2008 Doctoral Committee: Professor David M. Lubman, Chair Professor Masato Koreeda Professor Jairam K. Menon Assistant Professor Kristina I. Hakansson
Transcript
An Integrated Approach Utilizing Liquid Separations, Protein Microarrays and Tandem Mass Spectrometry Towards Understanding Phosphorylation,
Glycosylation and Humoral Response Changes in Cancer.
by
Tasneem H. Patwa
A dissertation submitted in partial fulfillment of the requirements for the degree of
Doctor of Philosophy (Chemistry)
in The University of Michigan 2008
Doctoral Committee:
Professor David M. Lubman, Chair Professor Masato Koreeda Professor Jairam K. Menon Assistant Professor Kristina I. Hakansson
I would like to express my sincere gratitude to my research advisor, Professor
David M. Lubman for his invaluable and continuous support throughout the course of my
Ph.D study. I would also like to thank my committee members, Dr. Masato Koreeda, Dr.
Jairam Menon and Dr. Kristina Hakansson for serving on my dissertation committee and
for their support and advice.
This work would not have been possible without collaboration with Dr. Diane
Simeone, and Dr. Dean Brenner at the University of Michigan. They provided samples
used in all humoral response experiments and the glycoprotein microarray studies. A
special thanks also goes to Dr. Fred R. Miller at Wayne State University for continuous
supply of AT1 and CA1a cell lines for the phosphoprotein experiments. I would
especially like to thank Dr. Jia Zhao, Dr. Yanfei Wang and Dr. Yinghua Qiu for their
collaboration. My graduate school experience would not have been the same without the
friendship and support of Kendra Reid, Amberlyn Wands, Sarah Bethune and all
colleagues in my lab.
And last but not least I would like to thank my parents, my brother and the rest of
my family as well as my fiancé Ricardo Lira for always being by my side, supporting me
and challenging me to do my best. For this I will always be grateful.
iii
Table of Contents
Dedication………………………………………………………………………..……….ii
Acknowledgements……………………………………………………………..……….iii
List of Figures …………………………………………………………………..……....vi
List of Tables………………………………………………………………….………...xii
Chapter 1. Introduction to proteomics and protein microarrays for post translational modification analysis and humoral response studies ………………….1 1.1 Emergence of Proteomics…………………...…..…………………..………..……….1 1.2 All-Liquid Proteomics Platforms………………………………………..…………….3 1.3 Post Translational Modifications in Proteomics………………….....………….…......5 1.4 High Throughput Protein Microarrays…………………………………………….......8 1.5 Dissertation Outline…………………………………………………...…..…………11 1.6 References……………………………………………………………………………13
Chapter 2. A novel analysis scheme for assessing phosphorylation changes of high and medium abundant proteins in pre-malignant and malignant breast cell lines using 2D liquid separations, protein microarrays and tandem mass spectrometry………………………………………………………………………….…17 2.1 Introduction…………………………………………………………………………..17 2.2 Experimental Section…………………………………...……………………………22 2.3 Results and Discussion………………………………………...………………….…27 2.4 Conclusion.………………………………………………………………………..…40 2.5 References…………………………..……………………….…...……………..……63 Chapter 3. Screening of glycosylation patterns in serum using natural glycoprotein microarrays and multi-lectin fluorescence detection…………………………………67 3.1 Introduction………………………………………………………………...………...67 3.2 Experimental Section .…………………………………………………...…………..70 3.3 Results and Discussion....………………………………………………...……….…75 3.4 Conclusion………...………..………………………………………...…………..….85 3.5 References…………………………………………………………………………..101
iv
Chapter 4. Using unique lectin binding patterns of glycoprotein microarrays as a tool for classifying normal, chronic pancreatitis and pancreatic cancer sera….….104 4.1 Introduction…………………………………………………………………...…….104 4.2 Materials and Methods…………………………………………….………………..107 4.3 Results and Discussion………………………………………..……………………114 4.4 Conclusion.……………………………………………………...……………….…123 4.5 References…………………………………………………….…………………….139 Chapter 5. Glycoprotein profiling in plasma samples to elucidate glycoprotein biomarkers of colorectal cancer: An application of natural glycoprotein microarrays and lectin blots………………………………………………………….142 5.1 Introduction ………………………………………………………..……………….142 5.2 Experimental Section..…..……………………….…………………………….…...144 5.3 Results and Discussion………………………………………..……………………151 5.4 Conclusion.……………………………………………………...………………….159 5.5 References…………………………………………………….…………………….172 Chapter 6. A protein microarray approach exploiting the naturally occurring humoral response to identify a potential panel of biomarkers for pancreatic cancer…………………………………………………………………………………..175 6.1 Introduction ………………………………………………………..……………….175 6.2 Experimental Section ..…..…………………………………………………….…...178 6.3 Results and Discussion………………………………………..……………………186 6.4 Conclusion.……………………………………………………...………………….196 6.5 References…………………………………………………….…………………….210
Chapter 7. Enhanced Detection of Autoantibodies on Protein Micorarrays Using a Modified Protein Digestion Technique………………………………………………213 7.1 Introduction ………………………………………………………..……………….213 7.2 Experimental Section ..…..…………………………………………………….…...215 7.3 Results and Discussion………………………………………..……………………221 7.4 Conclusion.……………………………………………………...………………….227 7.5 References…………………………………………………….…………………….236 Chapter 8. Conclusion………………………………………………………………...238
v
List of Figures
Figure
2.1 Microarray strategy for global evaluation of phosphorylation changes as a function of disease …………………………………………………………………..………….........53 2.2 2D liquid separation of pre-malignant AT1 and malignant CA1a cell lines. Each lane represents a pH fraction different by 0.2 units. Vertical axis refers to the retention time during the separation. Intensity of the bands correspond to peak heights which ranged from a value of 100 mV to 990 mV. Difference between premalignant and malignant sample appears in the middle panel …………….……………………………….…...….54 2.3 Detecting phosphoproteins on microarrays using ProQ Diamond dye and anti-phosphotyrosine antibodies. (a) A study done with standards where ovalbumin, B-casein and a mixture of tyrosine phosphorylated proteins were used. Notice that when probed with both ProQ and anti pY antibody, solely pY proteins appear red, mixture of pY and pS or pT appear yellow and solely pS or pT appear green. (b) An image of a section of a protein microarray containing fractionated proteins from a malignant breast whole cell lysate……………………………………………....………………………………….….55 2.4 Comprehensive study to assess reproducibility of the method. (a) CF chromatograms of 3 ca1a separations are shown on the left and of 2 AT1 separations are shown on the right. In all cases 4.5 mg of sample was loaded (one AT1 separation was performed with only 3 mg of total protein). Co-plotted with the chromatograms are pH profiles to illustrate that the pH gradient was consistent in all separations. (b) 2nd dimension chromatograms of all batches of cell lines for pH ranges 6.4-6.2 and 7.2-7.0. Arrows along the chromatogram illustrate peaks that are shown in subsequent microarray data. (c) Array images of samples from pH fractions 7.2-7.0, 6.4-6.2 and 5.4-5.2 to illustrate reproducibility throughout the separation space. (d) Sections of microarray data showing an example of reproducible positive spots that are unique to ca1a (pH 5.4-5.2, retention time 28 min) and that are found in all cell lines (pH 6.4-6.2, rentention time 26 min). Peaks corresponding to the positive spots found in all cell lines are indicated by arrows in fig 2.2b……………….…………………………………………………………………..56 2.5 Selected microarray images showing comparison of spots where differential phosphorylation was observed between pre-malignant and malignant breast cell lines over different pH regions. Protein IDs as determined by tandem mass spectrometry are shown beside the image. For some proteins, multiple consecutive spots light up due to diffusional broadening during peak collection. In some cases more than one
vi
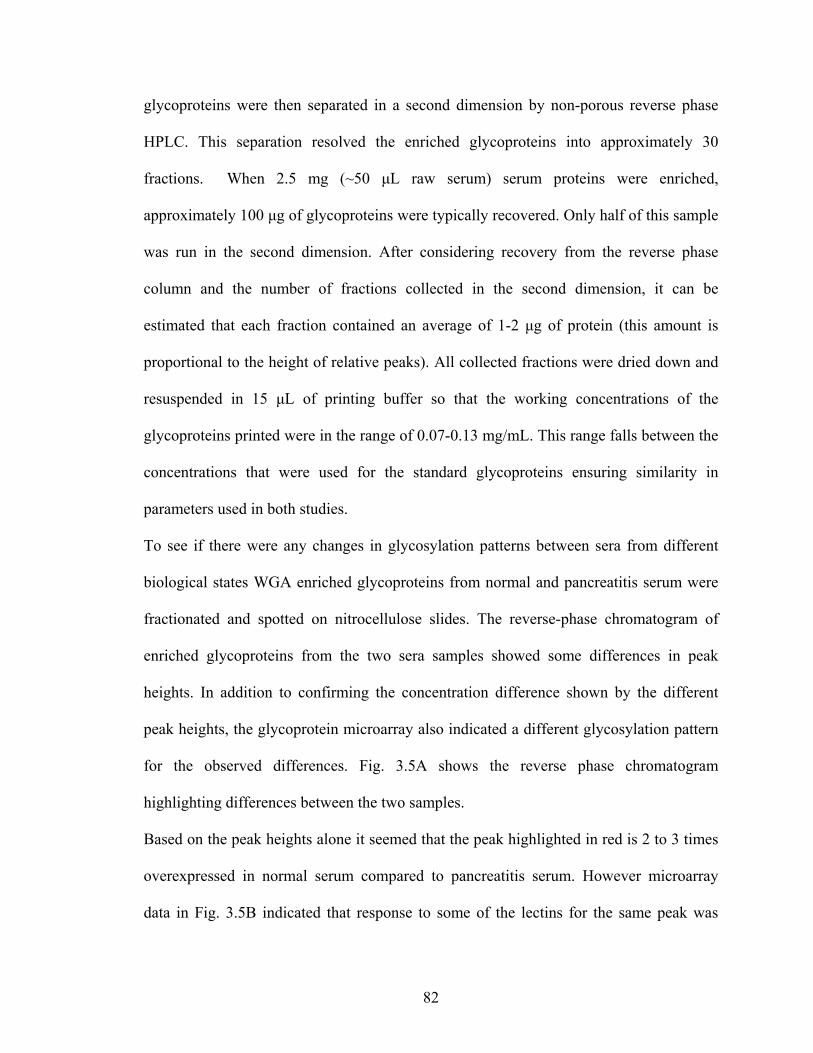
phosphoprotein was identified in the same collected fraction. In such cases, both phosphoproteins are listed………...……………………………………………………...58 2.6 Pie chart illustrating subcellular location of phosphoproteins whose phosphorylation sites were confirmed by mass spectrometry in both the AT1 and CA1a cell line combined. Closer examination showed a majority of these phosphoproteins to be present in the CA1a cell line (see table 2.2)……………………………………………………….……59 2.7 Functional classification of proteins differentially phosphorylated in the pre-malignant and malignant breast cell lines. Majority of phosphoproteins were found in the malignant, CA1a. In cases where a phosphoprotein was found in AT1 and not CA1a, it appears in a box with broken lines….......................……………………………………..60 2.8 (a) Tandem mass spectrum (with +1 ion series highlighted) of selected phosphopeptide from apoptotic condensation inducing factor with inset showing phosphorylation difference between AT1 (boxed in red) and CA1a (boxed in blue) as seen on the microarray. (b) Microarray image together with complementary portion of reverse phase chromatogram where 60S ribosomal protein L14 was found to be phosphorylated in only CA1a…………... ………………………...…………………….61 2.9 Reverse phase chromatogram of pH fraction 7.0-6.8 from malignant cancer cell line, CA1a and pre-malignant cell line AT1. IDs as determined by tandem mass spectrometry are shown for each peak in CA1a………………………………………………………..62 3.1 Experimental strategy for studying serum glycoproteins. 1) Lectin purification 2) Non-porous reverse phase HPLC separation and fraction collection 3) Microarray production 4) Lectin detection using biotin-streptavidin-Alexafluor555 detection 4) Image acquisition and analysis……………...……………………………………….…..95 3.2 Scanned images of printed standard glycoproteins probed with different lectins. Each block bracketed on the right represents a dilution series of indicated standard from 2mg/mL to 0.025mg/mL. Each dilution has been printed as 9 replicates in a 3x3 block…………………………………………………………..……………………..…...96 3.3 Linearity of response in standards a) Glycan distribution on standards printed at 1mg/mL concentration. Standard curve of b) Ribonuclease B in response to ConA c) Thyroglobulin in response to AAL d) Transferrin in response to SNA e) Fetuin in response to MAL f) Asialofetuin in response to PNA using lectin concentration of 5ug/mL…………….. …………………………………………………………………....97 3.4 Tandem mass spectra of dominant glycan structure in a) Ribonuclease B (precursor ion m/z 1257) b) Transferrin (precursor ion m/z 1663)………….. ……………………..98 3.5 Identifying differences in glycosylation from sera of different biological states. a) Reverse phase chromatogram of enriched glycopoteins from normal and pancreatitis sera with differences highlighted. Bar graph showing integrated fluorescence values of spots
vii
shown in array images after background subtraction and normalization based on UV peak area for peak shown with b) red arrow, c) orange arrow………...............……………...99 3.6 Comparison of differential glycosylation patterns in normal vs. cancer serum. All comparisons shown below had approximately the same peak area between cancer and normal sera but glycosylation patterns were different. Each illustration shows sections of microarray images of a protein’s binding to the lectins indicated. Bar graphs show integrated fluorescence values of spots shown in the array images after background subtraction and normalization based on UV peak area…………………………………100 4.1 Strategy used to screen the glycosylation patterns and characterize the target glycoproteins using samples of normal, chronic pancreatitis, and pancreatic cancer sera……………………………………………………………………….. ……….…...126 4.2 (a) UV Chromatogram of 125 µl serum depletion by IgY antibody column to remove the 12 high abundance proteins. During the binding process, the fraction flowing through was collected as the immunodepleted serum fraction, with the abundant protein fraction collected during elution. The absorption was set at 280nm. (b) WGA and ConA selected glycoproteins from three depleted serum samples were separated by NPS-RP C18 column. The UV absorption was at 214nm.…… …………………………………………….…127 4.3 Sections of glycoprotein microarray showing comparison of one fraction from NPS-RP-HPLC across all 24 samples. Each panel is a section of identical arrays probed with lectin indicated on the left side of the panel. It was observed that this fraction contained proteins that were predominantly mannosylated and fucosylated. It was also observed that the level of glycosylation (based on raw microarray data) was higher in cancer samples compared to the controls.………………………….……………………………...…….128 4.4 The normalized glycoprotein microarray responses to lectins (a) AAL (b) ConCA (c) MAL (d) SNA (e)PNA were visualized by principal component analysis (PCA). 24 serum samples (10normal, 8 pancreatitis and 6 pancreatic cancers), assayed in duplicate, were analyzed without replicate averaging. ……………………………………………129 4.5 The normalized glycoprotein microarray responses to lectins (a) AAL, (b) ConA, (c) MAL, (d) SNA, and (e) PNA were visualized by principal component analysis (PCA). Twenty-four serum samples (10 normal, 8 chronic pancreatitis, and 6 pancreatic cancers) were studied. Average linkage hierarchical clustering (HC) of the array responses to (f) AAL, (g) MAL, (h) ConA, (i) PNA and (j) SNA were shown to provide graphical representations of the relationships among the samples. The figure shows the clustering of serum samples obtained from patients with pancreatic cancer, chronic pancreatitis, or from normal subjects.………………………………………………………………..….131 4.6 AAL lectin blot analysis of (a) Antithrombin-III, (b) Haptoglobin-related protein, (c) Hemopexin in N (normal), P (chronic pancreatitis), and C (pancreatic cancer) serum.…………………………………………………………………………………...135
viii
4.7 Peptide mapping of Antithrombin-III. (a) Very similar patterns of unmodified peptides and (b) altered glycopeptide LGACNDTLQQLMEVFK (124-139) + (Hex)1
(HexNAc)2 (Deoxyhexose)1 (NeuAc)1 + (Man)3(GlcNAc)2 were detected by µLC-ESITOF in normal and pancreatic cancer serum……………………………………….136 4.8 Peptide mapping of Haptoglobin-related protein. (a) Glycopeptide NLFL NHSE NATAK(145-157) + (Hex)2(HexNAc)2 + (Man)3(GlcNAc)2, (b) glycopeptides NLFL NHSE NATAK(145-157) + (Hex)2(HexNAc)2(NeuAc)1 + (Man)3(GlcNAc)2, and (c) glycopeptides NLFLNHSENATAK(145-157) + (Hex)2 (HexNAc)2(NeuAc)2 + Man)3(GlcNAc)2 were detected as multiple charged peaks in normal and pancreatic cancer serum.………… ………………………………………………………...……...137 4.9 Peptide mapping of Kininogen-1 (P01042). Glycopeptide LNAEN NATFYFK(289-300) + Hex)3(HexNAc)3 + (Man)3(GlcNAc)2, LNAENNATFYFK(289-300) + (Hex)3(HexNAc)3(NeuAc)1 + (Man)3(GlcNAc)2, and LNAENNATFYFK(289-300) + (Hex)3(HexNAc)3(NeuAc)2 + (Man)3(GlcNAc)2 were detected as doubly charged peaks.……………………………..………………………………………………….....138 5.1 Flowchart of overall strategy using high throughput analysis of plasma N-glycosylation pattern changes in colorectal cancer ……………………..………..….…164 5.2 (A) Chromatographic profiles of immunoaffinity depletion of plasma from 6 normal, adenoma, and colorectal cancer patients using ProteomeLab IgY-12 kit. The 12 most abundant proteins are contained in the “bound” fraction and the less abundant proteins in plasma or serum remained in the “flow-through” fraction. (B). UV chromatograms of all plasma samples from colorectal cancer, adenoma, and normal controls. …………….……………………….........................................................…….165 5.3 Microarray images of lectin response across all collected fractions from all sample groups ………………………………………………...……………………………...…166 5.4 (A) Principal components analysis (PCA) plot for normalized glycoprotein microarray data derived from the replicate analysis of healthy individuals, adenoma, and colorectal cancer patient plasma. Circles indicate the areas where the data points of the three groups are clustered. (B)- Reproducibility demonstration of Principal components analysis (PCA) for normalized glycoprotein microarray data derived from the replicates of healthy individuals, adenoma, and colorectal cancer patients……………………….167 5.5 Unsupervised hierarchical clustering of glycoprotein microarray data for colorectal cancer (c1-c6) from adenoma (a1-a5) and normal controls (n1-n9). Average linkage was used, and the dissimilarity was obtained from the Pearson correlation coefficient…….169 5.6 Nano LC-MS/MS spectra of (A) doubly charged N-glycosylated peptide GLN*VTLSSGH (m/z = 553.28) from complement 4 and (B) doubly charged N-glycosylated peptide LANENN*ATFYFK from kininogen-1. The asterisk (*) denotes the site of N-glycosylation determined from the tandem mass spectrum…………………..170
ix
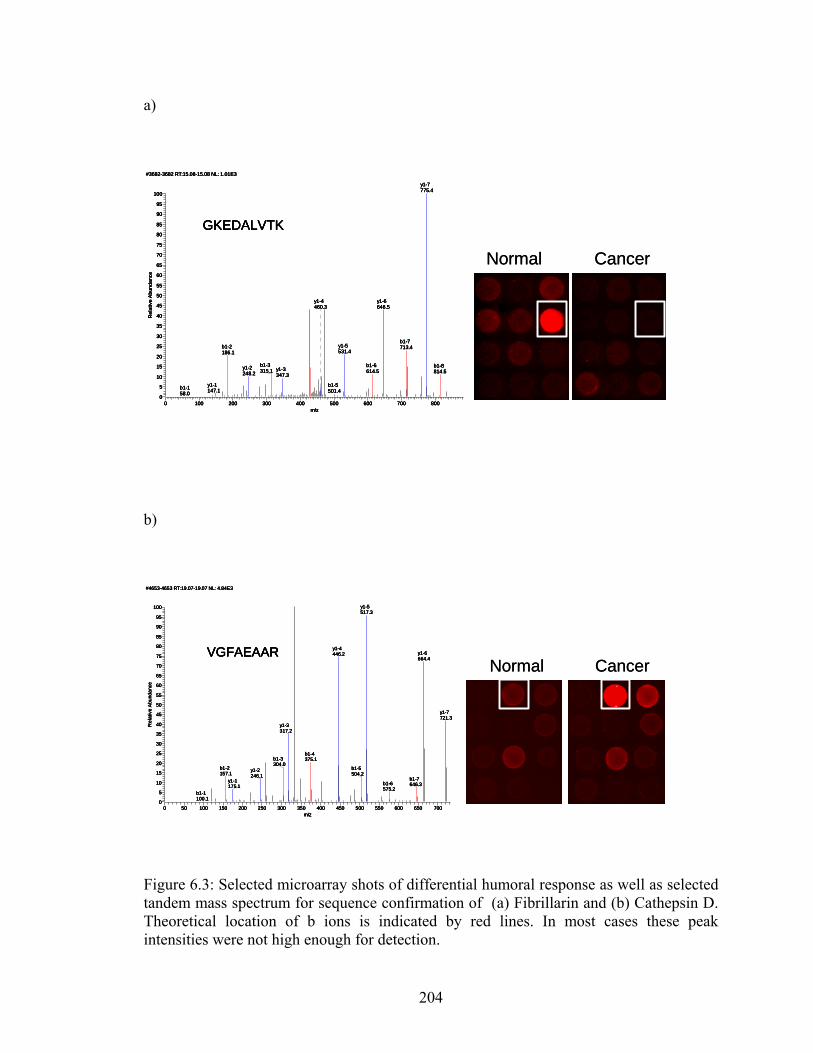
5.7 Validation study using 30 independent plasma sample to assess fucosylation and sialylation levels using AAL and SNA lectin blot analysis in complement C3 (A) and histidine-rich glycoprotein (C). The corresponding protein expression levels based on chromatogram peak areas are shown in (B) for complement C3 and (D) for histidine-rich glycoprotein………………………………………………………………………….…171 6.1 Humoral response experimental overview. Proteins are first extracted from cell line and separated in two orthogonal dimensions. Separated fractions are spotted by non-contact means on nitrocellulose slides which are then probed with serum from normal or cancer sera. Antibody-antigen response in detected using anti-human IgG conjugated to a florophore. Following non-parametric analysis proteins of interest are identified by tandem mass spectrometry……………………………………………. …………..…...202 6.2 2D UV chromatogram of separated (a) MIAPACA cell lysate and (b) pancreatic cancer tissue. On the horizontal axis are fractions from chromatofocusing starting from the lowest pH going to the highest pH. On the vertical axis is increasing retention time or hydrophobicity of the separated protein…..……………………………………………203 6.3 Selected microarray shots of differential humoral response as well as selected tandem mass spectrum for sequence confirmation of (a) Fibrillarin and (b) Cathepsin D..……204 6.4 All separated fractions showing result with non-parametric Wilcoxon tests (a) without background subtraction and (b) with background subtraction. Red and Orange blocks mean significantly higher humoral response in cancer samples compared to normal (p<0.05 and p<0.1 respectively) and darker and lighter shades of Blue represent higher humoral response in normal compared to cancer (p<0.05 and p<0.1 respectively). Yellow and green blocks mean 0.1<p<0.25. (c) z-score plot for proteins separated from pH fraction 5.1-4.9. On the vertical axis are all fraction by increasing retention time and on the horizontal axis are each of the serum samples with which samples were probed. Red and Yellow blocks represents responses significantly higher than the mean of the normal sample (4<Z<25 and 2<Z<4 respectively) while Blue and Green blocks represent responses significantly lower than the mean of the normal sample (-25<Z<-4 and -4<Z<-2 respectively). (d) All separated fractions from pancreatic cancer tissue showing results with non-parametric Wilcoxon tests. Color codes are the same as for figure 6.4 a and b……………... …………...………………………………………………….…………205 6.5 (a) ROC curve of 9 protein panel from PAM analysis showing an area under the curve of 0.85. (b) Boxplots of the 9 protein panel classifier built using all 30 samples ...…………………………………………………………………...………..…207 6.6 Heatmap showing median centered responses of all serum samples to selected proteins of interest. The scale from green to red represents lower response to higher response on a scale of -2 to 2. The arrows in the figure indicate the protein spots that formed the panel of 9 potential markers with highest sensitivity and specificity………208
x
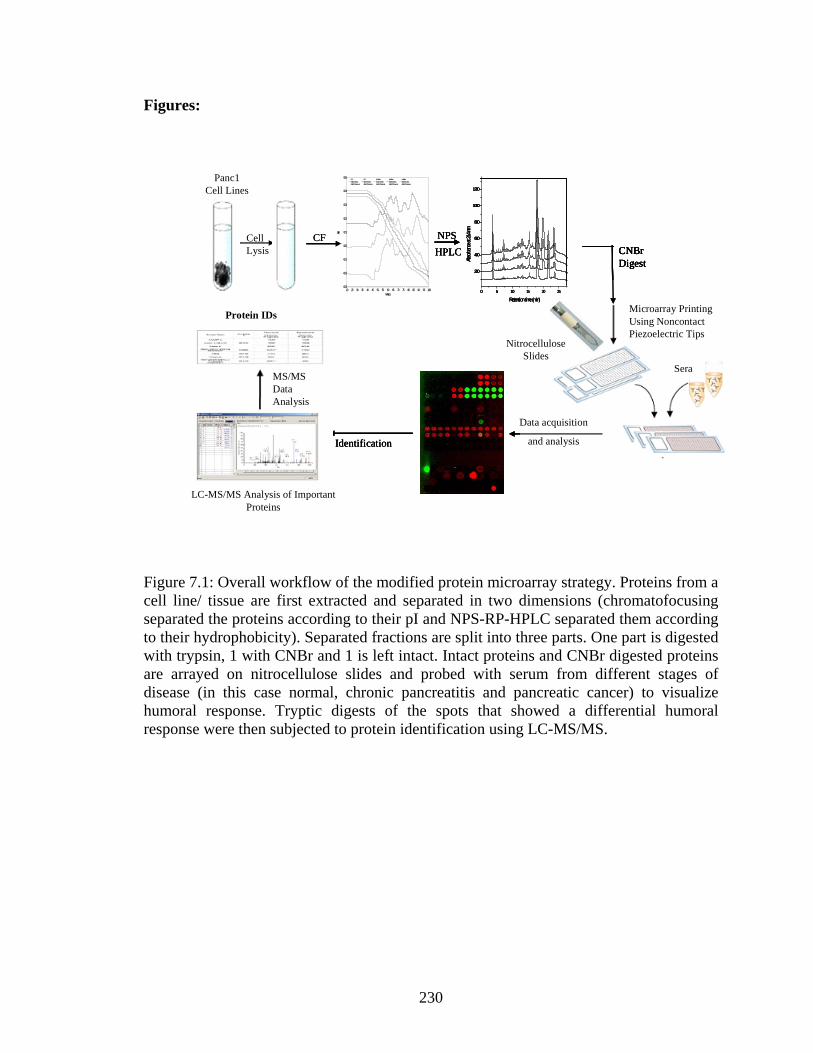
6.7 Scatterplot illustrating the differential humoral response in recombinant human PGK-1 used for validating initial experimental results……………………………………….209 7.1 Overall workflow of the modified protein microarray strategy. Proteins from a cell line/ tissue are first extracted and separated in two dimensions (chromatofocusing separated the proteins according to their pI and NPS-RP-HPLC separated them according to their hydrophobicity). Separated fractions are split into three parts. One part is digested with trypsin, 1 with CNBr and 1 is left intact. Intact proteins and CNBr digested proteins are arrayed on nitrocellulose slides and probed with serum from different stages of disease (in this case normal, chronic pancreatitis and pancreatic cancer) to visualize humoral response. Tryptic digests of the spots that showed a differential humoral response were then subjected to protein identification using LC-MS/MS……………..230 7.2 Reproducibility of separation methods used. (a) 3 chromatofocusing runs using 4.5 mg of protein lysate from Panc1 cell lines. (b) 4 reversed phase HPLC runs from two distinct pH fractions from the first dimension. Red arrows indicated fractions/peaks that responded to serum when digested by CNBr and Blue arrows indicated fractions/peaks that responded to serum when arrayed in its intact state……………………………….231 7.3 Hypothesis about why intact protein microarrays may not show high response signal. Binding site on protein is sterically hindered from serum proteins when the arrayed protein is intact. After digestion with CNBr, fragments with conserved binding sites are more exposed to serum proteins enhancing the signal due to humoral response………232 7.4 Microarray slide section illustrating differences in humoral response using 3 separate arraying methods. The top panel is intact proteins from Panc1 cell lines probed with serum resulting in very low overall response. The middle panel is GluC digested proteins from the same Panc1 cell line probed with serum resulting in a positive response to all arrayed fractions. This binding was non-specific to the GluC present in digested sample. The lower panel shows humoral response to tryptically digested proteins from the same Panc1 cell line. While the overall background is maintained at a low level, spots inside the yellow square illustrate a humoral response that was not present when the same protein in its intact state was probed with serum……………………………………….233 7.5 Scatter plots illustrating change in humoral response upon protein digestion with CNBr. (a) – (e) show the five spots that demonstrated differential humoral response between norma sera and pacreatitis and pancreatic cancer sera. On the left are scatter plots of all serum sample reactions to the intact spot while on the right are scatter plots of all serum sample responses to the CNBr digested spots. In all plots 1 = normal sera responses, 2 = chronic pancreatitis responses and 3 = pancreatic cancer responses…...234
xi
List of Tables
Table
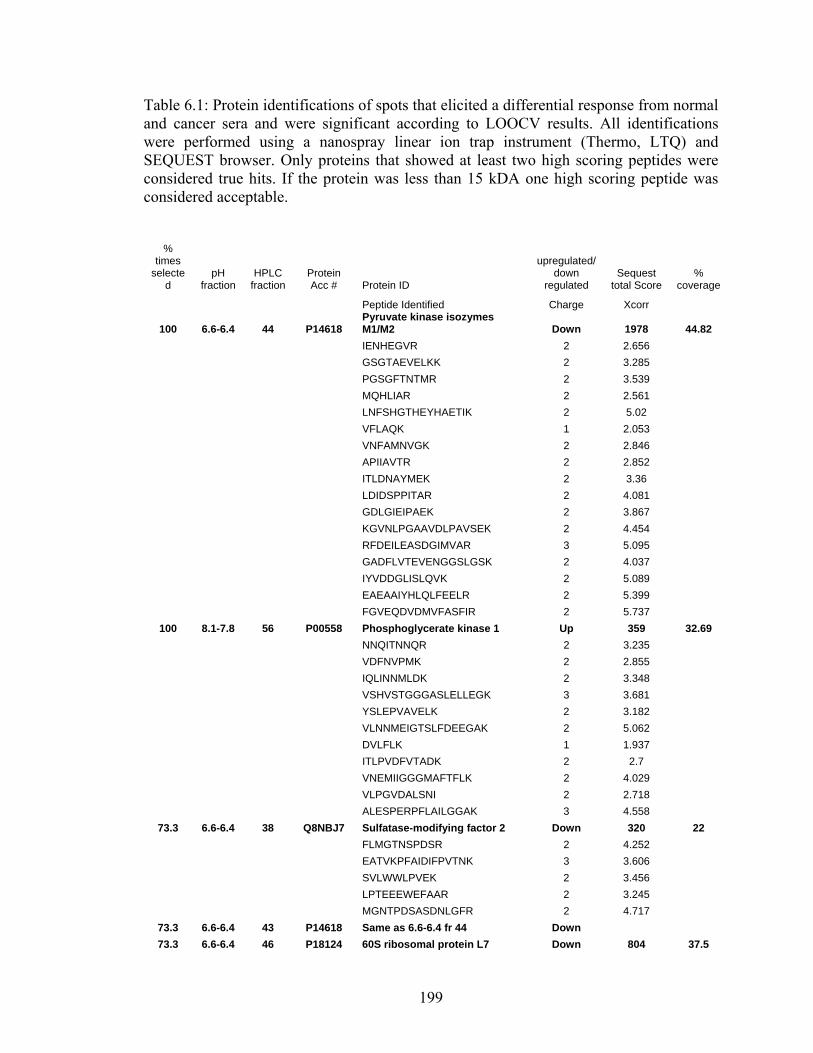
2.1 Protein IDs and peptides identified for selected microarray spots that were reproducibly positive from pH range 5.4-5.3 (as shown in figure 2.4c)………………………. ……………..……………………………………………...42 2.2 Phosphoproteins identified with confirmation of phosphorylation sites. Additional information was obtained from the Swissprot database ………………………………...43 2.3 Previously known phosphoproteins also identified as differentially expressed in this study without confirmation of phosphorylation site(s). All additional information provided was obtained from the Swissprot database…………………………….………46 2.4 Early eluting proteins from pH 7.0-6.6 identified from the malignant CA1a cell line. Any non-experimental information was obtained from the Swissprot database…….…..49 3.1 Biotinylated lectins used for glycan detection and their specificities………….…….87 3.2 Protein IDs of data shown in Fig.3.5 and 3.6 as identified by µ-LC-MS/MS with change in glycan expression based on microarray data. All data was background subtracted and normalized based on UV peak areas. N: Normal, P: Pancreatitis, C: Cancer.……………………..……………………………………………………...……..88 3.3 Detailed results from tandem mass spectrometry experiments done on proteins discussed. Information about peptides detected, Xcorr and coverage are included. ..…..89 4.1 Z values of the altered glycosylations detected by five lectins.(Z>2 or Z<-2 corresponds to P<0.05)…………………… ………………………...…………………125 5.1 The amount of protein processed through the IgY antibody column and recovered in the flow-through fraction from 250 µL plasma samples ………………………………161 5.2A Z-statistics of differentially glycosylated proteins detected by lectins ……..........162 5.2B Differentially glycosylated proteins identified with the glycosylation site…….…163 6.1 Protein identifications of spots that elicited a differential response from normal and cancer sera and were significant according to LOOCV results. All identifications were performed using a nanospray linear ion trap instrument (Thermo, LTQ) and SEQUEST
xii
browser. Only proteins that showed at least two high scoring peptides were considered true hits. If the protein was less than 15 kDA one high scoring peptide was considered acceptable…………………………………………………………………………….…199 7.1 Protein identifications of spots that demonstrated a differential humoral response between the three sera sample groups used with additional information about peptides identified and coverages observed……………………………………………………...229
xiii
Chapter 1
Introduction to proteomics and protein microarrays for post translational modification analysis and humoral response studies
1.1. Emergence of proteomics
The deciphering of the human genome has provided valuable information about
the numbers of genes and proteins present in human cells. DNA expression differences
between normal vs. diseased cells has shown that such studies can provide key
information about the pathways that are altered upon disease progression. However with
the knowledge about the human genome also came evidence that DNA expression does
not necessarily show the true picture when it comes to understanding the state of a cell at
any particular time. Studies have shown that DNA and mRNA levels do not necessarily
positively correlate.[1] Furthermore mRNA expression levels are not the true indicators
of protein expression.[2, 3] Proteins are the product of DNA transcription and RNA
translation and are therefore the functional units of cellular processes. After a protein is
translated it can also go through considerable post translational modifications. It is
believed that there are 50,000 to a million proteins in a cell from a higher organism and
these proteins have a dynamic range higher than 1010 orders of magnitude.[4-7]
Furthermore protein expression levels in all human cells are not the same. Studying
protein expression in cells at a global scale has become a major challenge for scientists
today due to inherent nature of proteins in a cell as well as available techniques for
1
studying different types of proteins. Another obstacle to protein analysis is the fact that it
can not be cloned into larger quantities in a similar fashion as DNA.
Over the years since global protein expression profiling has become possible,
two-dimensional gel electrophoresis (2D-GE) has emerged as a popular technique.[8] In
this technique proteins from a cellular lysate (be it from a cell line, tissue or bodily fluids
such as serum, plasma or urine) are separated initially by isoelectric focusing according
to the protein isoelectric point (pI) using a thin gel strip and subsequently by their
molecular weight using a polyacrylamide gel electrophoresis (PAGE). 2D-PAGE
methods are robust and have low detection limits in the picomole (and even lower) range
but suffer from multiple drawbacks. Proteins with extremely high or low pIs tend to
precipitate in a PAGE gel and are therefore out of the realm of this technique.[9]
Frequently 2D-GE is coupled offline with electrospray ionization (ESI) and matrix
assisted laser desorption ionization (MALDI) forms of mass spectrometry to determine
thousands of proteins that are manually or robotically excised from the spots.[10, 11]
Because such excision steps are pre-dominantly done by hand or a robot, contamination
due to keratins from skin and hair often pose a problem. Comparison of the same gel run
in different labs or on different days has also shown significant variation making
cataloging of multiple experiments for comparison quite difficult. Proteins have a large
dynamic range in terms of their molecular weight. Because the gel separations are
restricted to a physical gel surface, separation of both the very high and low molecular
weight proteins is difficult. In order to separate very high molecular weight proteins the
gel needs to be run for a long time where this could result in lower molecular weight
proteins running off the gel and not being analyzed.
2
1.2. All-liquid proteomics platforms
Due to the number of problems associated with gel electrophoresis discussed
earlier, there has been increased interest in alternate techniques for protein expression
profiling particularly methods that are all-liquid based. All liquid based techniques are
favorable because they can be made almost completely hands-free and integrated with
mass spectrometry without too much sample preparation. All liquid techniques have also
divided protein expression profiling research and proteomics research into two parts:
Bottom-up and Top-down proteomics. In bottom-up proteomics all proteins in a lysate
are first digested and then using multiple dimensions of separations they are analyzed and
finally identified by mass spectrometry. The most popular bottom-up technique currently
is MudPiT originally developed by John Yates 3rd.[12] This Multi-Dimensional Protein
Identification Technique first separates all digested peptides by strong cation exchange
chromatography and then by reversed-phase HPLC. The resulting fractionated peptides
are immediately transferred to a mass spectrometer for identification. Sophisticated
software has been developed that is able to analyze many storage servers worth of data
that can be obtained by such experiments. Such software is able to determine the
identification of the protein from each of the peptide identified and sequenced. Bottom-
up techniques are high throughput in nature but have some drawbacks. By digesting
proteins in the first stages of the experiment critical information about the proteins is lost
i.e. its intact molecular weight which could give information about potential post
translational modifications or isoform information. In addition, MuDPiT experiments can
3
also result in high false positive identifications due to the homology that exists in
multiple different proteins.
Top down methods currently being developed eliminate some of the drawbacks
presented by bottom-up methods. In top-down methods, all proteins in a lysate are first
separated (by chromatographic techniques or by high resolution mass spectrometry such
as the FTICR) and then analyzed individually for identification and structural information.
In earlier work isoelectric focusing using devices divided into chambers were created to
separate and isolate proteins within a certain pI range in specific chamber.[13-15] The
proteins in each chamber were then removed and further separated using other liquid base
techniques such as RP-HPLC. Problems with these techniques include sample loss due to
protein adhering to membrane surface separating chambers as well as poor resolution
leading to the same protein appearing in multiple adjacent chambers. Alternately weak
anion exchange based techniques have proved to be a good 1st dimension of separation.
Chromatofocusing is a weak anion based technique where proteins are separated by their
isoelectric points.[16] A unique feature of this technique involves the titration of a start
buffer with an elution buffer which results in a gradual change in the pH of the column.
The result is the elution of proteins bound to the column from the proteins with the
highest pI to the proteins with the lowest pI. Column resolution has been shown to be
within 0.2 pH units. Collecting intact proteins according to their pI can provide
interesting information about potential protein modifications because it has been shown
that modification can result in a change in the protein’s pI. Such information would be
destroyed by protein digestion in bottom-up methods. The column-based nature of CF
4
enables the direct coupling of this technique with a second dimension of separation such
as RP-HPLC.
In fact CF and RP-HPLC based systems have been commercialized by Beckman
Coulter as the PF2D system.[17] In such a system proteins are fractionated and collected
by pI in the first dimension. They are then transferred automatically to a non-porous
silica reversed phase column for separation in the second dimension. Fractions from the
second dimension can be collected by time or by peak depending on user preferences.
Non-porous silica is particularly favorable because it increases the number of times the
column can be used since clogging of the pores by large proteins is eliminated. It also
demonstrates better peak characteristics enhancing the peak capacity and resolution of the
separation.
1.3. Post-translational modifications in proteomics
Protein expression profiling work provides relevant information about proteins
that change as a function of time, disease or other variables being studied. However other
studies have shown that even more important than the protein expression levels in a cell
are the modifications present on proteins involved in cellular pathways. Proteins can be
modified with a variety of chemical groups ranging from phosphates, glycans, ubiquitin,
oxides, methyl, nitrate and sulfates. Protein phosphorylation and glycosylation have been
implicated in a variety of signaling pathways and changes in these modifications have
been shown to be involved in disease progression. However studying these two
modifications presents a great challenge due to reasons described herein.
Reversible phosphorylation is a key and important mechanism that is involved in
a range of cellular processes such as cell growth, differentiation and apoptosis via a
5
variety of signaling pathways. One phosphorylation can trigger a domino effect where a
signal travels via multiple phosphorylation events to affect a certain outcome. At any
point in time at least one-third of all proteins are thought to be phosphorylated at a serine,
threonine or tyrosine residue. It has been estimated that there at roughly 100,000 potential
phosphorylation sites in the human proteome.[18] However as of now only a few
thousand have been found. One reason for this lack of well-characterized phosphorylation
site information is the presence of signaling molecules in very low abundance in the cells.
In addition, the stoichiometry in which these molecules are phosphorylated is even lower.
Therefore, while phosphorylated proteins, when digested, can be identified, the
identification of phosphorylation sites is very difficult. Phosphopeptides do not ionize
well because their signal is suppressed by non-phosphorylated peptides. To bypass this
problem, research is ongoing in developing methods to isolate and enrich the
phosphorylated peptides. Immobilized metal affinity chromatography (IMAC) has been
popularly used to enrich phosphopeptides.[19, 20] In this method activated metal
chelators bind phosphate groups on phosphopeptides while other peptides can be washed
away. The phosphopeptides bound to the chelators can then be eluted out for further
analysis. IMAC technologies have been commercialized into easy use ziptip formats.
However coenrichment of other acidic peptides containing aspartic and glutamic acid
groups hinders phosphorylation site analysis. Current work on amphoteric oxide-based
solid phases for phosphopeptide enrichment appear promising.[21, 22] In these methods
titanium or zirconium dioxide based solid phases are utilized to enrich phosphate
containing peptides. Coenrichment of other acidic peptides is said to be reduced by using
competitor acid group containing compounds such as hydroxyl-cinnamic acid. However
6
these competitor compounds are platform friends in the case of MALDI based
instruments but often results in significant precipitation in HPLC based systems and
therefore cannot be used.
Glycosylation, which is the attachment of sugar moieties to a protein, is the most
complex type of protein post translational modification. Over 50% of all proteins have
been estimated to be phosphorylated at any one time.[23] Glycosylation can change a
protein’s conformation significantly thereby affecting the proteins’ activity.
Glycoproteins are known to be involved in a variety of cellular and intercellular
processes such as molecular recognition, fertilization and embryonic development,
inflammation, cell adhesion, immune defense and inter- and intra-cellular signaling.
There are two main types of protein glycosylations: N-glycosylation occurs when a
glycan is attached by an N-acetylglucosamine to the amide group of an asparagine within
a Asn-X-Ser/Thr consensus motif where X can be any amino acid but proline.[24] The
other type of glycosylation is the O-linked type where a glycan is attached to the protein
via an N-acetylgalactosamine to serine or threonine residues.[25] Glycoproteins are also
difficult to study but for very different reasons. Glycoproteins that play a key role in
signaling are often very high molecular weight proteins that are not easily isolated for
further studies. Glycopeptides are not easily detectable by mass spectrometry because of
their lower ionization efficiency compared to non-glycosylated peptides. Furthermore,
glycopeptide signal intensities are often suppressed by non-glycosylated peptides
particularly when the glycan structure on the peptide ends with negatively charged sialic
acid residues.[26] Glycan heterogeneity is also another challenge when studying
glycoproteins as one protein could have multiple different glycan structures associated to
7
it. This has led to development of techniques such as lectin affinity chromatography for
selective enrichment of glycopeptides.[27] In addition, glycosylation sites can be easily
determined by cleaving glycans from the protein using enzymatic means such as PNGAse
F.[28] Cleavage results in addition of a hydrogen on the glycopeptide which can easily be
monitored by mass spectrometry. Determination of the glycan structure on the other hand
presents a very complicated problem. Glycan structures can be simple to very complex
with various forms of branching possible. In order to study these structural complexities
cleaved glycans need to be analyzed individually using multiple stages of mass
spectrometry.[29, 30] This requires higher quantities of glycans than may be available in
samples from natural sources.
At the bioinformatics end mass spectrometry data needs to be extensively
analyzed to ensure that any results being obtained are confident protein identifications
due to the nature of homology between many proteins. The large amounts of data
obtained in proteomic experiments need huge amounts of server space and lots of
computer analysis time. Many advances in the field of proteomics informatics have been
made over the last 5 years.[31] However, because of the need for extensive sample
preparation and individual experiments to study glycans or phosphorylations in different
proteins, as well as the large amount of time needed for analysis of data obtained, the
currently available strategies are becoming less and less high throughput in their real
sense.
1.4. High-throughput protein microarrays
With the advent of microarray technology there is hope for reinstating the high
throughput nature of protein profiling. Microarray technology was initially used to profile
8
DNA expression and interaction. However recent work has focused on applying this
microarray technology to complex protein samples. Arrays can be made by fixing a
membrane on a glass slide surface. The most popular membranes used include
nitrocellulose and polyvinylidene diflouride membranes. Chemical derivatization of glass
slide surfaces is also popular such as epoxy, aldehyde, poly-L-lysine and amine surfaces.
Proteins can be arrayed on these surfaces using contact or non-contact mechanisms.
While contact printing mechanisms are robust and cheaper, non-contact printers are much
more reproducible and reliable in scientific studies. A typical microarray is the size of a
microscopic slide and it can accommodate up to 10000 spots depending on the array
format and protein spots diameter being arrayed. A protein array contains immobilized
protein spots. Each spot can contain a set of “bait” molecules.[32, 33] These baits can
range from a variety of molecules such as antibodies [34, 35], a cell or phage lysate [36,
37], a recombinant protein or peptide [38-40], a drug [41, 42], or a nucleic acid.[43, 44]
The array is hybridized with either a probe (labeled antibody or ligand), or an unknown
biological sample such as a cell lysate or serum sample. If the probe or biological
samples are tagged with a signal-generating molecule such as a flourophore then positive
and negative spots whose intensity corresponds to the extent of binding between the
arrayed spot and probe result. An image of the resulting array can be captured by
commercially available scanners and can be analyzed and interpreted using supporting
software.
Currently protein microarrays have been used in a range of different applications.
They can be divided into forward and reverse phase microarrays depending on whether
the analyte is in the solution phase or immobilized on the surface. In forward phase arrays
9
the surface is arrayed with capture molecules, typically antibodies. Each array is
processed with one test sample. Multiple antibodies can therefore be arrayed on one slide
to see if a test sample has proteins reactive with all the arrayed antibodies. As a result,
multiple analytes are measured at once. Such an approach has been used to identify
mouse monoclonal antibodies that demonstrate the highest sensitivity for recombinant
interleukin-4 detection.[45] Another very sophisticated example of an approach where
forward phase arrays are used is a study where multiple antibodies involved in signaling
pathways were probed with serum from various patient groups.[35, 46-48] Differential
responses when signals from each individual group were compared highlighted key
signaling proteins that demonstrated alterations in expression as a function of disease.
While such studies are critical in highlighting potential markers of disease, it is important
to note that only proteins whose antibodies are arrayed on slides can be probed for
differential expression. Novel proteins that may be good markers of disease but that have
previously not been implicated in diseases may therefore go unquestioned in these studies.
In a reverse phase array individual test samples are arrayed in each spot such that
multiple samples are analyzed at the same time. Each array is then processed with a
detection molecule such as an antibody resulting in a specific measurement being taken
across hundreds if not thousands of samples. Reverse phase arrays have been used to
generate SH2 binding profiles for phosphopeptides, recombinant proteins and entire
proteomes.[49] Tissue microarrays are another kind of reverse phase arrays where tissue
samples preferably from laser capture micro-dissection experiments are arrayed on slides
and probed for proteins of interest. One such study assessed levels of cell survival and
apoptotic proteins in breast cancer tissue.[50] Another approach that has been developed
10
over the last few years is a modified reverse-phase array approach where proteins from a
biological medium (cell line, tissue, serum) are initially separated by a chromatographic
technique. These proteins are then arrayed on slides after which they are probed for
qualities of interest such as post translational modifications of various type [51] as well as
immune response from the arrayed proteins particularly if the proteins originate from a
diseased sample. [52, 53]
1.5. Dissertation outline
This dissertation attempts to integrate the positive attributes of liquid separations,
protein microarrays and mass spectrometry to study disease progression.
Chromatofocusing and non-porous reversed-phase HPLC are used to sufficiently isolate
proteins into distinct fractions before subjecting them to microarray analysis for assessing
protein phosphorylation levels in cellular proteins and humoral response in cellular
proteins and tissue proteins. In addition other liquid separation methodologies,
particularly protein enrichment by reduction of complexity using affinity chromatography
and lectin enrichment chromatography are used to study glycosylated proteins in human
serum samples.
The first four chapters detail the development of an all liquid separations
techniques, protein microarray and mass spectrometry strategy that can be used to
highlight post translational modification changes as a function of cancer. Chapter 2
explains the utility of combining CF and NPS-RP-HPLC to protein microarrays to study
phosphorylation changes in breast cancer. The technique is applied to two breast cancer
cell lines AT1 and CA1a from the xenograft model of breast cancer resulting in the
identification of proteins from key cellular processes expressing differential
11
phosphorylation. Chapters 3, 4 and 5 are an overview of how such a technique can be
modified to study glycosylation changes in pancreatic and colon cancers respectively.
Instead of the CF/NPS-RP-HPLC platform, affinity chromatography for removal of the
top 12 abundant proteins from serum is coupled to lectin enrichment and NPS-RP-HPLC
after which proteins are arrayed on microarrays to assess changes in glycosylation states
as a function of cancer. Statistical analysis illustrates that such a methodology is
successful in distinguishing between normal and disease groups. Chapter 6 is a story of
how this 2D-liquid separations-protein microarray-MS/MS integrated technique can be
used to exploit the naturally present humoral response to disease in order to highlight
potential panels of biomarkers for pancreatic cancer. Using this approach a panel of 9
proteins is shown to distinguish between normal and cancer serum with good sensitivity
and specificity. This chapter illustrates the importance of choice of statistical method to
the nature of results obtained. Chapter 7 is an overview of a modification of the humoral
response measuring technique that enhances the sensitivity of humoral response
measurements.
Viewed together these chapters can be considered as a complete overview of how
separation technologies together with protein microarrays can be utilized to study
complex biological problems using a range of biological materials (cell lines, tissues,
serum) with particular focus on cancers.
12
1.6. References
[1] Holland, M. J., J Biol Chem 2002, 277, 14363-14366.
[2] Gygi, S. P., Rochon, Y., Franza, B. R., Aebersold, R., Mol Cell Biol 1999, 19, 1720-1730.
[3] Griffin, T. J., Gygi, S. P., Ideker, T., Rist, B., et al., Mol Cell Proteomics 2002, 1, 323-333.
[4] Hochstrasser, D. F., Sanchez, J. C., Appel, R. D., Proteomics 2002, 2, 807-812.
[5] Wilkins, M. R., Sanchez, J. C., Williams, K. L., Hochstrasser, D. F., Electrophoresis 1996, 17, 830-838.
[6] Jacobs, J. M., Adkins, J. N., Qian, W. J., Liu, T., et al., J Proteome Res 2005, 4, 1073-1085.
[7] Issaq, H. J., Chan, K. C., Janini, G. M., Conrads, T. P., Veenstra, T. D., J Chromatogr B Analyt Technol Biomed Life Sci 2005, 817, 35-47.
[8] O'Farrell, P. H., J Biol Chem 1975, 250, 4007-4021.
[9] Aebersold, R., J Am Soc Mass Spectrom 2003, 14, 685-695.
[10] Shevchenko, A., Wilm, M., Vorm, O., Mann, M., Anal Chem 1996, 68, 850-858.
[11] Gygi, S. P., Corthals, G. L., Zhang, Y., Rochon, Y., Aebersold, R., Proc Natl Acad Sci U S A 2000, 97, 9390-9395.
[12] Link, A. J., Eng, J., Schieltz, D. M., Carmack, E., et al., Nat Biotechnol 1999, 17, 676-682.
[13] Wall, D. B., Kachman, M. T., Gong, S., Hinderer, R., et al., Anal Chem 2000, 72, 1099-1111.
13
[14] Kachman, M. T., Wang, H., Schwartz, D. R., Cho, K. R., Lubman, D. M., Anal Chem 2002, 74, 1779-1791.
[15] Zhu, Y., Lubman, D. M., Electrophoresis 2004, 25, 949-958.
[16] Yan, F., Subramanian, B., Nakeff, A., Barder, T. J., et al., Anal Chem 2003, 75, 2299-2308.
[17] Wang, Y., Wu, R., Cho, K. R., Shedden, K. A., et al., Mol Cell Proteomics 2006, 5, 43-52.
[18] Zhang, H., Zha, X., Tan, Y., Hornbeck, P. V., et al., J Biol Chem 2002, 277, 39379-39387.
[43] Katilius, E., Flores, C., Woodbury, N. W., Nucleic Acids Res 2007, 35, 7626-7635.
15
[44] Li, Y., Lee, H. J., Corn, R. M., Nucleic Acids Res 2006, 34, 6416-6424.
[45] Wang, L., Cole, K. D., Peterson, A., He, H. J., et al., J Proteome Res 2007, 6, 4720-4727.
[46] Shafer, M. W., Mangold, L., Partin, A. W., Haab, B. B., Prostate 2007, 67, 255-267.
[47] Sanchez-Carbayo, M., Socci, N. D., Lozano, J. J., Haab, B. B., Cordon-Cardo, C., Am J Pathol 2006, 168, 93-103.
[48] Miller, J. C., Zhou, H., Kwekel, J., Cavallo, R., et al., Proteomics 2003, 3, 56-63.
[49] Machida, K., Thompson, C. M., Dierck, K., Jablonowski, K., et al., Mol Cell 2007, 26, 899-915.
[50] Cowherd, S. M., Espina, V. A., Petricoin, E. F., 3rd, Liotta, L. A., Clin Breast Cancer 2004, 5, 385-392.
[51] Pal, M., Moffa, A., Sreekumar, A., Ethier, S. P., et al., Anal Chem 2006, 78, 702-710.
[52] Taylor, B. S., Pal, M., Yu, J., Laxman, B., et al., Mol Cell Proteomics 2007.
[53] Yan, F., Sreekumar, A., Laxman, B., Chinnaiyan, A. M., et al., Proteomics 2003, 3, 1228-1235.
16
Chapter 2
A novel analysis scheme for assessing phosphorylation changes of high and medium abundant proteins in pre-malignant and malignant breast cell lines using 2D liquid
separations, protein microarrays and tandem mass spectrometry
2.1. Introduction
Breast cancer is the most frequently diagnosed cancer in women. More than
200,000 new cases of breast cancer, with over 41,000 deaths, were expected in the United
States in 2006.[1] Breast cancer related deaths have declined by approximately 2.3%
from 1990 to 2002 primarily due to earlier detection awareness as well as improved
treatment. While the five-year survival rate has increased to 98% for local-regional
disease, it is only 26% for women with distant metastases.[1] Understanding the
molecular mechanisms that underlie breast cancer development and progression to
malignancy may uncover better therapeutic targets with potential utility to further
decrease breast cancer mortality.
Aberrations in cellular signaling pathways have been associated with cancer
development and progression, as cancer cell survival and proliferation rates increase, and
as cancer cells become increasingly evasive to the immune system.[2-4] Growth factor
signals are propagated from the cell surface intracellular milieu by signaling pathways,
17
involving a variety of kinases such as membrane receptor kinases (EGFR, VEGF) and
cytoplasmic kinases (ERK, MEK, Ras, PI3-K and mTOR).[5] In cancer, these signaling
pathways are often dysregulated, resulting in a phenotype characterized by unfettered cell
growth and increased invasive potential. Cellular signaling is largely controlled by
transient, post-translational modifications of signaling proteins, which alter their ability to
bind and interact with downstream effectors.[4-6] Protein phosphorylation is one such
modification that primarily acts as a molecular switch to activate or deactivate cellular
signaling cascades.[4, 7, 8] A recent review by Krueger et al. lists several phosphorylated
proteins that are known to contribute to oncogenesis or are used in the context of a cancer
biomarker.[9] Proteins from all cellular compartments are represented in this list
including histones, HDACs, MAP kinases, Akt, PTEN, EGFRs and ILK.
A variety of techniques have been used to study phosphorylation expression on a
large scale.[10] One such technique involves incubation of cells with radioactive 32P
followed by 2D gel electrophoresis.[11] Although able to detect a wide dynamic range of
phosphoproteins, this method requires handling of radioactive orthophosphate which
makes it less favorable. In addition, the dependence on turnover rates at which the
orthophosphate is incorporated into proteins may reduce sensitivity of this technique. The
use of monoclonal and polyclonal antibodies specific to phosphorylated proteins to detect
global phosphoprotein patterns on gels[12] circumvents the use of radiolabels. However,
current available phosphoserine-specific and phosphothreonine-specific antibodies are
not always reliable and cannot detect phosphoproteins where steric hindrance prevents
antibody binding. More recently, a novel small molecule phosphosensor dye has been
reported for detecting phosphoproteins on both gel and microarray platforms.[13-16] This
18
dye is able to detect phosphotyrosine, serine and threonine residues and can discriminate
between thiophosphorylation and sulfation.
Gel-based methods have been considered the method of choice in studying global
protein expression, but more recently developed techniques have focused on liquid-based
methods due to the ease of coupling to mass spectrometers for protein identification. The
liquid-based method most frequently used for phosphoprotein analysis in complex
samples involves shotgun proteomics where a complex protein mixture is first digested
and enriched for phosphopeptides.[17-19] An enrichment step is often necessary since
phosphopeptide ionization is typically suppressed in the presence of many non-
phosphorylated peptides present in a complex sample. The enriched peptides are then
analyzed by LC-MS/MS with comprehensive database searching to confirm identity and
elucidate the phosphorylation site. A variety of enrichment methods have been developed
ranging from immobilized metal affinity chromatography[20, 21] to amphoteric oxide
based enrichment, frequently using titanium or zirconium dioxide,[22, 23] as well as
antibody based enrichment. While shotgun proteomics is a high throughput method at the
experimental front, it is very time-consuming at the analysis end since data must be
closely examined for possible false positives and negatives.
Quantitation of differentially expressed proteins by mass spectrometry is a further
challenge because in addition to the inefficient ionization and suppression of
phosphopeptide ions, efficient labeling methodologies are needed in order to make
quantitation possible. Currently available methodologies such as SILAC[24, 25],
ICAT[26] or iTRAQ[27, 28] can be used. SILAC involves stable isotope labeling of
proteins as they are produced in cultures therefore introducing problems of turnover rate
19
differences between proteins. Furthermore, ICAT may not be successful because it
requires the presence of a cystein residue for labeling and the frequency of occurrence of
a phosphopeptide with a cystein residue can be considered very low. In addition,
completeness of this labeling reaction is difficult to monitor especially when multiple
samples are being processed at the same time. Labeling at the peptide level also
eliminates intact protein information making quantitation ambiguous especially for
phosphoproteins that may exist as multiple isoforms or that have homology with other
cellular proteins because a peptide could belong to more than one protein. Furthermore,
in clinically relevant samples, even labeling may not be sufficient to detect very low
levels of phosphoproteins. Label free approaches where mass spectrometric signals are
directly compared to obtain quantitative information are also being developed.[29]
However such approaches require mass spectrometers with very high mass accuracy and
experiments with very precise and high reproducibility in order to ensure that the
quantitative information is accurate.
To overcome some of these limitations, we have been developing the coupling of
comprehensive 2D-liquid separation methods to protein microarray technology. We have
used this strategy previously to assess the phosphorylation status of all proteins in a cell
line that was treated with a specific protein kinase inhibitor.[30] While that study was
successful in highlighting phosphorylation changes caused by experimentally perturbing
a specific biological pathway, there are currently no reports investigating such changes in
naturally occurring disease states. A study comparing phosphorylation status in disease
states may have utility in elucidation of pathways that play a role in the progression of
disease.
20
A xenograft model of human breast disease progression has been developed from
the MCF10A breast epithelial cell lines. Selected cell lines within the series are
representative of normal, pre-malignant and malignant phenotypes.[31-33] T24 c-Ha-ras
oncogene-transfected MCF10A cells (MCF10AneoT) form small, flat nodules in
Nude/Beige mice which persist for the life span of the host and sporadically progress to
carcinomas. A variant cell line (MCF10AT1), derived from one xenograft, not only forms
simple differentiated ducts which persist in xenografts and sporadically progress to
carcinoma, but also forms intermediate proliferative lesions resembling proliferative
disease without atypia, atypical hyperplasia, and carcinoma in situ. By establishing cells
in culture representing different stages in progression of MCF10AT through atypical
hyperplasia to carcinoma, interruption of progression has been made possible. These cell
lines continue to progress when reimplanted in vivo in immune deficient mice but are
sufficiently stable in vitro to provide the tools essential for the genetic analysis of
progression. MCF10AT cells express estrogen receptor (ER) and estradiol (E2)
accelerates progression of the premalignant xenograft lesions. Fully malignant variants
(MCF10CA lines), some of which are metastatic have also been recently derived.
Although many cancers are ER- negative and E2 independent, the early stages of disease
may have been E2 responsive. It is hypothesized that E2 independent carcinomas
(represented by the MCF10CA lines in the model) may constitutively express proteins
that are altered by E2 in earlier premalignant stages (such as MCF10AT1). Attempting to
identify genes expressed constitutively in malignant MCF10CA variants that are also
induced by E2 in premalignant MCF10AT1 cells are currently in progress.
21
In this study we compared the phosphoproteome of pre-malignant (MCF10AT1)
and malignant (MCF10CA1a c11) cell lines using a 2-dimensional liquid-phase
separation method coupled to protein microarray technology. These two particular cell
lines were chosen because they are both ER positive and therefore similar to each other
despite the different phenotype they present. The naturally occurring, arrayed proteins
were probed with the small-molecule phosphosensor dye, ProQ Diamond and anti-
phosphotyrosine antibodies. The strategy enabled us to detect and identify differentially
expressed phosphoproteins and to determine specific changes associated with the
premalignant and malignant phenotypes.
2.2. Experimental Section
Sample Preparation/Cell lines: The premalignant AT1 cell line (MCF10AT1) and
malignant CA1a cell line (MCF10CA1a c11) were both derived from the MCF10A
human breast cell line and were maintained and prepared as previously described [31,
33].
Cell lysis, buffer exchange and protein quantitation: Cells were mixed with lysis
buffer containing 7 M urea, 2 M thiourea, 100 mM dithiothreitol (DTT), 2% n-octyl G-D-
glucopyranoside (OG), 10% glycerol, 10 mM sodium orthovanadate, 10 mM sodium
fluoride (all from Sigma, St. Louis, MO), 0.5% Biolyte ampholyte (Bio-Rad, Hercules,
CA), and protease inhibitor cocktail (Roche Diagnostics, GmBH, Mannheim, Germany)
with vortexing at room temperature for 1 hr. Cellular debris and other insoluble materials
were removed by centrifuging the mixture at 80000 x g for 1 hr 15 min. The supernatant
was subjected to buffer exchange in order to replace the lysis buffer with start buffer
22
(composition described later) for chromatofocusing using a PD-10 G-25 column
(Amersham Biosciences, Piscataway, NJ). The protein concentration was determined
using the Bradford Protein Assay kit with bovine serum albumin (BSA, Bio-Rad)
standard.
Chromatofocusing (CF): The CF experiment was performed using a Beckman System
Gold model 127 pump and 166 UV detector module (Beckman Coulter, Fullerton, CA)
with a HPCF-1D prep column (250 mm L x 4.6 mm ID, Eprogen, Darien, IL). A linear
pH gradient was generated using a combination of start buffer (SB) composed of 6 M
urea, 25 mM BisTris, and 0.2% OG and elution buffer (EB) containing 6 M urea, 0.2%
OG, and 10% polybuffer 74 (Amersham Biosciences). Saturated iminodiacetic acid
(Sigma) was used to adjust the pH of SB at 7.2 and EB at 3.9. The column was first
equilibrated in SB until the pH of the column was the same as start buffer by monitoring
with a post detector online assembly of a pH-flow cell (Lazar Research Laboratories, Los
Angeles, CA). After equilibration, ~10 mg of sample was loaded onto the column at a
low flow rate to allow for interactions of the proteins with the binding sites. Once a
baseline was achieved, solvent flow was switched to EB and the flow rate was set to 1
mL/min for CF fraction collection at the intervals of 0.2 pH units along the linear
gradient, where the elution profile was recorded at 280 nm. At the end of the gradient, the
column was flushed with 1 M sodium chloride (Sigma) to remove any proteins still
bound to the column. All collected samples were stored at -80oC until further analysis.
Non-porous silica reversed-phase HPLC: Each CF fraction was loaded onto a non-
porous silica reversed-phase (NPS-RP) HPLC column for further separation. An ODSIII-
E (8 x 33mm) column (Eprogen, Inc., Darien, IL) packed with 1.5 um non-porous silica
23
was used to achieve high separation efficiency. The separation was performed at a flow
rate of 1 mL/min using a water/acetonitrile solvent system (A was 0.1% TFA in
deionized water and B was acetonitrile and 0.1% TFA) and the gradient used was: 5-15%
B in 1 min, 15-25% B in 2 min, 25-31% B in 3 min, 31-41% B in 10 min, 41-47% B in 3
min, 47-67% B in 4 min, 67-100% B in 1 min, followed by maintaining the system at
100% B for 3 min. Separation was monitored at 214 nm using a Beckman 166 model UV
detector (Beckman-Coulter). Purified protein peaks were collected in deep-well 96 well
plates using an automated fraction collector (model SC 100; Beckman-Coulter),
controlled by in-house-designed DOS-based software. The column was maintained at
60oC during separation to enhance reproducibility, speed and resolution. Following
protein fractionation, the samples were stored at -80oC until further use.
Protein microarrays:
1. Array spotting:
All fractions were transferred to shallow-well print plates (Bio-Rad) and were lyophilized
to dryness. The samples were resuspended in printing buffer, consisting of 62.5 mM Tris-
1% glycerol in 1X PBS, and were left agitating on an orbital shaker overnight. Printing
was accomplished by depositing 5 droplets of ~500 pL each per fraction using a
piezoelectric dispenser (Nanoplotter 2, GeSiM). Distance between spots was maintained
at 600 µm and spot sizes were found to be ~450 µm. Prior to processing all slides were
kept sealed in a dessicator.
2. Array processing with ProQ Diamond dye:
24
Slides were blocked overnight in 1% BSA (Roche) in 1X PBS-T (0.1% Tween 20). They
were then incubated for 1 hr in ProQ Diamond phosphoprotein gel stain (Invitrogen). The
slides were then washed in destaining solution (Invitrogen) 3 times for 10 min each, then
rinsed with nuclease free water and dried by centrifugation. The slides were scanned in
the green channel using an Axon 4000A scanner, and GenePix Pro 6.0 software
(Molecular Devices, Sunnyvale, CA) was used for data acquisition and analysis. Spots
were considered to be positively fluorescent if background subtracted intensity of the spot
was >X2 the local background intensity around the spot.
3. Array processing with anti-tyrosine antibodies:
Slides processed and scanned with ProQ diamond dye were rehydrated and then
incubated in mouse monoclonal antiphosphotyrosine, 4G10 clone antibody (Upstate,
Charlottesville, VA) diluted to 2 ug/mL in probe buffer (5 mM magnesium chloride, 0.5
mM DTT, 0.05% TritonX 100 and 5% glycerol in 1X PBS). After primary incubation the
slides were washed (5 times, 5 min each) in probe buffer. Secondary incubation was
performed for 1hr using donkey anti-mouse antibody conjugated to fluorescent cy5 at a
concentration of 1 ug/mL in probe buffer. The slides were finally washed (5 times, 5 min
each) in probe buffer and scanned in the red channel. Once again, spots were considered
to be positively fluorescent if background subtracted intensity of the spot was >X2 the
local background intensity around the spot.
Removal of SDS from samples: Prior to digestion and protein identification by mass
spectrometry samples were cleaned using Detergent-OUT SDS-300 spin columns (G-
Biosciences, St Louis, MO) to remove residual sodium dodecyl sulfoxide (SDS) that was
25
present during reconstitution into print buffer as per the user guide. In short, spin columns
were inverted to re-suspend resin and liquid was drained off by spinning at 1000xg for 10
s. Columns were then equilibrated with 1.5 mL deionized water which was collected in a
centrifuge tube and discarded. Sample was then applied to the spin columns and was let
to stand for 5 minutes. After the columns were loaded they were centrifuged at 1000xg
for 30 s and the SDS-free sample was collected in a centrifuge tube.
Trypsin digestion: The samples were dried down to 10 µL, and then 40 uL of 100 mM
ammonium bicarbonate and 10 µL of 10 mM DTT were added to sample. The samples
were incubated at 60oC for 20 min to allow for reduction of disulfide bonds. 0.5 uL of
TPCK modified sequence grade trypsin (Promega) was added and the samples were
incubated at 37oC overnight. Digestion was stopped by adding 1 uL of TFA to the
digestion mixture.
Peptide sequencing by LC-MS/MS: Digested samples were separated by a capillary RP
column (MagicAQ C18, 0.1 × 150 mm) (Michrom Biosciences, Auburn, CA) on a
Paradigm MG4 micropump (Michrom Biosciences) with a flow rate of 300 nL/min. The
gradient was started at 3% ACN, ramped to 35% ACN in 25 min, 60% ACN in 15 min,
90% in 1 min, maintained at 90% ACN for 1 min and finally ramped back down to 3% in
another 1 min. Both solvents A (water) and B (ACN) contained 0.1% formic acid. The
resolved peptides were analyzed on an LTQ mass spectrometer (Thermo, San Jose, CA)
with an NANO-ESI platform (Michrom Biosciences). The capillary temperature was set
at 200oC, the spray voltage was 2.5 kV, and the capillary voltage was 20 V. The
normalized collision energy was set at 35% for MS/MS. The top 5 peaks were selected
for CID. Precursor selection was based upon a normalized threshold of 30 counts/s.
26
MS/MS spectra were searched using the SEQUEST algorithm incorporated in Bioworks
software (Thermo) against the Swiss-Prot human protein database with Trypsin as the
enzyme. Additional search parameters were as follows: (2) allowing two missed
cleavages; (3) possible modifications, oxidation of M and phosphorylation of S, T and Y;
(4) peptide ion mass tolerance 1.50 Da; (5) fragment ion mass tolerance 0.0 Da; (6)
peptide charges +1, +2, and +3. The filter function in Bioworks browser was applied to
set a single threshold to consider peptides assigned with Xcorr values as follows: 1.5 for
singly charged ions, 2.5 for doubly charged ions, and 3.5 for triply charged ions.
2.3. Results and Discussion
The overall strategy we used for the large scale analysis of cellular protein
phosphorylation status is outlined in Figure 2.1. Fractionation of the sample to reduce
complexity, was achieved by separation in two dimensions, initially by chromatofocusing
(according to the protein pI), and then by RP-HPLC, according to their hydrophobicity.
Fractions were manually collected by peaks and each cell line resulted in approximately
1200 fractions after the complete 2-dimensional separation. The fractionated proteins
were then printed onto microarrays and analyzed by hybridization with a universal
phosphoprotein stain, and with antibodies specific to phosphorylated tyrosine residues.
140 spots were found to exhibit a positive response to the ProQ dye. Sequence analysis of
specific phosphoproteins for confident identification was achieved by peptide sequencing
using tandem MS/MS. This combinatorial approach overcomes many of the limitations
inherent in single-method analyses. Phosphorylation sites have proved difficult to
identify by mass spectrometry alone due to poor ionization efficiency and low abundance
27
of phosphopeptides. Additionally, mass spectrometric methods are not reliable for
assessing global phosphorylation in a time-efficient manner. The proposed strategy is
high-throughput in nature and a method of choice in initial screening to find differentially
expressed proteins over the whole proteome in a sample of interest.
2D liquid separation and microarray reproducibility: A comparison of the 2-
dimensional liquid separation (pH 4.0-7.2) is illustrated in Figure 2.2. On the left is a 2D
UV map of the pre-malignant AT1 cell line, while on the right is the same for the
malignant CA1a cell line. In the center is the comparison of the two maps. It can be seen
that while the overall 2D maps are very similar for both cell lines, several differences are
revealed. In particular, many proteins are more highly expressed in the malignant cell
line, CA1a in the pH range 6.6-7.0 (corresponding to lanes 13 and 14 in Figure 2). Most
of these proteins elute during the 1st half of the HPLC run. Sixty nine proteins were
detected in the pH range 6.6-7.0 based upon LC-MS/MS experiments in the malignant
CA1a cell line.
Comparative screening of the protein microarrays was achieved using the global
phosphoprotein stain ProQ Diamond and antibodies specific to phosphorylated tyrosine
residues. To investigate the binding properties of ProQ phosphor-stain and antibodies,
protein and peptide standards were printed on SuperAmine slides. The slides were then
probed initially with the phosphoprotein stain, ProQ Diamond, followed by a monoclonal
anti-phosphotyrosine antibody (Figure 2.3a). While ovalbumin and β-Casein solely
contain phosphoserine and phosphothreonine residues and therefore fluoresce green as a
result of staining, the phosphotyrosine peptide (pY) mixture appears red. This occurs
28
because the antibody for phosphotyrosine displaces the ProQ and binds to the
phosphotyrosine residues present in that spot. Subsequently, a red fluorescently tagged
secondary antibody (in this case, an anti-anti-phosphotyrosine antibody conjugated to
cy5) binds to the primary anti-phosphotyrosine antibody resulting in a red spot. A section
of microarray generated by spotting of pre-malignant AT1 and malignant CA1a is also
shown in Figure 2.3b. It can be seen that several fluorescing protein spots indicate the
presence of phosphorylation. More importantly, figure 2.3b shows that the protein
contents that were being used in the 2-dimensional separation were sufficient for
microarray analysis.
Given the dynamic nature of cellular phosphorylation, we undertook a reproducibility
study in order to better indicate the biological relevance of our phospho-profile findings.
3 separately grown CA1a cell line batches and 2 separately grown AT1 cell line batches
were independently subjected to the entire analytical strategy, including 2D liquid
separations, protein microarray and mass spectrometry. Several pH ranges were selected
to assess reproducibility for all samples.
Figure 2.4 illustrates the results obtained. When looking at the chromatofocusing result
(Figure 2.4a.), where pH fractions as collected could be monitored online for pH via a pH
electrode assembly, it can be seen that for all separations a reproducible pH gradient was
obtained. Furthermore, it can be seen for the CA1a cell line that all separated samples
resulted in very similar and reproducible separation profiles. Similar separation profiles
were also observed for the 2 batches of AT1 cell lines run. However, although the peak
patterns were very similar they were not identical as in the case of CA1a. This difference
was explained by the fact that while all other samples were loaded at a total protein
29
content of 4.5 mg, one of the AT1 samples had a lower total protein content of only 3 mg
which resulted in an overall lower signal during the acquisition of the chromatogram. A
comparison of the two batches of chromatograms suggests some subtle differences
between CA1a and AT1 particularly in the higher pH range of about 7.0-6.2 and in the
lower pH range around 5.6-5.2.
In order to further assess these subtle differences, selected pH ranges were subjected to
NPS-RP-HPLC. Example chromatograms illustrating these separations are shown in
Figure 2.4b. A high level of reproducibility is seen in both the independently grown
batches of CA1a and AT1 samples analyzed. Furthermore, the subtle differences that
were seen in the CF profiles are better visualized in the 2nd dimension. It can be seen that
the malignant CA1a cells contains more hydrophilic protein peaks relative to the pre-
malignant AT1 cells.
Fractionated samples from the 2nd dimension were arrayed on glass slides and probed
with ProQ diamond dye to assess the phosphorylation status of the proteins. It is possible
that while the chromatograms appear reproducible, the phosphorylation status of the
protein may not be the same, making it necessary to assess reproducibility at the
microarray level. Five slides were printed and probed with ProQ dye to assess the
reproducibility of the printing and hybridization process. Figure 2.4c shows slide images
of spots that were arrayed from selected pH ranges. It can be seen that all spots show
consistently similar size and shape indicating that the printing process is consistent and
reproducible. Slight variation in background intensities between the slides can be
attributed to variation in slide surfaces and experimental variation during hybridization.
However, these variations do not alter the number of positive spots of the array and
30
therefore do not affect the results significantly. Figure 2.4d illustrates sample biological
reproducibility data obtained using the 3 CA1a and the 2 AT1 batches. It can be seen that
for the pH range 6.4-6.2 there is a phosphorylated protein that elutes around retention
time 26 min for all samples of CA1a and AT1 that were analyzed. However, for the pH
range 5.2-5.0 there is a phosphoprotein (retention time 28 min) that is present only in
CA1a samples. The reproducibility experiment revealed that consistent, differential
phosphoprotein expressions were achievable across samples and batches.
It was also important to verify that the proteins present in consistently detected spots on
the microarray were in fact the same proteins across samples. To this end, SDS was
removed from selected sample fractions to be printed on arrays (as outlined in the
methods section), proteins were trypsinized and then analyzed by tandem MS. Table 2.1
shows the protein IDs of the two spots that appeared positive for the CA1a samples in the
pH range 6.4-6.2. In all cases, the proteins present in specific microarray spots were the
same proteins. These analyses show that the strategy and the techniques are highly
reproducible and confirm that the differential expression of specific phosphoproteins is
maintained in the MCF10A tumor progression model.
Cell-Associated phosphoprotein profiles: All spots representing the same region of the
2D UV map from the two cell lines were compared to identify differential
phosphorylation profiles. Pre-malignant and malignant samples were printed on
microscopic glass slides with a chemically modified amine surface for studies with ProQ
and antiphosphotyrosine antibodies. For each comparison, at least 5 replicate slides were
processed. Of the phosphoproteins whose modification sites were identified, 11 proteins
31
were seen to be phosphorylated in the pre-malignant cell line but not the malignant cell
line, and 16 proteins were seen to be phosphorylated in the malignant cell line but not the
pre-malignant cell line. Examples of the differences observed, together with the identity
of the protein as determined by tandem mass spectrometry, are illustrated in Figure 2.5.
In some cases a protein eluted over multiple peaks due to diffusional broadening during
sample collection. These proteins appear in multiple spots in the figures. Furthermore,
there were instances where more than one phosphoprotein eluted at almost the same
retention time. In these cases both protein identities are shown in the figure. Overall, 51
phosphorylation sites from a total of 27 proteins were identified. In addition, 47
previously reported phosphoproteins were also identified, but no phosphorylation site
verification was obtained through the MS/MS data. Although dynamic exclusion was
used to ensure that peptides eluting over a longer time were not continuously selected for
tandem MS/MS analysis, it is possible that more sites were not identified due to the low
signal intensities of phosphopeptides which rendered them undetectable using the top 5
ion peak selection used during our tandem MS runs. Furthermore, 3 phosphoproteins
were shown to not be differentially expressed in the two cell lines. All phosphoproteins
identified with site validation are listed in Table 2.2, along with information about the
number of peptides and protein coverage pertinent to protein identification. Table 2.3 also
lists all phosphoproteins identified without site validation. Site verification was not
possible for these peptides due to low sample amounts. We did investigate
phosphopeptide enrichment using titanium dioxide tips to improve yield, but without
improvement. The results presented herein correlate well with previous work where
approximately 155 spots in a 2D gel stained positive for phosphorylation using the ProQ
32
Diamond dye.[34] In another study about 100 proteins showed a change in
phosphorylation upon stimulation of fibroblast cells where detection on 2D gels was
facilitated by using antiphosphotyrosine and antiphosphoserine antibodies.[35] Our
proposed strategy bypasses the problems associated with 2 dimensional gel
electrophoresis but provides equivalent and complementary information about protein
phosphorylation at the intact protein level which can be useful especially when site
verification from mass spectrometric data presents a difficulty due to poor
phosphopeptide spectra, which is often the case.
The pie chart in Figure 2.6 shows the cellular distribution of proteins whose modification
sites were verified regardless of whether the phosphorylation was found in the pre-
malignant or malignant cell line. Interestingly, of the 27 differentially phosphorylated
proteins whose modified sites could be verified by tandem mass spectrometry, 18 were
nuclear proteins (about 67% of all proteins identified). This trend of differential
phosphoprotein expression in the nuclear region was also observed for those proteins
whose sites were not verified. Closer examination of the proteins showed that the
malignant CA1a cell line exhibited increased phosphorylation of nuclear proteins
compared to the pre-malignant AT1 cell line.
It should be noted that a majority of the proteins that were detected and identified as
being differentially phosphorylated in this work are of high to medium abundance. In this
work we observed 85 differentially expressed spots (corresponding to a total of 75
phosphoproteins of which we were able to identify phosphorylation sites from 27
proteins) although we observed a total of 140 protein spots that responded to ProQ
Diamond dye. The information that can be found from this work can therefore shed light
33
on the downstream effects of phosphorylation signaling cascades. However information
about the very first changes that occur in a pathway were not detected since these occur
on molecules with very low copy numbers in the cell which are generally below the
detection limit of the ProQ dye.
An interesting phenomenon that we observed in our experiments was the shifts in pI due
to phosphorylation. For example, in table 2.2 it can be seen the protein Lamin A/C
appears multiple times. This protein was seen over more than one pH range. In addition it
was found that the phosphorylation sites on the protein that were detectable using the
unenriched samples were different for each pH range where the protein was observed.
This phenomenon illustrates an important aspect about the effect of post translational
modifications on protein pI. Previous work from our lab has shown that addition of a post
translational modification on a protein changes the protein pI[36] and microarray data
from this study further support these findings.
Functional grouping of phenotype-associated phosphoprotein profiles: Many of the
differentially expressed phosphoproteins identified in this study fall under distinct
categories with respect to the biological processes in which they are involved. Figure 2.7
summarizes these proteins according to their functional role in cellular processes. The
majority of differentially phosphorylated proteins were found to be upregulated in the
malignant CA1a cell line. A few key proteins that were found to be more phosphorylated
in the non-malignant AT1 appear in a box with broken lines in the same figure.
Transcriptional and translational proteins were in the majority, while mitotic and
apoptosis-related proteins were also represented. In addition, a separate class of enzymes
34
as well as proteins that maintain cytoskeletal integrity were observed to change in their
phosphorylation state as a function of malignant cellular phenotype. A discussion of
some of the known roles of the phosphoproteins identified in this study is given below.
• Apoptotic signaling:
Proteins involved in the regulation of apoptosis are important determinants of cell
proliferation and survival in malignant phenotypes. Stimulatory growth factor signaling
and inhibitory stress factors initiate signal transduction pathways that regulate apoptosis
via altering the phosphorylation of key regulating proteins. Three proteins important in
the regulation of apoptosis, Bad, Bax and Acinus were differentially phosphorylated in
AT1 and CA1a cells. While phosphorylated acinus was only found in CA1a, Bad and
Bax phosphorylated forms were uniquely seen in AT1.
Growth factor induced phosphorylation of BAD protects cells from apoptotic stimuli.
PI3K/Akt, Ras/MAPK/Rak, and PKA pathways all phosphorylate BAD. When serines at
112, 136, and 155 are phosphorylated, BAD is bound to an inactive complex.[37] In
LNCaP human prostate cancer cells, phosphorylated sites necessary for activity varied
with the survival signaling pathway.[38] Because malignant cells would be expected to
have diminished sensitivity to apoptotic signals, phosphorylation of BAD in AT1 relative
to CA1a suggests that additional sites other than the previously reported critical three
serines are phosphorylated in AT1 cells.
The consequence of phosphorylated threonines at 135 and 140 in Bax in AT1 cells is
unknown. Both apoptotic and anti-apoptotic activities have been associated with
phosphorylation at different sites in other cells. Phosphorylation of serine 184 inhibits
pro-apoptotic function of Bax in A549 human lung cancer cells[39] whereas
35
phosphorylation of threonine 167 in Bax activates apoptotic activity in HepG2 human
hepatoma cells.[40]
Acinus, apoptotic chromatin condensation inducer in the nucleus protein (Accesion
number Q9UKV3), is also a direct target of Akt and phosphorylation on serines 422 and
573 inhibits apoptosis in HEK293 cells, possibly by preventing caspase-mediated
cleavage to a form that is necessary for chromatin condensation and apoptosis.[41]
Acinus was uniquely seen to be phosphorylated in only the malignant CA1a cells,
according to both the microarray and mass spectrometry data. The phosphorylation site
that was identified was located on S1004, as shown in Figure 2.8a. Multiple peptides
from the protein were sequenced, some of which were in the a.a 800-900 region of the
protein. Interestingly it is known that the active form of the protein is a caspase-cleaved
isoform, p17 which consists of the sequence a.a 987-1093. It was thus confirmed that the
unprocessed, and therefore inactive, isoform was present in the cell line suggesting the
absence of apoptotic chromatin condensation. Suppression of apoptosis may be
instrumental to the malignant nature of the cell line.
• Transcriptional regulation:
This study showed that several proteins involved in transcriptional regulation were
differentially phosphorylated in the two cell lines. Several histones were more
phosphorylated in CA1a. Histones are typically positively charged to hold the negatively
charged DNA in its condensed form. Phosphorylation of histones imparts negative charge
so that DNA is less tightly bound and is thus available for manipulation. Zfp-36 and
nucleolar phosphoprotein p130 are transcriptional regulatory proteins that were seen to be
more phosphorylated in the malignant CA1a. SAF-B is a scaffold attachment factor that
36
regulates the formation of the transcriptosomal complex and is also thought to be a
corepressor of the estrogen receptor, a pivotal factor in breast cancer phenotypes. SAF-B
is known to decrease cell proliferation by reducing transcription of HSP-27. Interestingly
this protein was phosphorylated in the pre-malignant AT1.
• Protein synthesis:
In addition to an increase in transcription-related phosphorylation, a parallel increase was
seen in translational proteins in the malignant CA1a cell line compared to the pre-
malignant AT1. Protein identifications as confirmed by tandem mass spectrometry
showed the expression of large numbers of ribosomal proteins in malignant CA1a
compared to AT1. These protein IDs are listed in table 2.4. The higher level of expression
of ribosome related proteins suggests increased translational activity in the malignant
breast cancer cell line. One of these proteins, 60S ribosomal protein L14, was confirmed
to be phosphorylated on serine residue 138. No phosphorylation sites on this protein have
previously been reported. When comparing the region of the reverse phase chromatogram
where this protein eluted (Fig 2.8B.), it can be seen that distinct and unique peak patterns
are evident in both the CA1a and AT1 cell lines. L14 ribosomal protein was only
identified in the CA1a cell line.
• Mitosis:
Malignant cells tend to have increased rates of mitosis due to their proliferative nature.
Proteins involved in mitotic spindle formation appeared to be differentially
phosphorylated between the two cell lines. One such protein, Stathmin (Op18) was
uniquely phosphorylated in only the pre-malignant AT1. This protein regulates the
microtubule filament system by destabilizing microtubule assembly.
37
Nuclear migration protein (NudC) and microtubule associated protein (MAP4) are
involved in correct formation of mitotic spindle. NudC is also involved in cytokinesis and
cell proliferation. A higher expression of phosphorylated NudC could be indicative of the
malignant nature of the CA1a cell line.
Heat Shock protein beta-1 is a stress related protein which is found in the cytoplasm but
which colocalizes with mitotic spindles and migrates to the nucleus during stress.
Increased phosphorylation of this protein in the malignant cell line could act as a signal
for localization to a particular part of the cell.
Nuclear envelope disintegration is an integral component of mitosis. Lamins provide a
framework for the nuclear envelope and may also indirectly interact with chromatin. In
both cell lines, different forms of Lamin were confirmed to be phosphorylated by tandem
mass spectrometry. Lamins are known to be extensively phosphorylated prior to nuclear
disintegration during the mitosis process. Six phosphorylation sites were found on Lamin
A/C in the CA1a malignant cell line, of which 2 had not been previously reported (S17
and S18). In addition, 7 sites were found on Lamin A/C in the pre-malignant AT1 cell
line. Three of these sites were the same as the ones found in the CA1a cell line, while 4
were unique, of which 1 was predicted to be phosphorylated although no experimental
evidence has been previously reported. Lamin phosphorylation is involved in regulation
of Lamin interactions making the differential phosphorylation of this protein between the
two cell lines particularly noteworthy.
• Enzymes:
Few proteins involved in anabolic or catabolic enzymatic processes showed
phosphorylation differences between AT1 and CA1a cells. However, 2 examples with
38
relevance to cancer progression were aromatase and alpha enolase. Alpha enolase
(MBP1) is a multifunctional enzyme playing a role in many processes, including
glycolysis and growth control. When MPB1 binds to the c-myc promoter, it acts as a
transcriptional repressor. Alpha-enolase has been implicated as a potential diagnostic
marker for many cancers. In this study, MPB1 was identified in a phosphorylated form in
only the AT1 cell line. Aromatase catalyzes the conversion of testosterone to estradiol. It
has been reported that a kinase activity may be involved in the regulation of this catalytic
process.[42] In this study, a phosphorylated form of aromatase was uniquely found in the
pre-malignant AT1 cell line. It is plausible that phosphorylation of this enzyme renders it
inactive. Consequently, the absence of estradiol in the pre-malignant AT1 may reduce the
proliferative capability of the cell line.
Differential expression of proteins in pI range 7.0-6.6: Both the first and second
dimension chromatograms suggested an increased level of protein in the higher pH
separation range in the malignant CA1a cell line as compared to the pre-malignant AT1
cell line. Proteins from the range 7.0-6.6 in the malignant, CA1a cell line were analyzed
and identified by tandem MS to see if this increase was specific to any particular class of
proteins. Figure 2.9 shows a chromatogram of the 2nd dimension separation in the 7.0-6.8
pH range. Interestingly, most identified proteins were ribosomal proteins and other
proteins that regulate ribosomal function and genesis as shown in table 2.4. A majority of
the proteins identified are known to be phosphorylated and often times the presence or
absence of phosphorylation determines their location or activation status in the cell.
Furthermore, a large number of positive spots in the microarray (which suggested that the
protein in the spot was phosphorylated) corresponded to the fractions analyzed in this
39
high pH region as mentioned earlier. We were unable to locate the phosphorylation sites
on all of these proteins, partly due to the low sequence coverage as most ribosomal
proteins have low molecular weights. The theoretical iso-electric points of these
ribosomal proteins are beyond the detection and separation capabilities of CF (between
pH 8 and 11). It is likely that there appeared to be a higher expression of these proteins in
the malignant CA1a because in fact these proteins were phosphorylated in the malignant
cell line and therefore acquired a lower pI that made them detectable using the separation
scheme used in these experiments.
2.4. Conclusion
We have presented a protein microarray approach coupled to 2D liquid separations for
studying phosphorylation differences in a model of breast cancer progression. A
comparison of pre-malignant versus malignant breast cells has not been previously
reported using the strategy described here. A total of 51 phosphorylation sites in 27
different proteins were confirmed using tandem mass spectrometry and the status of these
proteins was found to be specifically associated with the cellular phenotype. 48 additional
previously known phosphoproteins were identified without site confirmation. The
ontological association of the differentially expressed phosphoproteins included mitosis,
apoptosis suppression and translational control. The research presented here illustrates
the use of protein microarrays together with mass spectrometry as complementary tools
to study phosphoproteins in complex samples. The microarray is often able to detect the
presence of phosphorylation not detected by mass spectrometry without using enrichment
techniques. When sample amounts are too low to permit enrichment the inability to detect
phosphorylation by mass spectrometry becomes a critical issue, making the protein
40
microarray strategy a valuable alternative means of detecting high to medium abundance
phosphoproteins which play a pivotal role in cellular phenotype. Site mapping by mass
spectrometry would subsequently be needed for complete characterization; however the
strategy outlined above can be used as an effective and rapid initial screen.
41
Table 2.1: Protein IDs and peptides identified for selected microarray spots that were reproducibly positive from pH range 5.4-5.3 (as shown in figure 2.4c).
S22, S390, S392, S652. By similarity S407, S496, T505,
S507, T510,
X nucleus
45
Table 2.3: Previously known phosphoproteins also identified as differentially expressed in this study without confirmation of phosphorylation site(s). All additional information provided was obtained from the Swissprot database.
Protein found in
Accesion #, Phosphoprotein pH range
# Peptides identified
previously reported site AT1 CA1A cellular
location
P16989 DNA-binding protein A (Cold shock domain protein A) (Single-strand DNA binding protein NF-GMB).
7.0-6.8 3 experimental S34 X nucleus, cytoplasm
P83731 60S ribosomal protein L24 (Ribosomal protein L30). 7.0-6.8 1 by similarity T83,
S86 X
P67809 Nuclease sensitive element binding protein 1 (Y-box binding protein 1) (Y-box transcription factor) (YB-1) (CCAAT-binding transcription factor I subunit A) (CBF-A)
7.0-6.8 3 expermental S102, Y162; by similarity S314
Table 2.4: Early eluting proteins from pH 7.0-6.6 identified from the malignant CA1a cell line. Any non-experimental information was obtained from the Swissprot database.
Protein Acc # Peps seqd
Phospho sites identified Function Known
phosphos
Nucleolar RNA helicase II (Nucleolar RNA helicase Gu) (RH II/Gu) (DEAD-box protein 21).
Q9NR30 6 cofactor for c-Jun-
activated transcription
pS71, pS89, pS121, pS171
Proliferating-cell nucleolar antigen p120 P46087 6 regulation of the cell cycle
pS58, pS181, pT195, pT603,
pS732
Ribosome biogenesis regulatory protein homolog Q15050 4
Figure 2.2: 2D liquid separation of pre-malignant AT1 and malignant CA1a cell lines. Each lane represents a pH fraction different by 0.2 units. Vertical axis refers to the retention time during the separation. Intensity of the bands corresponds to peak heights which ranged from a value of 100 mV to 990 mV. Difference between premalignant and malignant sample appears in the middle panel
Ret
entio
n tim
e (m
in) /
Hyd
roph
obic
ityR
eten
tion
time
(min
) / H
ydro
phob
icity
Chromatogram intensities from 100 mV to 990 mV in
AT1
CA1a
Chromatogram intensities from 100 mV to 990 mV in
AT1
CA1a
54
pY
pY + pS or pT
Ovalbumin pS + pT only
B-Casein pS and pT only
pY protein mixture pY only
b) pYpY +
pS or pT pYpY +
pS or pT
Ovalbumin pS + pT only
B-Casein pS and pT only
pY protein mixture pY only
a)a) b) Figure 2.3: Detecting phosphoproteins on microarrays using ProQ Diamond dye and anti-phosphotyrosine antibodies. (a) A study done with standards where ovalbumin, B-casein and a mixture of tyrosine phosphorylated proteins were used. Notice that when probed with both ProQ and anti pY antibody, solely pY proteins appear red, mixture of pY and pS or pT appear yellow and solely pS or pT appear green. (b) An image of a section of a protein microarray containing fractionated proteins from a malignant breast whole cell lysate.
55
Figure 2.4: a)
)
AU
Minutes20 30 40 50 60 70 80 90 100 110
AU
-0.02
-0.01
0.00
0.01
0.02
0.03
0.04
0.05
0.06
pH
4.0
4.5
5.0
5.5
6.0
6.5
7.0
7.5
8.0
UV-1061507-CA1a-3-CF061507-CA1a-3-CF.dat
UV-1061707-CA1a-1-CF061707-CA1a-1-CF.dat
pH Monitor061407-CA1a-2-CF061407-CA1a-2-CF.dat
pH Monitor061507-CA1a-3-CF061507-CA1a-3-CF.dat
pH Monitor061707-CA1a-1-CF061707-CA1a-1-CF.dat
Minutes20 30 40 50 60 70 80 90 100 110
-0.025
-0.020
-0.015
-0.010
-0.005
0.000
0.005
0.010
0.015
0.020
0.025
pH
3.0
3.5
4.0
4.5
5.0
5.5
6.0
6.5
7.0
7.5
UV-1062107-AT1-3-CF062107-AT1-3-CF.dat
pH Monitor062007-AT1-2-CF062007-AT1-2-CF.dat
pH Monitor062107-AT1-3-CF062107-AT1-3-CF.dat
b)
5 10 15 20 25 30
0100200300400500600700800900
100011001200130014001500160017001800
Abso
rban
ce a
t 214
nm
(AU
)
Retention time (min)
5 10 15 20 25 30
0
200
400
600
800
1000
1200
1400
1600
Abso
rban
ce a
t 214
nm
(AU
)
AT1
Retention time (min)
CA1a
5 10 15 20 25 30-100
0
100
200
300
400
500
600
700
800
900
1000
Abso
rban
ce a
t 214
nm
(AU
)
Retention time (min)
5 10 15 20 25 30-100
0100200300400500600700800900
100011001200130014001500
Abs
orba
nce
at 2
14 n
m (A
U)
Retention time (min)
5 10 15 20 25 30
0100200300400500600700800900
100011001200130014001500160017001800
Abso
rban
ce a
t 214
nm
(AU
)
Retention time (min)
5 10 15 20 25 30
0
200
400
600
800
1000
1200
1400
1600
Abso
rban
ce a
t 214
nm
(AU
)
AT1
Retention time (min)
CA1a
5 10 15 20 25 30-100
0
100
200
300
400
500
600
700
800
900
1000
Abso
rban
ce a
t 214
nm
(AU
)
Retention time (min)
5 10 15 20 25 30-100
0100200300400500600700800900
100011001200130014001500
Abs
orba
nce
at 2
14 n
m (A
U)
Retention time (min)
AT1 (
AT1 (CA1a (7.2-7.0)
CA1a (6.4-6.2)
7.2-7.0)
6.4-6.2)
AT1 (
AT1 (CA1a (7.2-7.0)
CA1a (6.4-6.2)
7.2-7.0)
6.4-6.2)
From CF fraction 6.4-6.2 From CF fraction 7.2-7.0
c
pH 5.4-5.2
ca1a
AT1
pH 5.4-5.2
ca1a
AT1
ca1a
AT1
56
d)
igur ss reproducibility of the method. (a) CF hromatograms of 3 ca1a separations are shown on the left and of 2 AT1 separations are own on the right. In all cases 4.5 mg of sample was loaded (one AT1 separation was
erformed with only 3 mg of total protein). Co-plotted with the chromatograms are pH rofiles to illustrate that the pH gradient was consistent in all separations. (b) 2nd imension chromatograms of all batches of cell lines for pH ranges 6.4-6.2 and 7.2-7.0. rrows along the chromatogram illustrate peaks that are shown in subsequent microarray ata. (c) Array images of samples from pH fractions 7.2-7.0, 6.4-6.2 and 5.4-5.2 to lustrate reproducibility throughout the separation space. (d) Sections of microarray data owing an example of reproducible positive spots that are unique to ca1a (pH 5.4-5.2,
pH 5.4-5.2 retention time 28 min
1 2 3
CA1a
AT1
1 2 3
CA1a
AT1
pH 6.4-6.2 retention time 26 min
F e 2.4: Comprehensive study to assecshppdAdilshretention time 28 min) and that are found in all cell lines (pH 6.4-6.2, retention time 26 min). Peaks corresponding to the positive spots found in all cell lines are indicated by arrows in fig 2.2b.
57
Nuclease sensitive element binding protein 1 and Histone H1.0
Splicing factor proline/glutamine rich
Figure 2.5: Selected microarray images showing comparison of spots where differential phosphorylation was observed between pre-malignant and malignant breast cell lines over different pH regions. Protein IDs as determined by tandem mass spectrometry are shown beside the image. For some proteins, multiple consecutive spots light up due to diffusional broadening during peak collection. In some cases more than one phosphoprotein was identified in the same collected fraction. In such cases, both phosphoproteins are listed.
pH 7.0-6.8
pH 5.8-5.6
Protein disulfide-isomeraseA3pH 5.4-5.2
Cytokeratin 8
Histone H2B andRibosomal protein L4
AT1 CA1a
Nuclease sensitive element binding protein 1 and Histone H1.0
Splicing factor proline/glutamine rich
pH 5.4-5.2
pH 6.4-6.2
pH 7.0-6.8
pH 5.8-5.6
Protein disulfide-isomeraseA3pH 5.4-5.2
Cytokeratin 8
Histone H2B andRibosomal protein L4
AT1 CA1a
pH 6.4-6.2
pH 5.4-5.2
58
Cellular disributions of phosphoproteins with confirmed
phopshorylation sites in both premalignant AT1 and malignant CA1a
Nucleus
plasma membrane
cytoskeleton + unknown
mitochondrial
Figure 2.6: Pie chart illustrating subcellular location of phosphoproteins whose phosphorylation sites were confirmed by mass spectrometry in both the AT1 and CA1a cell line combined. Closer examination showed a majority of these phosphoproteins to be present in the CA1a cell line (see table 2.2).
59
Apoptotic signaling
Acinus
Transcriptional regulation
p130 Sm D3
Zfp-37
H1d
H2A.2
snRNP70
YB-1
hnRNP-A1
SRp30C
protein synthesis
CAG-ISL 7
RPL24 MRPL34
RPL36
NF-GMB
EF-Tu
TARBP-B
NP33L18a
RP L12
Enzymes
GAPDH
ERp57
SASP
nudC
Mitosis
MAP 4SRP27
Aromatase
BAX
SAF-B
CPN10
PSF
BAD
MPB-1
Op18
DRBP76
Structural proteins
Vimentin CK 5CK 18
CK 6ACK 8 hTM5
LaminsApoptotic signaling
Acinus
Transcriptional regulation
p130 Sm D3
Zfp-37H2A.2
snRNP70
YB-1
hnRNP-A1
H1d
SRp30C
protein synthesis
CAG-ISL 7
RPL24 MRPL34
RPL36
NF-GMB
EF-Tu
TARBP-B
NP33L18a
RP L12
Enzymes
GAPDH
ERp57
SASP
nudC
Mitosis
MAP 4SRP27
Aromatase
BAX
SAF-B
CPN10
PSF
BAD
MPB-1
Op18
DRBP76
Structural proteins
Vimentin CK 5CK 18
CK 6ACK 8 hTM5
Lamins
Figure 2.7: Functional classification of proteins differentially phosphorylated in the pre-malignant and malignant breast cell lines. Majority of phosphoproteins were found in the malignant, CA1a. In cases where a phosphoprotein was found in AT1 and not CA1a, it appears in a box with broken lines.
60
#4482-4482 RT:16.99-16.99 NL: 2.34E3
0 100 200 300 400 500 600 700 800 900m/z
0
5
10
15
20
25
30
35
40
45
50
55
60
65
70
75
80
85
90
95
100
Rel
ativ
e Ab
unda
nce
y1-8931.4
y1-7860.3
b1-7761.3
y1-6732.2
b1-6664.3
y1-5633.1
y1-4536.2
b1-5497.2
b1-4400.2
y1-3369.2
b1-3301.1
y1-2272.3
y1-1175.1b1-1
102.1
a)
TAQVPpSPPR
Ca1a
AT1
ProQ anti-pY
#4482-4482 RT:16.99-16.99 NL: 2.34E3
0 100 200 300 400 500 600 700 800 900m/z
0
5
10
15
20
25
30
35
40
45
50
55
60
65
70
75
80
85
90
95
100
Rel
ativ
e Ab
unda
nce
y1-8931.4
y1-7860.3
b1-7761.3
y1-6732.2
b1-6664.3
y1-5633.1
y1-4536.2
b1-5497.2
b1-4400.2
y1-3369.2
b1-3301.1
y1-2272.3
y1-1175.1b1-1
102.1
TAQVPpSPPR
a)
Ca1a
AT1
ProQ anti-pY
10.6 10.8 11.0
200
400
600
AT1
CA1A
AT1
Ca1a
10.6 10.8 11.0
200
400
600
AT1
CA1A
10.6 10.8 11.0
200
400
600
AT1
CA1A
AT1
Ca1a
b)b) Figure 2.8: (a) Tandem mass spectrum (with +1 ion series highlighted) of selected phosphopeptide from apoptotic condensation inducing factor with inset showing phosphorylation difference between AT1 (boxed in red) and CA1a (boxed in blue) as seen on the microarray. (b) Microarray image together with complementary portion of reverse phase chromatogram where 60S ribosomal protein L14 was found to be phosphorylated in only CA1a.
61
5 1 0
2 0 0
4 0 0
6 0 0
8 0 0
1 0 0 0
He
tero
ge
ne
ou
s n
uc
lea
r ri
bo
nu
cle
op
rote
ins
A2
60
S r
ibo
so
ma
l p
rote
in L
23
60
S r
ibo
so
ma
l p
rote
in L
14
+H
isto
ne
H1
.2Pro
tein
CG
I-1
17
He
tero
ge
ne
ou
s n
uc
lea
r ri
bo
nu
cle
op
rote
He
tero
ge
ne
ou
s n
uc
lea
r ri
bo
nu
cle
op
rot
60
S r
ibo
so
ma
l p
rote
in L
17
His
ton
e H
1x
60
S r
ibo
so
ma
l p
rote
in L
8
Pro
tein
HT
03
1
60
S r
ibo
so
ma
l p
rote
in L
35
a
60
S r
ibo
so
ma
l p
rote
in L
1
His
ton
e H
1.0
60
S r
ibo
so
ma
l p
rote
in L
2N
uc
lea
se
se
ns
itiv
e e
lem
en
t b
ind
ing
pro
tein
1
DN
A-b
ind
ing
pro
tein
A
60
S r
ibo
so
ma
l p
rote
in L
24
60
S r
ibo
so
ma
l p
rote
in L
29
60
S r
ibo
so
ma
l p
rote
in L
36
aK
era
tin
, ty
pe
I c
yto
sk
ele
tal
9
Nu
cle
ola
r R
NA
he
lica
se
II
Retention time (min)
AU
CA1AAT1
Figure 2.9: Reverse phase chromatogram of pH fraction 7.0-6.8 from malignant cancer cell line, CA1a and pre-malignant cell line AT1. IDs as determined by tandem mass spectrometry are shown for each peak in CA1a
62
2.5. References
[1] American Cancer Society 2006.
[2] Wolf-Yadlin, A., Kumar, N., Zhang, Y., Hautaniemi, S., et al., Mol Syst Biol 2006, 2, 54.
[3] Yu, Y., Hao, Y., Feig, L. A., Mol Cell Biol 2006, 26, 6372-6380.
[4] Hunter, T., Harvey Lect 1998, 94, 81-119.
[5] Chow, S., Minden, M. D., Hedley, D. W., Exp Hematol 2006, 34, 1183-1191.
[6] Spickett, C. M., Pitt, A. R., Morrice, N., Kolch, W., Biochim Biophys Acta 2006.
Table 3.2: Protein IDs of data shown in Fig.3.5 and 3.6 as identified by µ-LC-MS/MS with change in glycan expression based on microarray data. All data was background subtracted and normalized based on UV peak areas. N: Normal, P: Pancreatitis, C: Cancer.
Fig. Protein ID % Cov MW Con A
AAL SNA MAL PNA
5B
P08603 Complement factor H precursor (H factor 1)
21 139034 2x in N 2x in N No change
No change
No change
5C
P02763 and P19652 Alpha-1-acid glycoprotein 1 and 2 precursors
Table 3.3: Detailed results from tandem mass spectrometry experiments done on proteins discussed. Information about peptides detected, Xcorr and coverage are included. Protein ID % Cov Theoretical MW
Figure 3.1: Experimental strategy for studying serum glycoproteins. 1) Lectin purification 2) Non-porous reverse phase HPLC separation and fraction collection 3) Microarray production 4) Lectin detection using biotin-streptavidin-Alexafluor555 detection 4) Image acquisition and analysis
95
Con A AAL SNA MAL Fetuin Asialofetuin
ThyroglobulinRibonuclease B
Transferrin
Figure 3.2: Scanned images of printed standard glycoproteins probed with different lectins. Each block bracketed on the right represents a dilution series of indicated standard from 2mg/mL to 0.025mg/mL. Each dilution has been printed as 9 replicates in a 3x3 block.
96
a) Glycan distribution on standard glycoprote ins
05
10152025303540
Fetuin
Asialofet
uin
Thyrog
lobuli
n
Ribonu
clease
B
Tran
sferrin
(Tho
usan
ds)
Glycoprote in
Fluo
resc
ence ConA
AALSNAMALPNA
b) Ribonuclease B response to ConA
y = 45208xR2 = 0.9997
05
1015202530
0 0.2 0.4 0.6
(Tho
usan
ds)
Concentration (m g/m L)
Fluo
resc
ence
c) Thyroglobulin response to AAL
y = 11596xR2 = 0.9949
05
1015202530
0 0.5 1 1.5 2 2.5(T
hous
ands
)Concentration (m g/m L)
Fluo
resc
ence
e ) Fe tuin response to MAL
y = 6163xR2 = 0.9798
0
2
4
6
8
0 0.2 0.4 0.6 0.8 1
(Tho
usan
ds)
Concentration (m g/m L)
Fluo
resc
ence
e ) As ialofe tuin response to PNA
y = 12371xR2 = 0.9616
0
5
10
15
20
0 0.2 0.4 0.6 0.8 1 1.2
(Tho
usan
ds)
Concentration (m g/m L)
Fluo
resc
ence
d) Transferr in response to SNA
y = 20275xR2 = 0.9964
0
5
10
15
0 0.2 0.4 0.6
(Tho
usan
ds)
Concentration (m g/m L)
Fluo
resc
ence
Figure 3.3: Linearity of response in standards a) Glycan distribution on standards printed at 1mg/mL concentration. Standard curve of b) Ribonuclease B in response to ConA c) Thyroglobulin in response to AAL d) Transferrin in response to SNA e) Fetuin in response to MAL f) Asialofetuin in response to PNA using lectin concentration of 5ug/mL
Reverse phase HPLC of WGA enriched glycoproteins from normal and pancretitis sera
0
0.1
0.2
0.3
0.4
0.5
0.6
0.7
5 10 15 20 25 30
Retention time (min)
Abs
orba
nce
at 2
14nm
(V
)
normal pancreatitis
Con A AAL SNA MAL PNA Con A AAL SNA MAL PNA
a)
b) c)
Glycan distribution on H factor 1
0
0.2
0.4
0.6
ConA AAL SNA MAL PNA
(Milli
ons)
Lectin
Norm
alize
d flu
ores
cenc
e
Normal
Pancreatitis
Glycan distribution on AGP precursors
0
0.1
0.2
0.3
0.4
0.5
ConA AAL SNA MAL PNA
(Mill
ions
)
Lectin
Norm
aliz
ed
fluor
esce
nce
Normal
Pancreatitis
Normal
Pancreatitis
Figure 3.5: Identifying differences in glycosylation from sera of different biological states. a) Reverse phase chromatogram of enriched glycopoteins from normal and pancreatitis sera with differences highlighted. Bar graph showing integrated fluorescence values of spots shown in array images after background subtraction and normalization based on UV peak area for peak shown with b) red arrow, c) orange arrow.
99
ConA AAL SNA MAL PNA
Normal Cancer
ConA AAL SNA MAL PNA
Normal Cancer
ConA AAL SNA MAL PNA
Normal
Cancer
ConA AAL SNA MAL PNA
Normal
Cancer
a) c)
b) d)
Glycan distribution on Human ATIII precursor
0
0.2
0.4
0.6
0.8
ConA AAL SNA MAL PNA
(Milli
ons)
Lectin
Norm
alize
d flu
ores
cenc
e
Normal
Cancer
Glycan distribution on Human LRG
0
0.5
1
1.5
ConA AAL SNA MAL PNA
(Milli
ons)
Lectin
Norm
alize
d flu
ores
cenc
e
Normal
Cancer
Glycan distribution on Human Alpha-2-M
0
0.5
1
1.5
ConA AAL SNA MAL PNA
(Milli
ons)
Lectin
Norm
alize
d flu
ores
cenc
e
Normal
Cancer
Glycan distribution on Human complement precursors
00.5
11.5
22.5
ConA AAL SNA MAL PNA
(Mill
ions
)
Lectin
Norm
aliz
ed
fluor
esce
nce
Normal
Cancer
Figure 3.6: Comparison of differential glycosylation patterns in normal vs. cancer serum. All comparisons shown below had approximately the same peak area between cancer and normal sera but glycosylation patterns were different. Each illustration shows sections of microarray images of a protein’s binding to the lectins indicated. Bar graphs show integrated fluorescence values of spots shown in the array images after background subtraction and normalization based on UV peak area.
100
3.5. References
[1] Rudd, P. M., Elliott, T., Cresswell, P., Wilson, I. A., Dwek, R. A., Science 2001, 291, 2370-2376.
haptoglobin, α1-acid glycoprotein, α2-macroglobin, apolipoprotein A-I and A-II and
fibrinogen). Fig 4.2a shows the UV chromatogram of the depletion process where the
immunodepleted fraction elutes at around 8 min. Following immunodepletion typically
about 8% of total serum proteins are retained in the immunodepleted serum fraction.
114
Glycoproteins retained in the immunodepleted serum were subsequently enriched
using a multi-lectin affinity column composed of WGA and ConA. ConA recognizes α-
linked mannose, including high mannose-type and mannose core structures which are
common to N-linked glycosylated proteins. WGA can interact with some glycoproteins
via sialic acid residues and it also binds oligosaccharides containing terminal N-
acetylglucosamine.[25] Thus, a majority of the complex type glycans can interact with
WGA. Combining these two lectins facilitated the extraction of most of the N-linked
glycoproteins in serum. We estimate that approximately 70% protein recovery was
achieved from each immunodepleted serum using this lectin affinity column.
Thirty µg of protein from each sample of lectin-enriched glycoproteins were
further separated on a non-porous reversed-phase HPLC (NPS-RP-HPLC) C18 column,
and the eluting proteins were detected by UV absorption at 214 nm. Fig. 4.2b shows the
UV map consisting of the chromatograms of three selected samples. A high level of
reproducibility in the UV traces among the different samples in the same group was
observed, although slight retention time shifts were observed. These shifts can be
associated with the manual nature of peak collection used in the experiments. The time
between data collection and beginning of sample run could have varied by 2-3 sec since
this was done manually. The UV peak area varied within 10% for serum samples from
different individuals. Protein fractions were collected by peak thereby making the
collected UV peaks relatively pure compared to the non-immunodepleted sample
(especially since sample has already been simplified by immunodepletion). Although
occasionally more than one protein per UV peak was observed, it was generally found
115
that the dominant protein was responsible for the UV absorption or glycan expression
change.[6]
Lectin Glycoarrays for Differential Detection of Changes in Glycan Structure: The
intact glycoproteins were separated and collected and the peaks were spotted on
nitrocellulose slides using a non-contact microarray spotter. The microarrays were then
hybridized against various lectins for differential glycan expression analysis. Five lectins
(AAL, MAL, SNA, PNA and ConA) were used to detect different glycan moieties. AAL
recognizes fucose linked (α-1,6) to N-acetylglucosamine or to fucose linked (α-1,3) to N-
acetyllactosamine. MAL can detect glycans containing NeuAc-Gal-GlcNAc with sialic
acid at the 3 position of galactose whereas SNA binds preferentially to sialic acid
attached to terminal galactose in an (α-2,6) and to a lesser degree, an (α-2,3) linkage.[26,
27] In contrast, PNA binds de-sialylated exposed galactosyl (β-1,3) N-
acetylgalactosamine. In fact, sialic acid in close proximity to the PNA binding site will
inhibit PNA binding. ConA was also used to detect high mannose structures. Greater than
95% of N-glycan types can be covered using these five lectins. The glycoproteins were
hybridized with lectins to probe differences in glycan content between normal, chronic
pancreatitis and pancreatic cancer sera and the binding was visualized using a biotin-
streptavidin-AlexaFluor555 interaction.[23]
Figure 4.3 shows sections of 5 microarrays probed with five different lectins. The
left 5 lanes contain normal samples, the middle three lanes contain cancer samples and
the right 4 lanes contain the chronic pancreatitis samples. The array data suggests that
this particular fraction contains glycan structures consisting primarily of mannose and
fucose residues as reaction with ConA and AAL were significant. Further, it appears that
116
the overall levels of mannosylation and fucosylation are higher in cancer samples
compared to normal. However, the raw microarray data in this figure was not normalized
and should be analyzed with caution.
As only changes induced by variations in glycan expression are of interest, all
array spot intensities were normalized with respect to their corresponding UV peak areas
from the chromatograms to mitigate protein abundance differences. The normalized data
was used for cluster analysis.
Bioinformatics analysis of the glycoprotein patterns: Bioinformatics analysis of the
glycoprotein arrays was performed to determine if there were any lectin response patterns
that grouped different disease states together. For data visualization, average linkage
hierarchical clustering (HC) and principal component analysis (PCA) were used to
provide graphical representations of the relationships among the samples. In these
unsupervised approaches, the samples were placed either in a hierarchical relationship or
as points in a 2-dimensional scatterplot (PCA) based on similarities in normalized
glycoform abundances. All 24 sera (8 chronic pancreatitis, 6 pancreatic cancer and 10
normal), each assayed in duplicate, were analyzed using unsupervised visualization
approaches and supervised differential abundance analyses. Separate PCA and HC results
were generated for all 48 samples, and for the replicate averages of the 24 distinct
biological specimens. The normalized abundances were log transformed, then their pair-
wise correlations were used to carry out HC, and their pairwise co-variances were used
for PCA. Because results on the set of 48 samples clearly showed good reproducibility
between replicates from the same biological source (see Fig. 4.4a-e), for biological
inferences the results for the 24 specimen-wise averages were used. The scatter plots
117
where the duplicate averaged samples tend to cluster separately are illustrated in Figure
4.5 a-e. The pancreatic cancer samples clustered further away from the normal sample
than the chronic pancreatitis sample pool especially in response to AAL, ConA and SNA.
There were some outliers in the cancer pool that fell into the chronic pancreatitis pool.
However, it was seen that this behavior always occurred with sera from the same 3
patients, indicating that the outliers were likely due to individual patient heterogeneity. It
was also observed that the glycan expression of chronic pancreatitis serum glycoproteins
were more similar to glycoproteins from the normal sera than to glycoproteins from the
cancer sera, as shown in the fucosylated (Fig. 4.5a) and high mannose glycan expression
(Fig. 4.5b). The hierarchical clustering results of average samples detected by ConA and
MAL are shown in Fig.4.5f and 4.5g. The clustering results for fucosylated and sialylated
glycan expression patterns generally distinguished the three clinical groups and correlated
well with the PCA results. Results with some lectins more clearly distinguished cancer
from chronic pancreatitis/normal, while other lectins more clearly distinguished normal
from cancer/chronic pancreatitis (shown in Fig.4.5 h-j).
Proteins with altered glycan structures in pancreatic cancer serum: For
differential abundance analysis, Z-statistics and Wilcoxon rank-sum statistics were
calculated for the normalized array spot intensities from each LC fraction, as detected by
each lectin. Comparisons were made of pancreatic cancer versus chronic pancreatitis and
normal combined and normal versus chronic pancreatitis and cancer combined. Only Z
value higher than 2 or lower than -2 (meaning only <5% would be expected by chance)
were considered significant. Positive Z value indicates over-expression and negative Z
118
value indicates under-expression. The data suggests that all of the lectins have substantial
power for identifying cancer samples relative to control or normal samples.
Proteins with significant changes (P<0.05) in chronic pancreatitis or pancreatic
cancer serum were identified by peptide sequencing using nano LC-MS/MS. Positive
protein identification was further validated by the Trans-Proteomics pipeline which
includes both PeptideProphet and ProteinProphet software.[24] PeptideProphet
automatically validates peptide assignment to MS/MS spectra made by a database search
program such as SEQUEST. For each dataset, it calculates the distribution of search
scores and peptide properties among correct and incorrect peptides, and uses those
distributions to compute for each obtained peptide sequence a probability that it is correct.
Only identifications with a TPP protein probability of >95% was considered a true hit.
ProteinProphet takes the peptides and search results and statistically validates the
identifications at the protein level. The altered protein IDs together with their Z-statistics
(Z>2 or Z<-2) are summarized in Table 4.1. The positive Z score in “cancer” is indicative
that this glycosylation is specifically over-expressed in cancer compared to normal and
pancreatitis combined. The negative Z score in “normal” is indicative that this
glycosylation is under-expressed in the normal sample compared to pancreatitis and
cancer combined. Thus, the differences shown are cancer specific.
In certain fractions, more than one protein was identified due to co-elution during
LC separation. These fractions were further separated by SDS-PAGE and analyzed by
lectin blots to determine which of the co-eluting proteins was responsible for the
differential lectin response.
119
Increased fucosylation and sialylation in pancreatic cancer sera were detected on a
majority of the differentially glycosylated proteins, including Hemopexin, Beta-2-
glycoprotein 1, serum amyloid P-component, Antithrombin-III and Haptoglobin-related
protein. Decreased sialylation was detected on plasma protease C1 inhibitor. This
phenomenon has also been previously shown.[6] The immunodepletion of the abundant
serum proteins in combination with further separation and lectin detection enabled the
observation of glycosylation alteration in less-abundant proteins which had previously
been difficult to detect. Some proteins have been suggested to be potential marker
proteins in cancer. Beta-2-glycoprotein has been observed to be over-expressed in breast
cancer serum [28] and serum amyloid P-component has been found down-regulated in
stomach cancer tissue.[29] However, the glycosylation pattern alteration of these proteins
has not been widely studied in sera from other cancer types.
Increased sialylation and fucosylation of these proteins in cancer serum lends
support to the theory that glycosylation changes may have clinical utility for the
identification of markers for early cancer detection. In order to verify the glycosylation
changes that we observed, lectin immunoblotting and glycopeptide mapping experiments
were also performed on selected LC fractions. AAL lectin was used to examine the
fucosylation expression level of target proteins. Fig. 4.6a shows the lectin blot results of
fucosylated Antithrombin-III. It was observed to be up-regulated in cancer serum
compared to normal and chronic pancreatitis serum. Peptide mapping experiments were
performed on the tryptic peptides from the LC fractions using µLC-ESI TOF. As shown
in Fig. 4.7a, very similar patterns were observed for the unmodified peptides for cancer
versus normal samples from Antithrombin-III. However, an over-expressed fucosylated
120
mono-sialylated glycopeptide was detected in cancer serum (Fig. 4.7b). This is consistent
with the up-regulation of fucosylation and sialylation on Antithrombin-III observed in the
microarray experiment (Table 4.1). These results highlight the potential utility of using
altered glycosylation patterns, rather than absolute protein levels, as markers for early
cancer detection.
Haptoglobin-related protein epitope expression is a clinically important predictor
of the recurrence of cancer in patients with early breast cancer, especially in combination
with progesterone-receptor status.[30] In our study, the over-expression of fucosylated
haptoglobin-related protein in pancreatic cancer serum was also verified by both
glycoprotein microarrays and lectin blot experiments. (See Fig. 4.6b and Table 4.1) The
up-regulation of fucosylated haptoglobin in pancreatic cancer serum has been reported
previously[31], although this protein was removed during the immunodepletion step, thus
its glycosylation changes were not analyzed in this study. In a peptide mapping
experiment, similar levels of a desialylated glycan structure and a mono-sialylated glycan
structure were observed on the peptide NLFLNHSENATAK from haptoglobin-related
protein in cancer and normal samples (Fig. 4.8a and 4.8b), where the fully sialylated
glycan structure on this peptide was found to be up-regulated in cancer sample as shown
in Fig. 4.8c. These results confirmed the increased response of SNA lectin and unaltered
response of PNA lectin on this protein (Table 4.1).
The over-expression of fucosylation in hemopexin in hepatocellular carcinoma
has been previously reported.[32] In pancreatic cancer serum, significant up-regulation
with a Z-score of 6.15 was observed on fucosylated Hemopexin. The lectin blotting
experiment verified this alteration where an increased response to AAL was observed as
121
compared to chronic pancreatitis and normal serum (Fig.4.6c). Over-expressed
desialylated and partially sialylated glycopeptides were also observed on Kininogen-1 in
pancreatic cancer sera (shown in Fig.4.9). This is consistent with the result from
glycoprotein microarrays where an increased response of this protein to SNA, MAL and
PNA was detected in cancer samples.
In some cases the glycan moieties that were detected by the five lectins including
sialylation, fucosylation, galactosylation and mannosylation were all up-regulated in
pancreatic cancer. For instance, the glycosylation of both Serum amyloid P-component
and Beta-2-glycoprotein 1 were found to be up-regulated as detected by all five lectins.
This may be due to the increased branching of glycans that has been associated with
metastasis and has been correlated with tumor progression in human cancers of pancreas,
breast, colon and melanomas.[8, 11, 33, 34] Fucosyltransferase 3 has been shown to be
over-expressed, and several isoforms of mannosidase have been shown to have decreased
expression in pancreatic cancer (as compared to chronic pancreatitis and normal
pancreata).[35] Fucosyltransferases increase fucosylation in selected proteins. The over-
expression of highly branched glycosylation either implicates increased activity of certain
glycosyltransferases (which may lead to increased expression of certain terminal glycans
such as sialic acid and fucosyl residues) or to decreased mannosidase activity (leading to
decreased trimming of high mannose structures, with corresponding increased branching
of the high mannose core) in cancer. However, all that being said, no pancreatic proteins
were found to show large glycosylation changes in the present study. In fact, the
majority of interesting proteins are secreted by the liver. It is well established that
pancreatic cancer is a highly inflammatory neoplasm and, as such, may elicit
122
inflammatory cytokine production with an associated acute phase response from the liver.
This acute phase response may, in fact, contribute to the synthesis of altered glycan
moieties on the secreted liver glycoproteins.
4.4. Conclusion
We have demonstrated the utility of glycoprotein microarrays as a tool to
differentiate serum samples from patients with pancreatic cancer, chronic pancreatitis or
normal subjects. Analysis of multiple normal, chronic pancreatitis and pancreatic cancer
sera showed distinct segregation of each state following PCA and HC analysis. Normal
and chronic pancreatitis sera were closer in similarity to each other, whereas pancreatic
cancer sera were distinct from the other two groups. Sialylation and fucosylation were the
dominant glycosylation differences seen to change with progression of pancreatic cancer.
Both an increase and decrease in glycosylation levels of different proteins were observed
as a function of disease. Many proteins whose glycosylation patterns changed as a
function of disease have been previously implicated in cancer. The results from this study
confirm previously implicated changes [8, 11] in that not only do protein abundances
change as a function of cancer, but more importantly, modifications such as changes in
glycosylation patterns of a serum glycoproteome may indicate presence or absence of a
disease. This change in disease specific glycosylation was further confirmed for selected
proteins by glycopeptide mapping experiments using a µLC-ESI-MS platform that were
able to show distinct glycopeptide differences between different sample types. The ability
to screen serum glycosylation patterns for sample classification and detect the location of
123
the altered glycosylations by further mass spectrometric validation may have utility for
the early detection of cancer.
124
Table 4.1: Z values of the altered glycosylations detected by five lectins.(Z>2 or Z<-2 corresponds to P<0.05)
AAL MAL SNA ConA PNA Protein ID / acc # Normal Cancer Normal Cancer Normal Cancer Normal Cancer Normal Cancer Beta-2-glycoprotein 1 (P02749) 2.49 3.3 2.08 2.07 -2.47 2.13 Hemopexin (P02790) 6.15 2.85 3.24 3.01 Haptoglobin-related protein (P00739) -3.6 2.82 -2.49 -3.71 2.41 -3.08 -3.63 Serum amyloid P-component (P02743) -4.96 4.02 -4.96 2.85 -5.28 4.11 -5.31 3.59 -5.96 3.12 Clusterin (P10909) -2.22 2.92 -2.52 2.22 -2.08 Antithrombin-III (P01008) -3.5 3.18 -2.9 3.28 -2.93 2.58 -3.24 2.63 -3.44 2.56 Kininogen-1 (P01042) -2.69 4.31 2.39 -2.64 3.98 -3.06 3.95 -2.1 2.14 Plasma protease C1 inhibitor (P05155) -2.97
125
Protein identification
Immunodepletion of abundant proteins
N-linked glycoprotein enrichment by ConA & WGA
Glycoprotein separation by NPS-RP HPLCProtein abundance detected by UV absorption
Tryptic digestion of target glycoproteins
Sera ( normal, pancreatitis and cancer)
Glycoprotein microarrays
Multi-lectin fluorescence detection
Data normalization/ Statistical analysis of significant patterns
Glycopeptide mapping
Target separation by SDS-PAGE& lectin blot experiment
Figure 4.1: Strategy used to screen the glycosylation patterns and characterize the target glycoproteins using samples of normal, chronic pancreatitis, and pancreatic cancer sera.
126
(a)
Minutes5 10 15 20 25 30 35 40 45 50 55 60
AU
0.0
0.2
0.4
0.6
0.8
1.0
1.2
1.4
1.6
AU
0.0
0.2
0.4
0.6
0.8
1.0
1.2
1.4
1.6
Top 12 depleted fraction
Top 12 retained fraction
Minutes5 10 15 20 25 30 35 40 45 50 55 60
AU
0.0
0.2
0.4
0.6
0.8
1.0
1.2
1.4
1.6
AU
0.0
0.2
0.4
0.6
0.8
1.0
1.2
1.4
1.6
Top 12 depleted fraction
Top 12 retained fraction (b) Figure 4.2: (a) UV Chromatogram of 125 µl serum depletion by IgY antibody column to remove the 12 high abundance proteins. During the binding process, the fraction flowing through was collected as the immunodepleted serum fraction, with the abundant protein fraction collected during elution. The absorption was set at 280nm. (b) WGA and ConA selected glycoproteins from three depleted serum samples were separated by NPS-RP C18 column. The UV absorption was at 214nm.
127
SNA
CONA
PNA
MAL
AAL
Normal Pancreatic cancer Chronic pancreatitis
SNA
CONA
PNA
MAL
AAL
Normal Pancreatic cancer Chronic pancreatitis Figure 4.3: Sections of glycoprotein microarray showing comparison of one fraction from NPS-RP-HPLC across all 24 samples. Each panel is a section of identical arrays probed with lectin indicated on the left side of the panel. It was observed that this fraction contained proteins that were predominantly mannosylated and fucosylated. It was also observed that the level of glycosylation (based on raw microarray data) was higher in cancer samples compared to the controls.
128
Figure 4.4: (a) (b) (c)
129
(d) (e) Figure 4.4: The normalized glycoprotein microarray responses to lectins (a) AAL (b) ConCA (c) MAL (d) SNA (e)PNA were visualized by principal component analysis (PCA). 24 serum samples (10normal, 8 pancreatitis and 6 pancreatic cancers), assayed in duplicate, were analyzed without replicate averaging.
130
Figure 4.5: (a)
AAL
CancerChronic pancreatitisNormalCancer outlier
AAL
CancerChronic pancreatitisNormalCancer outlier
AAL
CancerChronic pancreatitisNormalCancer outlier
CancerChronic pancreatitisNormalCancer outlier
ConAConA (b)
131
Figure 4.5: (c) MALMAL
SNASNA
(d) PNAPNA (e)
132
Figure 4.5:
AAL MAL (f) (g) (h) (i)
133
(j) Figure 4.5: The normalized glycoprotein microarray responses to lectins (a) AAL, (b) ConA, (c) MAL, (d) SNA, and (e) PNA were visualized by principal component analysis (PCA). Twenty-four serum samples (10 normal, 8 chronic pancreatitis, and 6 pancreatic cancers) were studied. Average linkage hierarchical clustering (HC) of the array responses to (f) AAL, (g) MAL, (h) ConA, (i) PNA and (j) SNA were shown to provide graphical representations of the relationships among the samples. The figure shows the clustering of serum samples obtained from patients with pancreatic cancer, chronic pancreatitis, or from normal subjects.
134
A
ANT3
N P C
ANT3
N P C B
HPTRN P C
HPTRN P C
N P C
HEMO
N P C
HEMOHEMOC Figure 4.6: AAL lectin blot analysis of (a) Antithrombin-III, (b) Haptoglobin-related protein, (c) Hemopexin in N (normal), P (chronic pancreatitis), and C (pancreatic cancer) serum.
135
(a) (b) HexNac
Mannose
Galactose
Fucose
Sialic Acid
HexNac
Mannose
Galactose
Fucose
Sialic Acid
Figure 4.7: Peptide mapping of Antithrombin-III. (a) Very similar patterns of unmodified peptides and (b) altered glycopeptide LGACNDTLQQLMEVFK (124-139) + (Hex)1
(HexNAc)2 (Deoxyhexose)1 (NeuAc)1 + (Man)3(GlcNAc)2 were detected by µLC-ESITOF in normal and pancreatic cancer serum.
136
0
771 772 773m/z0
100
%
0
100
%
771.1240
770.8822
770.3854
771.3927
771.6479
771.9033
771.1105
770.8688
771.3524
771.6076
771.8495
NLFLNHSENATAK
normal
cancer4+
0
771 772 773m/z0
100
%
0
100
%
771.1240
770.8822
770.3854
771.3927
771.6479
771.9033
771.1105
770.8688
771.3524
771.6076
771.8495
0
771 772 773m/z0
100
%
0
100
%
771.1240
770.8822
770.3854
771.3927
771.6479
771.9033
771.1105
770.8688
771.3524
771.6076
771.8495
NLFLNHSENATAKNLFLNHSENATAK
normal
cancer4+
(a)
0
843 844 845m/z0
100
%
0
100
%
843.9009
843.6761
843.4513
844.1538844.4068
844.6599 844.8707 845.1238 845.4191845.7849
843.8868
843.6339
844.1257
844.3927
844.7020845.0815
NLFLNHSENATAK4+
normal
cancer
0
843 844 845m/z0
100
%
0
100
%
843.9009
843.6761
843.4513
844.1538844.4068
844.6599 844.8707 845.1238 845.4191845.7849
843.8868
843.6339
844.1257
844.3927
844.7020845.0815
0
843 844 845m/z0
100
%
0
100
%
843.9009
843.6761
843.4513
844.1538844.4068
844.6599 844.8707 845.1238 845.4191845.7849
843.8868
843.6339
844.1257
844.3927
844.7020845.0815
NLFLNHSENATAKNLFLNHSENATAK4+
normal
cancer
(b)
0
916 917 918 919 920 921m/z0
100
%
0
100
%
920.4724919.9735919.4747
916.9244916.6754 917.4371917.7009 921.0300
919.4307 919.9588
920.4431
NLFLNHSENATAK
normal
cancer
4+
0
916 917 918 919 920 921m/z0
100
%
0
100
%
920.4724919.9735919.4747
916.9244916.6754 917.4371917.7009 921.0300
919.4307 919.9588
920.4431
0
916 917 918 919 920 921m/z0
100
%
0
100
%
920.4724919.9735919.4747
916.9244916.6754 917.4371917.7009 921.0300
919.4307 919.9588
920.4431
NLFLNHSENATAKNLFLNHSENATAK
normal
cancer
4+
4+0
916 917 918 919 920 921m/z0
100
%
0
100
%
920.4724919.9735919.4747
916.9244916.6754 917.4371917.7009 921.0300
919.4307 919.9588
920.4431
NLFLNHSENATAK
normal
cancer
4+
0
916 917 918 919 920 921m/z0
100
%
0
100
%
920.4724919.9735919.4747
916.9244916.6754 917.4371917.7009 921.0300
919.4307 919.9588
920.4431
0
916 917 918 919 920 921m/z0
100
%
0
100
%
920.4724919.9735919.4747
916.9244916.6754 917.4371917.7009 921.0300
919.4307 919.9588
920.4431
NLFLNHSENATAKNLFLNHSENATAK
normal
cancer
4+
4+ (c) HexNac
Mannose
Galactose
Sialic Acid
HexNac
Mannose
Galactose
Sialic Acid
Figure 4.8: Peptide mapping of Haptoglobin-related protein. (a) Glycopeptide NLFL NHSE NATAK(145-157) + (Hex)2(HexNAc)2 + (Man)3(GlcNAc)2, (b) glycopeptides NLFL NHSE NATAK(145-157) + (Hex)2(HexNAc)2(NeuAc)1 + (Man)3(GlcNAc)2, and (c) glycopeptides NLFLNHSENATAK(145-157) + (Hex)2 (HexNAc)2(NeuAc)2 + Man)3(GlcNAc)2 were detected as multiple charged peaks in normal and pancreatic cancer serum.
[26] Shibuya, N., Goldstein, I. J., Broekaert, W. F., Nsimba-Lubaki, M., et al., Arch Biochem Biophys 1987, 254, 1-8.
[27] Wang, W. C., Cummings, R. D., J Biol Chem 1988, 263, 4576-4585.
140
[28] Alsabti, E. A., Muneir, K., Jpn J Exp Med 1979, 49, 235-240.
[29] Jang, J. S., Cho, H. Y., Lee, Y. J., Ha, W. S., Kim, H. W., Oncol Res 2004, 14, 491-499.
[30] Kuhajda, F. P., Piantadosi, S., Pasternack, G. R., N Engl J Med 1989, 321, 636-641.
[31] Okuyama, N., Ide, Y., Nakano, M., Nakagawa, T., et al., Int J Cancer 2006, 118, 2803-2808.
[32] Comunale, M. A., Lowman, M., Long, R. E., Krakover, J., et al., J Proteome Res 2006, 5, 308-315.
[33] Kim, Y. J., Varki, A., Glycoconj J 1997, 14, 569-576.
[34] Dube, D. H., Bertozzi, C. R., Nat Rev Drug Discov 2005, 4, 477-488.
[35] Logsdon, C. D., Simeone, D. M., Binkley, C., Arumugam, T., et al., Cancer Res 2003, 63, 2649-2657.
141
Chapter 5
Glycoprotein profiling in plasma samples to elucidate glycoprotein biomarkers of colorectal cancer: An application of natural glycoprotein microarrays and lectin
blots
5.1. Introduction
Colorectal cancer is the third most common cancer in the world. It is estimated
that one million new cases and half a million new deaths occur due to this disease every
year.[1] Colorectal cancer related deaths amount to only 14% of all deaths due to cancer.
The five year survival rate in colon cancer can be increased to 90% if the tumor is
detected when it is still localized (not malignant and metastatic).[2] Current screening
methods for colorectal cancer include fecal testing, sigmoidoscopies, barium enemas and
colonoscopies.[3-5] Because some of these methods are invasive or not pleasant, patients
are often resistant to these tests. Blood based (serum or plasma) tests are considerably
less invasive and therefore a method of choice for colorectal cancer screening possibly
increasing the number of patients screened for the disease and therefore diagnosed at a
stage early enough for successful intervention.
A large amount of serum based proteomics studies are currently being pursued for
elucidation of cancer biomarkers for early detection as well as monitoring the
effectiveness of therapy.[6] Plasma and serum typically contain proteins native to this
142
biological fluid as well as proteins released from diseased cells.[7] Glycoproteins within
plasma comprise the most abundant post translationally modified sub-proteome.[8-12]
Currently known cancer markers that are glycoproteins include Her2/Neu in breast cancer,
prostate-specific antigen (PSA) in prostate cancer, CA125 in ovarian cancer,
carcinoembryonic antigen (CEA) in colon, breast, bladder, lung and pancreatic cancers.
CEA presents poor sensitivity specificity and therefore cannot be effectively used for
early detection.[13] CA19-9, CA242, CA195, CA50, CA74-2 and TIMP-1 have also been
proposed as potential markers of colorectal cancer but their sensitivities and specificities
are also too low for diagnostic purpose.[14-21]
Changes in abundance and glycan structure have been previously implicated in
multiple events during cancer progression ranging from cell growth and differentiation,
adhesion, metastasis and immune surveillance.[22-24] Invasiveness and metastatic ability
have been linked to changes in sialylation of cancer cells. Increase in sialylation could be
due to multiple factors some of which include increased activity of sialyl transferases and
increase in the numbers of potential sialylation sites on N-linked glycans.[25] Aberrant
fucosylation has also been shown in pancreatic cancer progression.[26, 27] Plasma
glycoproteins are therefore important targets because their identity and glycan structure
changes could provide insightful information about critical transformations due to cancer
progression and because they can be used as potential diagnostic markers of cancers. In
this study, multidimensional liquid separation was utilized on immunodepleted plasma
followed by natural glycoprotein microarray production with the goal to screen plasma
samples for glycan pattern changes as a function of colorectal cancer. Statistical analysis
of the data provided a reliable means to identify plasma glycoproteins possessing altered
143
glycosylation. Statistically significant altered glycoproteins were further validated on a
second independent group of plasma samples. These proposed glycoproteins may have
utility in the detection of colorectal cancer.
5.2. Experimental Section
Plasma samples
Human plasma samples were collected through a four institutional consortium
(Dana Farber Cancer Institute, MD Anderson Cancer Center, St. Michael Hospital,
Toronto, Ont, Canada, and University of Michigan Medical Center) of the Early
Detection Research Network (EDRN). Human subjects were identified prior to
endoscopy and informed consent obtained prior to sample collection procedures specified
in a protocol approved by Institutional Review Boards at all collaborating Institutions.
The samples were collected, handled, shipped, stored, and managed according to standard
operating procedures as specified in the protocol document. Samples were labeled with
bar coded subject identification number and tracked from collection through assay via a
relational database containing de-identified demographic and clinical data located at the
Bioinformatics Unit at Dartmouth Medical College. The samples were stored in a
professional repository facility at -80°C until use. The plasma was obtained from 6
patients with colorectal cancer (two stage II, two stage III and two stage IV), 5 samples
from patients with colonic adenomas (polyp size with 0.3-1.3 cm), and 9 samples from
patients with normal colonoscopies for use in a blinded set to screen N-linked
glycosylation pattern changes on plasma glycoproteins and 30 plasma samples (10 of
each) for use in a testing set. All subjects that donated plasma for this study were
144
between 50-76 years of age with 16 Caucasians and 4 African Americans. The plasma
was aliquoted into 0.5 ml aliquots, frozen, and then stored at -80°C until assayed.
Preparation of glycoprotein samples for lectin glycoarrays or lectin blot
Delipidation and immunodepletion of the plasma samples
The plasma samples were delipidated by centrifugation for 15 min at 20,000 × g,
and the lipid containing upper layer was removed before depletion. 250 µL of the
delipidated plasma was depleted using the ProteomeLab IgY-12 LC10 proteome
partitioning kit (Beckman Coulter, Fullerton, CA). This procedure enables simultaneous
removal of twelve highly abundant proteins from human plasma, including albumin, IgG,
Figure 5.2: (A) Chromatographic profiles of immunoaffinity depletion of plasma from 6 normal, adenoma, and colorectal cancer patients using ProteomeLab IgY-12 kit. The 12 most abundant proteins are contained in the “bound” fraction and the less abundant proteins in plasma or serum remained in the “flow-through” fraction. (B). UV chromatograms of all plasma samples from colorectal cancer, adenoma, and normal controls.
165
N
orm
al
Ade
nom
a C
ance
r
Co
nA
AAL
M
AL
SN
A
PNA
Figure 5.3: Microarray images of lectin response across all collected fractions from all sample groups
166
Figure 5.4: a)
Con
A
S
NA
M
AL
AA
L
P
NA
167
b)
Figure 5.4: (A) Principal components analysis (PCA) plot for normalized glycoprotein microarray data derived from the replicate analysis of healthy individuals, adenoma, and colorectal cancer patient plasma. Circles indicate the areas where the data points of the three groups are clustered. (B)- Reproducibility demonstration of Principal components analysis (PCA) for normalized glycoprotein microarray data derived from the replicates of healthy individuals, adenoma, and colorectal cancer patients.
168
Con
A (d
uplic
ates
ave
rage
d)
M
AL
(trip
licat
es a
vera
ged)
A
AL
(dup
licat
es a
vera
ged)
SN
A (t
riplic
ates
ave
rage
d)
PN
A (d
uplic
ates
ave
rage
d
Figure 5.5: Unsupervised hierarchical clustering of glycoprotein microarray data for colorectal cancer (c1-c6) from adenoma (a1-a5) and normal controls (n1-n9). Average linkage was used, and the dissimilarity was obtained from the Pearson correlation coefficient.
169
a)
b)
Figure 5.6: Nano LC-MS/MS spectra of (A) doubly charged N-glycosylated peptide GLN*VTLSSGH (m/z = 553.28) from complement 4 and (B) doubly charged N-glycosylated peptide LANENN*ATFYFK from kininogen-1. The asterisk (*) denotes the site of N-glycosylation determined from the tandem mass spectrum. Theoretical location of b ions is indicated by red lines. In most cases these peak intensities were not high enough for detection.
170
a)
b)
c)
d)
Figure 5.7: Validation study using 30 independent plasma sample to assess fucosylation and sialylation levels using AAL and SNA lectin blot analysis in complement C3 (A) and histidine-rich glycoprotein (C). The corresponding protein expression levels based on chromatogram peak areas are shown in (B) for complement C3 and (D) for histidine-rich glycoprotein.
171
5.5. References
[1] Parkin, D. M., Bray, F., Ferlay, J., Pisani, P., CA Cancer J Clin 2005, 55, 74-108.
[2] Engwegen, J. Y., Helgason, H. H., Cats, A., Harris, N., et al., World J Gastroenterol 2006, 12, 1536-1544.
[3] Burt, R. W., Gastroenterology 2000, 119, 837-853.
[4] Kung, J. W., Levine, M. S., Glick, S. N., Lakhani, P., et al., Radiology 2006, 240, 725-735.
[5] Ransohoff, D. F., Gastroenterology 2005, 128, 1685-1695.
[6] Wulfkuhle, J. D., Liotta, L. A., Petricoin, E. F., Nat Rev Cancer 2003, 3, 267-275.
[7] Feldman, A. L., Espina, V., Petricoin, E. F., 3rd, Liotta, L. A., Rosenblatt, K. P., Surgery 2004, 135, 243-247.
B in 1 min, 15-25% B in 2 min, 25-31% B in 3 min, 31-41% B in 10 min, 41-47% B in 3
181
min, 47-67% B in 4 min, 67-100% B in 1 min, followed by maintaining the system at
100% B for 3 min. All separations were performed at 60oC and were monitored at 214
nm. All 2D fractions were stored at -80oC until further use.
Microarray printing-
Approximately 30% of the fractionated proteins were transferred to 96-well printing
plates (Bio-Rad) and were completely dried using a speedvac concentrator at 60oC. The
fractions were then resuspended in printing buffer (62.5 mM Tris-HCl (pH6.8), 1% w/v
sodium dodecyl sulfate (SDS), 5% w/v dithiothreitol (DTT) and 1% glycerol in 1X PBS)
and were left to shake overnight at 4oC. Slides were printed by transferring each fraction
from the plate onto nitrocellulose slides using a non-contact piezoelectric printer
(Nanoplotter 2, GeSiM). Each spot resulted from deposition of 5 spotting events of 500
pL each, such that a total volume of 2.5 nL of each fraction was spotted. Each spot was
found to be ~450 µm in diameter, with the distance between spots maintained at 600 µm.
Printed slides were left on the printer deck overnight to dry and were then stored in a
desiccator at 4oC until further use.
Hybridization of slides-
The printed arrays were rehydrated in 1X PBS with 0.1% Tween-20 (PBS-T), and were
then blocked overnight in a solution of 1% BSA in PBS-T. Each serum sample was
diluted 1:400 in probe buffer (5 mM magnesium chloride, 0.5 mM DTT, 0.05% Triton X-
100, 5% glycerol and 1% BSA in 1X PBS) to make a total solution of 4 mL and kept on
ice. The slides were hybridized in diluted serum for 2 hrs (1 serum sample per slide).
Hybridization was done at 4oC in heat-sealable pouches with agitation, using a mini-
rotator. The slides were then washed five times with probe buffer (5 min each), and were
182
then hybridized with 4 mL goat anti-human IgG conjugated with Alexafluor647
(Invitrogen, Carlsbad, CA) (at 1 µg/mL in probe buffer), for 1 hr at 4oC. After secondary
incubation all slides were washed in probe buffer five times, for 5 min each, and were
then dried by centrifugation for 10 min. All processed slides were immediately scanned
using an Axon 4000B microarray scanner (Axon Instruments Inc., Foster City, CA).
Data acquisition and analysis-
GenePix 6.0 software was used to grid all spots, to determine the median Cy5
single-channel intensities and median local background intensities for each spot. A spot
was considered positive if the foreground measure was at least 2X the background
intensity measure. Both the foreground data alone as well as the background-subtracted
data were considered for analysis. To account for variation between arrays, each array
was median-centered and scaled by its interquartile range. After standardization the
replicate arrays were averaged. To assess differences between humoral response in cancer
and normal sera, the non-parametric Wilcoxon rank-sum test was employed and results
patterns were visually assessed to determine if background subtraction was beneficial for
this data analysis. Additionally z-score statistics were used on the foreground data to look
for subtle differences between the two sera groups. Finally, a classifier was built from the
differential proteins found by these methods.
Non-parametric method- A two-sample Wilcoxon rank sum test between cancer
and benign sera was run for each spot on the array. Each pH/fraction combination was
tested and the p-values were visualized in a grid plot to highlight regions of spots that
exhibited differential response between normal and cancer sera. A p-value threshold of
0.05 was used to determine differential proteins for further study.
183
Z-score method- The standardized data was log transformed after adding a small
value to each point to eliminate negative values. Z-score measures were constructed for
each spot by subtracting the mean and dividing by the standard deviation of only the
control serum samples for that spot. Resulting z-scores were then on the scale of standard
deviations from the mean of the control samples. Proteins that had Z-scores of >2 (or < -2
) in 20% of the cancer serum samples were determined to be differential and considered
for further study.
Prediction Analysis for Microarrays (PAM) classification algorithm and
Leave One Out Cross Validation (LOOCV)- The PAM classification algorithm [27], as
implemented in R, was used to explore the classificatory power of the proteins found to
be differential between control and cancer sera using either the Wilcoxon rank-sum test
or the z-score method. From PAM the smallest subset of proteins that gave the lowest
error rate were chosen to be used as a classifier. An ROC curve was drawn to illustrate
the selection of this 'best' subset of proteins and the area under the curve (AUC) was
estimated.
The generalizability of the PAM analysis was estimated using leave-one-out
cross-validation (LOOCV) in which each sample was left out of the data set in turn and
classified using the remaining samples. Specifically, using only the 29 remaining
samples, the same analysis scheme as done above for the full set of 30 samples was
repeated, including reselection of differential proteins using Wilcoxon tests and z-scores
from the 29 samples1 and classifier selection using PAM. The resulting classifier was
then used to predict the diagnosis of the excluded sample. Each of the 30 samples were
predicted in this way and error rates were estimated. ROC curves were drawn to illustrate 1 The median number of differential proteins across the 30 leave-one-out datasets was 96 (range=[65,109]).
184
the selection of the 'best' protein subset for classification in each of the 30 leave-one-out
cycles and the AUC was estimated.
Heatmaps- Heatmaps were drawn using Cluster and TreeView software.[29]
Spots were median-centered across samples and average linkage clustering was used.
Protein identification – nanoLC-ESI-MS/MS-
Individual protein fractions were first dried down to ~10 µL, and then mixed with
40 µL 100 mM ammonium bicarbonate, 10 µL 20mM DTT and 0.5 µL of sequence grade
modified trypsin (Promega). The mixture was allowed to incubate at 37oC overnight with
agitation after which the digest was stopped by addition of 1 µL TFA (Baker and Baker).
The digested sample was loaded on a paradigm desalting column (C18, 5mm x 300 um,
Michrom), and was washed at a flow of 50 µL/min using HPLC grade water containing
0.3% formic acid. The desalted peptides were directly eluted onto an analytical column
(100 µm x 15cm, C18, Michrom) using a flow rate of 300 nL/min and the following
gradient profile, where solvent A was water/0.3% formic acid and solvent B was
acetonitrile/0.3% formic acid. The gradient was started at 3% B, ramped to 35% B in 25
min, 60% B in 15 min, 90% in 1 min, maintained at 90% B for 1 min and finally ramped
back down to 3% in another 1 min. The eluting peptides were analyzed on a linear ion-
trap based mass spectrometer (LTQ, Thermo, San Jose, CA) with an NANO-ESI
platform (Michrom Biosciences). The capillary temperature was set at 200oC, the spray
voltage was 2.6 kV, and the capillary voltage was 20 V. The normalized collision energy
was set at 35% for MS/MS. The top 5 peaks were selected for collision induced
dissociation (CID). MS/MS spectra were interrogated using the SEQUEST algorithm in
Bioworks software (Thermo) against the SwissProt human protein database. Two missed
185
cleavages were allowed during the database search. The search threshold was set to 1000
and tolerances were set at 1.4 and 0.00 for peptide and fragment ion tolerances
respectively. Protein identification was considered positive when a peptide showed an
Xcorr of greater than or equal to 3.0, 2.5 and 1.9 for triply, doubly and singly charged ions
respectively. Only proteins with greater than 10% coverage were considered in the
analysis and a minimum of 3 good-scoring peptides were required for positive
identification. In the event that more than one protein was found in a fraction, the data
was filtered. If the spot of interest was unique and did not lie between adjacent reactive
spots then only the highest scoring protein that was not found in adjacent fractions in the
separation profile were considered true hits, since the adjacent fractions did not elicit a
humoral response. On the other hand if the spot of interest was part of a group of spots
eliciting a positive response within a separation profile, the common protein identified in
all these spots was considered a true hit.
6.3. Results and Discussion
Experimental Scheme
We spotted native proteins derived from the MIAPACA pancreatic cancer cell
line or pancreatic cancer tissue on protein microarrays to characterize a pancreatic
cancer-specific humoral response. Such a study has potential utility in identification of
novel potential candidate markers of pancreatic cancer. Figure 6.1 illustrates
schematically the methodology employed within this study. Proteins from the MIAPACA
pancreatic adenocarcinoma cell line or pancreatic cancer tissue were first solubilized, and
then separated using two-dimensional liquid-based separation that employs
186
chromatofocusing (separation according to protein pI) in the first dimension and non-
porous reversed-phase HPLC (separation according to protein hydrophobicity) in the
second dimension. The MIAPACA cell line was used because it was readily available.
Pancreatic cancer tissue was run in order to see if results with the MIAPACA cell line
would correlate with the clinically relevant tissue sample. The separated proteins were
then arrayed on nitrocellulose slides using non-contact piezoelectric printing. Following
printing, slides were hybridized with serum from patients diagnosed with pancreatic
cancer or normal subjects. Spots on the slides were statistically evaluated using non-
parametric statistical methods to identify proteins that elicit a pancreatic cancer-specific
humoral response. It was found that the omission of background subtraction during data
acquisition is critical in the identification of a differential humoral response. Furthermore
it was seen that tissue samples did not provide results as clear as the MIAPACA cell
lines. Reasons for this will be discussed shortly. Proteins that elicited a statistically
significant humoral response difference were subjected to classification analysis to obtain
a panel of classifiers which were subsequently identified by nano-LC-linear ion trap mass
spectrometry. For select identified proteins, a validation study using a separate set of
serum samples was attempted where the recombinant protein was arrayed on
nitrocellulose slides and probed with serum from a separate cohort of normal and
pancreatic cancer patients.
2-dimensional liquid separation
MIAPACA proteins were separated by CF from pH 9.2-3.9, and each CF fraction
was subsequently further separated by NPS-RP-HPLC. In the case of the tissue samples
separation in the first dimension was restricted to 7.2-4.0 only. Figure 6.2 represents the
187
2D UV chromatogram from these separations. Along the horizontal axis are all fractions
from the first dimension from lower pI to higher pI. The vertical axis represents retention
times from the 2nd dimension separations and going up the axis corresponds to increased
hydrophobicity. A typical 2D separation across the pH range above results in about 1300
total fractions in the MIAPACA cell line. A majority of these fractions are relatively pure
since manual collection by peak is performed. However there are instances when more
than one protein is present in the peak particularly for more highly abundant proteins that
elute over a longer time. Furthermore it can be seen that the signal intensities of fractions
in the MIAPACA separation is considerably higher compared to the tissue samples. This
is because the cell line could be easily obtained but tissue samples were more limited in
nature and therefore a smaller amount of total protein was available for the 2D
separation.
Microarray printing and processing
The separated proteins were printed on nitrocellulose slides and probed with
serum from normal individuals and patients diagnosed with pancreatic cancer. The
immune response in the sera was visualized using an antihuman-IgG –Alexaflor647
conjugate. Figure 6.3 illustrates portions of the arrays from the MIAPACA cell line
printed on nitrocellulose slides to indicate the typical appearance of slides and spot
quality, with specific examples of differential humoral response. Tandem mass spectra
are also shown to indicate the protein identity present in the spot of interest. It can be
seen that spot intensities appear homogenous throughout the spot. However, it was found
that some fractions from the separated MIAPACA lysates were not printed on all the
nitrocellulose pads due to incorrect calibration of the printing surface and printing errors
188
that occurred during the print run for the lower pH fractions. Thus, all subsequent data
representations indicate these missed spots which were not considered further in the
statistical analysis.
Statistical analysis of immune response in MIAPACA cell lines
While looking at the humoral response from one normal and one cancer serum
sample may indicate a difference as shown in Figure 6.3, it is critical to assess this
response in an adequately sized set of normal and cancer sera to see if the difference is
indeed statistically significant. Two analysis approaches were used to analyze the
humoral response differences in 15 control and 15 pancreatic cancer sera. The first
approach utilized a non-parametric Wilcoxon rank sum test which was repeated using
both the locally-derived background-subtracted median spot intensities as well as
foreground median intensities without background-subtraction. Results showed that while
background subtraction reduced batch effects between slides, a large amount of signal is
washed away by background correction. Figures 6.4a and 6.4b show the grid of p-values
from the per spot Wilcoxon rank-sum tests between cancer and normal sera. The grid is
arranged according to the two dimensional fractionation of the whole cell lysate and
colored according to the level of significance and the direction of the difference between
cancer and normal sera. Figure 6.4a is the p-value grid from the foreground only analysis
and the background subtracted p-value grid is shown in Figure 6.4b. Given the method of
fractionation it was expected that in some cases neighboring fractions containing higher
abundant reactive proteins would be correlated, thus producing hot (cold) regions. These
hot-spots (cold-spots), seen in the foreground-only p-value grid, are missing in the
189
background-subtracted p-value grid. Thus, it was found that the uncorrected measures
were preferable.
In the pancreatic cancer data set, uniform increases or decreases across all cancer
samples were not expected. We sought to identify those proteins that elicited a pancreatic
cancer-specific humoral response in as few as 20% of the samples or greater. For an
alternate view of the changes in the immune response between healthy and cancer
diagnosed patients, Z-score plots of each studied pH range were also generated in which
z-scores were calculated, per spot, using the mean and standard deviation of only the
normal samples. Resulting z-scores were thus on a scale of standard deviations from the
mean of the normal samples. Thus, if a fraction had a high z-score it had well above the
average normal reactivity at that spot. Likewise, a low z-score indicated that the fraction
had well below the normal reactivity. When plotted in grids of spot by sample, patterns
could be easily discerned in cancer samples. An example of such a z-score grid is
illustrated in Fig 6.4c, where the multiple orange/red fractions across the cancer samples
but not control samples is indicative of a protein of interest. Increases or decreases that
persist across at least 20% of the cancer samples were pursued for further study.
Comparing statistical analysis results from cell line to tissue samples
Figure 6.4d illustrates the wilcoxon rank sum data for humoral response differences
between the normal and pancreatic cancer sera across all printed fractions from the
pancreatic cancer tissue samples using the foreground only measures for spot intensities.
When comparing this grid diagram to that obtained for the humoral response differences
in the MIAPACA cell line fractions (Fig 6.4a) it can be seen that almost no difference of
significance is observed with tissue sample data.
190
This lack of successful results can be attributed to multiple factors. The tissue samples
that were analyzed may not have been homogeneous. i.e. all the cells in the tissue sample
may not necessarily been cancerous. It is therefore very likely that from the total proteins
extracted and separated, only a small percentage were actual cancerous tissue proteins.
These proteins could have therefore been below the detection limits of microarray
experiments. Such a problem can be alleviated by utilizing a more sophisticated approach
toward cancer tissue collection. Laser Capture Micro-dissection (LCM) is capable of
extracting very thin layers of cells from tissue samples. If such a technique is utilized to
carefully select only cancer cells from available tissue samples a more concentrated batch
of cancer-only cells could be obtained to facilitated a more focused humoral response
analysis. However such a study would require pooling of multiple samples of cancer cells
from different tissue samples to reach the amount of sample that is needed to perform a
complete humoral response experiment as outlined in this chapter. Because results with
pancreatic cancer tissue were not successful, all subsequent cross validation and
classification algorithms were performed on data from the MIAPACA cell line.
Classification and Cross Validation for MIAPACA fractions
The PAM (Prediction Analysis for Microarrays) classification algorithm [27] was
used to explore the classificatory power of the proteins from the MIAPACA cell line
found to be differential between control and cancer sera. Differential proteins were
selected as having (1) a Wilcoxon p-value of 0.05 or less or (2) having over 20% of the
cancer samples with a z-score >2 (or <-2). The PAM algorithm selects the most
predictive subset of proteins for classification. The best classifier, resulting in the
smallest error using the fewest proteins, used 9 proteins, chosen from 98 differential
191
proteins, and only misclassified 4 samples. The ROC curve shown in figure 6.5a shows
the true positive and false positive classification rates associated with this fit. The red
points indicate the 30 threshold values considered by PAM, corresponding to 30 subsets
of the proteins. The blue circle highlights the chosen threshold which uses only 9 proteins
for classification. The area under the curve (AUC) for this ROC curve was estimated to
be 0.85.
In an effort to estimate the generalizability of the classification analysis, leave-
one-out cross-validation (LOOCV) was used. For the 30 leave-one-out cycles, the median
size of the of protein subset chosen for the classifier was 12 proteins (range=[4,83])
which resulted in a median error rate of 4 (range=[2,6]) and an average AUC of 0.82
(range=[0.63,0.96]) for classifier selection. This is comparable to what we found when
using all 30 samples.
From predictions of the left out sample, it was found that if generalized to a new
population our classification analysis should predict the serum diagnosis with 86.7%
accuracy (4 misclassified samples). Among these 4 misclassified samples, 3 were false
positives and only 1 was a false negative. This gives an expected sensitivity of 93.3% and
an expected specificity of 80%.
We examined how frequently each protein was selected as an important predictor
across the 30 LOOCV classifiers built. Two proteins (PH 6.6-6.4, fraction 44 and PH 8.1-
7.8, fraction 56) were selected in all 30 LOOCV classifiers. Four other proteins were
46; PH 7.8-7.5, fraction 42). It is interesting to note that the 9 protein spots selected
192
initially are among the most common proteins used in the LOOCV classifiers; see table
6.1. Figure 6.5b illustrates the response of all serum groups to these nine proteins.
Figure 6.6 shows the scaled humoral response distribution across all serum
samples considered to be differential on a scale of green to red (lowest response to
highest response), based upon data from the Wilcoxon tests and z-score plots combined.
The 9 proteins spots that comprised the best classifier are indicated by arrows.
Identification and implications of statistically significant proteins identified from
MIAPACA cell line
Studying the humoral response to pancreatic cancer has utility to identify
potential tumor antigens. These tumor antigens appear as reactive spots on the protein
microarray since they bind autoantibodies present in the serum against which the array
was hybridized. Since these spots have been identified as specific proteins, important
pathway changes as well as key players involved in these changes might be highlighted.
Microarrays printed with fractionated lysates from the MIAPACA cell lines were
probed with 15 normal sera and 15 sera from patients diagnosed with pancreatic cancer.
Statistical treatment using the Wilcoxon rank-sum statistics, z-score plots and
classification analysis of the humoral response to pancreatic cancer cells yielded a panel
of 9 spots that showed best specificity and sensitivity in their ability to identify normal
and cancer sera correctly. The protein IDs of these are detailed in Table 6.1. In addition,
the percentage of cancer samples in which the panel was able distinguish from normal
sera is also indicated.
Higher Reactivity in Normal Sera
193
We found that the humoral response to proteins that are known to be involved in
stress was lower in cancer patient sera compared to normal sera. Heat Shock protein beta
1 is a 27 kDa heat shock protein that is expressed in response to environmental stresses or
estrogen stimulation. The protein colocalizes with mitotic spindles in dividing cells and is
also known to migrate to the nucleus during heat shock. It is also known to be a
chaperone protein that inhibits apoptosis and prevents aggregation of actin intermediate
filaments.[30] In pancreatic cancer, often characterized by a large amount of
inflammation, we found that serum humoral response to HSPB1 was significantly lower
than was found in normal sera. While the decreased HSPB1-specific humoral response in
pancreatic cancer has not been reported previously, we hypothesize that HSPB1
autoantibodies are detectable in normal serum due to the presence of some naturally
occurring process that is disrupted in pancreatic cancer.
Two variants of histone H2, H2A type 1-B and H2A.a, both showed a higher
humoral response in normal sera than was apparent in pancreatic cancer sera. A variant of
histone has previously been implicated in DNA break repair mechanisms.[31] Such
breaks are often caused by external stimuli such as radiation or internal events such as
oxidative damage that cause breaks in double-strand DNA. Lack of a humoral response to
such proteins in pancreatic cancer suggests that pancreatic cancer patients may be unable
to form autoantibodies to proteins that are potentially involved in stress relief
mechanisms.
Finally, a key protein, pyruvate kinase, involved in glycolysis was found to elicit
higher humoral responses in normal sera as compared to cancer sera. Expression of
glycolytic enzymes has been shown to be increased in a variety of cancers, including
194
pancreatic cancer tissues.[32] However, a humoral response to this enzyme has not been
previously reported. Regulator of chromatin condensation and ubiquitin were also more
reactive with normal sera compared to cancer sera. Both proteins have been implicated in
stress response although the exact mechanism of action is still not understood.
Higher Reactivity in Cancer Sera
A panel of 3 proteins was found to discriminate pancreatic cancer sera with high
sensitivity and specificity from normal sera by generating a higher response in cancer
samples. Our efforts identified two of these 3 proteins. Phosphoglycerate kinase 1 is a
glycolytic enzyme but is also known to be active as a primer recognition protein. PGK1 is
known to show antigen activity in other types of cancers[33]. Histone H4 is a nuclear
protein that maintains DNA in its proper configuration. As mentioned earlier, certain
variants of histones have been implicated in the DNA repair process. Presence of
antibodies against histone H4 in cancer sera but not in normal sera may serve as an
important indicator of improper DNA regulatory mechanisms in cancer patients.
While none of the proteins discussed were individually able to discriminate
clearly between the two clinical groups, used together, as a 9 protein panel, they showed
high specificity, sensitivity and selectivity, and may have potential diagnostic utility in
the identification of patients with pancreatic cancer. Further validation studies using
adequately sized test and trial sets of patient sera with pancreatic cancer would be
required for this determination.
Validation using recombinant proteins
For some of the proteins identified as eliciting differential humoral response in
pancreatic cancer, we were able to obtain recombinant proteins for further validation
195
studies using a separate set of 18 normal and 18 cancer sera. Four proteins were used,
Phosphoglycerate Kinase (PGK-1), Histone H4, Heat Shock Protein (HSP27) and Pterin-
4-alpha-carbinolamine dehydratase. Recombinant proteins were arrayed on nitrocellulose
slides and the slides were then probed with samples of 18 normal and 18 cancer sera. In
the case of PGK-1 and Histone H4 a differential response similar to that observed in the
test set was seen where cancer sera showed an overall higher humoral response compared
to the normal sera (Fig. 6.7). On the other hand the Pterin carbinolamine dehydratase and
HSP27 did not show a differential humoral response similar to the test set. One possible
reason for this lack of differential response could be the nature of the recombinant
proteins that were arrayed. It is quite possible that the recombinant protein synthesized in
bacteria did not posses key modifications responsible for the antigenicity of the
endogenous proteins.
The validation studies showed that PGK-1 and Histone H4 do in fact differentiate
normal and cancer sera. However, because the response is not “absent in normal and
present in cancer” and there is some overlap with each individual marker, these proteins
are not suitable as single biomarkers for diagnostic purposes. However their ability to
distinguish normal vs. cancer sera provides important information about possible
mechanisms of pancreatic cancer progression and can potentially be used to monitor
therapeutic response to the disease.
6.4. Conclusion
A humoral response to tumor proteins may have utility for the detection of the
pancreatic cancer. We have used 2-D liquid separation and protein microarrays to study
196
the humoral response in pancreatic cancer. Several different statistical treatments of
results were used to highlight proteins that elicited a differential humoral response pattern
between the different clinical groups. It was found that subtraction of background signal
from microarray data often eliminated key signals that were able to distinguish between
clinical groups, thus foreground measures without background subtraction were used
instead for all statistical analyses. Rank-based statistics (Wilcoxon rank-sum tests)
highlighted differences between the two clinical groups. Significant variability existed
between the measurements obtained with the cancer sera, and z-score statistics were
utilized as a complementary statistical tool to further analyze the differences between the
cancer and control samples.
The PAM classification algorithm and leave-one-out cross-validation (LOOCV)
highlighted a panel of 9 spots that was able to classify groups with high sensitivity and
specificity. Furthermore, a separate validation study using available human recombinant
proteins was able to substantiate results obtained with LOOCV for phosphoglycerate
kinase-1 and histone H4. It is possible that all recombinant proteins used did not provide
optimal results because they were not in their active form i.e. the correct isoform or post
translational modification was absent. A study comparing the printed protein in the initial
study vs. the recombinant protein to verify this hypothesis could not be performed
because of insufficient sample from the initial study. Microarray results showed a
significantly higher humoral response to a range of proteins in healthy subject sera
compared to cancer sera. These proteins are primarily known to be involved in stress
response and glycolysis. It was hypothesized that these differences were not due to
sample variability (since data was globally normalized to eliminate systemic variations in
197
slide processing) but rather due to distinct mechanisms that renders these proteins less
detectable in pancreatic cancer sera. In addition, proteins that have been previously
implicated in cancer progression as well as other novel proteins such as a variety of
ribosomal proteins showed higher humoral response in sera from cancer patients
compared to healthy subjects.
However, further work using a larger panel of antibody and recombinant protein
arrays containing active forms of proteins highlighted in this study together with a much
larger sample set of normal and pancreatic cancer sera are necessary in order to validate
these proteins as candidate markers of pancreatic cancer. Such work would also require
one to assess reactivity to these proteins of sera from other types of cancers in order to
ensure that the panel is pancreatic cancer specific.
198
Table 6.1: Protein identifications of spots that elicited a differential response from normal and cancer sera and were significant according to LOOCV results. All identifications were performed using a nanospray linear ion trap instrument (Thermo, LTQ) and SEQUEST browser. Only proteins that showed at least two high scoring peptides were considered true hits. If the protein was less than 15 kDA one high scoring peptide was considered acceptable.
Lysis: MIAPACA cell line or pancreatic cancer tissue
Chromatofocusing
Non-Porous Reversed-phase HPLC (NPS-RP-HPLC)
Figure 6.1: Humoral response experimental overview. Proteins are first extracted from cell line and separated in two orthogonal dimensions. Separated fractions are spotted by non-contact means on nitrocellulose slides which are then probed with serum from normal or cancer sera. Antibody-antigen response in detected using anti-human IgG conjugated to a florophore. Following non-parametric analysis proteins of interest are identified by tandem mass spectrometry.
Nano-LC-ESI-MS/MS for confirming protein
identification
Non-contact microarray
Array processing with normal and cancer serum
Array scanning of humoral response
Statistical analysis of response
Validation
202
Incr
easi
ng re
tent
ion
time
/ hyd
roph
obic
ity
pH 4 to 9 Saltwash
Incr
easi
ng re
tent
ion
time
/ hyd
roph
obic
ity
pH 4 to 9 SaltwashSaltwash
(a)
(b)
4.0-7.24.0-7.2
Figure 6.2: 2D UV chromatogram of separated (a) MIAPACA cell lysate and (b) pancreatic cancer tissue. On the horizontal axis are fractions from chromatofocusing starting from the lowest pH going to the highest pH. On the vertical axis is increasing retention time or hydrophobicity of the separated protein.
Figure 6.3: Selected microarray shots of differential humoral response as well as selected tandem mass spectrum for sequence confirmation of (a) Fibrillarin and (b) Cathepsin D. Theoretical location of b ions is indicated by red lines. In most cases these peak intensities were not high enough for detection.
204
a)
b)
205
c) (d)
Figure 6.4: All separated fractions showing result with non-parametric Wilcoxon tests (a) without background subtraction and (b) with background subtraction for the MIAPACA cell line. Red and Orange blocks mean significantly higher humoral response in cancer samples compared to normal (p<0.05 and p<0.1 respectively) and darker and lighter shades of Blue represent higher humoral response in normal compared to cancer (p<0.05 and p<0.1 respectively). Yellow and green blocks mean 0.1<p<0.25. (c) z-score plot for proteins separated from pH fraction 5.1-4.9. On the vertical axis are all fraction by increasing retention time and on the horizontal axis are each of the serum samples with which samples were probed. Red and Yellow blocks represents responses significantly higher than the mean of the normal sample (4<Z<25 and 2<Z<4 respectively) while Blue and Green blocks represent responses significantly lower than the mean of the normal sample (-25<Z<-4 and -4<Z<-2 respectively). (d) All separated fractions from pancreatic cancer tissue showing results with non-parametric Wilcoxon tests. Color codes are the same as for figure 6.4 a and b.
206
a)
b)
Figure 6.5: (a) ROC curve of 9 protein panel from PAM analysis showing an area under the curve of 0.85. (b) Boxplots of the 9 protein panel classifier built using all 30 samples.
207
Figure 6.6: Heatmap showing median centered responses of all serum samples to selected proteins of interest. The scale from green to red represents lower response to higher response on a scale of -2 to 2. The arrows in the figure indicate the protein spots that formed the panel of 9 potential markers with highest sensitivity and specificity.
208
a)
Validation study w ith PGK1
0.00E+00
1.00E+04
2.00E+04
3.00E+04
4.00E+04
5.00E+04
6.00E+04
7.00E+04
0 1 2
Hum
oral
res
pon
3
s
Normal Cancer
Validation study w ith PGK1
0.00E+00
1.00E+04
2.00E+04
3.00E+04
4.00E+04
5.00E+04
6.00E+04
7.00E+04
0 1 2
Hum
oral
res
pons
Normal Cancer3
b)
Validation study with Histone H4
0.00E+00
1.00E+04
2.00E+04
3.00E+04
4.00E+04
5.00E+04
6.00E+04
7.00E+04
0 1 2
Hum
oral
res
pons
e
Normal Cancer 3
Validation study with Histone H4
0.00E+00
1.00E+04
2.00E+04
3.00E+04
4.00E+04
5.00E+04
6.00E+04
7.00E+04
0 1 2
Hum
oral
res
pons
e
Normal Cancer 3
Figure 6.7: Scatterplot illustrating the differential humoral response in recombinant human PGK-1 used for validating initial experimental results.
209
6.5. References
[1] Jemal, A., Siegel, R., Ward, E., Murray, T., et al., CA Cancer J Clin 2006, 56, 106-130.
[2] Mann, D. V., Edwards, R., Ho, S., Lau, W. Y., Glazer, G., Eur J Surg Oncol 2000, 26, 474-479.
[3] Ferrone, C. R., Finkelstein, D. M., Thayer, S. P., Muzikansky, A., et al., J Clin Oncol 2006, 24, 2897-2902.
[4] Duffy, M. J., Ann Clin Biochem 1998, 35 ( Pt 3), 364-370.
(DTT) and 1% glycerol in 1X PBS) and were left to shake overnight at 4oC. Slides were
printed by transferring each fraction from the plate onto nitrocellulose slides using a non-
contact piezoelectric printer (Nanoplotter 2, GeSiM). Each spot resulted from deposition
of 5 spotting events of 500 pL each, such that a total volume of 2.5 nL of each fraction
was spotted. Each spot was found to be ~450 µm in diameter, with the distance between
spots maintained at 600 µm. Printed slides were left on the printer deck overnight to dry
and were then stored, desiccated at 4oC until further use.
Hybridization of slides
The printed arrays were rehydrated in 1X PBS with 0.1% Tween-20 (PBS-T), and
were then blocked overnight in a solution of 1% BSA in PBS-T. Each serum sample was
diluted 1:400 in probe buffer (5 mM magnesium chloride, 0.5 mM DTT, 0.05% Triton X-
100, 5% glycerol and 1% BSA in 1X PBS) to make a total solution of 4 mL and kept on
219
ice. Each diluted serum sample was used to hybridize a slide for 2 hrs. Hybridization was
done at 4oC in heat-sealable pouches with agitation, using a mini-rotator. The slides were
then washed five times with probe buffer (5 min each), and were then hybridized with 4
mL anti-human IgG conjugated with Alexaflour647 (Invitrogen, Carlsbad, CA) (at 1
µg/mL), for 1 hr at 4oC. After secondary incubation all slides were washed in probe
buffer five times, for 5 min each, and were then dried by centrifugation for 10 min. All
processed slides were immediately scanned using an Axon 4000B microarray scanner
(Axon Instruments Inc., Foster City, CA) and GenePix Pro 6.0 software (Molecular
Devices, Sunnyvale, CA) was used for data acquisition and analysis.
Protein Identification
Proteins were trypsinized in a solution of 100 mM ammonium bicarbonate and 1
mM DTT. The samples digested by trypsin were separated by a capillary RP column
(C18, 0.3 × 150 mm) (Michrom Biosciences, Auburn, CA) on a Paradigm MG4
micropump (Michrom Biosciences) with a flow rate of 300 nL/min. The gradient, started
at 5% ACN, was ramped to 60% ACN in 25 min and finally ramped to 95% in another 5
min. Both solvents A (water) and B (ACN) contained 0.3% formic acid. The resolved
peptides were analyzed on a Finnigan LTQ mass spectrometer (Thermo Electron Corp.,
San Jose, CA) with a nanoESI ion source (Thermo). The capillary temperature was set at
190°C, spray voltage was 2.6 kV, and capillary voltage was 30 V. The normalized
collision energy was set at 35% for MS/MS. The top 5 peaks were selected for CID.
Precursor selection was based upon a normalized threshold of 30 counts/s. MS/MS
spectra were searched using the SEQUEST algorithm incorporated in Bioworks software
(Thermo) against the Swiss-Prot human protein database. The search was performed
220
using the following parameters: two miscleavages were allowed during the database
search; peptide ion mass tolerance 1.50 Da; fragment ion mass tolerance 0.0 Da; Protein
identification was considered positive for a peptide with Xcorr of greater than or equal to
3.5 for triply, 2.5 for doubly, and 1.9 for singly charged ions.
7.3. Results and Discussion
Protein separation methods
In this study, proteins extracted from the Panc1 pancreatic cancer cell line were
separated in two relatively orthogonal dimensions for maximum peak capacity. In the
first dimension the proteins were separated according to their isoelectric points by a
liquid phase separation technique, chromatofocusing. It has been shown that such a
technique is able to separate proteins whose isoelectric points are as low as 0.2 pH units
apart or less. In the second dimension each fraction from chromatofocusing was further
separated by non-porous reversed phase HPLC. Non-porous particles eliminated column
clogging problems associated with separation of large proteins using porous columns.
Separation times and quality were also optimized due to the short column length of
33mm and separation temperature of 65oC which reduced diffusional broadening.
Figure 7.2 illustrates the separation quality and reproducibility of each dimension
of separation. Figure 7.2A shows three independent CF runs together with the pH profile
of each run. It is evident that the pH profiles of all runs are very similar as are the peak
profiles. It can also be seen that the peaks and valleys in the profiles correspond to the pH
changes and not the retention times so that even if there is a slight change in the pH
profile, the proteins eluting over each pH interval will always be the same. Figure 7.2B
221
illustrates similar reproducibility data generated for the second dimension separations.
Separations done on two distinct pH lanes (5.2-5.0 and 6.6-6.4) from CF are shown.
Again it was observed that peak profiles were almost identical in all four cases. For the
second dimension profile of pH fraction 5.2-5.0 the bottom-most chromatogram has one
peak missing which was due to a pressure drop that occurred in the instrument for a short
period of time. The reproducibility data suggests that the two-dimensional liquid
separation used in this study was robust, reliable and reproducible for further studies.
Digestion protocols:
In humoral response experiments using undigested proteins we separated cellular
cancer proteins and printed them on nitrocellulose slides in their intact form. However the
overall response of these arrays to serum remained low in most experiments. While some
differences in response were statistically different between normal and cancer sera the
overall fold differences were not very high. We hypothesized that the low response
correlated with the lack of access to binding sites as illustrated in figure 7.3. When the
protein is intact the binding site which would potentially react with serum proteins, could
be in a sterically unfavorable position, resulting in low binding. If this protein was
cleaved into a few pieces it is possible that the autoantibody binding site would be more
favorably located during the array hybridization process.
The digestion method chosen to study this hypothesis is critical. A protocol that
would cleave the proteins into too many fragments may not be appropriate because this
would potentially destroy the binding site. Trypsin is a popular enzyme of choice in
attempts at protein identification. However the very property of trypsin that is favorable
for PMF experiments (two cleavage sites that lead to many peptide fragments) is not
222
favorable for the purpose of our study. We have therefore utilized two alternative
methods to assess the effect of digestion on the humoral response. Enzymatic digestion
using GluC was performed since this enzyme cleaves only after glutamic acid. Chemical
digestion using cyanogen bromide (CNBr) was also used. CNBr cleaves after methionine
residues and because the occurance of methionine in proteins is very low, cleavage by
CNBr should result in very few, long peptides, possibly conserving the binding site for
humoral response experiments. Peptides resulting from CNBr and GluC digestion could
consequently be up to 4 or more times larger than peptides resulting from trypsin
digestion.
Array hybridization
The separated proteins were first divided into 4 fractions and each fraction was
used as follows: fraction 1=intact for microarray, fraction 2=digested with GluC for
microarray, fraction 3=digested with CNBr for microarray and fraction 4=digested with
trypsin for identification. All fractions for microarray analysis were arrayed using a non-
contact arrayer, Nanoplotter 2.0E (GeSiM, Germany). The arrays were then probed with
serum samples from 10 normal subjects, 10 patients with chronic pancreatitis and 10
patients with pancreatic cancer.
Figure 7.4 illustrates sections of microarray slides probed with serum to compare
the three different array-hybridization protocols. The top panel reflects the humoral
response to intact proteins arrayed onto nitrocellulose slides. It can be seen that the
response is very weak for the fractions from the pH range shown. The middle panel
shows the response of GluC digested fractions to serum. In this case all spots showed a
positive response. The digestion protocol for GluC involved the addition of 0.1 ug of
223
gluC into the fraction that was being digested. In printing the arrays of GluC digested
fraction, the GluC was also being printed. We concluded that all spots were positive most
probably due to non-specific binding to the GluC that was present in the digested sample.
The problem could be alleviated by having GluC immobilized on beads prior to digestion
so that it can be removed from the sample prior to arraying. Interestingly, the bottom
panel shows the humoral response to CNBr digested protein fractions where at least 1
spot shows significantly higher response to serum when digested by CNBr compared to
when arrayed as an intact protein. In addition 3 other spots show a slightly higher
response when digested compared to when arrayed as intact proteins.
When comparing the 62 fractions that were printed from the proteins from 2
separate pH lanes of the first dimensional separation, it was observed that 10 spots
showed a very distinct response to serum when arrayed after CNBr digestion (a >10%
improvement). These same spots did not show any response to serum when arrayed as
intact proteins. By performing a simultaneous humoral response experiment with both a
control (intact proteins) and test (digested with CNBr) set it was confirmed that digestion
by CNBr prior to arraying facilitates an improved response making it possible to identify
changes in humoral response that may be present between two different classes of sera.
We believe that digestion with CNBr shows an enhanced humoral response that is
clinically relevant and not just due to non-specific binding because only specific spots
showed an enhanced response with this digestion strategy. If the response were non-
specific we should have seen an enhancement with all fractions that were printed as was
the case with GluC.
224
Initial study toward differential humoral response in pancreatic cancer using CNBr
digested proteins
After confirming that CNBr digestion increases the sensitivity of the humoral
response results, 10 normal, 10 chronic pancreatitis and 10 pancreatic cancer sera were
hybridized with arrays printed with intact proteins and CNBr digested proteins to see if
there was a group specific trend in the humoral response that resulted in improved
detection with CNBr digested arrays. To that effect proteins from pH lanes 5.2-5.0 and
6.6-6.4 were fractionated by NPS-RP-HPLC. They were then divided into two parts, one
of which was directly arrayed on nitrocellulose slides as intact proteins. The other divided
fraction was subjected to CNBr digestion after which it was arrayed on the same
nitrocellulose slides as the intact proteins. 30 slides were printed and each was hybridized
with serum from the 10 normal, 10 chronic pancreatitis and 10 pancreatic cancer sera.
The arrays were scanned in the red channel to detect a humoral response.
Background subtracted data from both sets of experiments i.e. intact protein results for all
three sera classes and digested protein results for all three sera classes were then
compared to see if there was any differential response between the classes that was more
visible in the CNBr digested sample data. A spot intensity of > 2 fold than the
background intensity was required for the spot to be considered positive. At least 50% of
the cancer and pancreatitis spots needed to show a higher response than the 2nd highest
normal spot response in order for the response to be considered significantly different in
the groups.
5 spots showed a differential humoral response when the spots were digested with
CNBr but not when they were arrayed in an intact state. A comparison of some of these
225
humoral responses is shown in figure 7.5. On the left are all sera responses to intact spots
while on the right are sera responses to spots that were digested with CNBr. On the plots
1 refers to normal sera group, 2 refers to the chronic pancreatitis sera group and 3 refers
to the pancreatic cancer sera group. For the digested spot responses a broken line is
shown to indicate the number of cancer samples that showed a higher response than the
second highest normal serum response. It can be seen that in all cases at least 50 % (5/10)
of the chronic pancreatitis and pancreatic cancer samples showed higher reactivity in the
studied fractions when digested with CNBr compared to when arrayed as intact proteins.
Interestingly in figure 7.5 b, c and d the response to the intact spots was generally very
low (almost at background fluorescence level) while the same response in the case of the
spots digested with CNBr was significantly higher. On the contrary, as shown in figure
7.5 a and e, it was observed that while the overall signal intensities were not very low
when intact protein spots were probed with sera from different groups, there was no
indication of differential humoral response between the normal and disease sample group.
However when digested with CNBr a differential humoral response became very evident
despite the slightly lower overall signal intensity.
The 5 spots that were identified as eliciting a differential humoral response were further
interrogated by mass spectrometry to determine the proteins present in the spots. Table
7.1 shows the identity of the proteins and relevant information with respect to the protein
identification. Out of the 5 spots of interest identification was only possible for three
spots. In the other two cases the sample amount was insufficient for conclusive
identification.
226
Two of the three proteins identified were mitochondrial proteins not previously
implicated in pancreatic cancer. The third identified protein was ubiquitin-conjugating
enzyme E2 variant 1. While this particular protein has not been previously associated
with pancreatic cancer, another variant of the ubiquitin-conjugating enzyme has been
previously implicated in pancreatic cancer and has been linked to a T-cell mediated
recognition of pancreatic cancer cell.[23] An immune response to this class of protein has
therefore been shown previously suggesting that the body is responding to the cancer via
the ubiquitin pathway. Such a protein could be a potential target of interest both for
diagnostics and therapeutic purposes. However due to the small sample numbers used as
a proof of concept set for the digested array strategy further experimentation with much
larger sample pools is necessary in order to draw more biologically relevant conclusions
about pancreatic cancer progression.
7.4. Conclusion
Studies designed to enhance our understanding of the host response to cancer i.e.
humoral response can provide key information regarding potential markers of the cancer
as well as important pathways critical to the development of the disease. However current
efforts at understanding this response using microarray approaches are hampered by low
response of cancer proteins on the array surface to serum samples that are used to probe
the arrays. Here we present a possible explanation for this weak response and a potential
strategy to overcome the problem.
It is possible that upon immobilization to a solid surface the protein on the array is unable
to bind to potential binding partners in serum because the binding site on the protein is
227
sterically hindered. To overcome this problem, we have developed a strategy where
protein is first digested using CNBr resulting in a few large fragments that are
subsequently arrayed on the microarray surface. Depending on the size of the protein
such a digestion could result in 2 to up to 6 fragments. Digestion into large fragments is
likely critical to allow fragments to still possess the binding sites in their intact form
whereas if digestion into many smaller fragments was performed, the binding site may be
destroyed. Preliminary results show that digestion prior to arrays facilitates increased
detection sensitivity of the overall humoral response. In addition, when the experiment
was repeated with 10 normal, 10 chronic pancreatitis and 10 pancreatic cancer sera, it
was observed that out of 62 spots that were arrayed, 10 spots showed stronger signals
when arrayed after digestion. Out of these 10 spots, 5 showed a response that was
different between normal sera and diseased sera (chronic pancreatitis and pancreatic
cancer). In this study a response unique to chronic pancreatitis and pancreatic cancer was
observed. This response could be indicative of inflammation rather than cancer since it
was seen in both the chronic pancreatitis and pancreatic cancer sera. Regardless, it is very
likely that a similar trend will be seen if all pH lanes from the first dimension are
interrogated resulting in a larger number of potential proteins that can be validated for
diagnostic capabilities. In addition the results from this study are used as a proof of
concept for the digested array strategy, but further work with larger sample pools will be
needed before any biologically relevant conclusions can be drawn.
228
Table 7.1: Protein identifications of spots that demonstrated a differential humoral response between the three sera sample groups used with additional information about peptides identified and coverages observed.
Figure 7.1: Overall workflow of the modified protein microarray strategy. Proteins from a cell line/ tissue are first extracted and separated in two dimensions (chromatofocusing separated the proteins according to their pI and NPS-RP-HPLC separated them according to their hydrophobicity). Separated fractions are split into three parts. One part is digested with trypsin, 1 with CNBr and 1 is left intact. Intact proteins and CNBr digested proteins are arrayed on nitrocellulose slides and probed with serum from different stages of disease (in this case normal, chronic pancreatitis and pancreatic cancer) to visualize humoral response. Tryptic digests of the spots that showed a differential humoral response were then subjected to protein identification using LC-MS/MS.
b) Figure 7.2: Reproducibility of separation methods used. (a) 3 chromatofocusing runs using 4.5 mg of protein lysate from Panc1 cell lines. (b) 4 reversed phase HPLC runs from two distinct pH fractions from the first dimension. Red arrows indicated fractions/peaks that responded to serum when digested by CNBr and Blue arrows indicated fractions/peaks that responded to serum when arrayed in its intact state.
231
After DigestAfter DigestAfter DigestAfter Digest
Figure 7.3: Hypothesis about why intact protein microarrays may not show high response signal. Binding site on protein is sterically hindered from serum proteins when the arrayed protein is intact. After digestion with CNBr, fragments with conserved binding sites are more exposed to serum proteins enhancing the signal due to humoral response.
232
Figure 7.4: Microarray slide section illustrating differences in humoral response using 3 separate arraying methods. The top panel is intact proteins from Panc1 cell lines probed with serum resulting in very low overall response. The middle panel is GluC digested proteins from the same Panc1 cell line probed with serum resulting in a positive response to all arrayed fractions. This binding was non-specific to the GluC present in digested sample. The lower panel shows humoral response to tryptically digested proteins from the same Panc1 cell line. While the overall background is maintained at a low level, spots inside the yellow square illustrate a humoral response that was not present when the same protein in its intact state was probed with serum.
233
a) (812 and 316)
0
1000
2000
3000
4000
5000
6000
0 1 2 3
hum
oral
resp
onse
40
2000
4000
6000
8000
10000
12000
14000
0 1 2 3 4
hum
oral
resp
onse
n=6
N P C N P C
0
1000
2000
3000
4000
5000
6000
0 1 2 3
hum
oral
resp
onse
0
2000
4000
6000
8000
10000
12000
14000
0 1 2 3 4
hum
oral
resp
onse
n=6
N P C N P C4
b) (762 and 166)
0
2000
4000
6000
8000
10000
12000
0 1 2 3
hum
oral
resp
onse
4
n=7
0
50
100
150
200
250
300
0 1 2 3 4
hum
oral
resp
onse
N P C N P C0
2000
4000
6000
8000
10000
12000
0 1 2 3
hum
oral
resp
onse
n=7
0
50
100
150
200
250
300
0 1 2 3 4
hum
oral
resp
onse
N P C N P C 4
c) (637 and 533)
020406080
100120140160180200
0 1 2 3 4
hum
oral
resp
onse
0
500
1000
1500
2000
2500
3000
3500
4000
0 1 2 3
hum
oral
resp
onse
N P C N P C4
n=5
020406080
100120140160180200
0 1 2 3 4
hum
oral
resp
onse
0
500
1000
1500
2000
2500
3000
3500
4000
0 1 2 3
hum
oral
resp
onse
N P C N P C
n=5
4
d) (861 and 365)
0200400600800
100012001400160018002000
0 1 2 3 4
hum
oral
resp
onse
0
2000
4000
6000
8000
10000
12000
0 1 2 3
hum
oral
resp
onse
N P CN P C 4
n=6
0200400600800
100012001400160018002000
0 1 2 3 4
hum
oral
resp
onse
0
2000
4000
6000
8000
10000
12000
0 1 2 3
hum
oral
resp
onse
N P CN P C
n=6
4
234
e) (862 and 356)
0100020003000400050006000700080009000
0 1 2 3 4
hum
oral
resp
onse
0
2000
4000
6000
8000
10000
12000
14000
16000
0 1 2 3 4
hum
oral
resp
onse
n=5
N P C N P C0
100020003000400050006000700080009000
0 1 2 3 4
hum
oral
resp
onse
0
2000
4000
6000
8000
10000
12000
14000
16000
0 1 2 3 4
hum
oral
resp
onse
n=5
N P C N P C
Figure 7.5: Scatter plots illustrating change in humoral response upon protein digestion with CNBr. (a) – (e) show the five spots that demonstrated differential humoral response between normal sera and pancreatitis and pancreatic cancer sera. On the left are scatter plots of all serum sample reactions to the intact spot while on the right are scatter plots of all serum sample responses to the CNBr digested spots. In all plots 1 = normal sera responses, 2 = chronic pancreatitis responses and 3 = pancreatic cancer responses.