Page 1
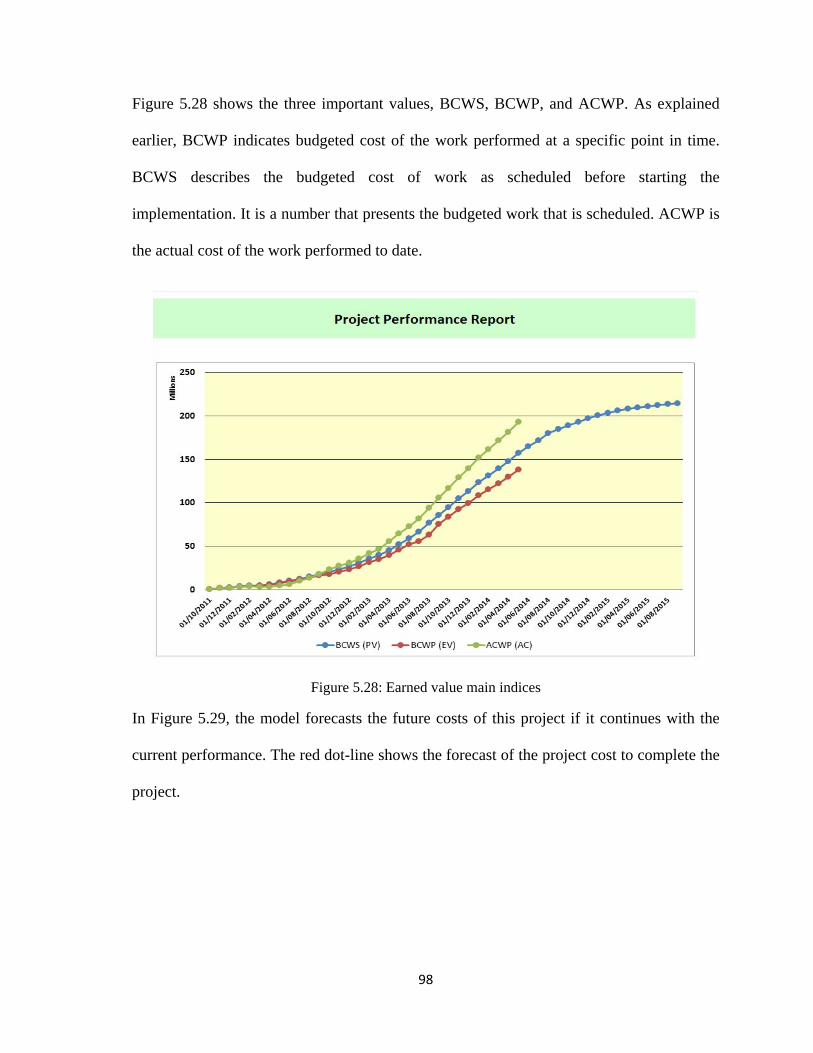
An integrated model for auditing construction projects
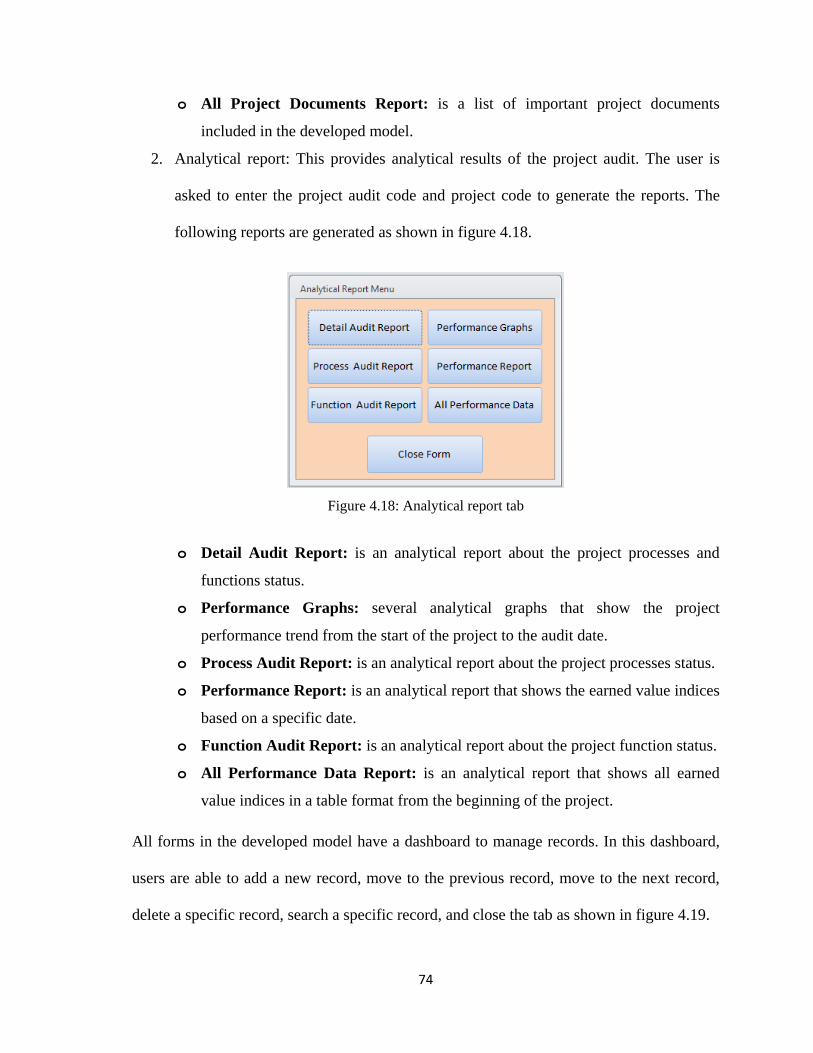
A Case study of Oil and Gas projects in Iran
By
Ahmad Teymouri
M.A.SC. Thesis
Under the Supervision of Dr. Ahmad Jrade
In Partial Fulfillments of the Requirements for the Degree of M.A.Sc in
Civil Engineering
Ottawa-Carleton Joint Institute of Engineering Faculty
Department of Civil Engineering
University of Ottawa
Ottawa, Canada
©Ahmad Teymouri, Ottawa, Canada, 2015
Page 2
ii
ACKNOLEGMENT
First, I am grateful of The Almighty God for providing me this opportunity and granting me the
capability to proceed successfully.
I would like to gratefully and sincerely thank my supervisor Dr. Ahmad Jrade for his supports,
patience, and advice, and valuable technical comments during the entire work.
Furthermore I would like to thank my mother and father who always encouraged me during my
study period.
I would like to give special thanks to my wife for her support, patience, and love that were
undeniably the bedrock upon which the past fifteen years of my life have been built.
I would like to thank the Department of Civil Engineering of University of Ottawa especially
those members of the committee for their input, valuable discussions, and accessibility.
Also, I like to thank the participants in my research, who have willingly shared their precious
time, knowledge, and experience.
Page 3
iii
Abstract
Nowadays, organizations implement projects for many purposes. Using the project as a strategic
success factor for project-oriented companies is continuously increasing. However, most of the
time, the results are not the same as planned. Some projects fail to achieve their objectives;
others are canceled, whereas on some other cases, companies have to re-plan their strategy.
Project-oriented companies know that maintaining an ideal and logical balance between the
project’s time, cost, and quality constraints can vastly guaranty project success. Therefore, they
should switch from traditional project management to modern and advanced project management
methodology, which improves project performance and efficiency over its life cycle. One of the
most applicable tools used to assess and monitor project performance and thus finding the
associated issues is Project Audit, which is a comprehensive and organized assessment of the
effectiveness and efficiency of project performance, management, and compliance. In this
research, an integrated project audit model is presented that incorporates a detailed design
module, which shows the structure of the model, questionnaire module, and a scoring module.
The model is developed as an integrated project audit application where the user is easily able to
select, plan, implement, and report a project audit. The model’s output consists of two parts: 1) a
comprehensive report that shows the project situation in five main project processes and nine
project functions. This report presents the project’s score in a specific function and its related
process (i.e., planning cost or closing procurement); 2) useful analytical reports and graphs of the
project performance. In this part, the model compares the project’s planned and actual time and
cost, calculates their variances, and forecasts the final cost and time based on the current
performance. The model is validated by using an actual Oil and Gas project to test its workability
and capabilities. Three groups will benefit from this model; 1) owners; 2) project managers and
Page 4
iv
project team; 3) general contractors and construction companies. The model helps project owners
to identify problems early on and reduce project waste in terms of time, effort, material and
costs. Moreover, it provides owners the opportunity to identify the project performance from the
cost and time constraints. Also, after using this model, project managers and project team have a
list of findings that need to be addressed to enhance the overall project performance. The various
reports of the model not only provide detail information about project constraints (time, cost, and
quality) but it also present valuable analysis related to other aspect of the project (i.e. risk, scope,
and communication) which are very useful for the project team. Furthermore, the developed
lessons learned from the project can be documented with this model, which is very useful for
general contractors and construction companies in future projects.
Page 5
v
Table of Contents
Contents
Contents ACKNOLEGMENT ....................................................................................................................... ii
Abstract .......................................................................................................................................... iii
Table of Contents ............................................................................................................................ v
List of Tables ............................................................................................................................... viii
List of Figures ................................................................................................................................ ix
Glossary ....................................................................................................................................... xiii
Chapter One .................................................................................................................................... 1
Introduction ..................................................................................................................................... 1
1.1. Background ........................................................................................................................................ 1
1.2. Research Objectives ........................................................................................................................... 3
1.3. Methodology ...................................................................................................................................... 4
1.3.1. Literature Review ........................................................................................................................ 4
1.3.2. Data Collection ........................................................................................................................... 5
1.3.3. Analysing project audit and improvement models ...................................................................... 5
1.3.4. Model development process ........................................................................................................ 5
1.3.5. Model Validation ........................................................................................................................ 5
1.4. Thesis Organization ........................................................................................................................... 6
Chapter Two.................................................................................................................................... 7
Literature Review............................................................................................................................ 7
2.1. Introduction ........................................................................................................................................ 7
2.2. Fundamentals of the Project ............................................................................................................... 8
2.2.1. Project Functions ...................................................................................................................... 10
2.2.2. Project Team Organization Form .............................................................................................. 12
2.3. Construction Project Life cycle ........................................................................................................ 13
2.4. Project Audit .................................................................................................................................... 15
2.5. Project Audit Success Factors .......................................................................................................... 18
2.6. Project Maturity ............................................................................................................................... 19
2.7. Project Audit and Improvement Models .......................................................................................... 20
Page 6
vi
2.7.1. Portfolio, Programme & Project Management Maturity Model (P3M3) .................................. 20
2.7.2. Prince2 Maturity Model (P2MM) ............................................................................................. 23
2.7.3. Capability Maturity Model Integrated (CMMI) ........................................................................ 24
2.7.4. Kerzner Project Management Maturity Model (KPM3) ........................................................... 25
2.7.5. Project Management Process Improvement .............................................................................. 26
2.7.6. ISO 10006:2003 Standard for Project Management ................................................................. 27
2.7.7. Roland Gareis Model ................................................................................................................ 28
2.7.8. German Association Model for Project Management (GPM) .................................................. 29
2.7.9. Lynn Craford Maturity Model .................................................................................................. 30
2.7.10. Project Excellence Model (PEM) ........................................................................................... 31
2.7.11. Organizational Project Maturity Model (OPM3) .................................................................... 34
2.8. Summary .......................................................................................................................................... 36
Chapter Three................................................................................................................................ 39
Methodology ................................................................................................................................. 39
3.1. Introduction ...................................................................................................................................... 39
3.2. Analysing project audit and improvement models ........................................................................... 39
3.2.1. Identifying the advantages and disadvantages of the reviewed models .................................... 39
3.2.2. Ranking the models ................................................................................................................... 41
3.3. Model development process ............................................................................................................. 53
3.3.1. Developing the conceptual model (Phase 1) ............................................................................. 53
3.3.2. Developing the detail model (Phase 2) ..................................................................................... 54
3.3.3. Developing the scoring system for the model (Phase 3) ........................................................... 58
3.3. Summary .......................................................................................................................................... 60
Chapter Four ................................................................................................................................. 62
Model Development ...................................................................................................................... 62
4.1. Introduction ...................................................................................................................................... 62
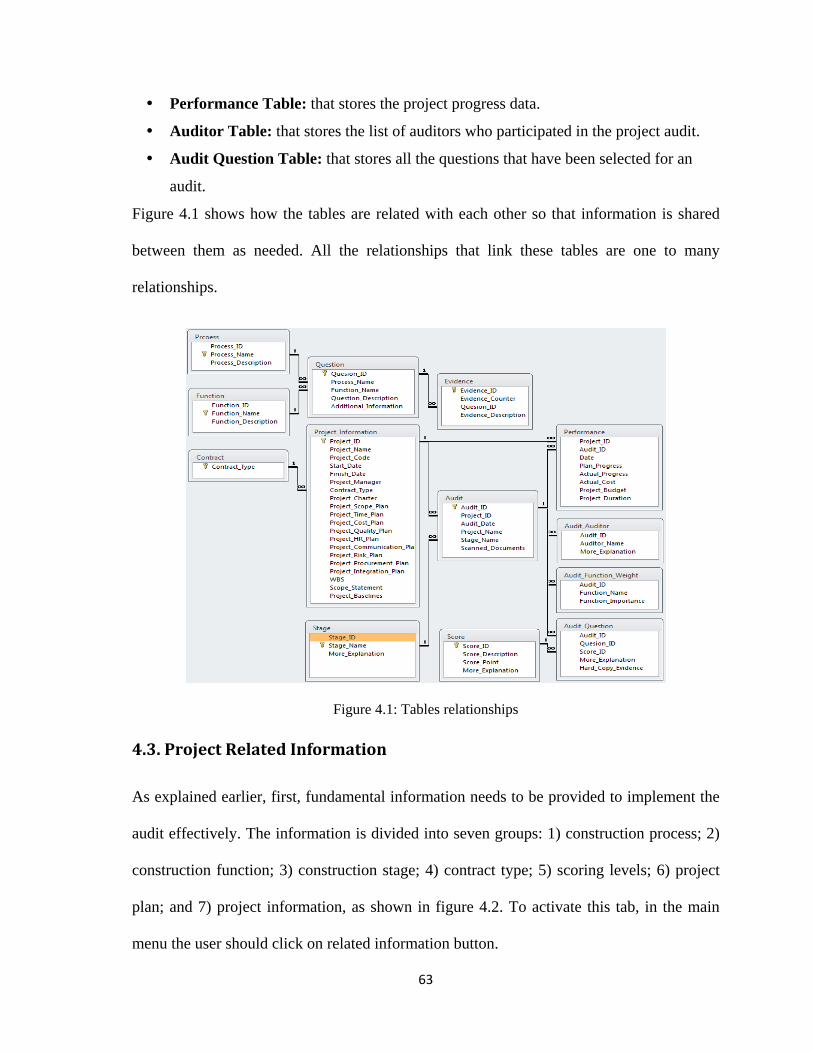
4.2. Table relationship ............................................................................................................................. 62
4.3. Project Related Information ............................................................................................................. 63
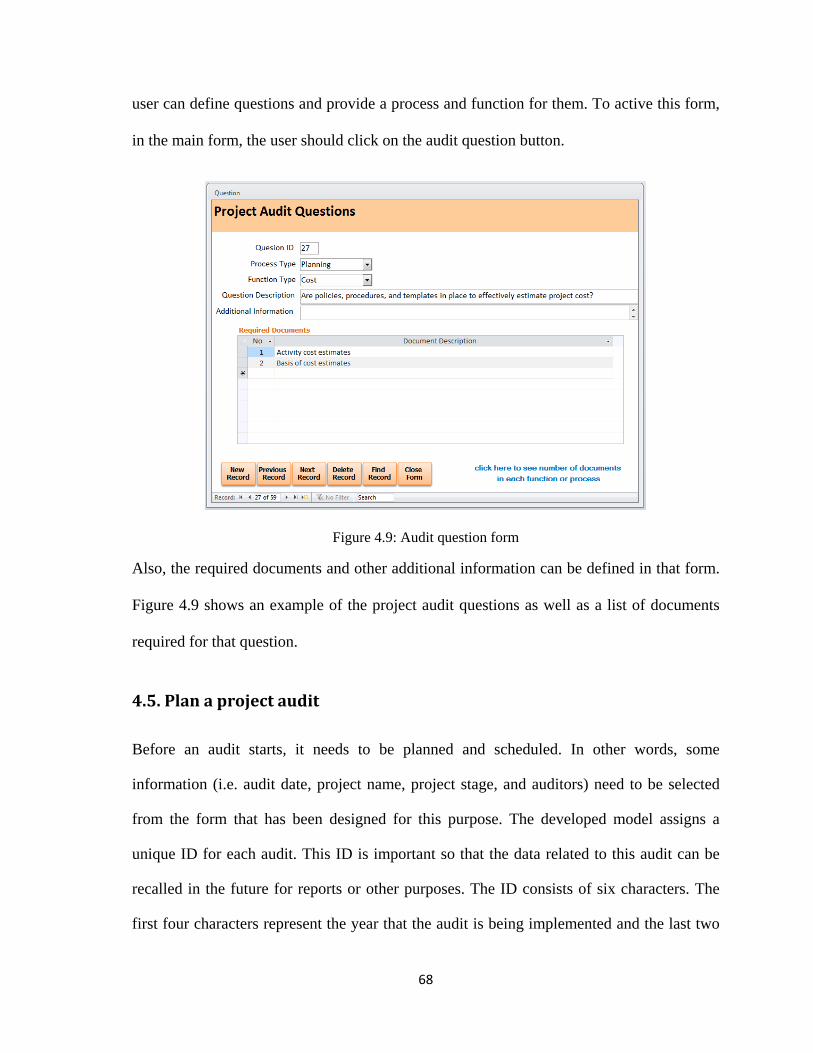
4.4. Audit questions ................................................................................................................................ 67
4.5. Plan a project audit ........................................................................................................................... 68
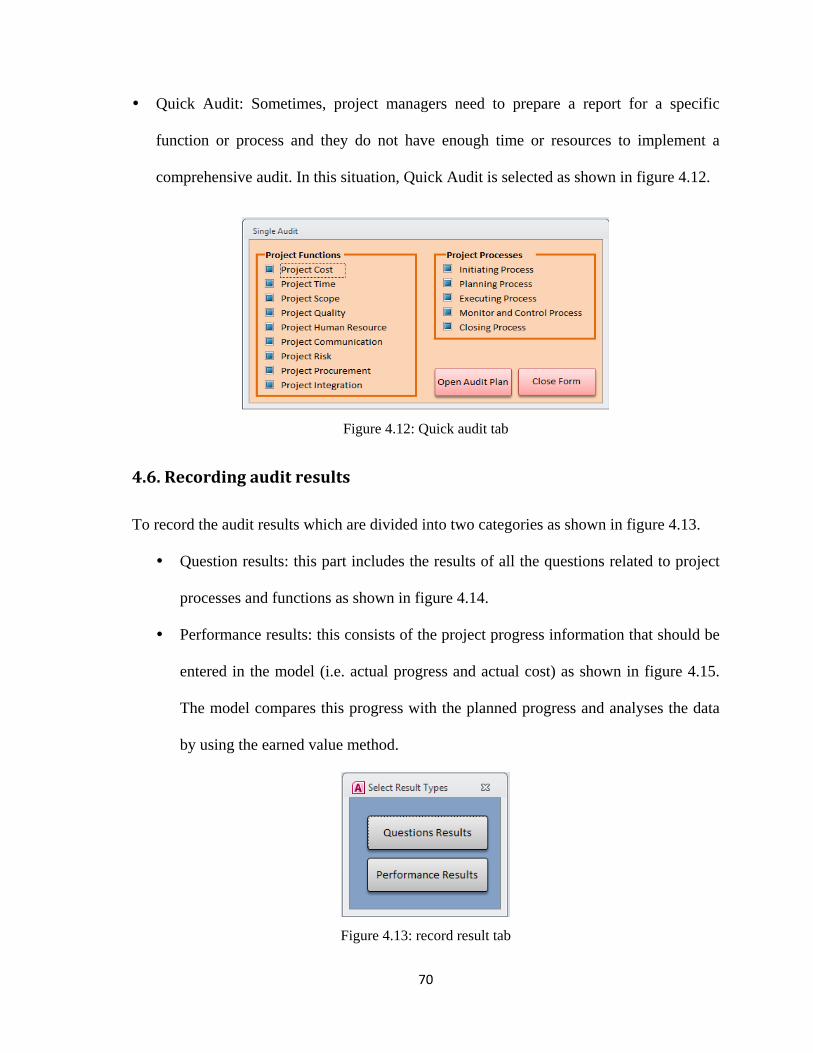
4.6. Recording audit results..................................................................................................................... 70
4.7. Output Reports ................................................................................................................................. 72
4.8. Summary .......................................................................................................................................... 75
Page 7
vii
Chapter Five .................................................................................................................................. 76
Model Validation .......................................................................................................................... 76
5.1. Introduction ...................................................................................................................................... 76
5.2. Related Information Menu ............................................................................................................... 77
5.3. Audit Questions Menu ..................................................................................................................... 82
5.4. Plan (schedule) a Project Audit ........................................................................................................ 83
5.5. Input Project Audit Results .............................................................................................................. 86
5.6. Reports ............................................................................................................................................. 88
5.7. Summary ........................................................................................................................................ 107
Chapter Six.................................................................................................................................. 108
Conclusion and Recommendations ............................................................................................. 108
6.1. Conclusion ..................................................................................................................................... 108
6.2- Research Contributions .................................................................................................................. 109
6.3- Limitations of the Developed Model ............................................................................................. 110
6.4- Recommendations for Future Expansion ....................................................................................... 110
References ................................................................................................................................... 111
Page 8
viii
List of Tables
Table 2.1: Influence of organizational structures on projects …………………………………...12
Table 2.2: Five levels P3M3 model ……………………………………………………………..22
Table 2.3: The main 19 project’s assessment areas in GPM model (Delta) ………………….....30
Table 2.4: Lynn Craford maturity model project criteria ……………………………………….31
Table 3.1: Reviewed models advantages ………………………………………………………..40
Table 3.2: Reviewed models disadvantages …………………………………………………….40
Table 3.3: Reviewed project audit and project maturity models (Alternatives) ………………...43
Table 3.4: Factors to model comparison (Criteria) ……………………………………………...44
Table 3.5: Alternative and criteria matrix ……………………………………………………….48
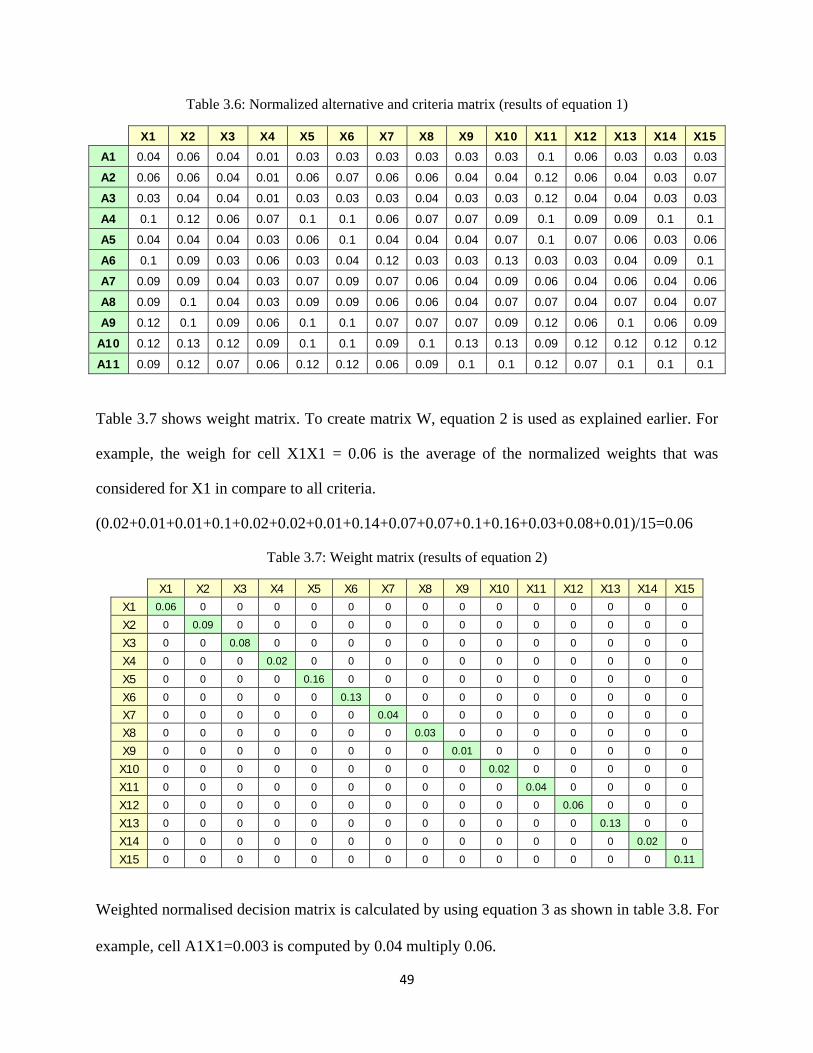
Table 3.6: Normalized alternative and criteria matrix (results of equation 1) …………………..49
Table 3.7: Weight matrix (results of equation 2) ………………………………………………..49
Table 3.8: Multiplying matrix y and w (results of equation 3) ………………………………….50
Table 3.9: The worst and the best alternatives (results of equation 4 and 5) ……………………50
Table 3.10: Distances between the target and the best alternative ……………………………...52
Table 3.11: Distances between the target and the worst alternative …………………………….51
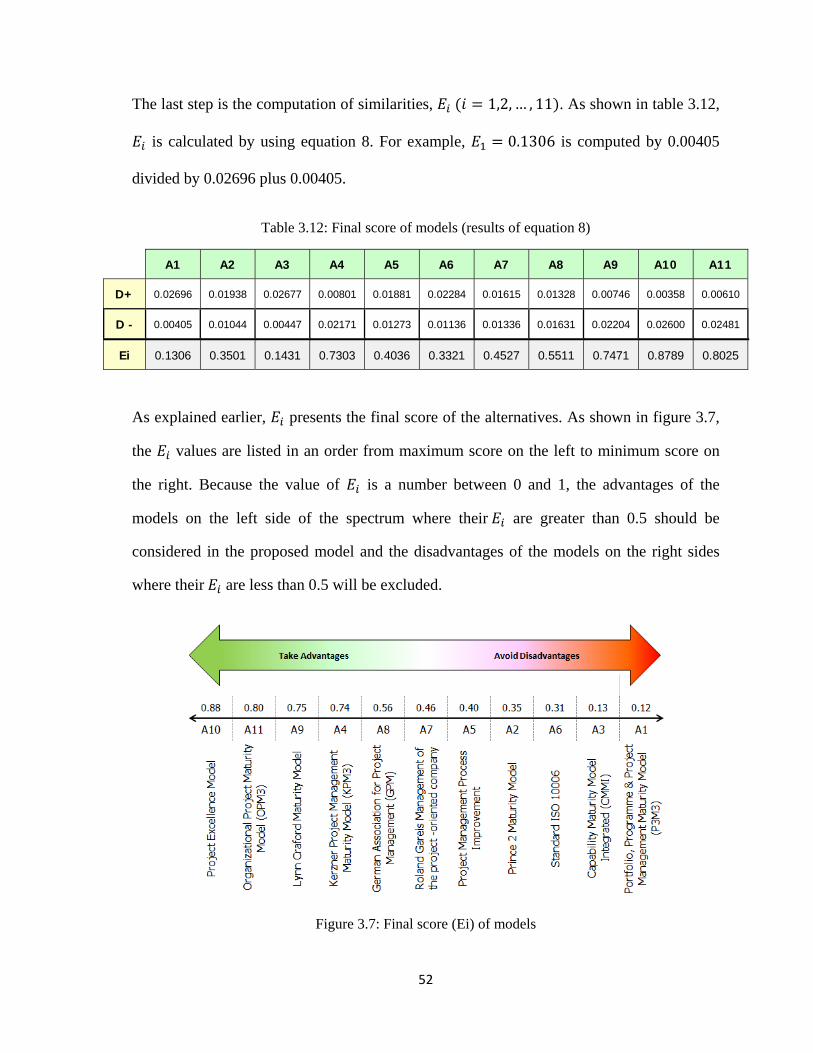
Table 3.12: Final score of models (results of equation 8) ……………………………………….52
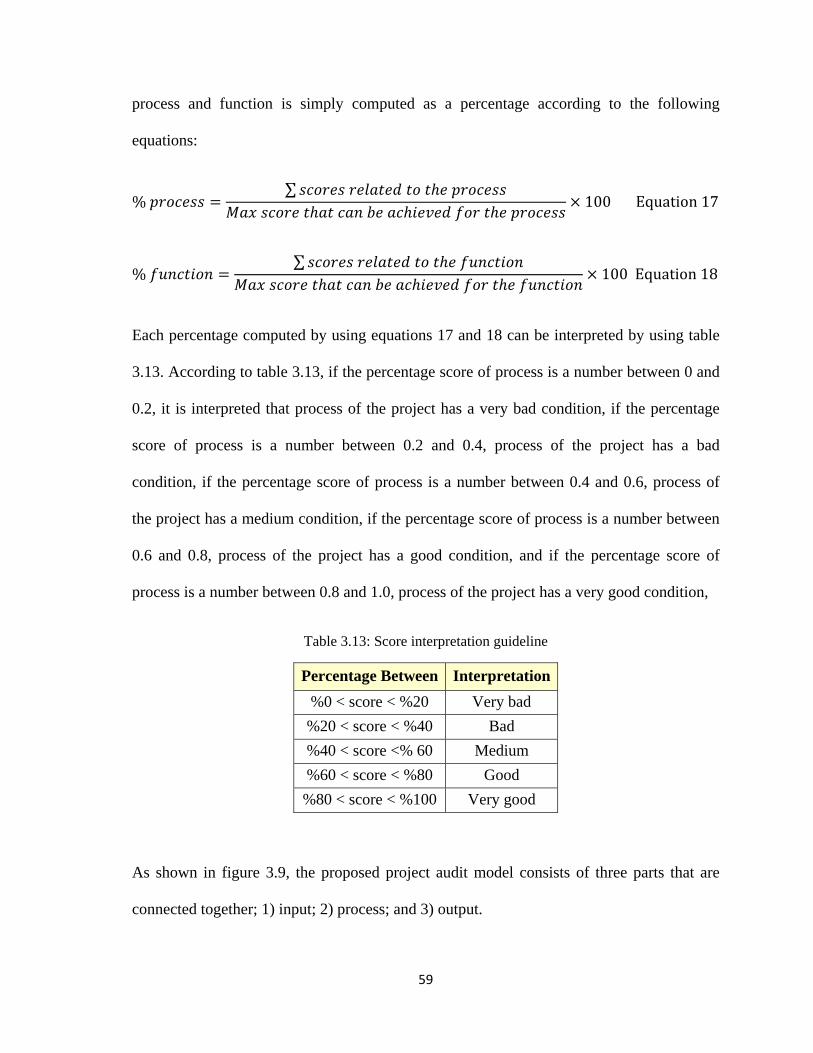
Table 3.13: Score interpretation guideline ………………………………………………………59
Page 9
ix
List of Figures
Figure 2.1: Process groups interact in a construction phase or project ………………………….10
Figure 2.2: Comparing project management functions ………………………………………….11
Figure 2.3: Typical cost and staffing levels across a construction project life cycle ……………14
Figure 2.4: Optimal project audit timing ………………………………………………………..17
Figure 2.5: An example of long-term performance improvements ……………………………..24
Figure 2.6: The five levels of Kerzner’s Project Management Maturity Model ………………..25
Figure 2.7: Roland’s model criteria ……………………………………………………………..29
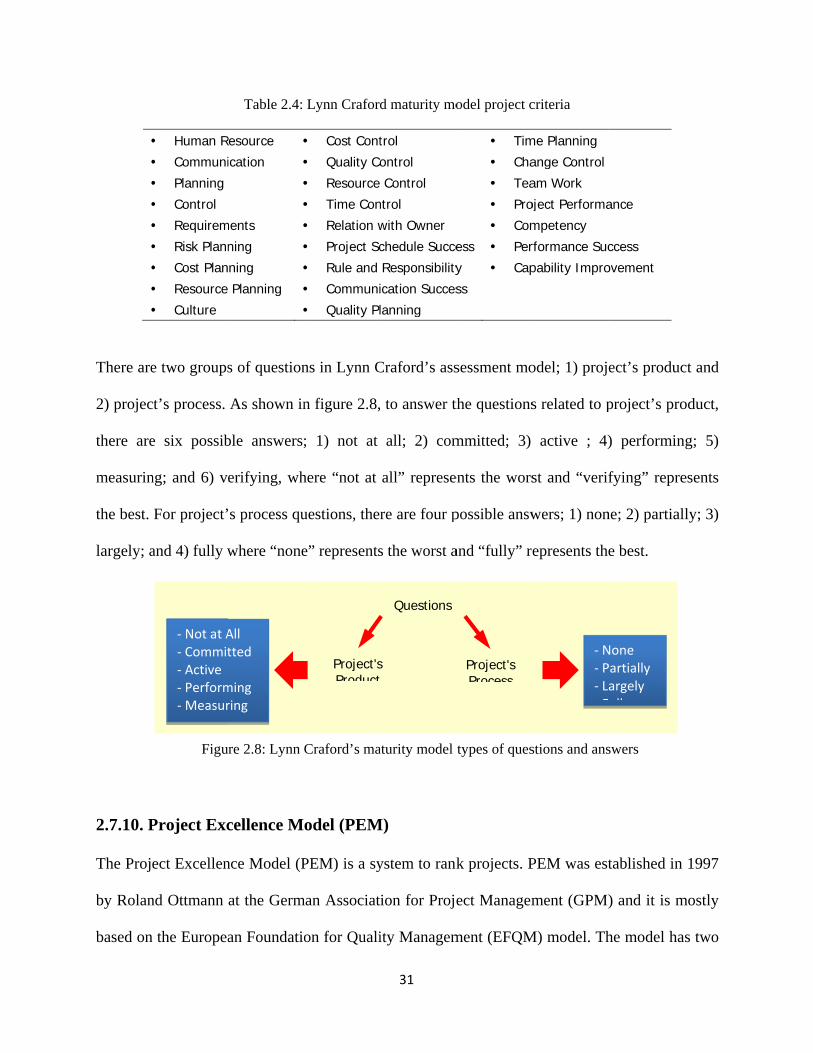
Figure 2.8: Lynn Craford’s maturity model types of questions and answers …………………...31
Figure 2.9: Project Excellence Model (PEM) criteria and sub-criteria …………………………32
Figure 2.10: Project Excellence Model (PEM) scores ………………………………………….33
Figure 2.11: three elements of the OPM3 ………………………………………………………35
Figure 2.12: Best practice, capability, outcome, and KPI in OPM3 model …………………….36
Figure 3.1: TOPSIS primary score checklist ……………………………………………………45
Figure 3.2: TOSIS participants’ gender …………………………………………………………46
Figure 3.3: TOSIS participants’ age …………………………………………………………….46
Figure 3.4: TOPSIS participants' working positions ……………………………………………47
Figure 3.5: TOPSIS participants' education …………………………………………………….47
Figure 3.6: TOPSIS participants' work experience ……………………………………………..47
Figure 3.7: Final score (Ei) of models …………………………………………………………..52
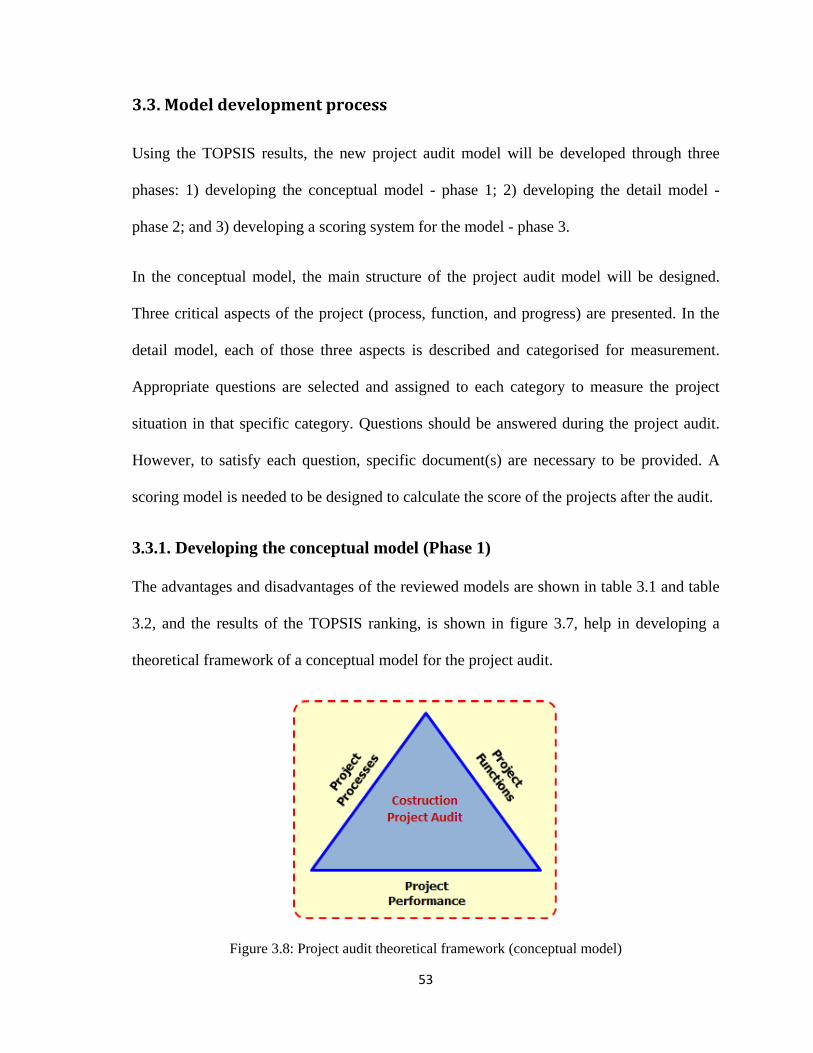
Figure 3.8: Project audit theoretical framework (conceptual model) …………………………..53
Figure 3.9: Project audit model …………………………………………………………………60
Figure 4.1: Tables relationships ………………………………………………………………...63
Page 10
x
Figure 4.2: Related information tab ……………………………………………………………..64
Figure 4.3: Project processes form ………………………………………………………………64
Figure 4.4: Project functions form……………………………………………………………… 64
Figure 4.5: Project stages form ………………………………………………………………….65
Figure 4.6: Scoring categories form ……………………………………………………………..65
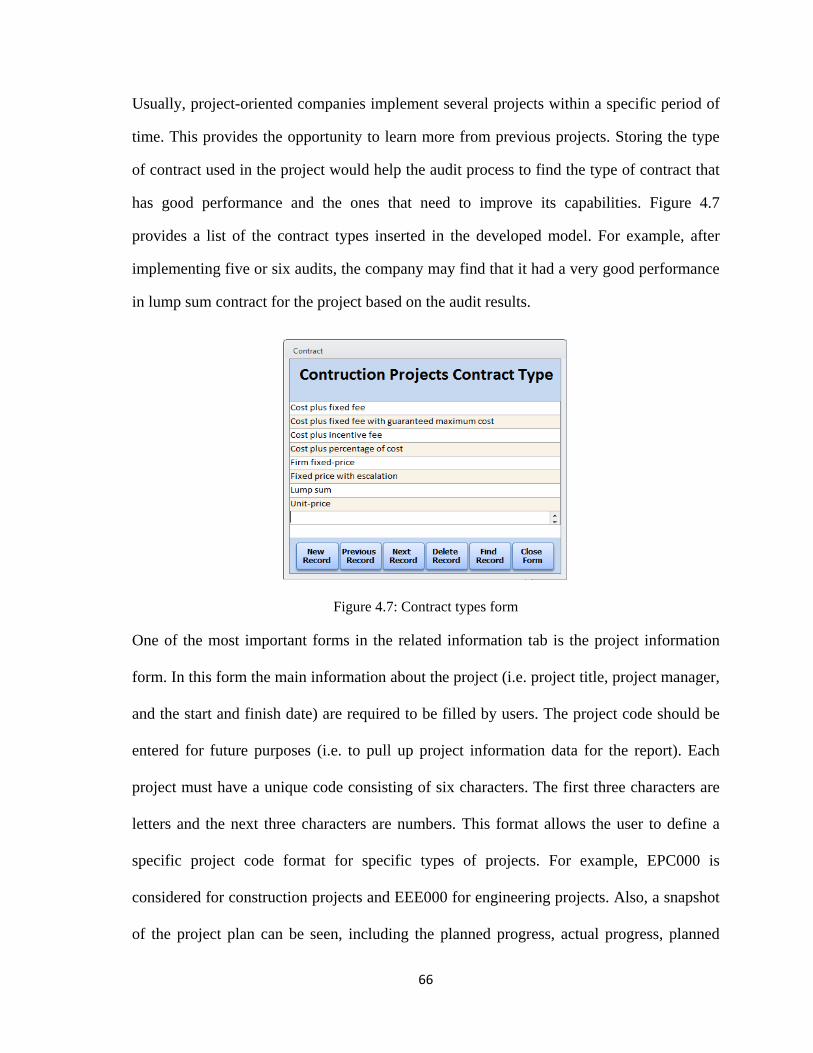
Figure 4.7: Contract types form ………………………………………………………………....66
Figure 4.8: Project information form ……………………………………………………………67
Figure 4.9: Audit question form …………………………………………………………………68
Figure 4.10: Audit types tab ……………………………………………………………………..69
Figure 4.11: Comprehensive planning audit form ………………………………………………69
Figure 4.12: Quick audit tab …………………………………………………………………….70
Figure 4.13: record result tab ……………………………………………………………………70
Figure 4.14: Recording questions' score ………………………………………………………...71
Figure 4.15: Recording performance data ………………………………………………………71
Figure 4.16: Selecting report type tab …………………………………………………………...72
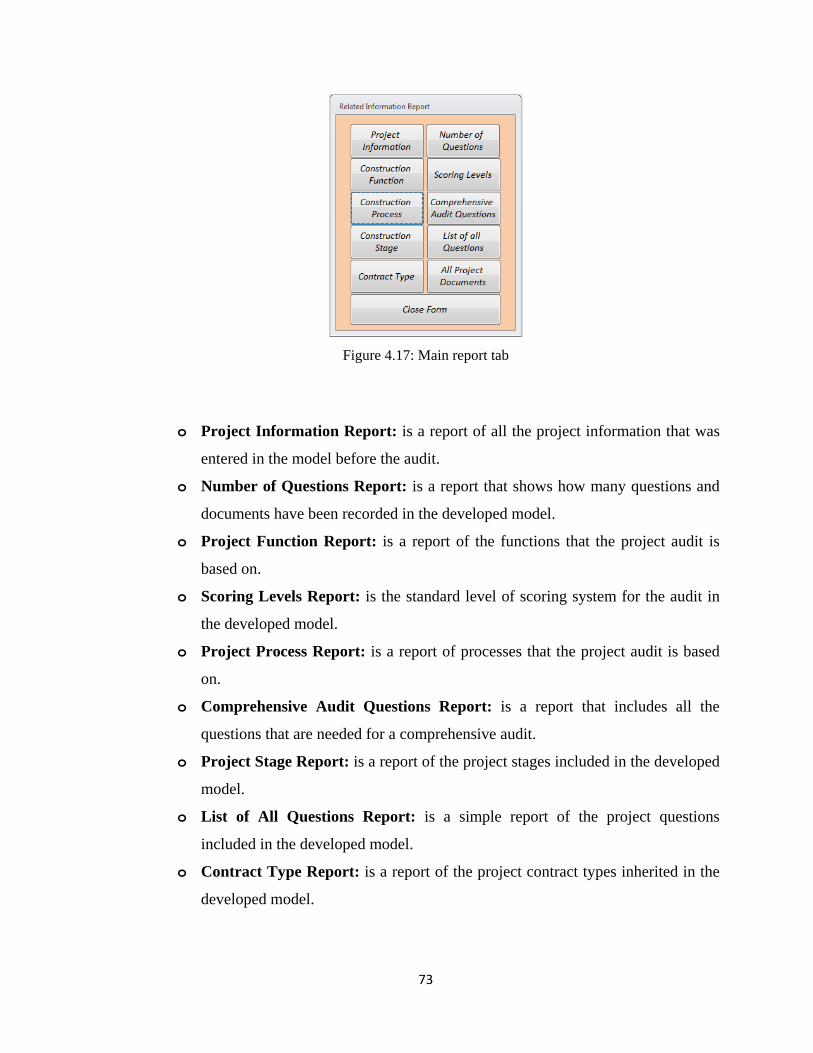
Figure 4.17: Main report tab …………………………………………………………………….73
Figure 4.18: Analytical report tab ………………………………………………………….……74
Figure 4.19: Data management dashboard ………………………………………………………75
Figure 4.20: Export data tab……………………………………………………………………...75
Figure 5.1: Related information menu …………………………………………………………..77
Figure 5.2: Project information input form without the summary plan …………………………78
Figure 5.3: Project summary plan ……………………………………………………………….79
Figure 5.4: Project information input form with summary of plan ……………………………...79
Page 11
xi
Figure 5.5: Project processes and functions input forms ………………………………………..80
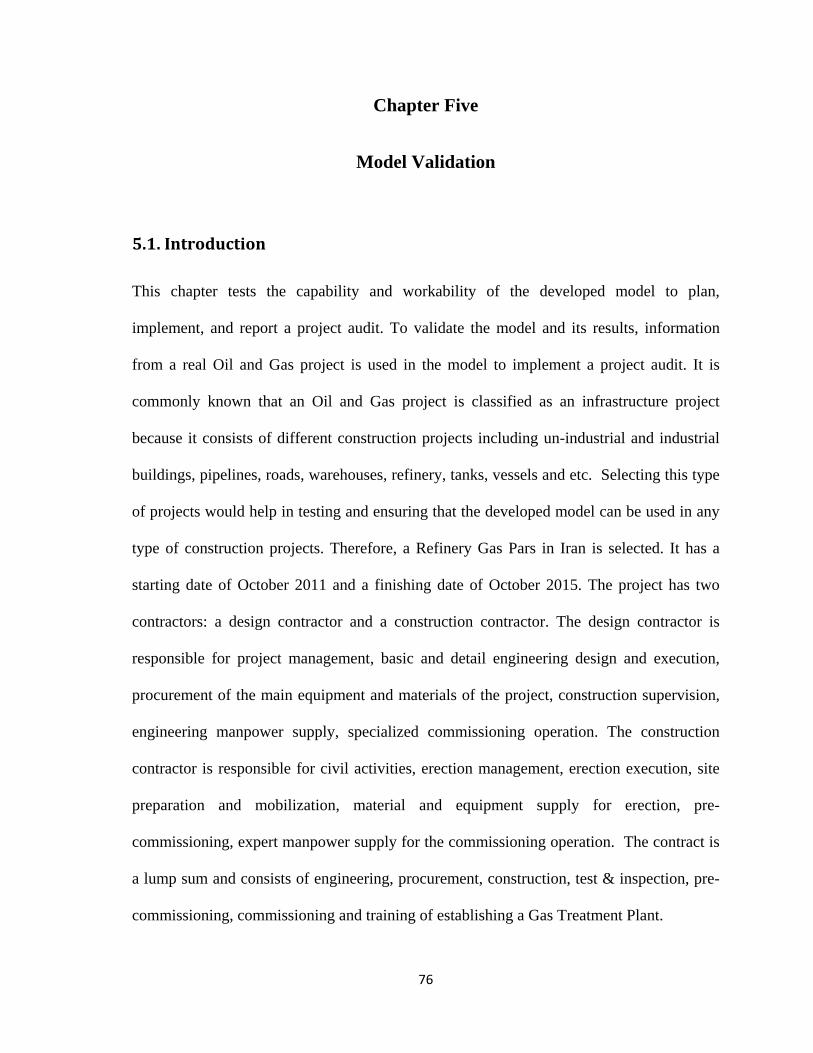
Figure 5.6: Project contract types and construction stages input forms ………………………...81
Figure 5.7: Project audit coring levels input form ………………………………………………82
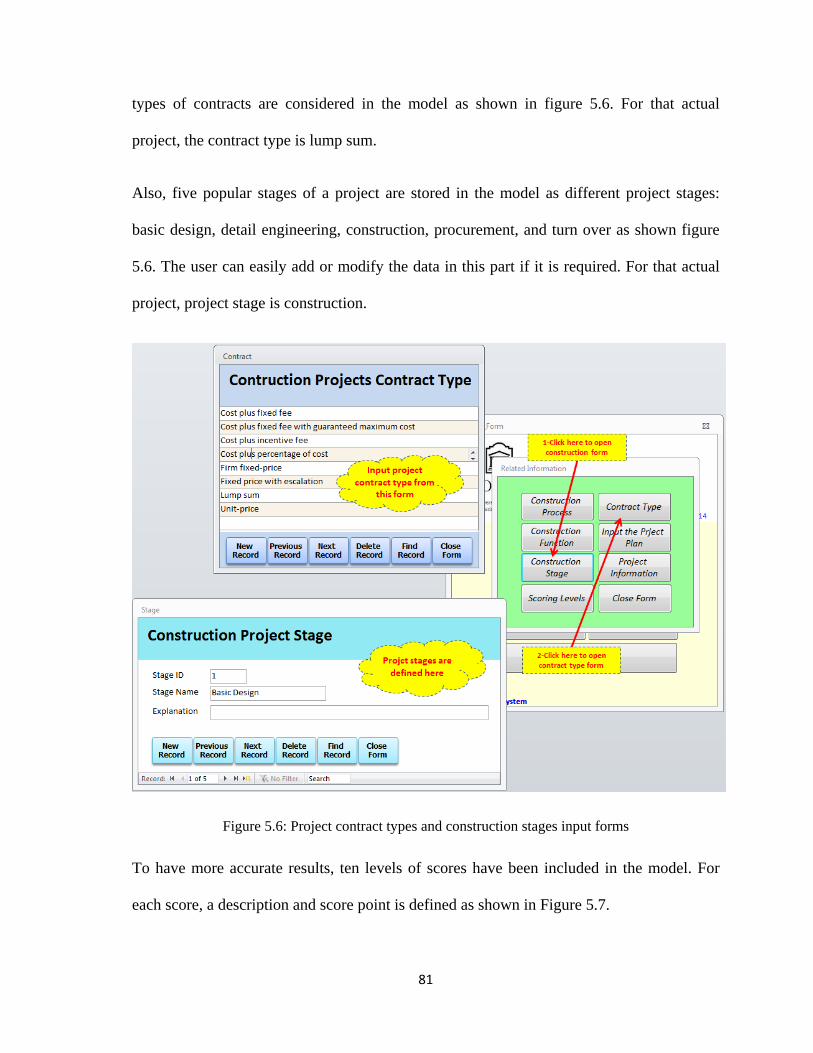
Figure 5.8: Project audit the questions form …………………………………………………….83
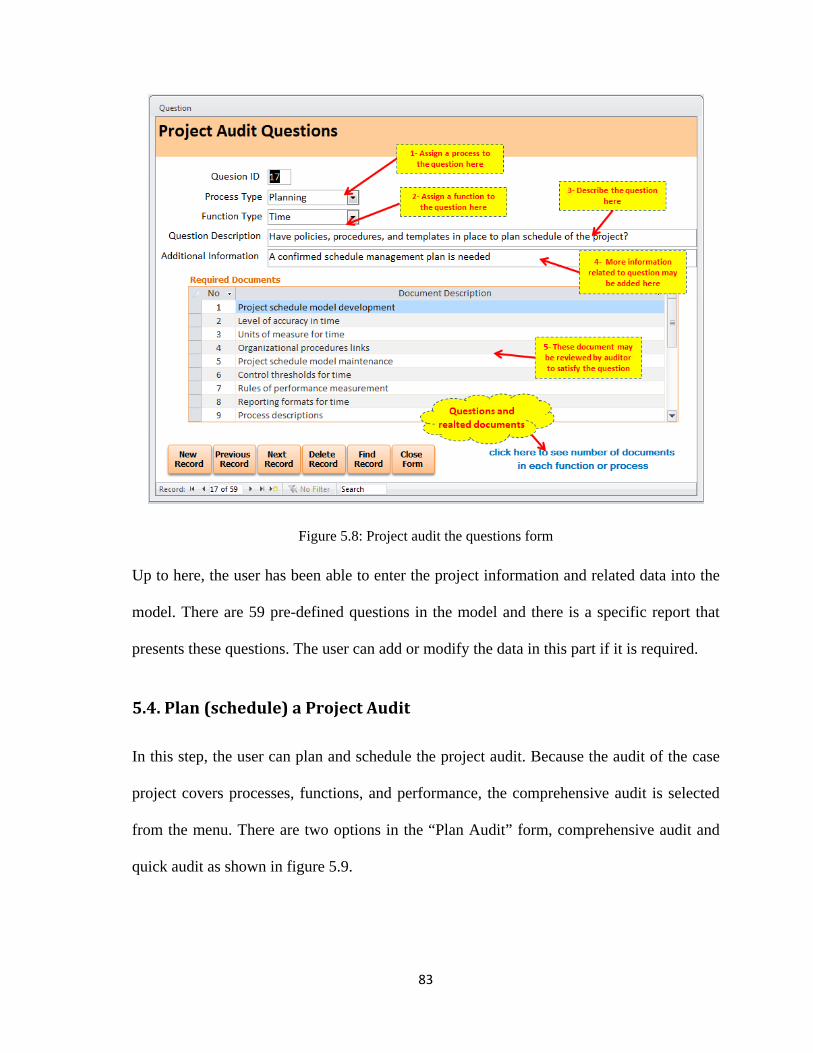
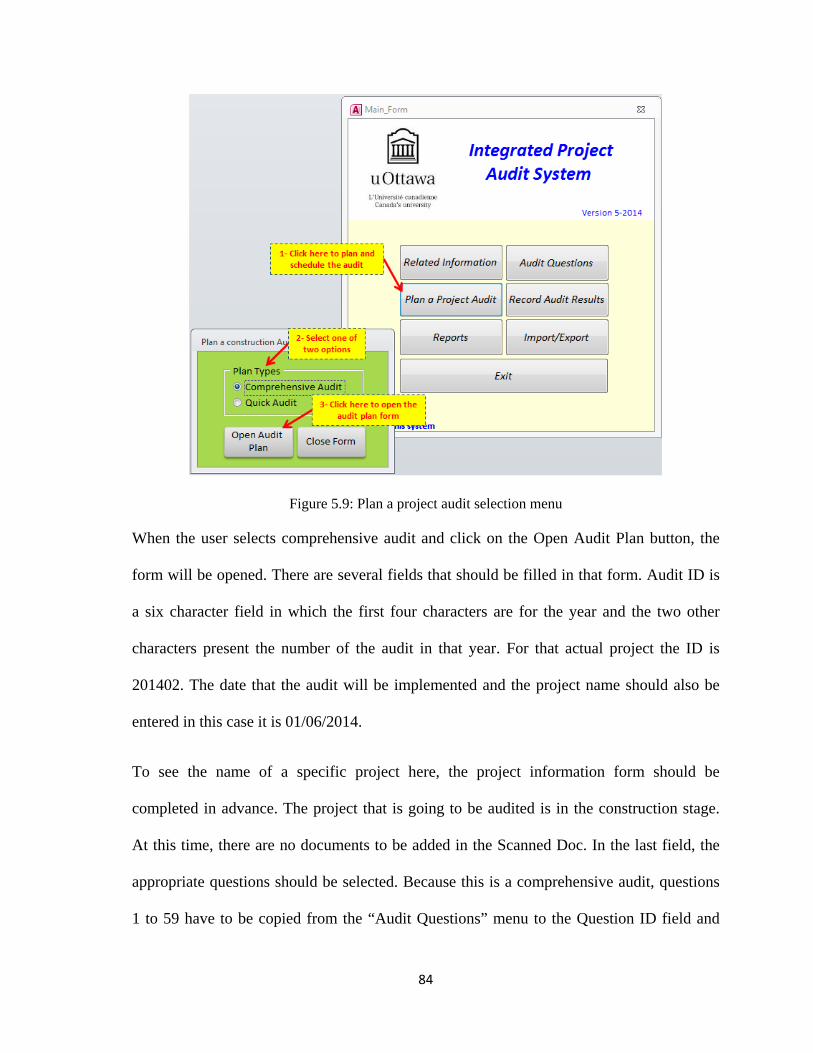
Figure 5.9: Plan a project audit selection menu …………………………………………………84
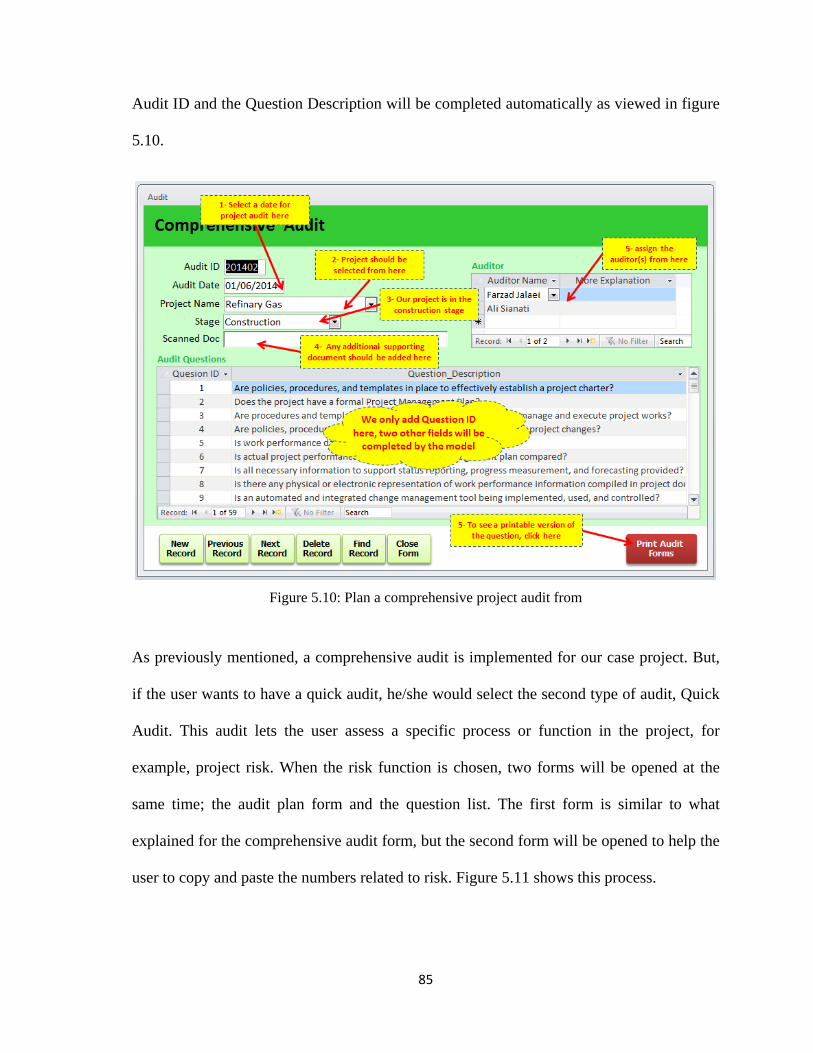
Figure 5.10: Plan a comprehensive project audit from ………………………………………….85
Figure 5.11: A sample to plan a quick project audit form for another project ………………….86
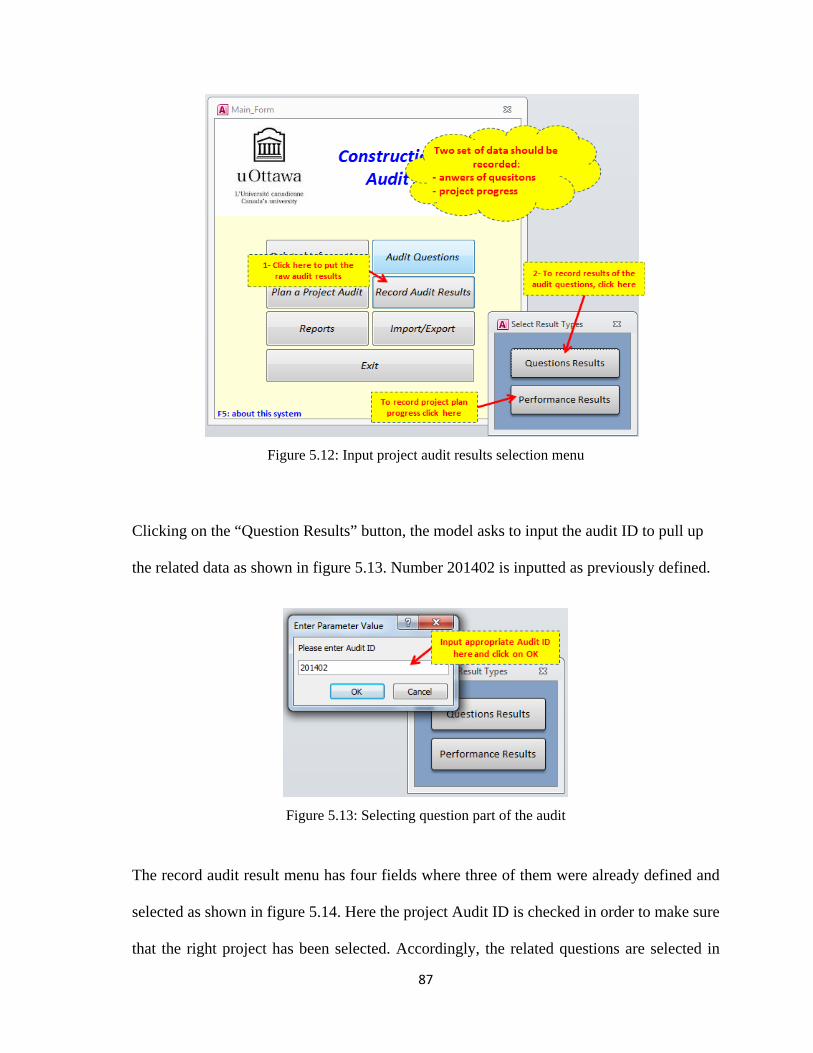
Figure 5.12: Input project audit results selection menu …………………………………………87
Figure 5.13: Selecting question part of the audit ………………………………………………..87
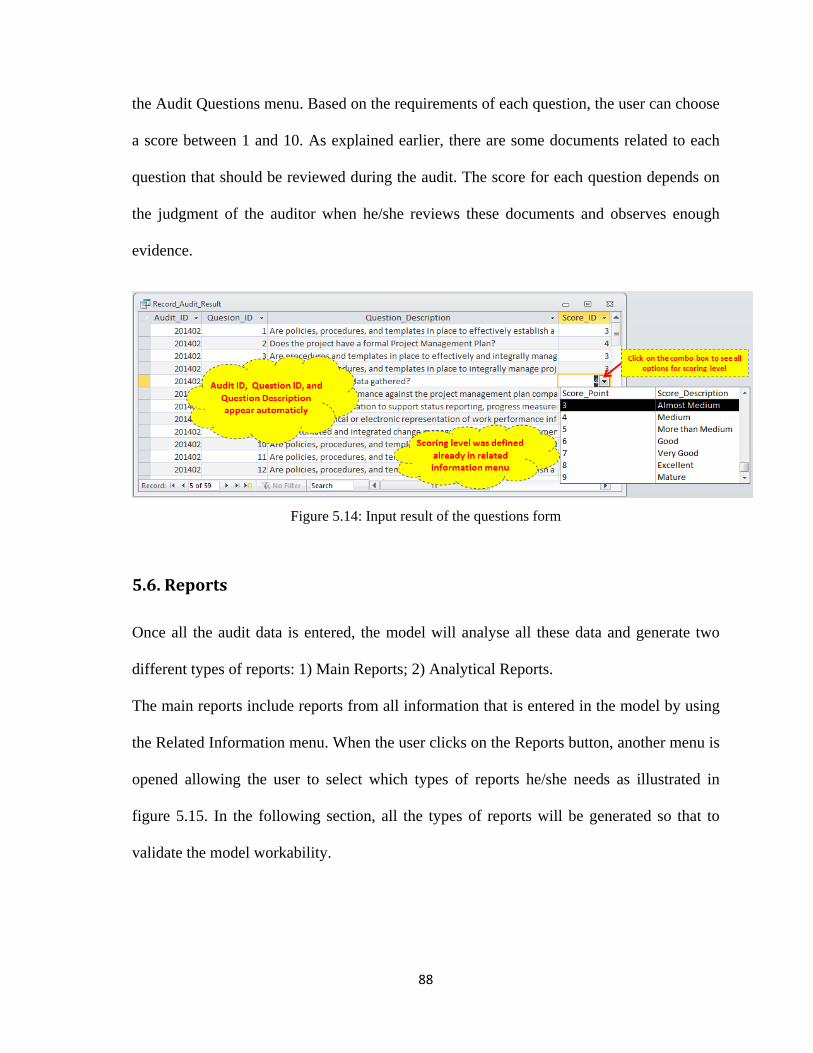
Figure 5.14: Input result of the questions form ……………………………………………….....88
Figure 5.15: Report selection menu …………………………………………………………..…89
Figure 5.16: Main report selection form ……………………………………………..………….89
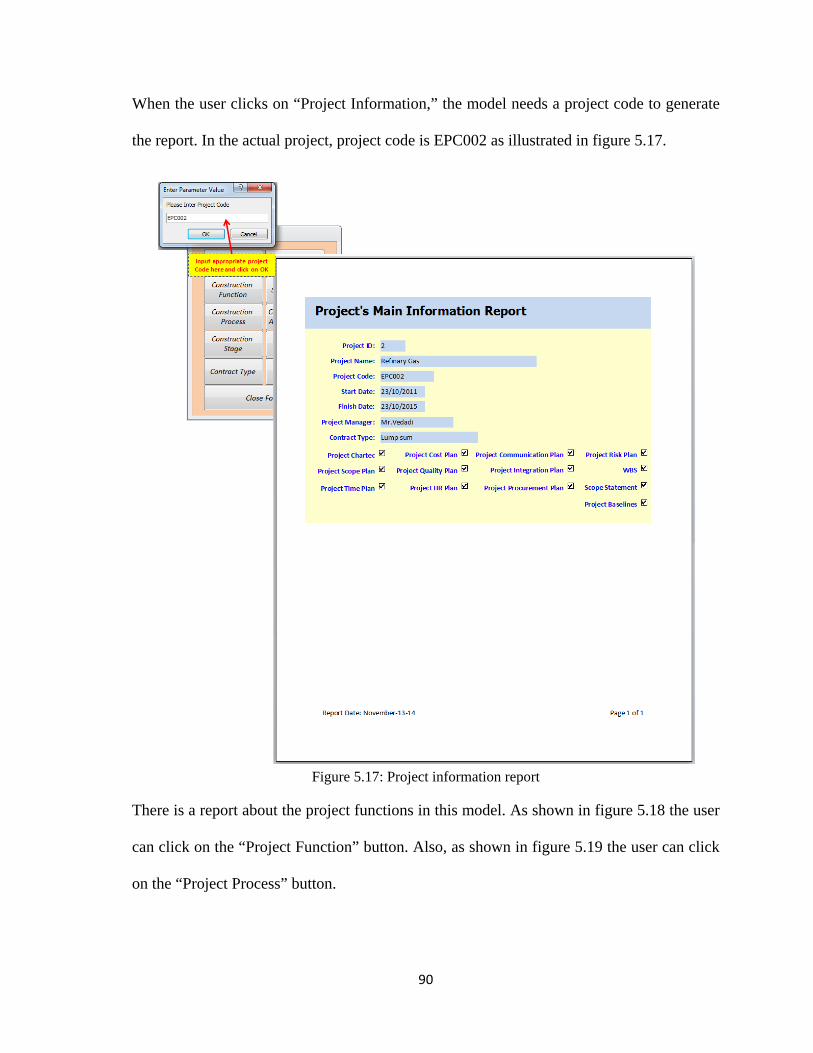
Figure 5.17: Project information report ………………………………………………………....90
Figure 5.18: Project functions report ……………………………………..……………………..91
Figure 5.19: Project Processes report ……………………………..………………………….….91
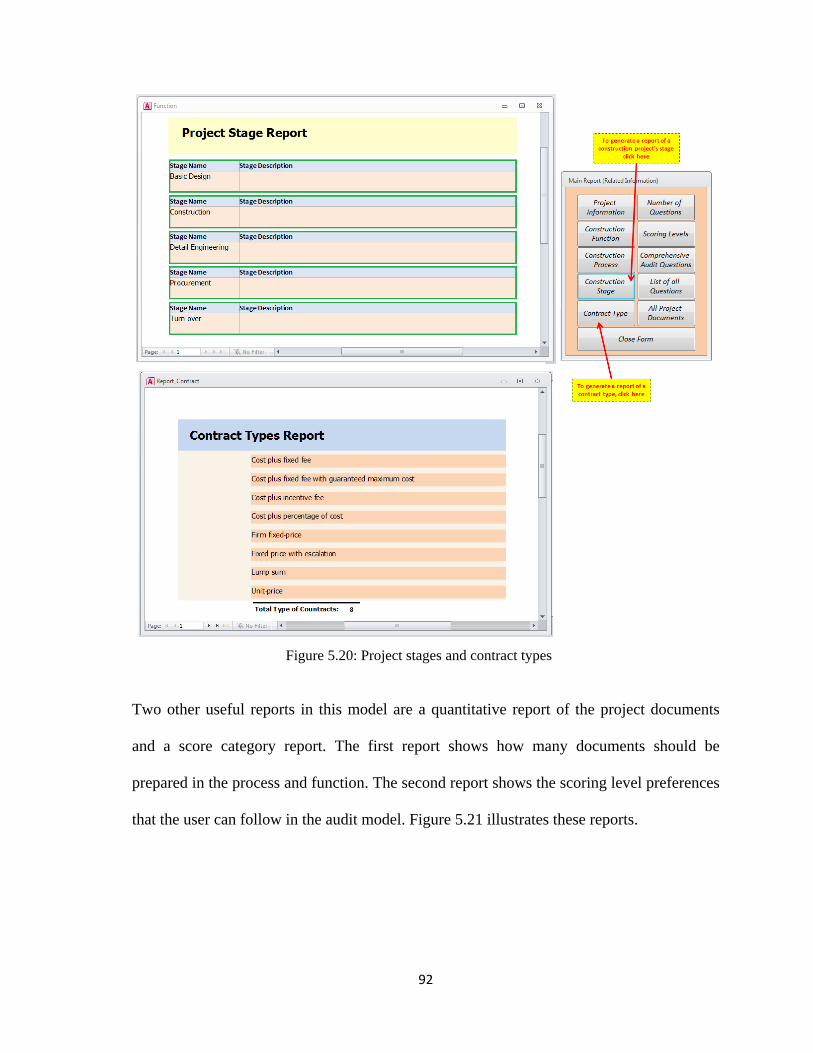
Figure 5.20: Project stages and contract types …………………………………..………………92
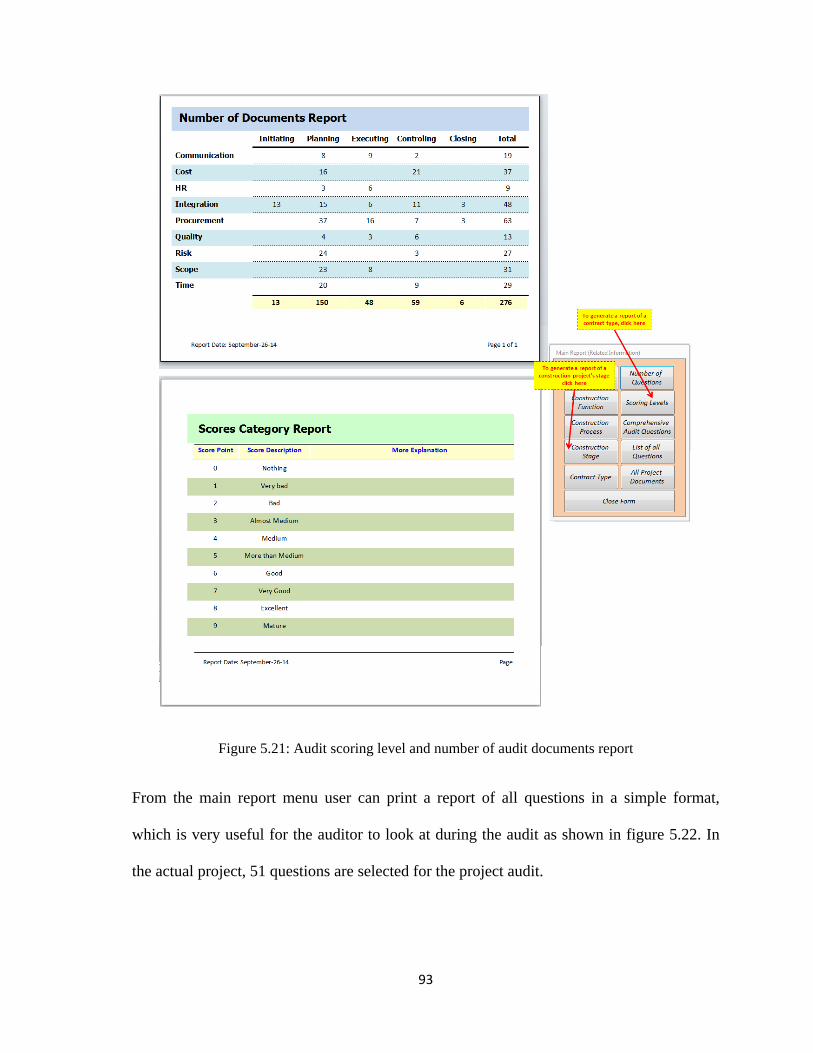
Figure 5.21: Audit scoring level and number of audit documents report …………………..…...93
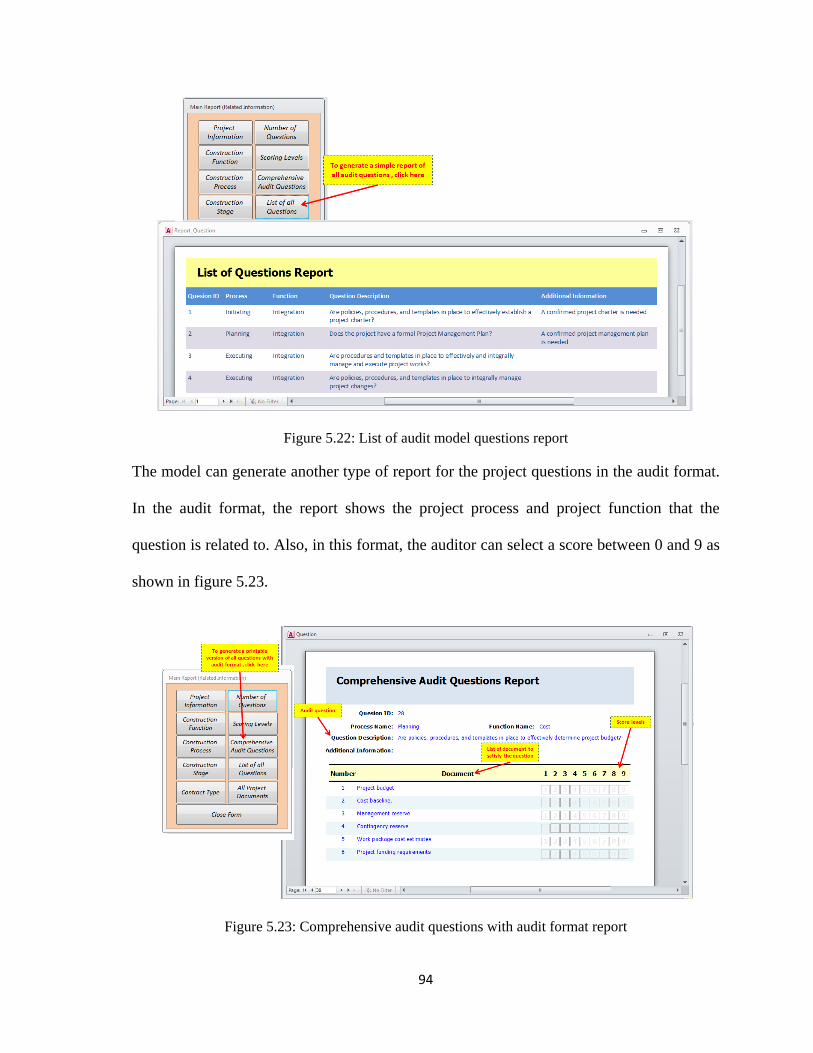
Figure 5.22: Comprehensive audit questions with audit format report …………………..……..94
Figure 5.23: List of audit model questions report ………………………………………...……..94
Figure 5.24: List of audit model documents report ………………………………………...……95
Figure 5.25: Analytical report selection menu ……………………………………………..……96
Figure 5.26: Analytical report of project processes ………………………………………..……96
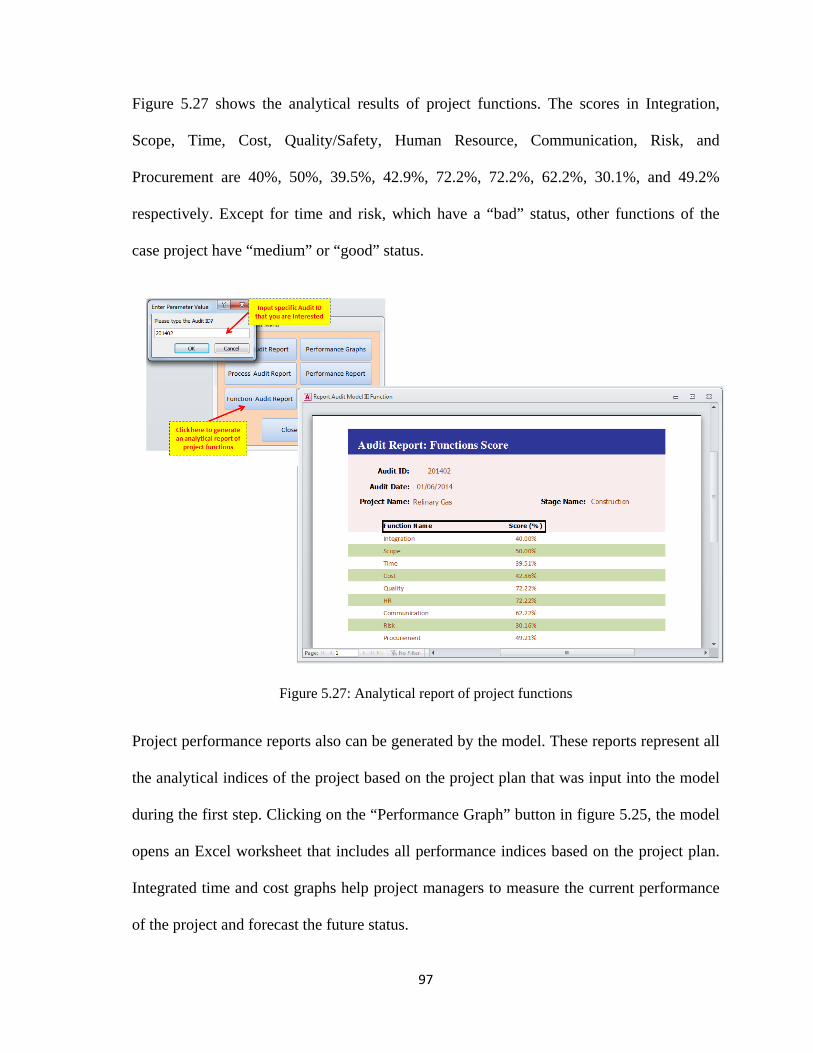
Figure 5.27: Analytical report of project functions …………………………………..…………97
Page 12
xii
Figure 5.28: Earned value main indices ………………………………………………..……….98
Figure 5.29: Earned value main indices with forecast …………………………………..………99
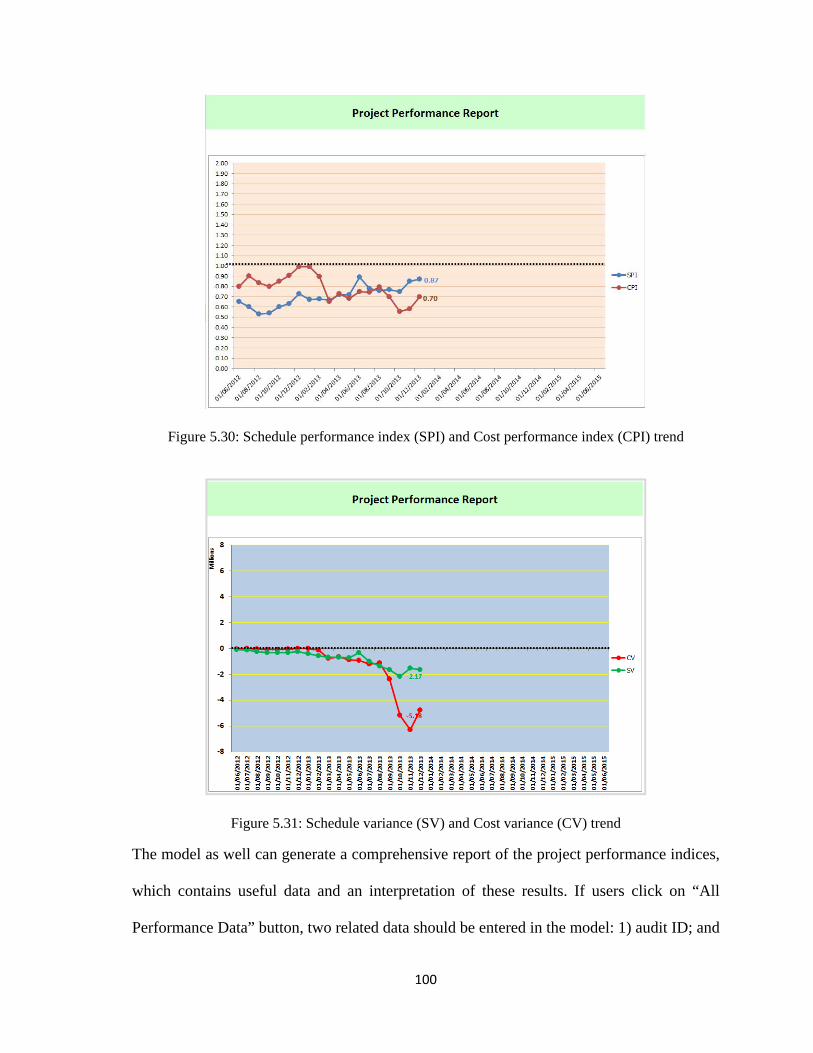
Figure 5.30: Schedule performance index (SPI) and Cost performance index (CPI) trend …...100
Figure 5.31: Schedule variance (SV) and Cost variance (CV) trend …………………………..100
Figure 5.32: Project performance analytical report selection menu …………………………...101
Figure 5.33: Project performance analytical report with comment ……………………………102
Figure 5.34: Project performance analytical guideline ………………………………………...102
Figure 5.35: Project function status model I …………………………………………………...103
Figure 5.36: Project function status model II ………………………………………...………...104
Figure 5.37: Project process status model I …….…….………………………………………..104
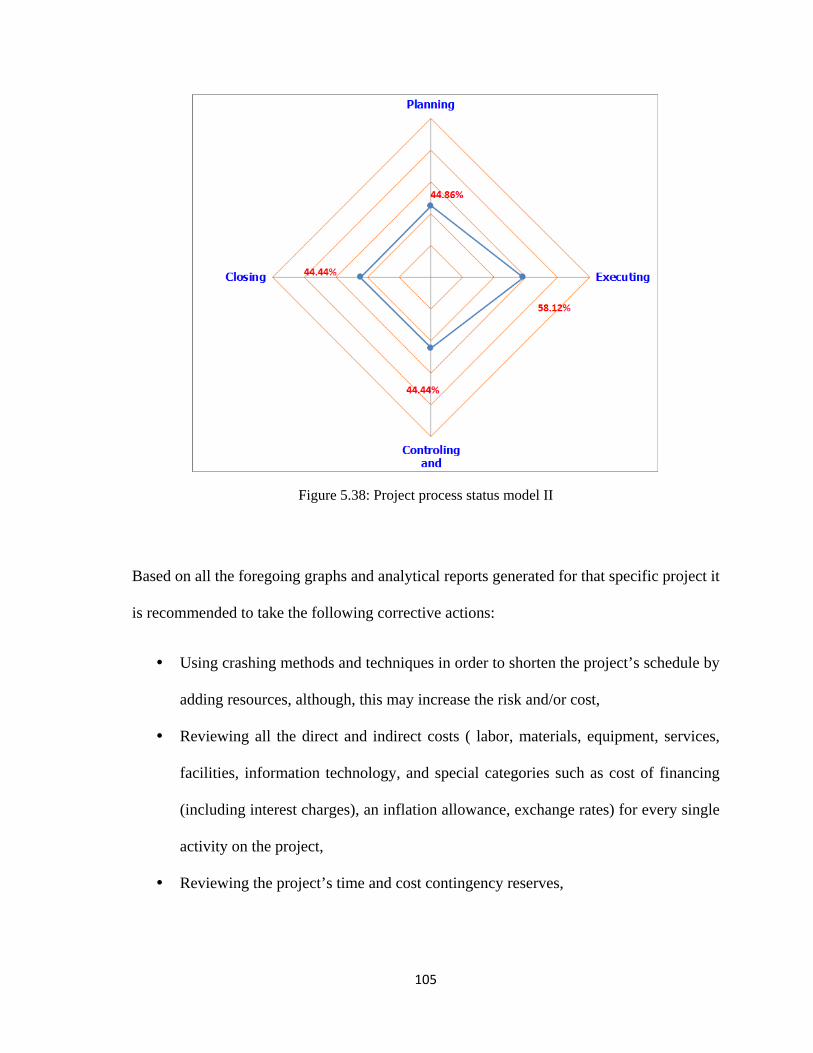
Figure 5.38: Project process status model II …………………………………………………...105
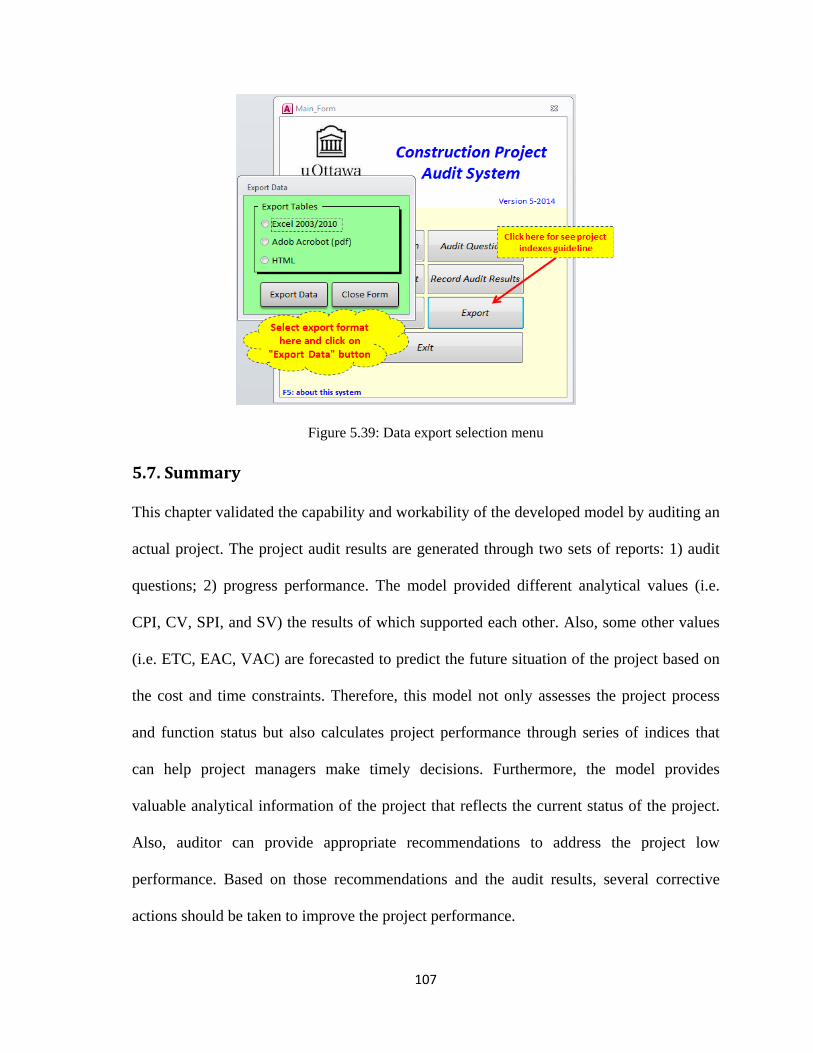
Figure 5.39: Data export selection menu ………………………………………………………107
Page 13
xiii
Glossary
ACWP Actual Cost of Work Performed
BCWP Budgeted Cost of Work Performed
BCWS Budgeted Cost of Work Scheduled
CMMI Capability Maturity Model Integrated
CSF critical success factors
CV Cost Variance
EFQM European Foundation for Quality Management
EVM Earned Value Method
GPM German Association Model for Project Management
IPMA International Project Excellence Award
KPA Key Performance Area
KPI Key Performance Indicators
KPM3 Kerzner Project Management Maturity Model
MADM Multiple Attributes Decision Making
MPP Measuring Project Performance Tool
OGC Office of Government Commerce
OPM3 Organizational Project Management Maturity Model
P2MM Prince2 Maturity Model
P3M3 Portfolio, Programme & Project Management Maturity Model
PD Process definitions
PEM Project Excellence Model
PHC Project Health Check
Page 14
xiv
PHT Project Health Check Tool
PMBOK Project Management Body of Knowledge
PMI Project Management Institute
PMO Project Management Office
PMP Project Management Professional
PP Process Practice
PQC Practice Questionnaire Corporate
SEI Software Engineering Institute
SPI Schedule Performance Index
SV Schedule Variance
TOPSIS Technique for Order of Preference by Similarity to Ideal Solution
TQM Total Quality Management
Page 15
1
Chapter One
Introduction
1.1. Background
Nowadays, using the project as a strategic success factor is continuously increasing; this proves
the importance of projects. Organizations use projects for many purposes but these projects do
not always have the planned results. Some projects fail to achieve their objectives, some projects
are cancelled, and in other cases organizations have to re-plan the project strategy. It is rare to
find a successful project in which the results are better than what was planned. Lack of efficiency
in planning the project deliverable may impose a higher cost and more resources. Poorly-defined
quality and specifications result in a low level of project quality. Project-oriented organizations
have many challenges to manage projects correctly and to achieve their predetermined
objectives. They know that maintaining an ideal logical balance among project constraints such
as time, cost, and quality can vastly improve the chances of project success. In order to save
time, reduce costs, and improve quality in projects, organizations are aware of the importance of
switching from traditional project management methods to modern, scientific, and up-to-date
project management methodologies, which improve project performance and efficiency during
the whole project life cycle. Using different tools and techniques such as project control
methods, risk management methodologies, cost management applications, value engineering
techniques, etc., have the potential to aid the critical role of construction management. Because
of the huge amount of investment in infrastructural projects (i.e., oil and gas, roads, dams, and
buildings) around the world, organizations should not only use valid standards, rules, and
Page 16
2
regulations for projects but they must also always assess the outcome of their projects. In this
research the focus is on the type of project named “Oil and Gas Projects” in Iran.
One of the most useful tools by which project-oriented organizations can assess their project
success, find project’s issues, and monitor its performance is the “Project Audit.” In the
literature, an audit is defined as a systematic, integrated, and independent assessment to
determine the level of achieving project requirements and progress. A project audit is an
assessment of the effectiveness and efficiency of project performance, management, and
compliance. A construction project audit is a detailed evaluation of all its functions in order to
find the project concerns, issues, and challenges so a set of corrective actions can be provided. A
project audit can be formal or informal. Also, it may be quick or comprehensive. It can be done
anytime during the project life cycle including the conception stage, the implementation stage, or
the closing stage. Finding the reasons for uncomfortable symptoms is the primary purpose of a
project audit. This audit may be done by asking the project team simple questions such as:
Are you being told the truth about the current status of the project?
Is the project going to deliver something that meets its requirements?
Is the project management approach being used appropriately?
Should you believe the project plan?
Is the project organised appropriately, and are the project processes being fully followed?
What should be done to improve the project performance?
The output of a project audit should answer these questions. The main achievement of a project
audit is the identification of the lessons learned, resulting in a positive impact on project
performance. Also, an audit provides an opportunity to improve the performance of future
Page 17
3
projects by avoiding repeating the same errors and mistakes. In this case, for project-oriented
organizations, project audits are highly beneficial because of the following outcomes:
Defining project success factors such as being on-time, being on-budget, having
acceptable quality, satisfying stakeholder expectations, etc.
Defining a corrective action plan that may address current problems and enhance the
likelihood of success in future projects
Providing a valuable source for risk management because all issues and concerns
mentioned in a project audit report are the project risks
Identifying the lessons learned on the project, which can be applied in future projects
within the organization.
Providing recommendations to prevent potential problems and challenges.
Developing documents of the project lessons learned that are beneficial for the
organization and its subcontractors.
Providing a snapshot of the current situation of the project that says whether the project is
on-track or off-track.
Showing the project performance trend, especially for long term projects, such as oil and
gas, which take more than 5 years, by doing periodic project audits.
Identifying both the opportunities and the risks of the project.
1.2. Research Objectives
Because huge amounts of work, time, and money are spent in the construction of projects, it is
very important to know that the project meets its predetermined objectives and to ensure its
success. Although the term “project audit” may have a negative connotation to it, especially for
the project team undergoing it, a project audit will result in a positive outcome, whether a project
manager and his/her team passes or fail it. The objectives of this research are based on actual
Page 18
4
problems (i.e. delay, over budget, quality, resources, and project management) that face
organizations and project team during the project life cycle. The main objective of this research
is to develop an integrated project audit model with several modules for construction projects,
which can be used as a tool during the project implementation. The proposed model can be
applied in any construction project regardless of its location. It reports the status of project
processes and project functions, and measures their performance. The sub-objectives of the
research are:
Study and evaluate the different methods (i.e. project maturity model, project
measurement performance) used to assess construction projects.
Identify advantages and disadvantages of current project audit tools and models.
Determine the critical factors (i.e. process, function, performance indices) which affect
construction project results.
Developing an automated tool, which can be used during construction implementation to
assure the quality of project implementation and project management methodology,
identify project risks and issues, and document the lessons learned.
Developing an integrated project audit model that can be used in construction projects
despite of the project location, size, and duration.
1.3. Methodology
To accomplish all the above listed objectives the following steps need to be taken:
1.3.1. Literature Review
A review related to construction project processes and functions, project success factors and
project management methodology are necessary. Furthermore, a comprehensive review of
project audits and project maturity models must be conducted.
Page 19
5
1.3.2. Data Collection
Because this integrated project audit model stores and analyses the project’s data, collecting
accurate and updated data is a very important step for this research. The data was collected from
real Oil and Gas construction projects implemented in Iran between 2011 and 2014.
1.3.3. Analysing project audit and improvement models
After reviewing the project audit and improvement models, these will be analysed. This analysis
is divided into two parts; 1) identifying the advantages and disadvantages of each model; 2)
ranking the models based on their advantages. Then, several advantages and disadvantages have
been identified for each model. The advantages will be included in the proposed model while the
disadvantages will be excluded.
1.3.4. Model development process
The new project audit model will be developed through three phases: 1) developing the
conceptual model; 2) developing the detail model; and 3) developing a scoring system for the
model. In the conceptual model, the main structure of the project audit model will be designed.
In the detail model, selected aspects (process, function, and progress) of the project are described
and categorised for measurement. A scoring model is needed to be designed to calculate the
score of the projects after the audit.
1.3.5. Model Validation
To validate the capability and workability of the developed model and its results, a real Oil and
Gas project is audited by using the developed model. The project is a Refinery Gas Pars which
has a starting date of October 2011 and a finishing date of October 2015.
Page 20
6
1.4. Thesis Organization
This thesis consists of six chapters. A brief description of each chapter is provided as follows:
- Chapter Two: This chapter present a comprehensive literature review of the research which
is divided into two main parts: 1) construction project management methodology, 2) project audit
and improvement models. The first part focuses on project management methodology and related
subjects (i.e. project processes, functions, life cycle, project team organization). This part helps us
to understand the methodology used to manage construction projects and describes its critical
elements. The second part provides a comprehensive review of different project audit and
improvement models. This is achieved by identifying the advantages and disadvantages of each
model to be considered during the development of the proposed model.
- Chapter Three: This chapter describes the methodology that has been used to develop the
proposed project audit model, clarify its components, and show the data flow.
- Chapter Four: This chapter illustrates the development process of the proposed project audit
model and shows the main steps that have been followed.
- Chapter Five: In this chapter the capability and workability of the developed project audit
model is examined by using a real Oil and Gas project.
- Chapter Six: This chapter consists of the thesis conclusion and the list of recommendations.
Also, some future expansions have been suggested as well as limitations of the current research
is provided.
Page 21
7
Chapter Two
Literature Review
2.1. Introduction
One of the important knowledge areas in project management is performance management,
which will be more vital if it is integrated with other sciences (i.e. project performance
management). There is lots of research works related to project Key Performance Indicators
(KPI) that are only concern about the output of the projects (Atkinson, 1999). However, a project
audit provides the opportunity for the project team, especially the project manager and project
sponsor, to find the problems, concerns, and challenges that are raised during the project life
cycle including design, implementation, and turn over. The audit increases the chance for the
project team to uncover what has gone well and what needs to be dealt with as soon as possible
to successfully complete the project. Therefore, a deep understanding of the project and its
related subjects is a vital factor in implementing the project audit.
The first part of this chapter will focus on construction projects and related literature (i.e. project
process, function, life cycle, team, and organization). Also, project management knowledge will
be reviewed briefly. Furthermore, earned value technique and its importance to the project
during implementation will be checked as well. The second part highlights reviews of the project
audit with the concentration on construction projects. Some important models for project audit
and improvement will be reviewed from several aspects (i.e. having an understandable process,
scoring system, questionnaire) to find the advantages and disadvantages of each model.
Page 22
8
2.2. Fundamentals of the Project
A project is “a temporary endeavor undertaken to create a unique product, service, or result”
(PMBOK, 2012). According to Spinner (1997), a project has several distinguishing
characteristics, which are: 1) well-defined objectives; 2) specified product or result; 3) no
repetitive endeavour; and 4) limited sources to consume. There is a significant difference
between “project” and other similar words such as “operation.” They may seem similar because
both “project” and “operation” are performed by people, use limited resources, and need to be
planned, executed, and controlled.
However, according to the Michigan Office of Project Management, there are three specific
characteristics for every project: temporary, unique, and progressive elaboration. They are
temporary because every project has a finish time. They are unique because the product or
service of every project is different from those of others although they may have a similar
platform. Progressive elaboration integrates the two prior characteristics and means that the
project will be developed step by step and in detail (Woodward, 1997).
Construction projects not only meet the definition of projects but also contain a high degree of
risk related to time and cost. Although an oil and gas refinery project may have similar
engineering specifications and may need the same types of equipment, during the construction
phase, it has specific uncertainties about its constraints, time, cost, and quality. For example,
construction projects may require additional technology to install a specific unit (i.e. slug
catcher) that needs an additional contract, budget, and schedule (Woodward, 1997).
Moreover, because there is no way to make a prototype for a construction project, the project
design needs to be done in the initial step. Because a construction project always has one or more
deliverables, such as refinery, dam, highway, etc., the geographical location and the environment
of the project’s site must also be considered. In addition, due to the size, complexity, and type of
Page 23
9
construction projects, more than one group of individuals such as managers, engineers,
technicians, and workers, or more than one organization may be involved.
Project management is the art and skill of achieving project goals through the project
implementation while considering available resources and several constraints. Spinner (1997)
defines project management in this way: “managing and directing time, materials,
personnel/labor, and costs to complete a project in an orderly and economical manner and to
meet the established objectives of time, costs, and technical and/or service results”.
Spinner (1997) believes that a project needs three important tasks to be managed; planning,
scheduling, and controlling. Therefore, the main goals of managing a project are: 1) requirements
identification; 2) consideration of all stakeholders’ concerns and expectations during the project
planning and executing, to achieve project objectives; and 3) addressing project constraints such
as time, cost, quality, human resources, etc. (Woodward, 1997). Although knowledge areas such
as cost, time, quality, procurement, risk, scope, integration, communication, and human resource
are common among all types of projects, in construction projects there are some additional areas
which also need to be managed such as safety, claim, and environmental effects.
Project management is essential to monitor project constraints during the construction process.
For instance, when there is a need to reduce project time, the first reaction should be to increase
the project budget. If the project budget is limited, project scope may be affected and changed.
There are five main groups of processes for every project which can also be used for construction
projects: 1) Initiating; 2) Planning; 3) Executing; 4) Monitoring and Controlling; and 5) Closing
Process Groups as shown in figure 2.1.
Page 24
10
Figure 2.1: Process groups interact in a construction phase or project, Source: Construction Extension of PMBOK (2007)
These processes are sequential activities, but in most projects, especially construction projects,
they overlap. Each process has its own outcomes that affect later processes. For instance, when
basic design is finished, the client or project sponsor must approve the result and accept the
design documents.
2.2.1. Project Functions
A project function includes a set of tasks, concepts, and sometimes definitions making up the
project management field. These functions are mostly defined based on few factors: 1) project
type (i.e. construction, IT, research and development, etc.); 2) size (i.e. small, medium, or large),
and 3) complexity (i.e. simple or complex). However, project functions are relatively similar in
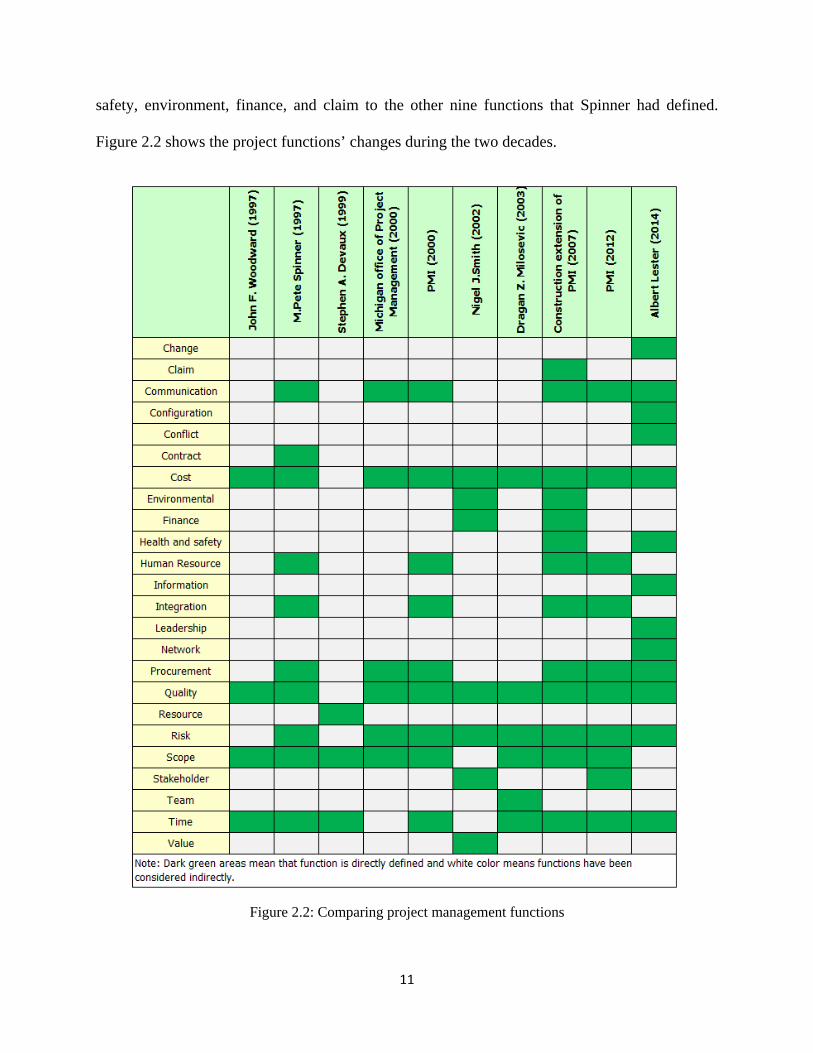
every project. Woodward (1997) defined cost, time, scope, and quality as project functions.
Spinner (1997) considered integration, risk, procurement, human resources, and communication
as project functions in addition to what Woodward already had defined. Three years later, in
2000, the Project Management Institute (PMI) published a guideline, Project Management Body
of Knowledge (PMBOK), in which a set of functions were defined as a standard for many
projects. Construction Extension of Project Management Body of Knowledge (2007) added
Page 25
11
safety, environment, finance, and claim to the other nine functions that Spinner had defined.
Figure 2.2 shows the project functions’ changes during the two decades.
Figure 2.2: Comparing project management functions
Page 26
12
2.2.2. Project Team Organization Form
Another aspect of the project that should be reviewed is organizational form of the project.
Organizational structure affects a project in two ways: 1) it has a strong effect on resource
availability (i.e. human resources); 2) it may influence project implementation approach
according to project management authority. There are three main groups of project
organizational structures in the project management literature; 1) functional; 2) matrix (weak,
balanced, and strong); and 3) projectized. Table 2.1 represents the difference in these groups
based on five project characteristics.
In the functional organization, staff members work in a specific group based on their speciality,
for example accounting, engineering, or construction, and each group may be divided into some
other detail categories such as electrical, process, or pipeline engineering, but they work
completely independently of each other. A matrix organization, which is classified as weak,
balanced, or strong has a combination of functional organization and project-oriented structure.
Table 2.1: Influence of organizational structures on projects, Source: PMBOK (2012)
Organizational Structure
Project Characteristics
Functional
Matrix
Projectized Weak Matrix
Balanced Matrix
Strong Matrix
Project Manager’s Authority
Little or None
Low Low to
Moderate Moderate to
High High to Almost
Total Resource
Availability Little or None
Low Low to
Moderate Moderate to
High High to Almost
Total Who manages the
project budget Functional Manager
Functional Manager
Mixed Project
Manager Project
Manager Project Manager's
Role Part time Part time Full Time Full Time Full Time
Project Management Administrative Staff
Part time Part time Part time Full Time Full Time
Page 27
13
A weak matrix organization is very similar to functional because it has most of the functional
characteristics. There is no real project manager, or project expediter. The project coordinator
has the authority to make decisions and he or she reports to a high-level manager. On the other
hand, a strong matrix organization is very similar to a projectized organization because it has
most project-oriented characteristics. As shown in Table 2.1, a projectized organization gives the
maximum authority to project managers and all resources are used to serve projects.
2.3. Construction Project Life cycle
According to Lester (2014), most construction projects pass through a different life cycle based
on the project type, complexity, and size. He divided this life cycle into eight main sequences as
following:
1. Concept: includes basic ideas, business case, statement of requirements, scope of the
project,
2. Feasibility: consists of tests for technical, commercial, and financial viability, technical
studies, and investment appraisal,
3. Evaluation: includes application for funds and stating risks,
4. Authorization: includes approvals of permits to start the project, all conditions, project,
5. Implementation: consists of design development, procurement, fabrication, installation, and
commissioning,
6. Completion: covers performance tests, handover to client, post-project appraisal,
7. Operation: includes revenue earning period, production, and maintenance of the project, and
8. Termination: includes close-down, decommissioning, and disposal of the project
Page 28
14
Construction projects, regardless of their size, type, or complexity, have four main periods in
their life cycle: 1) beginning the project, 2) arranging and setting up, 3) carrying out the project
work, and 4) finishing the project (Chou, 2012). First, the need to construct a new facility or
renovate/improve of an existing facility is determined by the owner. To determine what exactly
the project should be and clearly understand its viability and profitability, a basic and detail study
is conducted by designers. The study should include some input from the contractor if possible.
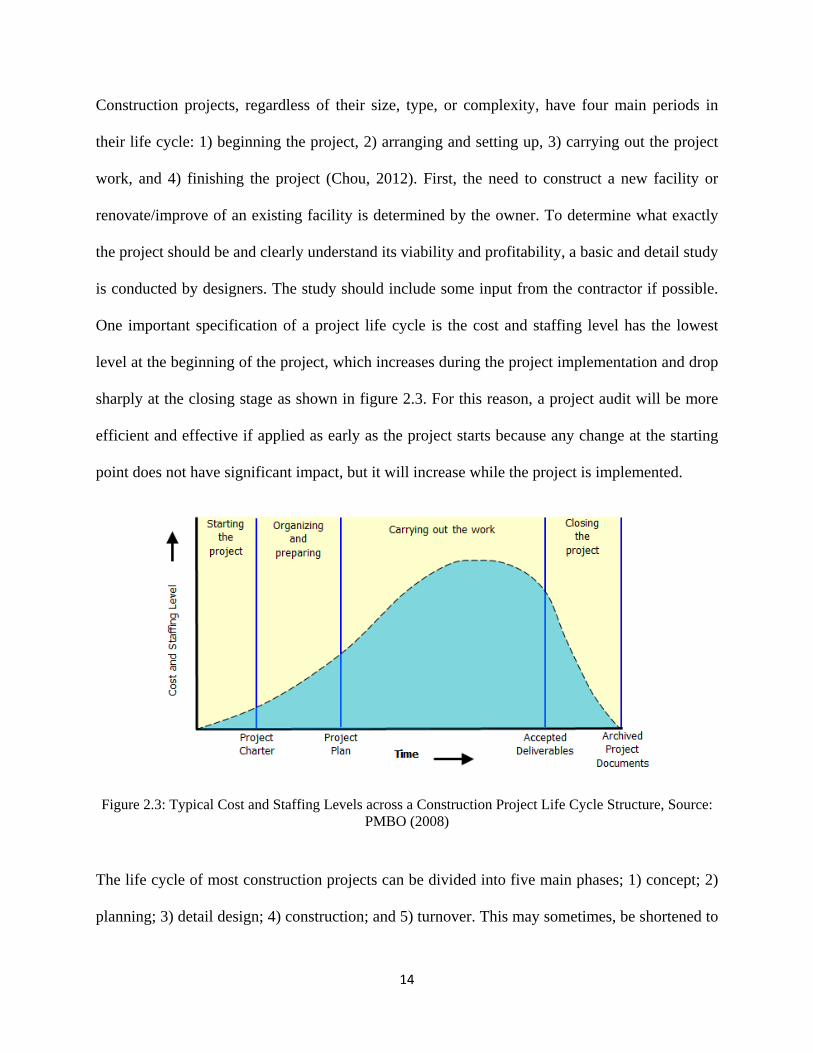
One important specification of a project life cycle is the cost and staffing level has the lowest
level at the beginning of the project, which increases during the project implementation and drop
sharply at the closing stage as shown in figure 2.3. For this reason, a project audit will be more
efficient and effective if applied as early as the project starts because any change at the starting
point does not have significant impact, but it will increase while the project is implemented.
Figure 2.3: Typical Cost and Staffing Levels across a Construction Project Life Cycle Structure, Source: PMBO (2008)
The life cycle of most construction projects can be divided into five main phases; 1) concept; 2)
planning; 3) detail design; 4) construction; and 5) turnover. This may sometimes, be shortened to
Page 29
15
four for some types of construction. In the first phase, concept, the project is defined by a
comprehensive feasibility study. Then, in the planning phase, more explanation and information
such as basic design, high level schedule and budget, high level project risks, etc. are provided.
Sometimes, the planning phase needs the involvement and approval of the owner. Next, in the
detail design, all specifications, equipment, and drawings are prepared. To start the construction
phase, it is not necessary to finish the detail design but basic design should be finished. Usually
construction starts a short time after the start of the detail design. It is because of the progressive
elaboration characteristic of construction projects. After finishing construction, the project
should be inspected, which may be followed by turnover to the owner. The number of phases is
not constant, it depends on the size and complexity of the project and it can be of any number but
each phase needs different time and effort.
There is a big difference between phases and processes of a project. According to ISO10006 “A
project may be divided into interdependent processes and into phases as a means of planning and
monitoring the realization of objectives and assessing the related risks”. Project processes are
important and necessary for two aspects; managing the project and realize the project’s product.
Project phases, has other duties, which is dividing the project life cycle into two or more
manageable parts such as conception, detail, and development.
2.4. Project Audit
Although the trend of project management in construction projects is growing, the purpose of
using project management in many projects is still as document management or knowledge
management (Chou and Yang, 2012). However, ineffective project management not only lead to
waste in resources (time and cost) but also in many cases it causes project failure. Bassioni et al,
Page 30
16
(2004) have suggested that reasons for project failure should be translated into quantitative
measurements that can define a corrective action for those failures. In other words, in today’s
competitive environment, project-oriented organizations cannot focus only on project KPIs to be
sure their project is going the right way. Therefore, in the past decade, some related research has
been conducted where a model for assessing and correcting construction project health was
introduced by Mian et al, (2004); the Project Health Check (PHC) was introduced by Jaafari
(2007), and an analysis of project performance methodologies by Nalewaik and Millsb (2014).
Since 1993, the Taiwan government has enforced public construction projects to have three-
levels of quality management systems to improve the quality of the projects (Wang and Kong,
2012)
According to the National Institute for Further Education of Netherlands (2010), the project audit
is “the process of verification of the extent to which the project realisation complied with the
rules and principles of project management for the specific project. The project audit has many
goals, one of which is to inspect and evaluate the current situation of the project. It also helps the
team to find if the project complies with all the defined criteria or not. Moreover, the project
audit identifies the points of strength and points of weakness in the project and whether it is
moving toward success or not. Furthermore, project issues, challenges, and concerns, which
usually happen during project execution, are uncovered by conducting a project audit. It is
worthwhile for the project team, manager, and other stakeholders to spend time considering what
has gone well in the project and which parts need to be improved to complete the project
successfully. If done at the final part of the project, the audit results and experiences will be
useful for future projects. This especially helps the project team to avoid repeating mistakes on
future projects.
Page 31
17
According to Ruskin and Estes (1984) project failure is mostly because of problems in the
planning and executing processes which are not corrected. Sometimes, project teams do not
notice these problems, or there is no time to fix them. Project audit can truly identify and address
these issues. In other words, the chance of project failure is reduced by an on-time project audit.
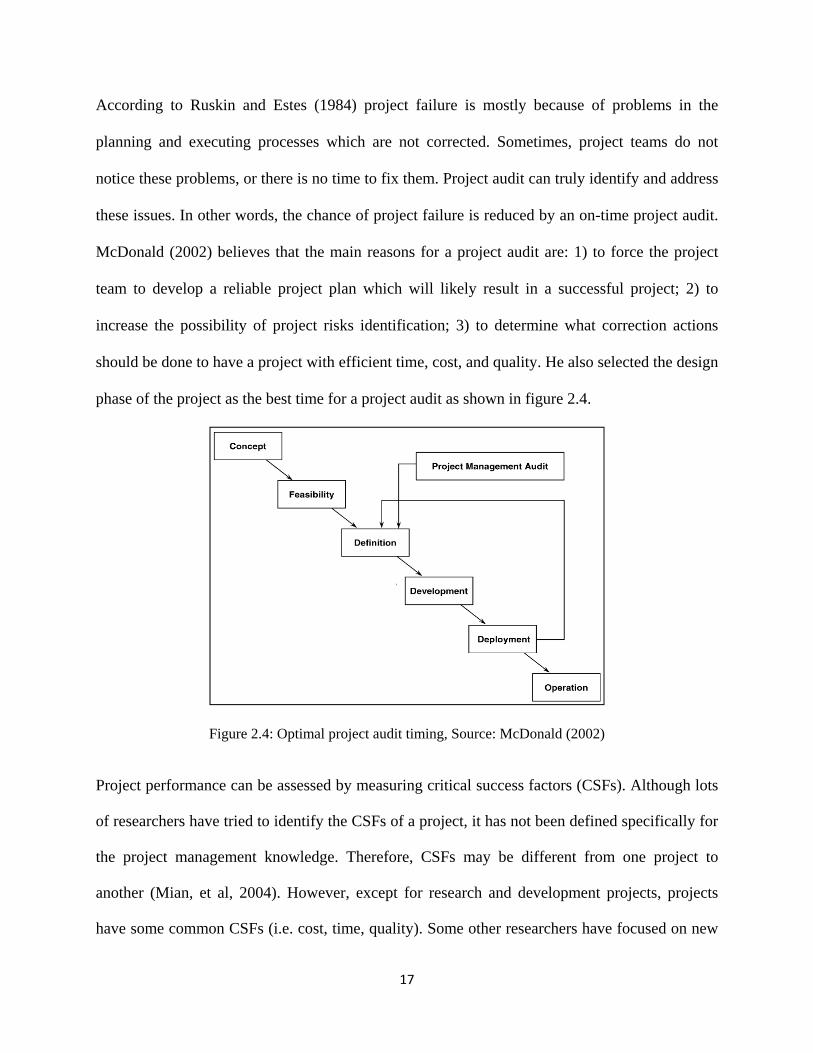
McDonald (2002) believes that the main reasons for a project audit are: 1) to force the project
team to develop a reliable project plan which will likely result in a successful project; 2) to
increase the possibility of project risks identification; 3) to determine what correction actions
should be done to have a project with efficient time, cost, and quality. He also selected the design
phase of the project as the best time for a project audit as shown in figure 2.4.
Figure 2.4: Optimal project audit timing, Source: McDonald (2002)
Project performance can be assessed by measuring critical success factors (CSFs). Although lots
of researchers have tried to identify the CSFs of a project, it has not been defined specifically for
the project management knowledge. Therefore, CSFs may be different from one project to
another (Mian, et al, 2004). However, except for research and development projects, projects
have some common CSFs (i.e. cost, time, quality). Some other researchers have focused on new
Page 32
18
types of CSFs (i.e. productivity, contract disputes, and procurement strategy). Past work by
Young and Poon (2013) identifies success factors specifically for the construction process.
Regardless of when the audit is conducted, either in the middle or at the end of the project, audit
processes are similar. It is important that a third party, who is a specialist in project management,
conducts the project audit. There might be several interviews during a complete audit process
that provide the opportunities to the project team to express their opinions and points of view
about what has been done in the project. Usually, the process of a project audit consists of the
following phases; 1) Development of project success factors; 2) Development of a questionnaire;
3) In-depth investigation; 4) Final report (Bates and Coles, 2012).
First, appropriate success criteria for the project need to be defined. This is usually completed
with the collaboration of all stakeholders because the success criteria are extracted from
stakeholders’ expectations. Next, a questionnaire is developed by the auditors. Questionnaires
could be sent to the team directly or they could be answered through interviews. In a complete
project audit both methods are used. Then, one or more project site-visits are planned to gain
detail information about the project. Also, all project historical data and documents such as the
Project Plan, Milestone Report, Team Structure, Business Requirements, Meeting Minutes, Issue
Logs, Change Logs, etc., need to be reviewed. Finally, all collected information from interviews,
individuals who completed the questionnaire, project documentation review, review of the
project quality management, issues, concerns, and challenges, and also the site-visit, are
gathered, analysed, and reported.
2.5. Project Audit Success Factors
Although varieties of researches have been conducted, there is no common consensus on a
project audit success factors. Different people consider different factors to assess the project
Page 33
19
audit success factors. It is commonly known that delivering what the owner wants out of the
project is to be on budget, on time, and with defined quality could be considered project success.
Although these are real success factors for every project, there are some other factors and ways
to achieve a successful outcome; 1) achieving the project's objectives; 2) completing the project
with an agreed budget; 3) delivering the project on time; 4) delivering the project with required
quality; 5) satisfying stakeholders (i.e. owner, vendor, supplier); and 6) providing value added
for all stakeholders. For example, one stakeholder may sacrifice quality for a quicker delivery,
and another may want to extend the project time and cost by adding in a new scope to the project
work. In both cases, satisfying stakeholders’ expectations mean project success although the
project is completed over budget and over time. The reality is that only 34% of projects are
delivered on time and on budget. Jaafari (2007) believes that project success is influenced by
three factors; 1) project resources; 2) capability and managerial approach; and 3) commercial and
physical environment. Marques et al (2010) advocate that the risk assessment report is a main
part of every project performance measurement system. They believe it is not possible to create a
unique and complete checklist for the project assessment that can be used in every project.
According to Takim and Akintoye (2002), performance is a contribution of performing a task in
order to completing the construction project. Therefore, to determine a construction project
performance, all tasks should be measured, analyzed, and prioritised.
2.6. Project Maturity
One factor that is indirectly determined and measured in a project audit is project maturity. The
level of maturity can be extracted from the score of all success factors. Project maturity is
defined as those capabilities that produce repeatable success in project management.
Page 34
20
Kwak and Ibbs (2000) believe that project maturity is the sophistication level of an
organisation’s current project management practices and processes. Moreover, Bolles (2002)
mentions that the current level of project management knowledge and skills in an organisation is
project management maturity. In the definition of Kerzner (2004) “Maturity in project
management is the implementation of a standard methodology and accompanying processes such
that there is a high likelihood of repeated successes”. Albrecht and Spang (2014) believe that
most of project management maturity models have a similar structure with five level of maturity
for a project and each level has its specific requirements to be satisfied.
The appropriate level of maturity will vary for each organization based on specific goals,
strategies, resource capabilities, scope, and needs. Furthermore, project maturity translates
organizational strategy into success and provides a roadmap for strategic improvement. It allows
another way for organizations to find their strengths and weaknesses and enables them to set
achievable targets for improvement.
2.7. Project Audit and Improvement Models
In this section, different project audit and improvement models are reviewed. This review enables us
to identify the advantages and disadvantages of all 11 models that will be considered in developing
the proposed project audit model.
2.7.1. Portfolio, Programme & Project Management Maturity Model (P3M3)
This model has been provided by the Office of Government Commerce (OGC) of the UK, which
has conducted lots of research in the field of project management. The P3M3 is based on the
Capability Maturity Model Integrated (CMMI) of Carnegie Mellon University and uses a similar
approach. Initially, between 1986 and 1991, the Software Engineering Institute (SEI) of Carnegie
Mellon University designed a primitive version of the model. Later, because of its weaknesses,
Page 35
21
researchers improved it as the P3M3, which is considered as a guideline and a list of instructions
for project management, program management, and portfolio management.
The P3M3 model uses critical process areas that contribute to achieving project success. The
P3M3 recognizes activities that need to be carried out in project and program levels and also
within the organization that is responsible to implement them (UK Office of Government
Commerce, 2006).
The P3M3 can be used for any type of organization (i.e. public, private, consultant, and training)
because this model does not focus on a specific industry. However, it seems that this model is
more compatible with UK industries. According to this model, project-oriented organizations
need a set of critical project requirements and they are divided into two groups: Mature and
Immature. In a mature organization, there are appropriate and sufficient standard procedures and
instructions to keep the project on schedule and on budget with a high quality. Managers monitor
and control project progress against the project plan and always consider stakeholders’
satisfaction.
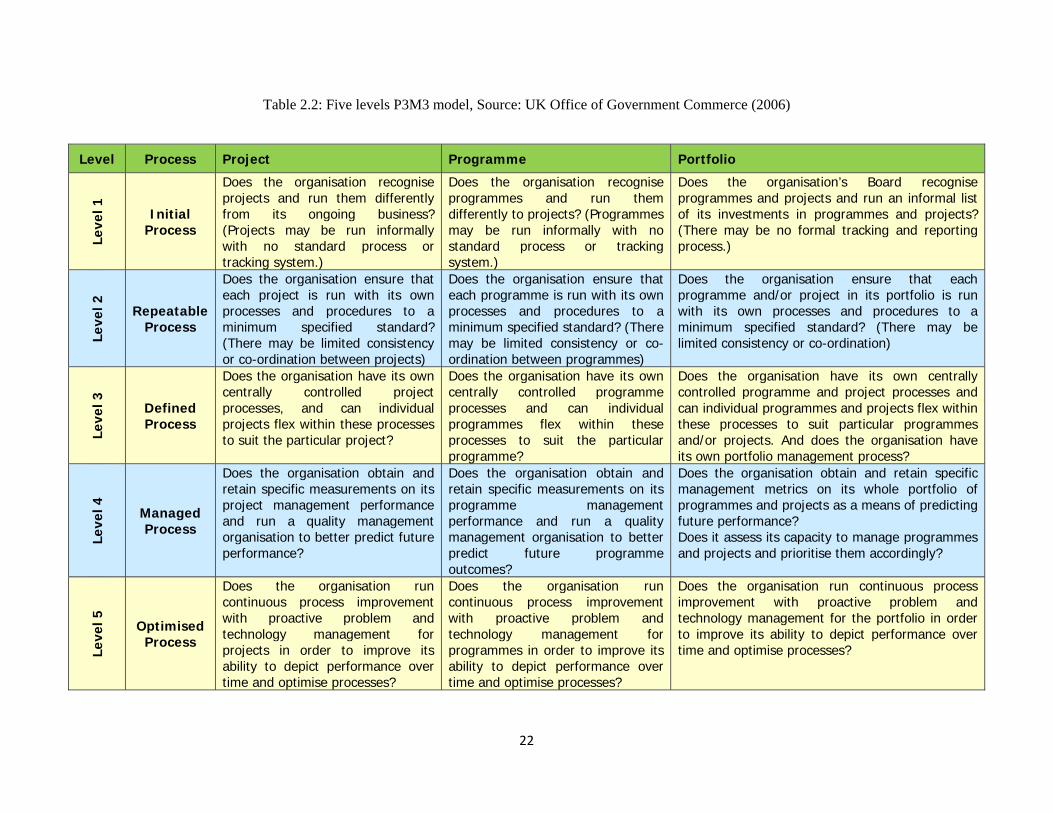
As shown in Table 2.2, P3M3 has five levels of maturity: 1) initial process; 2) repeatable
process; 3) defined process; 4) managed process; and 5) optimised process. These levels can be
considered in developing the proposed project audit model. Table 2.2 present a brief description
of these five levels for project, programme, and portfolio maturity.
Page 36
22
Table 2.2: Five levels P3M3 model, Source: UK Office of Government Commerce (2006)
Level Process Project Programme Portfolio
Leve
l 1
Initial Process
Does the organisation recognise projects and run them differently from its ongoing business? (Projects may be run informally with no standard process or tracking system.)
Does the organisation recognise programmes and run them differently to projects? (Programmes may be run informally with no standard process or tracking system.)
Does the organisation’s Board recognise programmes and projects and run an informal list of its investments in programmes and projects? (There may be no formal tracking and reporting process.)
Leve
l 2
Repeatable Process
Does the organisation ensure that each project is run with its own processes and procedures to a minimum specified standard? (There may be limited consistency or co-ordination between projects)
Does the organisation ensure that each programme is run with its own processes and procedures to a minimum specified standard? (There may be limited consistency or co-ordination between programmes)
Does the organisation ensure that each programme and/or project in its portfolio is run with its own processes and procedures to a minimum specified standard? (There may be limited consistency or co-ordination)
Leve
l 3
Defined Process
Does the organisation have its own centrally controlled project processes, and can individual projects flex within these processes to suit the particular project?
Does the organisation have its own centrally controlled programme processes and can individual programmes flex within these processes to suit the particular programme?
Does the organisation have its own centrally controlled programme and project processes and can individual programmes and projects flex within these processes to suit particular programmes and/or projects. And does the organisation have its own portfolio management process?
Leve
l 4
Managed Process
Does the organisation obtain and retain specific measurements on its project management performance and run a quality management organisation to better predict future performance?
Does the organisation obtain and retain specific measurements on its programme management performance and run a quality management organisation to better predict future programme outcomes?
Does the organisation obtain and retain specific management metrics on its whole portfolio of programmes and projects as a means of predicting future performance? Does it assess its capacity to manage programmes and projects and prioritise them accordingly?
Leve
l 5
Optimised Process
Does the organisation run continuous process improvement with proactive problem and technology management for projects in order to improve its ability to depict performance over time and optimise processes?
Does the organisation run continuous process improvement with proactive problem and technology management for programmes in order to improve its ability to depict performance over time and optimise processes?
Does the organisation run continuous process improvement with proactive problem and technology management for the portfolio in order to improve its ability to depict performance over time and optimise processes?
Page 37
23
The P3M3 defines related activities for the programme and project through different key process
areas in each level. The structure of these process areas consists of functional
achievement/process goals, approach, deployment, review, perception, and performance
measures (UK Office of Government Commerce, 2006).
2.7.2. Prince2 Maturity Model (P2MM)
Another model developed by the UK Office of Government Commerce (OGC) is the Prince2
Maturity Model (P2MM). This model provides a framework that can access projects which their
project management method is Prince2. Because P2MM is derived from P3M3, they have similar
structure in managing projects. It has five levels for organizational maturity and seven processes
that cover project management aspects (Williams, 2013). The five Maturity Levels are; 1) Level
1 – awareness of process; 2) Level 2 – repeatable process; 3) Level 3 – defined process; 4) Level
4 – managed process; and 5) Level 5 – optimized process. Also, seven processes that P2MM
focuses on are; 1) management control; 2) benefits management; 3) financial management; 4)
stakeholder engagement; 5) risk management; 6) organizational governance; and 7) resource
management. With using P2MM, project oriented organizations can justify investment in project
management improvements and recognise their strengths and weaknesses in order to enable
those improvements.
Organizations use the P2MM assessment method, which is only conducted by an Accredited
Consulting Organizations (ACO) and led by a qualified consultant who already has been trained
to do the assessment process. During the assessment they look for KPAs through structured
interviews. The numbers of people who are interviewed depend on the size and complexity of the
project and organization (Murray, 2006). In this model, organizations plan to improve their level
of maturity in project management during the projects implementation and they can track their
Page 38
24
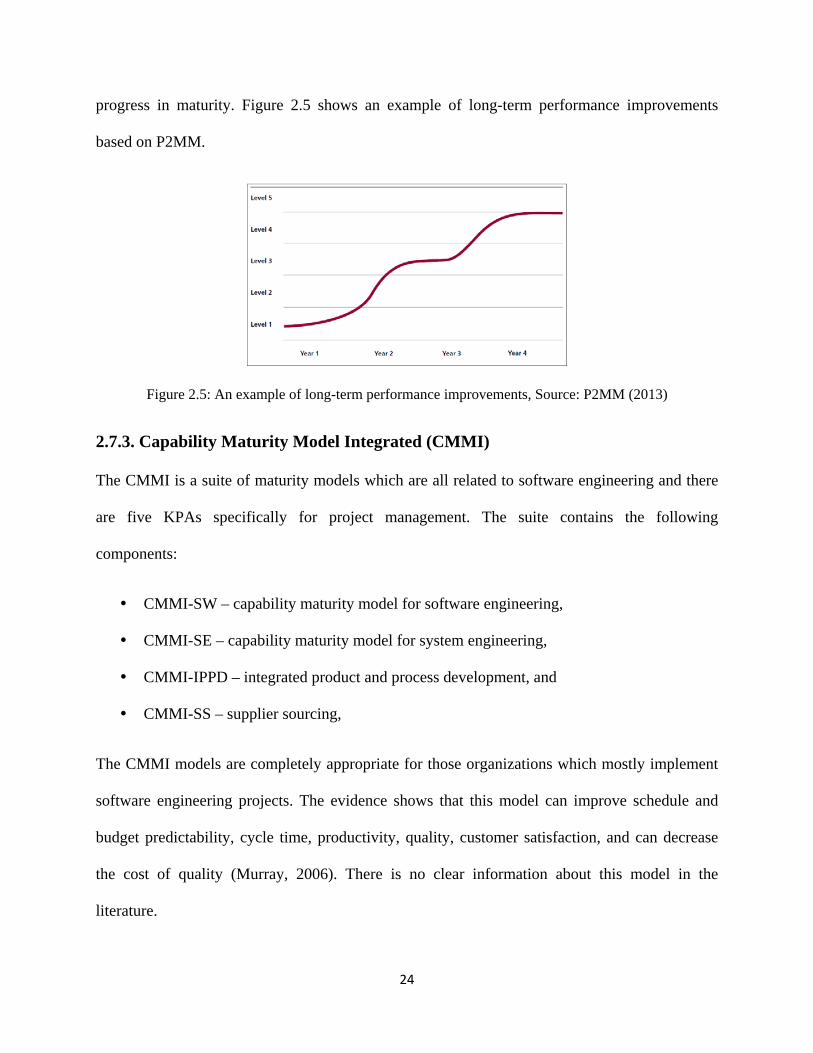
progress in maturity. Figure 2.5 shows an example of long-term performance improvements
based on P2MM.
Figure 2.5: An example of long-term performance improvements, Source: P2MM (2013)
2.7.3. Capability Maturity Model Integrated (CMMI)
The CMMI is a suite of maturity models which are all related to software engineering and there
are five KPAs specifically for project management. The suite contains the following
components:
CMMI-SW – capability maturity model for software engineering,
CMMI-SE – capability maturity model for system engineering,
CMMI-IPPD – integrated product and process development, and
CMMI-SS – supplier sourcing,
The CMMI models are completely appropriate for those organizations which mostly implement
software engineering projects. The evidence shows that this model can improve schedule and
budget predictability, cycle time, productivity, quality, customer satisfaction, and can decrease
the cost of quality (Murray, 2006). There is no clear information about this model in the
literature.
Page 39
25
2.7.4. Kerzner Project Management Maturity Model (KPM3)
Dr. Harold Kerzner, developed a model named the Kerzner Project Management Maturity Model
(KPM3) in 2001. This model helps project-oriented organizations to achieve a new level of
project management excellence and improve its capabilities. Kerzner (2001) believes that this
model can describe an appropriate way to achieve excellence in project management on those
five levels. Each level represents a required degree of maturity in project management. Figure
2.6 shows the five levels of KPM3.
Figure 2.6: The five levels of KPM3, Source: Strategic Planning for Project Management (2001)
By reviewing these levels, only one advantage is identified: they represent organized steps that a
project oriented company needs to follow to be successful in its project processes and functions.
It would be a good practice to include this advantage in the model that will be developed in this
research. As shown in Figure 2.6, there are five levels for maturity and each level represents a
specific capability as following:
Level 1- Common Language: Importance and basic knowledge of project management
are fully understood in this level. Also, common language and terminology is defined.
Page 40
26
Level 2- Common Processes: Definition and development of common project
management processes are the main outcomes of this level. For example, a successful
approach in one project can be helpful for another. Also, additional information such as
application and support of the project management principles may need to be provided.
Level 3- Singular Methodology: In this level, the organization puts project management
methodology in the center of all other methodologies which are being used. Combining
these methodologies to take advantage of their synergistic effect is the main objective.
Level 4- Benchmarking: The goal of this level is to provide a competitive advantage
environment for the company to continuously improve processes. It is important to
understand whom and what should be benchmarked.
Level 5- Continuous Improvement: All information obtained through benchmarking is
evaluated in this level. A decision should be made whether this information can enhance
project management methodology used by the organization or not.
2.7.5. Project Management Process Improvement
Wysocki (2004) developed a model that was published by Artech House publisher. Although the
author did not mention a specific industry for his model, it seems that the model is mostly
compatible with information technology projects. The model presents ten criteria to project
success: 1) executive support; 2) user involvement; 3) experienced project manager; 4) Clear
business objectives; 5) minimized scope; 6) standard software infrastructure; 7) firm basic
requirements; 8) formal methodology; 9) reliable estimates; 10) skilled staff.
Seven of these criteria are related to the process where the other three of them, which are not the
interest of this research, executive support, experienced project manager, and skilled staff, are
specifically about the project team members, and the relation between the project objectives and
Page 41
27
the organization’s goals. The model was designed based on two project management standards;
1) OPM3 and 2) PMBOK. Also, this model considers five maturity levels for projects; 1) initial
process; 2) structured process; 3) institutionalized process; 4) managed process; and 5)
optimizing process
All other maturity levels assess both the process definitions (PD) and Process Practice (PP) in the
organization and its projects. In this way, project team can evaluate only a single process for
either PD or PP maturity or both (Wysocki, 2004). He believes that “PD is the documented and
standardized processes that drive all project management activity in the organization. The
second, and more difficult step, is the adoption of the project management processes. This will
be measured by PP. Project managers, especially those who come from other organizations, will
bring their own approaches to project management”. This model has a complicated process for
audit, which is a disadvantage for it.
2.7.6. ISO 10006:2003 Standard for Project Management
ISO 10006 provides guideline specifically applicable in quality management in projects. This
standard can be used in all type of projects simple to complex, small to large, short to long
duration, soft product such as IT projects to physical product such as oil and gas projects.
However, it is very important to tailor the standard before implementation. This model has four
main clauses; 1) management responsibility that consists of strategic process; 2) resource
management that consists of resource-related and personnel-related processes; 3) product
realization that consists of interdependency, scope, time, cost, communication, risk, and
purchasing processes; 4) measurement, analysis, and improvement that consist of improvement,
measurement, and continuous improvement processes. ISO 10006 has not been developed for
managing a project, but it is a very useful guideline for quality in project management processes.
Page 42
28
According to the Bureau of Indian Standards (2003), ISO 10006 is an application that provides
guideline for quality management in any type of project with different complexity, size, and
duration. This model has a specific definition for a project: “unique process, consisting of a set of
coordinated and controlled activities with start and finish dates, undertaken to achieve an
objective conforming to specific requirements, including the constraints of time, cost and
resources (ISO 10006)”. Therefore, ISO10006 can be applied along with a project management
methodology and it provides a set of important requirement for project management quality.
2.7.7. Roland Gareis Model
The basis of Roland’s model is analysing the organisational competencies in the project-oriented
organizations. These competencies consist of strategies, structures, and cultures of project
management that project-oriented organizations use. In 2005, a research was conducted by
Project Management Group of Vienna by which they analysed organisational competencies of a
project-oriented company by applying Roland’s model.
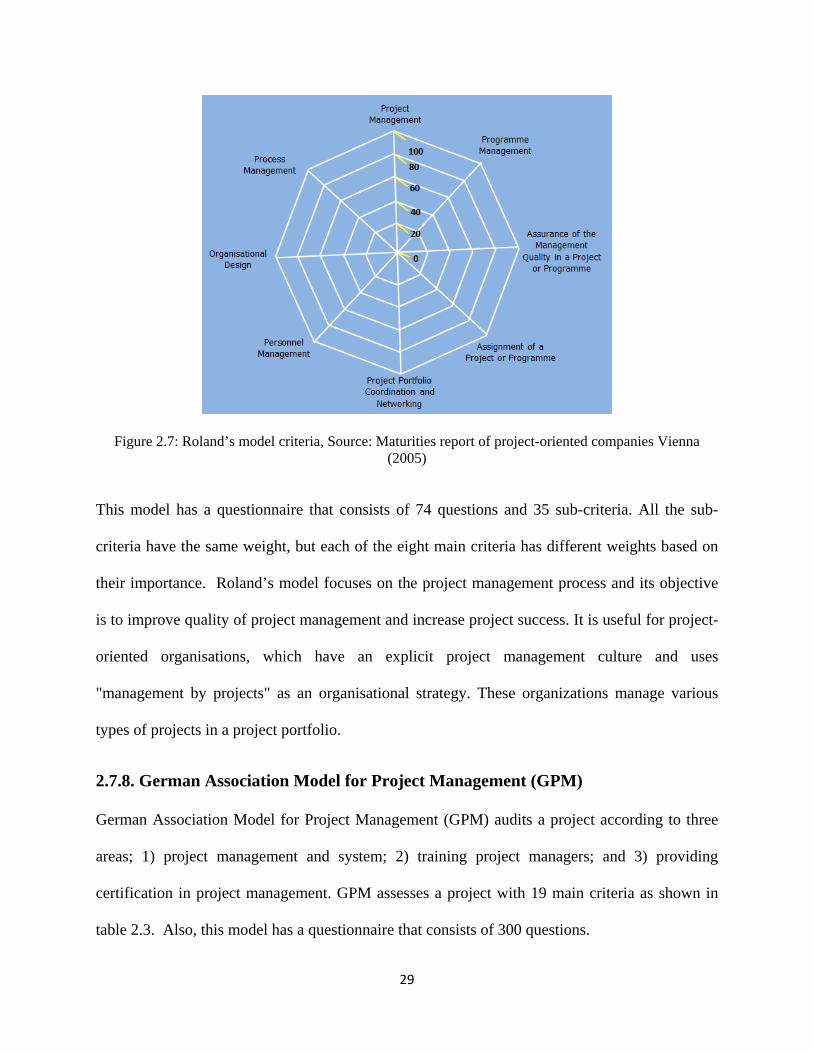
The model is based on eight important criteria; 1) project management; 2) programme
management; 3) assurance of the management quality in a project or programme; 4) assignment
of a project or programme; 5) project portfolio coordination and networking; 6) organisational
design; 7) personnel management; and 8) process management. Each criterion has a score
between 0 and 100 as shown figure 2.7.
Page 43
29
Figure 2.7: Roland’s model criteria, Source: Maturities report of project-oriented companies Vienna (2005)
This model has a questionnaire that consists of 74 questions and 35 sub-criteria. All the sub-
criteria have the same weight, but each of the eight main criteria has different weights based on
their importance. Roland’s model focuses on the project management process and its objective
is to improve quality of project management and increase project success. It is useful for project-
oriented organisations, which have an explicit project management culture and uses
"management by projects" as an organisational strategy. These organizations manage various
types of projects in a project portfolio.
2.7.8. German Association Model for Project Management (GPM)
German Association Model for Project Management (GPM) audits a project according to three
areas; 1) project management and system; 2) training project managers; and 3) providing
certification in project management. GPM assesses a project with 19 main criteria as shown in
table 2.3. Also, this model has a questionnaire that consists of 300 questions.
Page 44
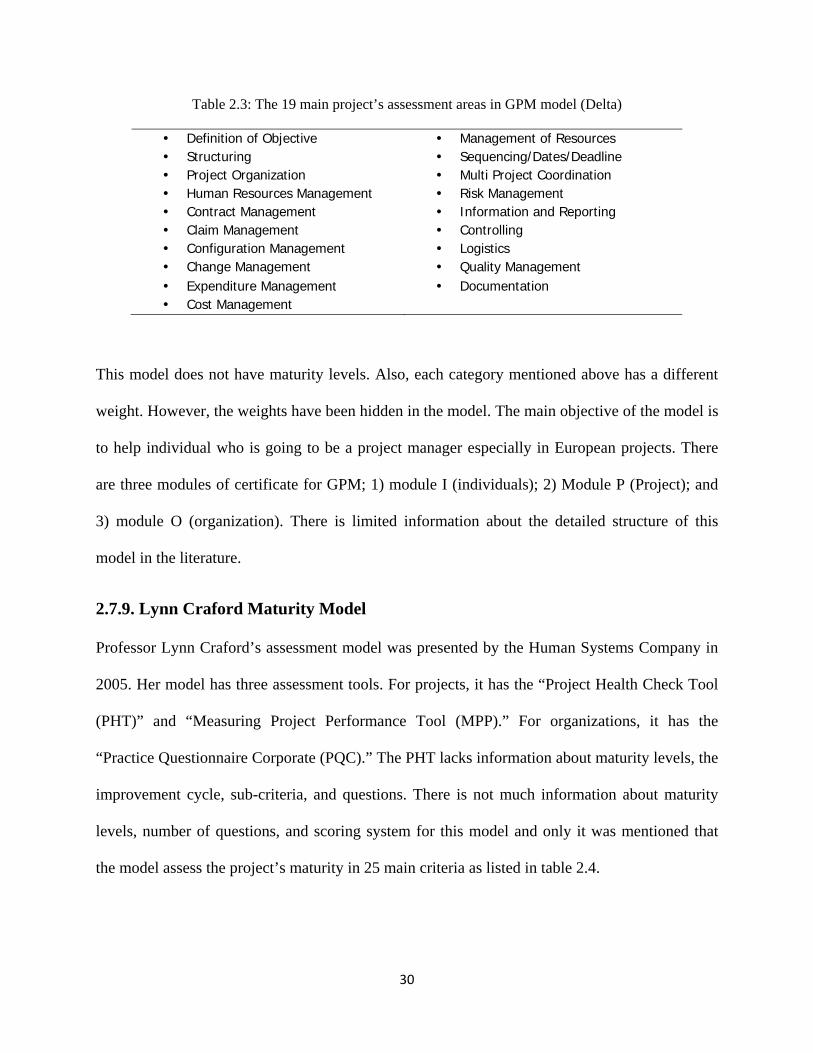
30
Table 2.3: The 19 main project’s assessment areas in GPM model (Delta)
Definition of Objective Management of Resources Structuring Sequencing/Dates/Deadline Project Organization Multi Project Coordination Human Resources Management Risk Management Contract Management Information and Reporting Claim Management Controlling Configuration Management Logistics Change Management Quality Management Expenditure Management Documentation Cost Management
This model does not have maturity levels. Also, each category mentioned above has a different
weight. However, the weights have been hidden in the model. The main objective of the model is
to help individual who is going to be a project manager especially in European projects. There
are three modules of certificate for GPM; 1) module I (individuals); 2) Module P (Project); and
3) module O (organization). There is limited information about the detailed structure of this
model in the literature.
2.7.9. Lynn Craford Maturity Model
Professor Lynn Craford’s assessment model was presented by the Human Systems Company in
2005. Her model has three assessment tools. For projects, it has the “Project Health Check Tool
(PHT)” and “Measuring Project Performance Tool (MPP).” For organizations, it has the
“Practice Questionnaire Corporate (PQC).” The PHT lacks information about maturity levels, the
improvement cycle, sub-criteria, and questions. There is not much information about maturity
levels, number of questions, and scoring system for this model and only it was mentioned that
the model assess the project’s maturity in 25 main criteria as listed in table 2.4.
Page 45
There are
2) projec
there are
measurin
the best.
largely; a
2.7.10. P
The Proj
by Rolan
based on
Human R
Communi
Planning
Control
Requirem
Risk Plann
Cost Plan
Resource
Culture
e two groups
ct’s process.
e six possib
ng; and 6) v
For project’
and 4) fully w
Project Exc
ect Excellen
nd Ottmann
n the Europea
- Not at A- Commit- Active - Perform- Measur
Figu
Table 2.4:
Resource
ication
ments
ning
ning
Planning
s of question
As shown in
ble answers;
erifying, wh
s process qu
where “none
cellence M
nce Model (P
at the Germ
an Foundatio
All tted
ming ring
ure 2.8: Lynn
Lynn Craford
Cost Cont
Quality Co
Resource
Time Con
Relation w
Project Sc
Rule and
Communi
Quality Pl
ns in Lynn C
n figure 2.8,
; 1) not at
here “not at
uestions, ther
e” represents
odel (PEM
PEM) is a sy
man Associat
on for Quali
Project'sProduct
Craford’s ma
31
d maturity mo
trol
ontrol
Control
ntrol
with Owner
chedule Succe
Responsibility
ication Succes
lanning
Craford’s ass
to answer t
all; 2) com
all” represe
re are four p
s the worst a
M)
ystem to rank
ion for Proje
ity Managem
s
Questions
aturity model
odel project c
Tim
Cha
Tea
Pro
Com
ess Per
y Cap
ss
sessment mo
the questions
mmitted; 3)
ents the wors
possible answ
and “fully” re
k projects. P
ect Managem
ment (EFQM
Project's Process
types of ques
criteria
me Planning
ange Control
am Work
oject Performa
mpetency
rformance Suc
pability Impro
odel; 1) proj
s related to p
active ; 4)
st and “verif
wers; 1) non
epresents the
PEM was est
ment (GPM)
M) model. Th
- N- P- L
F
stions and ans
ance
ccess
ovement
ect’s produc
project’s pro
) performin
fying” repre
ne; 2) partial
e best.
tablished in
) and it is m
he model ha
None Partially argely
ll
swers
ct and
oduct,
ng; 5)
esents
ly; 3)
1997
mostly
s two
Page 46
32
main objectives; 1) evaluation of the project management process and 2) measurement of the
results achieved in a project. Two institutes, GPM and International Project Excellence Award
(IPMA), designed an award system named the Project Excellence Awards by using the model.
As shown in figure 2.9, PEM has two main criteria for project audit; 1) project management and
2) project results. Project management has five sub criteria; 1) project objectives; 2) leaderships;
3) people; 4) resources; and 5) processes. Project results has four sub criteria; 1) customer
results; 2) people results; 3) results of other parties involved; and 4) key performance and project
results.
Figure 2.9: Project Excellence Model (PEM) criteria and sub-criteria, Source: Möller (2005)
PEM’s sub-criteria have the following definitions:
Project Objectives: The way that the project defines, develops, controls, and realises its
objectives according to information about the demands of all involved parties.
Leadership: How project managers move toward “Project Excellence.”
Page 47
33
People: Project team members approached to be involved in the project.
Resources: Effective and efficient approach to the use of project resources.
Processes: The way that projects’ processes are defined, implemented, and controlled.
Customer Results: Customer expectations and satisfaction management.
People Satisfaction: Project team members’ expectations and satisfaction management.
Results of other Parties involved: Stakeholders’ expectations and satisfaction
management.
Key Performance and Project Results: Project achievements and performance.
The philosophy of PEM originates in a quality management model, Total Quality Management
(TQM) in which teams try to find strong and weak points of the project. As shown in figure 2.10,
PEM divides a project into two main parts; 1) project management (total 500 scores) and 2)
project results (total 500 scores).
Figure 2.10: Project Excellence Model (PEM) scores, Source: IPMA International Project Excellence Award (2008)
Final score of the project assessment with PEM is computed by project management score plus
project results score. For example, if a project achieves 410 scores in project criteria and 360
score in project results criteria, the total score for this project is 770. There is a comprehensive
Page 48
34
questionnaire for this model and only trained auditors are allowed to audit projects based on this
model. The following steps should be followed to audit a project with PEM:
Step 1: Sending a request letter to the International Project Excellence Award for being audited
Step 2: Project audit by a four-member group of trained auditors
Each member audits the project based on his or her point of view
Consensus on the results
Reporting the assessment result
Step 3: Project site visit (if needed)
Step 4: Final project assessment report
Step 5: Participation in the award competition
2.7.11. Organizational Project Maturity Model (OPM3)
The Organizational Project Management Maturity Model (OPM3) was designed by PMI in 2003.
It is a self-assessment project audit model. This model was developed for project-oriented
organizations and it assesses them in three levels: 1) project, 2) program, and 3) portfolio. In
other word, the OPM3 framework provides an overview of an organization’s maturity level of
portfolio, program, and project (OPM3, 2008). This model considers everything from the lowest
level of a strategic plan which is a project to the highest level which is portfolio. As shown in
figure 2.11 OPM3 consists of the three important elements that are connected together; 1)
knowledge; 2) assessment; and 3) improvement.
Page 49
35
Figure 2.11: three elements of the OPM3, Source: OPM3 (2008)
The structure of OPM3 consists of four components: 1) best practices which consist of 600
recognized approaches that an organization can follow to achieve its projects goals; 2)
capabilities that include all steps to achieve a project maturity level; 3) outcomes that consist of
results of applying a capability; and 4) KPIs that provide qualitative and quantitative criteria to
assess an outcome.
As shown in figure 2.12 each best practice has one or more project management capabilities.
When all capabilities achieved, the best practice is attained. Capabilities also need one or more
outcomes to be satisfied. OPM3 uses KPI to determine, quantitatively or qualitatively, whether
the outcome exists or the degree to which it exists.
Page 50
36
Figure 2.12: Best practice, capability, outcome, and KPI in OPM3 model, Source: OPM3 (2008)
There are four maturity levels in OPM3; 1) standardization; 2) measuring; 3) controlling; and 4)
continuous improvement. Also, OPM3 has a questionnaire that contains 151 questions for project
audit self-assessment. But the scoring system has been hidden in its software.
2.8. Summary
This chapter reviewed the most important aspects of a project (i.e. process, function, and
performance) and project audit and improvement models and methodologies. Discussing the
details of these models is out of scope of our research. Also, there are some limitations of
accessing related information to some models. The main objective of reviewing these models is
to find their advantages and disadvantages so it will be considered in the model proposed in this
research. Before doing the project audit the following questions should be answered by whoever
has asked for the audit, most of the time, the project sponsor:
1. What is the purpose of this audit: The purpose of a project audit is a key factor that has an
impact on the results. Usually, the main reason for a project audit is to determine if the
Page 51
37
project is on-track or not. If the answer is yes, what should be done to keep it on-track?
What will be the future challenges? And if not, what should be done to fix the situation
and bring the project on-track or sometimes cancel it?
2. What is the scope of this project audit: A project audit can be quick or comprehensive. It
is important to know which area of the project needs to be audited--processes, functions,
or performance--to select an appropriate approach.
3. When is the best time to do the audit: It should be considered that the project audit is not
only when the project is in trouble or the client/customer complaints. Sometimes, when a
key team member, especially the project manager is changed, a project audit is needed.
Also, as mentioned earlier, post-project review is very important to have successful future
projects.
4. Who is qualified to be a project auditor: Different people can audit a project such as a
PMP certified person, a project manager, a third party construction company, architect,
etc. It depends on the two previous questions: what is the purpose of the audit and what
should be covered.
To do the project audit, the following steps should be clearly done:
Having an agreement with key stakeholders especially the project sponsor, owner, and
project manager
Having a detail plan and schedule for the audit to know when it will start and finish. Who
is responsible for the audit report? What documents should be provided? What is the
level of access to project information? etc.
Having an appropriate questionnaire and scoring model because there are many questions
that can be asked in a project audit
Page 52
38
Having a commitment to implementing the audit as planned and collecting high-quality
information
Reviewing all historical and current documentation related to the project that has valuable
information and can indirectly answer questions. For instance, the project charter, scope
statement, project plan, risk logs, change logs, meeting minutes, WBS, project
organizational chart, etc.
Having an effective audit report and presentation
Page 53
39
Chapter Three
Methodology
3.1. Introduction
This chapter explains the proposed methodology to be used to develop and implement an
integrated model for auditing construction projects. The proposed model covers necessary
processes and functions that should be audited in a project and includes all related questions.
Therefore, before developing the proposed model, the reviewed project audit and improvement
models should be analyzed to determine their advantages and disadvantages. Furthermore, in this
research, project performance is measured based on the Earned Value method.
3.2. Analysing project audit and improvement models
After reviewing the project audit and improvement models in chapter two, these will be
analysed. This analysis is divided into two parts; 1) identifying the advantages and disadvantages
of each model; 2) ranking the models based on their advantages.
3.2.1. Identifying the advantages and disadvantages of the reviewed models
For each model, several advantages and disadvantages have been identified and extracted from
the project audit and improvement models. The advantages will be included in the proposed
model while the disadvantages will be excluded. Table 3.1 and Table 3.2 show the advantages
and disadvantages of the reviewed models respectively. In these following tables a “+” means
that the model includes the advantage or disadvantage and empty cells mean that the model does
not include the advantage or disadvantage.
Page 54
40
Table 3.1: Reviewed models advantages
Model Advantages P3
M3
P2M
M
CMM
I
KPM
3
PMPI
ISO
Rol
an d
GPM
PHT
PEM
OPM
3
applicable for all project stages + + applicable in construction projects + appropriate for project quality management + compatible with project life cycle + + defines maturity levels + + + + + + defines process improvement + + defines project key process areas + evidences are needed + + + + + + + has a questionnaire + + + + + + + + has project success criteria + + + industry independent + + + + + + + + is easily applicable + + + + + many best practice are available + + scoring model is clear + provides project audit workflow + strong conceptual model + cover all project processes and functions + + +
Table 3.2: Reviewed models disadvantages
Model Disadvantages P3
M3
P2M
M
CMM
I
KPM
3
PMPI
ISO
Rol
an d
GPM
PHT
PEM
OPM
3
compatible only with specific country + + compatible only with IT projects + + does not cover all project functions + + + + + does not cover all project processes + + + + does not have project audit workflow + + + + + + + + + does not have scoring model + + + is not easily applicable + + + + + + is not evidence base + + + needs trained auditor + + + + not applicable for all project stages + + + + + + questionnaire is not available + + scoring model is not available + + scoring model is not clear + + + + ambiguous questions + specifically applicable in quality management + is mainly conceptual model + + is not compatible with project life cycle + + + + + + + + +
Page 55
41
3.2.2. Ranking the models
One of the multi-criteria decision analysis methods that clearly consider multiple criteria in
decision-making environments is the Technique for Order of Preference by Similarity to Ideal
Solution (TOPSIS). In order to rank the project audit and improvement models, TOPSIS has
been utilized to rank the models from the highest to the lowest application. Furthermore, it
provides a better review of the strong and weak points of each model and helps to develop the
proposed project audit model. TOPSIS was originally developed by Hwang and Yoon in 1981. In
1987, Yoon did some more development and improvement for it. The main concept of TOPSIS
is that the geometric distance from the positive and negative ideal solutions should be the
shortest and longest respectively. According to Kim (1997), TOPSIS is a major MADM
technique which has advantages if compared to other MADM techniques (i.e. AHP). TOPSIS
advantages are: 1) an understandable logic; 2) considers both the best and worst alternatives
simultaneously; 3) a straightforward calculation process; and 4) considers several criteria to rank
alternatives. In this method, all alternatives are compared by defined criteria. First, for each
criterion a weight is identified. Next, a normalised score for each criterion is calculated. Then,
the geometric distance between each alternative and the ideal alternative is computed to find the
best score. TOPSIS allows trade-offs between criteria. For example, one criterion which has a
poor result can be compensated for by a good result of a positive criterion. This trade-off is the
main difference from non-compensatory methods and provides a more realistic result. To apply
TOPSIS, the following steps should be implemented:
Step 1: Put as alternatives (i=1, 2 . . . n) and as criteria (j=1, 2 . . . m). Create an evaluation
matrix consisting of (m) alternatives and (n) criteria, each alternative and criteria is named ,
therefore a matrix( ) × is created.
Page 56
42
Step 2: Normalize the created matrix in step one by using equation 1. Therefore a normalized
matrix named Y × is created.
Y = ( ) × = ∑ ( ) , = 1, … , ; = 1, … , Equation 1
Step 3: Put as weight of criteria j, (j=1, 2 . . . n) and W the original weight given to the
criteria j. Create the weight matrix W by using equation 2.
= ∑ Equation 2
Therefore the matrix W × created.
nnnw
ww
w
W
0000
0...000
0000
0000
0000
3
2
1
Step 4: Calculate the weighted normalised decision matrix by using equation 3. Therefore matrix × is created. N = ( ) × = ( ) × Equation 3
Step 5: Determine the worst alternatives ( ) by using equation 4 and the best alternatives ( )
using by equation 5.
= {[max = 1,2, … . , )| ∈ ]} {[min ( | = 1,2, … . , )| ∈ ]} Equation 4 = {[min = 1,2, … . , )| ∈ ]} {[max ( | = 1,2, … . , )| ∈ ]} Equation 5
Where, J = {j = 1,2, … , n| j associated with the criteria having a positive impact, and J = {j = 1,2, … , n| j associated with the criteria having a negative impact.
Page 57
43
Step 6: Calculate , the distance between the target alternative and the best condition by
using equation 6 and , the distance between the target alternative and the worst condition −
by using equation 7.
= ∑ ( − ) Equation 6
= ∑ ( − −)2 Equation 7
Step 7: Determine similarities , ( = 1,2, … , ) to the best condition by using equation 8. The
values present the final score of the alternatives. As shown in equation 8, is a number
between 0 (the worst alternative) and 1 (the best alternative).
= , 0 ≤ ≤ 1 Equation 8
Table 3.3 presents all alternatives which are compared with TOPSIS. For simplicity, the
alternatives are named from A1 to A11.
Table 3.3: Reviewed project audit and project maturity models (Alternatives)
Alternatives Code Alternatives Name
A1 Portfolio, Programme & Project Management Maturity Model (P3M3)
A2 Prince 2 Maturity Model (P2MM)
A3 Capability Maturity Model Integrated (CMMI)
A4 Kerzner Project Management Maturity Model (KPM3)
A5 Project Management Process Improvement (PMPI)
A6 Standard ISO 10006
A7 Roland Gareis Management of the project-oriented company
A8 German Association for Project Management (GPM)
A9 Lynn Craford Maturity Model
A10 Project Excellence Model (PEM)
A11 Organizational Project Maturity Model (OPM3)
Page 58
44
The above alternatives have been compared based on the criteria listed in table 3.4. For
simplicity, the criteria are named from X1 to X15. These criteria have been extracted from the
models that have been reviewed in chapter two.
Table 3.4: Factors to model comparsion (Criteria)
Criteria Code Criteria name Criteria
Code Criteria name
X1 Industry Independent X9 Various Reports
X2 Questionnaire Availability X10 Evidence Requirement
X3 Scoring Model Availability X11 Maturity Levels
X4 Having Audit Workflow X12 Conceptual Model Availability
X5 Considering Project Functions X13 Detailed Model Availability
X6 Considering Project Processes X14 Availability of Best Practice
X7 Applicable in all Project Stages X15 Applicability
X8 Detail Analytical Report
To implement TOPSIS technique, the checklist shown in figure 3.1 has been sent to project
management specialists, project managers, and project team members who have been working in
the Oil and Gas industry in Iran.
The statistical report of participants provides some information; 1) 22.39% of the participants are
female while 77.61% are male; 2) 7.46% of the participant are between 20-30 years old, 44.78%
are between 30-40 years old, and 47.76% are between 40-50 years old; 3) 19.40% of the
participants have experience as a team member, 35.82% have experience as a project manager;
3) 34.33% have experience as a project stakeholder, and 4) 10.45% have experience as a project
sponsor; 5) 5.97% of the participants have high school education, 40.30% have college
education, and 53.73% have bachelor or higher education; 6) 13.43% of the participants have 0-
10 years of work experience, 47.76% have 10-20 years, and 38.81% have 20-30 years.
Page 59
In order t
who hav
project au
held to e
selected
to obtain rel
ve enough q
udit, were se
explain the T
participants
Figu
iable results
qualification
elected to pa
TOPSIS che
were famil
ure 3.1: TOPS
from TOPS
n, knowledg
articipate in t
cklist and to
liar with som
45
SIS primary sc
SIS, the follo
ge, and und
this survey w
o provide in
me of the c
core checklist
owings are c
derstanding o
were pre-sel
nstructions o
current mod
t
onsidered: 1
of project m
lected. 2) Tw
on how to fil
dels (KPM3,
1) 85 particip
management
wo meetings
ll it up. Mos
ISO, PEM
pants,
t and
were
st the
M, and
Page 60
46
OPM3) because these were already used in their projects. To avoid bias, a presentation was
prepared and presented to participants in addition to distributing a brief summary about each
model. 3) At all time during the survey, participants had access to the research team either
through face to face meeting, emails, or phone calls in order to answer their questions and to
provide more explanation whenever was needed. Out of 85 project management specialists
including project managers, project team members, project stakeholders, and project sponsors,
67 participated in TOPSIS and returned the checklist. Statistical reports about the participants are
shown in figures 3.2 through 3.6.
Figure 3.2: TOSIS participants’ gender
Figure 3.3: TOSIS participants’ age
15, 22.39%
52, 77.61%
Gender
F M
5
3032
7.46%
44.78%47.76%
0.00%
20.00%
40.00%
60.00%
0
10
20
30
40
20-30 30-40 40-50
Perc
enta
ge
Num
ber o
f Peo
ple
Age
Page 61
1
2
3
4
Perc
enta
ge
19
0%
10%
20%
0%
40%
Team
5
Figure 3
Figu
Figure 3
9.40%
13
m Member
53.73%
38.81%
3.4: TOPSIS p
ure 3.5: TOPS
3.6: TOPSIS
35.82%
24
Project Manag
P
5.97%
Ed
Work
47
participants' w
SIS participan
participants' w
34.
ger Project S
Position
%
40.30%
ducation
13.43
47
Experien
working posit
nts' education
work experie
.33%
23
Stakeholder
%High S
Colleg
Bache
3%
7.76%
nce
tions
n
ence
10.45%
7
Project Sponso
School
ge
elor or More
0-1010-2020-30
0
5
10
15
20
25
30
or
Num
ber o
f Peo
ple
Page 62
48
Except the gender and age, which are optional, other statistical reports were helpful in making
sure that TOPSIS survey has been completed by qualified project team. As mentioned earlier, all
participants have project work experience. Around 94% of the participants have college or
university education where 86% of them have more than 10 years project experience.
Table 3.5 shows the evaluation matrix consisting of 11 alternatives and 15 criteria. This matrix
has been created directly from the checklist sent to participants. An average of 67 checklists is
calculated for all cells as shown in table 3.5. For example cell A1X1=3 is the average of 67
scores that participants wrote for cell A1X1.
Table 3.5: Alternative and criteria matrix
X1 X2 X3 X4 X5 X6 X7 X8 X9 X10 X11 X12 X13 X14 X15
A1 3 4 3 1 2 2 2 2 2 2 7 4 2 2 2
A2 4 4 3 1 4 5 4 4 3 3 8 4 3 2 5
A3 2 3 3 1 2 2 2 3 2 2 8 3 3 2 2
A4 7 8 4 5 7 7 4 5 5 6 7 6 6 7 7
A5 3 3 3 2 4 7 3 3 3 5 7 5 4 2 4
A6 7 6 2 4 2 3 8 2 2 9 2 2 3 6 7
A7 6 6 3 2 5 6 5 4 3 6 4 3 4 3 4
A8 6 7 3 2 6 6 4 4 3 5 5 3 5 3 5
A9 8 7 6 4 7 7 5 5 5 6 8 4 7 4 6
A10 8 9 8 6 7 7 6 7 9 9 6 8 8 8 8
A11 6 8 5 4 8 8 4 6 7 7 8 5 7 7 7
Normalized value of the evaluation matrix has been calculated by using equation 1 as shown in
table 3.6. For example, cell A1X1= 0.04 is computed by previous value of A1X1=3 divided by
square root of the square of all cells which is 67.72, ∑ ( ) = √4452 = 67.72.
Page 63
49
Table 3.6: Normalized alternative and criteria matrix (results of equation 1)
X1 X2 X3 X4 X5 X6 X7 X8 X9 X10 X11 X12 X13 X14 X15
A1 0.04 0.06 0.04 0.01 0.03 0.03 0.03 0.03 0.03 0.03 0.1 0.06 0.03 0.03 0.03
A2 0.06 0.06 0.04 0.01 0.06 0.07 0.06 0.06 0.04 0.04 0.12 0.06 0.04 0.03 0.07
A3 0.03 0.04 0.04 0.01 0.03 0.03 0.03 0.04 0.03 0.03 0.12 0.04 0.04 0.03 0.03
A4 0.1 0.12 0.06 0.07 0.1 0.1 0.06 0.07 0.07 0.09 0.1 0.09 0.09 0.1 0.1
A5 0.04 0.04 0.04 0.03 0.06 0.1 0.04 0.04 0.04 0.07 0.1 0.07 0.06 0.03 0.06
A6 0.1 0.09 0.03 0.06 0.03 0.04 0.12 0.03 0.03 0.13 0.03 0.03 0.04 0.09 0.1
A7 0.09 0.09 0.04 0.03 0.07 0.09 0.07 0.06 0.04 0.09 0.06 0.04 0.06 0.04 0.06
A8 0.09 0.1 0.04 0.03 0.09 0.09 0.06 0.06 0.04 0.07 0.07 0.04 0.07 0.04 0.07
A9 0.12 0.1 0.09 0.06 0.1 0.1 0.07 0.07 0.07 0.09 0.12 0.06 0.1 0.06 0.09
A10 0.12 0.13 0.12 0.09 0.1 0.1 0.09 0.1 0.13 0.13 0.09 0.12 0.12 0.12 0.12
A11 0.09 0.12 0.07 0.06 0.12 0.12 0.06 0.09 0.1 0.1 0.12 0.07 0.1 0.1 0.1
Table 3.7 shows weight matrix. To create matrix W, equation 2 is used as explained earlier. For
example, the weigh for cell X1X1 = 0.06 is the average of the normalized weights that was
considered for X1 in compare to all criteria.
(0.02+0.01+0.01+0.1+0.02+0.02+0.01+0.14+0.07+0.07+0.1+0.16+0.03+0.08+0.01)/15=0.06
Table 3.7: Weight matrix (results of equation 2)
X1 X2 X3 X4 X5 X6 X7 X8 X9 X10 X11 X12 X13 X14 X15 X1 0.06 0 0 0 0 0 0 0 0 0 0 0 0 0 0
X2 0 0.09 0 0 0 0 0 0 0 0 0 0 0 0 0
X3 0 0 0.08 0 0 0 0 0 0 0 0 0 0 0 0
X4 0 0 0 0.02 0 0 0 0 0 0 0 0 0 0 0
X5 0 0 0 0 0.16 0 0 0 0 0 0 0 0 0 0
X6 0 0 0 0 0 0.13 0 0 0 0 0 0 0 0 0
X7 0 0 0 0 0 0 0.04 0 0 0 0 0 0 0 0
X8 0 0 0 0 0 0 0 0.03 0 0 0 0 0 0 0
X9 0 0 0 0 0 0 0 0 0.01 0 0 0 0 0 0
X10 0 0 0 0 0 0 0 0 0 0.02 0 0 0 0 0
X11 0 0 0 0 0 0 0 0 0 0 0.04 0 0 0 0
X12 0 0 0 0 0 0 0 0 0 0 0 0.06 0 0 0
X13 0 0 0 0 0 0 0 0 0 0 0 0 0.13 0 0
X14 0 0 0 0 0 0 0 0 0 0 0 0 0 0.02 0
X15 0 0 0 0 0 0 0 0 0 0 0 0 0 0 0.11
Weighted normalised decision matrix is calculated by using equation 3 as shown in table 3.8. For
example, cell A1X1=0.003 is computed by 0.04 multiply 0.06.
Page 64
50
Table 3.8: Multiplying matrix y and w (results of equation 3)
X1 X2 X3 X4 X5 X6 X7 X8 X9 X10 X11 X12 X13 X14 X15
A1 0.003 0.006 0.003 0.000 0.005 0.004 0.001 0.001 0.000 0.001 0.004 0.003 0.004 0.001 0.003
A2 0.003 0.006 0.003 0.000 0.010 0.010 0.003 0.002 0.001 0.001 0.005 0.003 0.006 0.001 0.008
A3 0.002 0.004 0.003 0.000 0.005 0.004 0.001 0.001 0.000 0.001 0.005 0.002 0.006 0.001 0.003
A4 0.006 0.011 0.005 0.001 0.017 0.013 0.003 0.002 0.001 0.002 0.004 0.005 0.012 0.002 0.011
A5 0.003 0.004 0.003 0.001 0.010 0.013 0.002 0.001 0.001 0.002 0.004 0.004 0.008 0.001 0.006
A6 0.006 0.009 0.002 0.001 0.005 0.006 0.005 0.001 0.000 0.003 0.001 0.002 0.006 0.002 0.011
A7 0.005 0.009 0.003 0.001 0.012 0.012 0.003 0.002 0.001 0.002 0.002 0.002 0.008 0.001 0.006
A8 0.005 0.010 0.003 0.001 0.015 0.012 0.003 0.002 0.001 0.002 0.003 0.002 0.010 0.001 0.008
A9 0.007 0.010 0.007 0.001 0.017 0.013 0.003 0.002 0.001 0.002 0.005 0.003 0.014 0.001 0.010
A10 0.007 0.013 0.009 0.002 0.017 0.013 0.004 0.003 0.002 0.003 0.004 0.007 0.016 0.002 0.013
A11 0.005 0.011 0.006 0.001 0.020 0.015 0.003 0.003 0.001 0.002 0.005 0.004 0.014 0.002 0.011
Table 3.9 shows the worst alternatives ( ) and best alternatives ( ) that are computed by using
equation 4 and equation 5. For example, the worst alternatives for X1 in table 3.8 is the
minimum value in column X1 that is 0.002 and the best alternatives is the maximum value in
column X1 that is 0.007.
Table 3.9: The worst and the best alternatives (results of equation 4 and 5)
X1 X2 X3 X4 X5 X6 X7 X8 X9 X10 X11 X12 X13 X14 X15
0.007 0.013 0.009 0.002 0.020 0.015 0.005 0.003 0.002 0.003 0.005 0.007 0.016 0.002 0.013
0.002 0.004 0.002 0.000 0.005 0.004 0.001 0.001 0.000 0.001 0.001 0.002 0.004 0.001 0.003
As shown in table 3.10, to calculate , the distance between the target alternative and the best
condition +, equation 6 is used. Also, as shown in table 3.11, to calculate , the distance
between the target alternative and the worst condition −, equation 7 is used. For example, D+
for A1=0.027 is computed by SQRT[(0.003-0.007)2 +(0.006-0.013)2 +(0.003-0.009)2+(0.000-
0.002)2+(0.005-0.02)2+(0.004-0.015)2+(0.001-0.005)2+(0.001-0.003)2+(0.000-0.002)2+(0.001-
0.003)2+(0.004-0.005)2+(0.003-0.007)2+(0.004-0.016)2+(0.001-0.002)2+(0.003-0.013)2]=0.0270
Also, D- for A1=0.004 is computed by SQRT[(0.003-0.002)2+(0.006-0.004)2+(0.003-0.002)2+(0.000-
0.000)2+(0.005-0.005)2+(0.004-0.004)2+(0.001-0.001)2+(0.001-0.001)2+(0.000-0.000)2+(0.001-
0.001)2+(0.004-0.001)2+(0.003-0.002)2+(0.004-0.004)2+(0.001-0.001)2+(0.003-0.003)2]=0.004
Page 65
51
Table 3.10: Distances between the target and the best alternative or D+ (results of equation 6)
X1 X2 X3 X4 X5 X6 X7 X8 X9 X10 X11 X12 X13 X14 X15 D+ A1 0.00002 0.00005 0.00003 0.00000 0.00021 0.00013 0.00001 0.00000 0.00000 0.00001 0.00000 0.00001 0.00014 0.00000 0.00009 0.0270
A2 0.00001 0.00005 0.00003 0.00000 0.00010 0.00003 0.00001 0.00000 0.00000 0.00000 0.00000 0.00001 0.00010 0.00000 0.00002 0.0194
A3 0.00003 0.00007 0.00003 0.00000 0.00021 0.00013 0.00001 0.00000 0.00000 0.00001 0.00000 0.00002 0.00010 0.00000 0.00009 0.0268
A4 0.00000 0.00000 0.00002 0.00000 0.00001 0.00000 0.00001 0.00000 0.00000 0.00000 0.00000 0.00000 0.00002 0.00000 0.00000 0.0080
A5 0.00002 0.00007 0.00003 0.00000 0.00010 0.00000 0.00001 0.00000 0.00000 0.00000 0.00000 0.00001 0.00006 0.00000 0.00004 0.0188
A6 0.00000 0.00002 0.00005 0.00000 0.00021 0.00009 0.00000 0.00000 0.00000 0.00000 0.00001 0.00002 0.00010 0.00000 0.00000 0.0228
A7 0.00000 0.00002 0.00003 0.00000 0.00005 0.00001 0.00000 0.00000 0.00000 0.00000 0.00001 0.00002 0.00006 0.00000 0.00004 0.0162
A8 0.00000 0.00001 0.00003 0.00000 0.00002 0.00001 0.00001 0.00000 0.00000 0.00000 0.00000 0.00002 0.00004 0.00000 0.00002 0.0133
A9 0.00000 0.00001 0.00001 0.00000 0.00001 0.00000 0.00000 0.00000 0.00000 0.00000 0.00000 0.00001 0.00000 0.00000 0.00001 0.0075
A10 0.00000 0.00000 0.00000 0.00000 0.00001 0.00000 0.00000 0.00000 0.00000 0.00000 0.00000 0.00000 0.00000 0.00000 0.00000 0.0036
A11 0.00000 0.00000 0.00001 0.00000 0.00000 0.00000 0.00001 0.00000 0.00000 0.00000 0.00000 0.00001 0.00000 0.00000 0.00000 0.0061
Table 3.11: Distances between the target and the worst alternative or D- (results of equation 7)
X1 X2 X3 X4 X5 X6 X7 X8 X9 X10 X11 X12 X13 X14 X15 D-
A1 0.00000 0.00000 0.00000 0.00000 0.00000 0.00000 0.00000 0.00000 0.00000 0.00000 0.00001 0.00000 0.00000 0.00000 0.00000 0.0040
A2 0.00000 0.00000 0.00000 0.00000 0.00002 0.00003 0.00000 0.00000 0.00000 0.00000 0.00001 0.00000 0.00000 0.00000 0.00002 0.0104
A3 0.00000 0.00000 0.00000 0.00000 0.00000 0.00000 0.00000 0.00000 0.00000 0.00000 0.00001 0.00000 0.00000 0.00000 0.00000 0.0045
A4 0.00002 0.00005 0.00001 0.00000 0.00015 0.00009 0.00000 0.00000 0.00000 0.00000 0.00001 0.00001 0.00006 0.00000 0.00006 0.0217
A5 0.00000 0.00000 0.00000 0.00000 0.00002 0.00009 0.00000 0.00000 0.00000 0.00000 0.00001 0.00001 0.00002 0.00000 0.00001 0.0127
A6 0.00002 0.00002 0.00000 0.00000 0.00000 0.00000 0.00001 0.00000 0.00000 0.00001 0.00000 0.00000 0.00000 0.00000 0.00006 0.0114
A7 0.00001 0.00002 0.00000 0.00000 0.00005 0.00006 0.00000 0.00000 0.00000 0.00000 0.00000 0.00000 0.00002 0.00000 0.00001 0.0134
A8 0.00001 0.00003 0.00000 0.00000 0.00010 0.00006 0.00000 0.00000 0.00000 0.00000 0.00000 0.00000 0.00004 0.00000 0.00002 0.0163
A9 0.00003 0.00003 0.00002 0.00000 0.00015 0.00009 0.00000 0.00000 0.00000 0.00000 0.00001 0.00000 0.00010 0.00000 0.00004 0.0220
A10 0.00003 0.00007 0.00005 0.00000 0.00015 0.00009 0.00001 0.00000 0.00000 0.00001 0.00001 0.00002 0.00014 0.00000 0.00009 0.0260
A11 0.00001 0.00005 0.00001 0.00000 0.00021 0.00013 0.00000 0.00000 0.00000 0.00000 0.00001 0.00001 0.00010 0.00000 0.00006 0.0248
Page 66
52
The last step is the computation of similarities, ( = 1,2, … , 11). As shown in table 3.12,
is calculated by using equation 8. For example, = 0.1306 is computed by 0.00405
divided by 0.02696 plus 0.00405.
Table 3.12: Final score of models (results of equation 8)
A1 A2 A3 A4 A5 A6 A7 A8 A9 A10 A11
D+ 0.02696 0.01938 0.02677 0.00801 0.01881 0.02284 0.01615 0.01328 0.00746 0.00358 0.00610
D - 0.00405 0.01044 0.00447 0.02171 0.01273 0.01136 0.01336 0.01631 0.02204 0.02600 0.02481
Ei 0.1306 0.3501 0.1431 0.7303 0.4036 0.3321 0.4527 0.5511 0.7471 0.8789 0.8025
As explained earlier, presents the final score of the alternatives. As shown in figure 3.7,
the values are listed in an order from maximum score on the left to minimum score on
the right. Because the value of is a number between 0 and 1, the advantages of the
models on the left side of the spectrum where their are greater than 0.5 should be
considered in the proposed model and the disadvantages of the models on the right sides
where their are less than 0.5 will be excluded.
Figure 3.7: Final score (Ei) of models
Page 67
53
3.3. Model development process
Using the TOPSIS results, the new project audit model will be developed through three
phases: 1) developing the conceptual model - phase 1; 2) developing the detail model -
phase 2; and 3) developing a scoring system for the model - phase 3.
In the conceptual model, the main structure of the project audit model will be designed.
Three critical aspects of the project (process, function, and progress) are presented. In the
detail model, each of those three aspects is described and categorised for measurement.
Appropriate questions are selected and assigned to each category to measure the project
situation in that specific category. Questions should be answered during the project audit.
However, to satisfy each question, specific document(s) are necessary to be provided. A
scoring model is needed to be designed to calculate the score of the projects after the audit.
3.3.1. Developing the conceptual model (Phase 1)
The advantages and disadvantages of the reviewed models are shown in table 3.1 and table
3.2, and the results of the TOPSIS ranking, is shown in figure 3.7, help in developing a
theoretical framework of a conceptual model for the project audit.
Figure 3.8: Project audit theoretical framework (conceptual model)
Page 68
54
As shown in figure 3.8, the project audit can be conducted by considering three critical
aspects of the project: 1) project processes; 2) project functions; and 3) project
performance. Figure 3.8 shows these aspects on the three sides of a triangle. In other words,
a project should be audited through its processes, functions, and the performance that it
achieves through the audit data.
3.3.2. Developing the detail model (Phase 2)
The Detail model provides much more information about each of three aspects mentioned
in the conceptual model. The project processes include four main parts:
1. Project Planning or Basic Design; which consists of all the processes required to
establish the project plan, to cover the project scope and to achieve the project
objectives.
2. Project Executing or Implementation; which consists of all the processes
required to complete the project work as planned and to satisfy the project
specifications
3. Project Monitoring and Controlling; which consists of all the processes
responsible to track, review, and regulate the project work and progress.
4. Project Closing or Turn over; which consists of all the processes related to
finalizing the project activities and closing it.
Project functions include nine parts:
1. Project Cost; which is related to estimating, budgeting, managing, and controlling
project costs so that the project can be completed within the determined budget.
Page 69
55
2. Project Time; which is related to the project activities duration, scheduling the
project and completing it on time.
3. Project Quality/Safety; which needs to be performed in order to determine
policies, objectives, and responsibilities to quality of the project specifications with
defined safety.
4. Project Scope; which is required for ensuring that the project works will be
completed and any other type of works that are out of the project scope will be
reported.
5. Project Human Resources; which are necessary to organize, manage, and lead the
project team.
6. Project Communication; which is related to collecting project information,
generating appropriate reports, and distributing reports.
7. Project Risk; which is related to identification, analysis, response, and control of
project uncertainties.
8. Project Procurement; which is needed to purchase or acquire products, services,
or results needed from outside the project team.
9. Project Integration; which is necessary to combine and integrate project
management activities.
Based on the advantages and disadvantages of the reviewed models and the results of the
TOPSIS ranking, some questions are assigned to each process and function needed to audit
the project and measure its status. Also, related documents are included to satisfy each
question.
Page 70
56
As for the project performance, it is computed through the application of the Earned Value
Method (EVM). This part provides useful analysis related to the project indices. EVM
relies on three key data points; 1) Budgeted Cost of Work Performed (BCWP); 2) Budgeted
Cost of Work Scheduled (BCWS); 3) Actual Cost of Work Performed (ACWP).
BCWP indicates work progress at a given point in time. It indicates the amount of work put
in place at a specific point of time. BCWS describes how the project work is supposed to be
at any given point based on the project schedule. It is a number that presents the budgeted
work that is scheduled. ACWP is a number that indicates the actual work performed to
date.
The first index that presents the project time performance is Schedule Performance Index
(SPI). SPI shows how efficiently the project used its time. As shown in equation 9, SPI is
computed by dividing the BCWP by the BCWS. SPI is a number that can be either lower
than 1 (under schedule) or bigger than 1 (ahead of schedule).
= BCWP BCWS Equation 9
The second index presents the project cost performance, which is Cost Performance Index
(CPI). CPI indicates how efficiently the project used its budget to date. As shown in
equation 10, CPI is computed by dividing the BCWP by the ACWP. CPI is a number that
can be either less than 1 (over budget) or greater than 1 (under budget).
= BCWP ACWP Equation 10
Page 71
57
Two other important values that EVM calculates are: 1) Schedule Variance (SV) and 2)
Cost Variance (CV). SV indicates that a project is ahead of or behind schedule and it is
calculated by subtracting the BCWP from BCWS as shown in equation 11. A positive value
is a favorable condition and a negative value is an unfavorable condition.
= BCWP − BCWS Equation 11 CV indicates that a project is over or under budget and it is calculated by subtracting the
BCWP from ACWP as shown in equation 12. A positive value is a favorable condition and
a negative value is an unfavorable condition.
= BCWP − ACWP Equation 12
There are some other useful values that can be computed with the earned value method; 1)
Time Estimate at Completion (EAC ); 2) Estimate to Completion (ETC); 3) Estimate at
Completion (EAC); and 4) Variance at Completion (VAC).
The ETC (t) is an approximate estimate indicates when the project will be completed, if
current performance continues. As shown in equation 13, ETC (t) is calculated by project
duration divided by SPI.
= Equation 13
The ETC is an approximate estimate indicates how much money is needed from now to
complete the project, if current performance continues. As shown in equation 14, ETC is
calculated by project budget minus BCWP divided by CPI.
= − Equation 14
Page 72
58
The EAC is an approximate estimate indicates how much the final cost of the project will
be, if current performance continues. As shown in equation 15, EAC is calculated by
project budget divided by CPI.
= Equation 15
Knowing the value of EAC, VAC can be calculated. VAC indicates whether the project
will finish under or over budget. As shown in equation 16, VAC is computed by subtracting
the EAC from the project budget.
= − Equation 16
EVM indices and its other values measure the current performance of the project and
forecast its future performance if the project continues on the same trend.
3.3.3. Developing the scoring system for the model (Phase 3)
After defining the three aspects of the project audit, a scoring system is needed to compute
a quantitative value for the project processes and functions. The proposed model has a
flexible scoring system, which can be defined based on the company preference. This
would help project oriented companies to adjust the level of details and accuracy when
auditing their projects. However, to have reliable results and to ensure equality, the same
scoring system must be applied to audit all company’s projects. The auditor may assign any
score between 0 and 9 to each question: nothing (0); very bad (1); bad (2); almost medium
(3); medium (4); more than medium (5); good (6); very good (7); excellent (8); mature (9).
For example, if an auditor assesses a question as good, the system assigns a score of 6
points to the planning process and scope function of the project. The performance of each
Page 73
59
process and function is simply computed as a percentage according to the following
equations:
% = ∑ ℎ ℎ ℎ ℎ × 100 Equation 17
% = ∑ ℎ ℎ ℎ ℎ × 100 Equation 18
Each percentage computed by using equations 17 and 18 can be interpreted by using table
3.13. According to table 3.13, if the percentage score of process is a number between 0 and
0.2, it is interpreted that process of the project has a very bad condition, if the percentage
score of process is a number between 0.2 and 0.4, process of the project has a bad
condition, if the percentage score of process is a number between 0.4 and 0.6, process of
the project has a medium condition, if the percentage score of process is a number between
0.6 and 0.8, process of the project has a good condition, and if the percentage score of
process is a number between 0.8 and 1.0, process of the project has a very good condition,
Table 3.13: Score interpretation guideline
Percentage Between Interpretation
%0 < score < %20 Very bad
%20 < score < %40 Bad
%40 < score <% 60 Medium
%60 < score < %80 Good
%80 < score < %100 Very good
As shown in figure 3.9, the proposed project audit model consists of three parts that are
connected together; 1) input; 2) process; and 3) output.
Page 74
60
Figure 3.9: Project audit model
Current status of the project processes and its functions are inputted into the model, and
other values are measured by their related questions. As mentioned earlier, to satisfy each
question, specific document(s) is/are necessary to be provided. Then, the scoring system
calculates the final score of each process and function. Also, project progress key data
points (BCWP, BCWS, and ACWP) are inputted into the model. By using the earned value
method, important project indices are calculated and related graphs are drawn. The output
of the proposed model provides a comprehensive report of the project status. By reviewing
the output, project owner and project manager can monitor the project status by having
detail information about the different parts of the project.
3.3. Summary
In this chapter, the methodology that has been used to develop the project audit model is
described and its components are clarified. First, project audit and improvement models are
analyzed and their advantages and disadvantages are identified. Then, by using TOPSIS,
Page 75
61
the reviewed models are ranked from the best to the worst. Their advantages have been
included in the proposed model and their disadvantages have been excluded. Next, the
proposed model is developed and a scoring system is designed to calculate the project
processes and functions scores. For project performance, earned value method is used to
measure the project progress performance. The proposed model is completely integrated
and provides comprehensive report of the project status.
Page 76
62
Chapter Four
Model Development
4.1. Introduction
This chapter illustrates the development of the integrated project audit model. The
development process of the model consists of six components: 1) table relationship; 2)
project information; 3) audit questions; 4) plan a project audit; 5) record audit results; 6)
reports. The development has been implemented using Visual Basic for application
Programming language, and Access 2010.
4.2. Table relationship
To develop the model, tables are needed to store the project data. These data consist of the
project main information (i.e. name, code, start and finish date) and project progress data
(i.e. time and cost). Also, some tables are needed to store the questions and the results of
the calculations. Therefore, the following tables are designed:
Process Table: that stores all the project processes that will be audited.
Function Table: that stores all the project functions that will be audited.
Project Information Table: that stores the project information (i.e. start date).
Contract Table: that stores the type of the project contract.
Question Table: that stores all the audit questions.
Stage Table: that stores the different stages of the project (i.e. basic design)
Evidence Table: that stores the documents needed to satisfy the questions.
Audit Table: that stores the date where the project audits are scheduled and planned.
Score Table: that stores the standard scoring level that can be used for the audit.
Page 77
63
Performance Table: that stores the project progress data.
Auditor Table: that stores the list of auditors who participated in the project audit.
Audit Question Table: that stores all the questions that have been selected for an
audit.
Figure 4.1 shows how the tables are related with each other so that information is shared
between them as needed. All the relationships that link these tables are one to many
relationships.
Figure 4.1: Tables relationships
4.3. Project Related Information
As explained earlier, first, fundamental information needs to be provided to implement the
audit effectively. The information is divided into seven groups: 1) construction process; 2)
construction function; 3) construction stage; 4) contract type; 5) scoring levels; 6) project
plan; and 7) project information, as shown in figure 4.2. To activate this tab, in the main
menu the user should click on related information button.
Page 78
64
Figure 4.2: Related information tab
If the user clicks on either the project process or the project functions, different forms will
be opened as shown in figure 4.3 and figure 4.4 respectively.
Figure 4.3: Project processes form
Figure 4.4: Project functions form
Page 79
65
To show in which stage the project is audited, a standard list of project stages will be
needed. This list is used when an audit is being planned as shown in figure 4.5 where the
project stage is in a basic design stage.
Figure 4.5: Project stages form
In this application, the scoring system is flexible and can be defined according to the
owner’s standards. As mentioned earlier, a flexible scoring category provides the
opportunity to audit the project deeply and accurately. Figure 4.6 shows the scoring
category form.
Figure 4.6: Scoring categories form
Page 80
66
Usually, project-oriented companies implement several projects within a specific period of
time. This provides the opportunity to learn more from previous projects. Storing the type
of contract used in the project would help the audit process to find the type of contract that
has good performance and the ones that need to improve its capabilities. Figure 4.7
provides a list of the contract types inserted in the developed model. For example, after
implementing five or six audits, the company may find that it had a very good performance
in lump sum contract for the project based on the audit results.
Figure 4.7: Contract types form
One of the most important forms in the related information tab is the project information
form. In this form the main information about the project (i.e. project title, project manager,
and the start and finish date) are required to be filled by users. The project code should be
entered for future purposes (i.e. to pull up project information data for the report). Each
project must have a unique code consisting of six characters. The first three characters are
letters and the next three characters are numbers. This format allows the user to define a
specific project code format for specific types of projects. For example, EPC000 is
considered for construction projects and EEE000 for engineering projects. Also, a snapshot
of the project plan can be seen, including the planned progress, actual progress, planned
Page 81
67
cost, actual cost, project duration, and estimated time to finish with current performance
and cost to completion.
There is a list of critical project documents in this tab and the user needs to check off any
documents that are already prepared for the project. These documents are necessary to
satisfy the related questions during the project audit. Figure 4.8 illustrates an example of
the project information and its related documents.
Figure 4.8: Project information form
4.4. Audit questions
Several questions have been designed to audit projects. Each question is related to a project
process and a project function. Furthermore, to satisfy each question, two or more
documents need to be prepared. As shown in figure 4.9, in the audit questions form, the
Page 82
68
user can define questions and provide a process and function for them. To active this form,
in the main form, the user should click on the audit question button.
Figure 4.9: Audit question form
Also, the required documents and other additional information can be defined in that form.
Figure 4.9 shows an example of the project audit questions as well as a list of documents
required for that question.
4.5. Plan a project audit
Before an audit starts, it needs to be planned and scheduled. In other words, some
information (i.e. audit date, project name, project stage, and auditors) need to be selected
from the form that has been designed for this purpose. The developed model assigns a
unique ID for each audit. This ID is important so that the data related to this audit can be
recalled in the future for reports or other purposes. The ID consists of six characters. The
first four characters represent the year that the audit is being implemented and the last two
Page 83
69
characters count the number of audits in each year. For example, audit ID=201402 means
that the second audit in 2014. Also, there are two ways to audit a project: 1)
comprehensive; 2) quick. To active this tab, users should click on plan a project audit
button in the main menu (figure 4.10).
Figure 4.10: Audit types tab
Comprehensive Audit: where a real project audit should be comprehensive and include
all processes and functions. This audit is planned in advance where qualified auditors
are chosen to participate during the predetermined date. Also, the user is able to attach
any related document in this tab as illustrated in figure 4.11.
Figure 4.11: Comprehensive planning audit form
Page 84
70
Quick Audit: Sometimes, project managers need to prepare a report for a specific
function or process and they do not have enough time or resources to implement a
comprehensive audit. In this situation, Quick Audit is selected as shown in figure 4.12.
Figure 4.12: Quick audit tab
4.6. Recording audit results
To record the audit results which are divided into two categories as shown in figure 4.13.
Question results: this part includes the results of all the questions related to project
processes and functions as shown in figure 4.14.
Performance results: this consists of the project progress information that should be
entered in the model (i.e. actual progress and actual cost) as shown in figure 4.15.
The model compares this progress with the planned progress and analyses the data
by using the earned value method.
Figure 4.13: record result tab
Page 85
71
Figure 4.14: Recording questions' score
Figure 4.15: Recording performance data
Page 86
72
4.7. Output Reports
Reporting is one the most important parts of an audit. The developed model is able to
generate several types of reports and to generate a variety of new user-defined reports. In
other words, some reports are generated from the main information (i.e. project
information, processes, and functions) and others are the result of the analysis and
computations that the model implement. Therefore, two groups of reports have been
designed in this model as shown in figure 4.16.
Figure 4.16: Selecting report type tab
1. Main report: the reports generated from the main information menu (i.e. project
information, processes, functions) as shown in figure 4.17.
Page 87
73
Figure 4.17: Main report tab
o Project Information Report: is a report of all the project information that was
entered in the model before the audit.
o Number of Questions Report: is a report that shows how many questions and
documents have been recorded in the developed model.
o Project Function Report: is a report of the functions that the project audit is
based on.
o Scoring Levels Report: is the standard level of scoring system for the audit in
the developed model.
o Project Process Report: is a report of processes that the project audit is based
on.
o Comprehensive Audit Questions Report: is a report that includes all the
questions that are needed for a comprehensive audit.
o Project Stage Report: is a report of the project stages included in the developed
model.
o List of All Questions Report: is a simple report of the project questions
included in the developed model.
o Contract Type Report: is a report of the project contract types inherited in the
developed model.
Page 88
74
o All Project Documents Report: is a list of important project documents
included in the developed model.
2. Analytical report: This provides analytical results of the project audit. The user is
asked to enter the project audit code and project code to generate the reports. The
following reports are generated as shown in figure 4.18.
Figure 4.18: Analytical report tab
o Detail Audit Report: is an analytical report about the project processes and
functions status.
o Performance Graphs: several analytical graphs that show the project
performance trend from the start of the project to the audit date.
o Process Audit Report: is an analytical report about the project processes status.
o Performance Report: is an analytical report that shows the earned value indices
based on a specific date.
o Function Audit Report: is an analytical report about the project function status.
o All Performance Data Report: is an analytical report that shows all earned
value indices in a table format from the beginning of the project.
All forms in the developed model have a dashboard to manage records. In this dashboard,
users are able to add a new record, move to the previous record, move to the next record,
delete a specific record, search a specific record, and close the tab as shown in figure 4.19.
Page 89
75
Figure 4.19: Data management dashboard
Also a very useful option of the developed model is the ability to export the data in other
formats. The user can export audit data and other data from the developed model to three
different formats: Excel 2003/2010, Adobe Acrobat, and HTML. This helps to generate
more analytical reports, as shown in figure 4.20.
Figure 4.20: Export data tab
4.8. Summary
The process of developing of the proposed project audit model is illustrated in this chapter
and the main steps that have been followed to generate an integrated project audit system
are showed. First, the table relationships are defined. All the relationships that link these
tables are one to many relationships. Then, the components of the main menu consist of
project related information tab, audit questions tab, plan a project audit tab, recording the
audit results tab, and output reports tab are described.
Page 90
76
Chapter Five
Model Validation
5.1. Introduction
This chapter tests the capability and workability of the developed model to plan,
implement, and report a project audit. To validate the model and its results, information
from a real Oil and Gas project is used in the model to implement a project audit. It is
commonly known that an Oil and Gas project is classified as an infrastructure project
because it consists of different construction projects including un-industrial and industrial
buildings, pipelines, roads, warehouses, refinery, tanks, vessels and etc. Selecting this type
of projects would help in testing and ensuring that the developed model can be used in any
type of construction projects. Therefore, a Refinery Gas Pars in Iran is selected. It has a
starting date of October 2011 and a finishing date of October 2015. The project has two
contractors: a design contractor and a construction contractor. The design contractor is
responsible for project management, basic and detail engineering design and execution,
procurement of the main equipment and materials of the project, construction supervision,
engineering manpower supply, specialized commissioning operation. The construction
contractor is responsible for civil activities, erection management, erection execution, site
preparation and mobilization, material and equipment supply for erection, pre-
commissioning, expert manpower supply for the commissioning operation. The contract is
a lump sum and consists of engineering, procurement, construction, test & inspection, pre-
commissioning, commissioning and training of establishing a Gas Treatment Plant.
Page 91
77
5.2. Related Information Menu
First, the project information must be entered into the model. As shown in figure 5.1, the
user should click on the “Related Information” button to open another tab that provides the
main menu from which the user can select and input project information.
Figure 5.1: Related information menu
In the project information form, project name, project manager’s name, start date and finish
date should be entered. While, other related information about the project such as the
contract type and the list of current project documents can be added. The project code
should be entered for future purposes (i.e. to pull up project information data for the
report). Each project must have a unique code consists of six characters, three letters and
three numbers, AAA000. This format allows the user to define a specific project code for
specific types of projects. For example, EPC002 represent that a the project number two
includes of Engineering (E), Procurement (P), and Construction (C) phases .There is a table
Page 92
78
in the middle of the form that present a summary of the project progress information. This
table will be filled by related data that will be added from the form “Input the Project Plan”
as shown in Figure 5.2. The purpose for this table is to show a snapshot of the project status
Figure 5.2: Project information input form without the summary plan
Clicking on “Input the Project Plan” button from the related information form, the data
related to the project plan such as the date, plan and actual progress, actual cost, project
budget, and project duration must be added by the user as shown in figure 5.3. This data
can be easily copied from the project schedule but the Project ID should be the same as the
one saved for the project in the project information menu.
Figure 5.3 shows the data related to Project ID number 2. In the first row, planned progress
and actual progress in 23/10/2011 are 0.54% and 0.50% respectively and increase during
the project life cycle. Also, the project was planned to be implemented in 48 month with a
budget of $214 million, this number is not changed.
Page 93
79
Figure 5.3: Project summary plan
After recording the data of the project plan data in the model, in the project information
menu the data can be seen as shown in figure 5.4.
Figure 5.4: Project information input form with summary of plan
Page 94
80
There are five other buttons in the related information form. Clicking on the “Construction
Process” button, the related form opens and three boxes need to be filled. The Process ID is
used to make a connection with the developed tables. The process name and its description
can be added. The user can also define and change processes for the project if it is
necessary. The same steps should be taken for the project function as shown in Figure 5.5.
There are five processes in the model; Initiating, Planning, Executing, Controlling and
Monitoring, and Closing. Furthermore, there are nine project’s functions in the model;
integration, scope, time, cost, quality/safety, human resources, risk, and procurement. The
user can add or modify this data if required.
Figure 5.5: Project processes and functions input forms
There are two other buttons in the related information form, which are: contract type and
project stage. As mentioned earlier, the user can define different types of contracts. Eight
Page 95
81
types of contracts are considered in the model as shown in figure 5.6. For that actual
project, the contract type is lump sum.
Also, five popular stages of a project are stored in the model as different project stages:
basic design, detail engineering, construction, procurement, and turn over as shown figure
5.6. The user can easily add or modify the data in this part if it is required. For that actual
project, project stage is construction.
Figure 5.6: Project contract types and construction stages input forms
To have more accurate results, ten levels of scores have been included in the model. For
each score, a description and score point is defined as shown in Figure 5.7.
Page 96
82
Figure 5.7: Project audit coring levels input form
5.3. Audit Questions Menu
Next are the audit questions that are defined and grouped according to the processes and
functions as shown in figure5.8. There are five fields in the project audit form. Question ID
is used for making the connection between the related tables. For each question, one
appropriate process and function should be assigned. Also, the question should be clearly
explained and additional information related to that question may be added. Furthermore, in
order to increase the accuracy of the audit, some of the available documents should be
checked and reviewed by the auditor. The number of questions and related documents is
flexible and can be changed based on the auditor need and choice as shown in figure 5.8.
Page 97
83
Figure 5.8: Project audit the questions form
Up to here, the user has been able to enter the project information and related data into the
model. There are 59 pre-defined questions in the model and there is a specific report that
presents these questions. The user can add or modify the data in this part if it is required.
5.4. Plan (schedule) a Project Audit
In this step, the user can plan and schedule the project audit. Because the audit of the case
project covers processes, functions, and performance, the comprehensive audit is selected
from the menu. There are two options in the “Plan Audit” form, comprehensive audit and
quick audit as shown in figure 5.9.
Page 98
84
Figure 5.9: Plan a project audit selection menu
When the user selects comprehensive audit and click on the Open Audit Plan button, the
form will be opened. There are several fields that should be filled in that form. Audit ID is
a six character field in which the first four characters are for the year and the two other
characters present the number of the audit in that year. For that actual project the ID is
201402. The date that the audit will be implemented and the project name should also be
entered in this case it is 01/06/2014.
To see the name of a specific project here, the project information form should be
completed in advance. The project that is going to be audited is in the construction stage.
At this time, there are no documents to be added in the Scanned Doc. In the last field, the
appropriate questions should be selected. Because this is a comprehensive audit, questions
1 to 59 have to be copied from the “Audit Questions” menu to the Question ID field and
Page 99
85
Audit ID and the Question Description will be completed automatically as viewed in figure
5.10.
Figure 5.10: Plan a comprehensive project audit from
As previously mentioned, a comprehensive audit is implemented for our case project. But,
if the user wants to have a quick audit, he/she would select the second type of audit, Quick
Audit. This audit lets the user assess a specific process or function in the project, for
example, project risk. When the risk function is chosen, two forms will be opened at the
same time; the audit plan form and the question list. The first form is similar to what
explained for the comprehensive audit form, but the second form will be opened to help the
user to copy and paste the numbers related to risk. Figure 5.11 shows this process.
Page 100
86
Figure 5.11: A sample to plan a quick project audit form for another project
5.5. Input Project Audit Results
There are two types of data that should be entered in the model to be analyzed: inputting
the answer of the audit questions; updating the project progress. Usually, there is a project
management office in any project oriented organization that supports project managers
during the project lifecycle and it is the responsibility of that office to perform project
audits. Therefore, all the project audit information is entered by that office into the
developed model. In the main menu, first, the user should click on “Record Audit Result”
button and after that one of the two options can be selected as shown in figure 5.12. For our
project, first, the answers to the audit questions are inputted and after that the project plan
progress is updated.
Page 101
87
Figure 5.12: Input project audit results selection menu
Clicking on the “Question Results” button, the model asks to input the audit ID to pull up
the related data as shown in figure 5.13. Number 201402 is inputted as previously defined.
Figure 5.13: Selecting question part of the audit
The record audit result menu has four fields where three of them were already defined and
selected as shown in figure 5.14. Here the project Audit ID is checked in order to make sure
that the right project has been selected. Accordingly, the related questions are selected in
Page 102
88
the Audit Questions menu. Based on the requirements of each question, the user can choose
a score between 1 and 10. As explained earlier, there are some documents related to each
question that should be reviewed during the audit. The score for each question depends on
the judgment of the auditor when he/she reviews these documents and observes enough
evidence.
Figure 5.14: Input result of the questions form
5.6. Reports
Once all the audit data is entered, the model will analyse all these data and generate two
different types of reports: 1) Main Reports; 2) Analytical Reports.
The main reports include reports from all information that is entered in the model by using
the Related Information menu. When the user clicks on the Reports button, another menu is
opened allowing the user to select which types of reports he/she needs as illustrated in
figure 5.15. In the following section, all the types of reports will be generated so that to
validate the model workability.
Page 103
89
Figure 5.15: Report selection menu
As shown in figure 5.15, the user can click on the “Main Report” button to open a menu
that contains all the related information reports, as illustrated in figure 5.16.
Figure 5.16: Main report selection form
Page 104
90
When the user clicks on “Project Information,” the model needs a project code to generate
the report. In the actual project, project code is EPC002 as illustrated in figure 5.17.
Figure 5.17: Project information report
There is a report about the project functions in this model. As shown in figure 5.18 the user
can click on the “Project Function” button. Also, as shown in figure 5.19 the user can click
on the “Project Process” button.
Page 105
91
Figure 5.18: Project functions report
Figure 5.19: Project Processes report
Construction project stages and contract type reports are generated when the user clicks on
“Construction Stage” and “Contract Type” respectively as shown in figure 5.20.
Page 106
92
Two other useful reports in this model are a quantitative report of the project documents
and a score category report. The first report shows how many documents should be
prepared in the process and function. The second report shows the scoring level preferences
that the user can follow in the audit model. Figure 5.21 illustrates these reports.
Figure 5.20: Project stages and contract types
Page 107
93
Figure 5.21: Audit scoring level and number of audit documents report
From the main report menu user can print a report of all questions in a simple format,
which is very useful for the auditor to look at during the audit as shown in figure 5.22. In
the actual project, 51 questions are selected for the project audit.
Page 108
94
Figure 5.22: List of audit model questions report
The model can generate another type of report for the project questions in the audit format.
In the audit format, the report shows the project process and project function that the
question is related to. Also, in this format, the auditor can select a score between 0 and 9 as
shown in figure 5.23.
Figure 5.23: Comprehensive audit questions with audit format report
Page 109
95
The last report in this menu is a list of all project audit documents which are important to
be generated in every construction project as shown in figure 5.24. The list of all project
documents is useful for future project so that the project team can provide many of them
before starting the project.
Figure 4.24: List of audit model documents report
The analytical reports of the model have been divided in two categories; audit questions
and progress performance. As shown in figure 5.25, all analytical reports are generated
from this menu. The auditors consider a score according to the scoring level for each
answer. The model calculates the total score for project processes and functions.
Page 110
96
Figure 5.25: Analytical report selection menu
Figure 5.26 shows the analytical results of the Refinery Gas project processes, in June
2014. The score in initiating, planning, executing, monitoring and controlling, and closing
are 33.3%, 44.9%, 58.1%, 44.4%, and 44.4% respectively. Based on table 3.13 in page 72,
score interpretation guideline, except for initiating, which has a bad status, the other project
processes have medium status.
Figure 5.26: Analytical report of project processes
Page 111
97
Figure 5.27 shows the analytical results of project functions. The scores in Integration,
Scope, Time, Cost, Quality/Safety, Human Resource, Communication, Risk, and
Procurement are 40%, 50%, 39.5%, 42.9%, 72.2%, 72.2%, 62.2%, 30.1%, and 49.2%
respectively. Except for time and risk, which have a “bad” status, other functions of the
case project have “medium” or “good” status.
Figure 5.27: Analytical report of project functions
Project performance reports also can be generated by the model. These reports represent all
the analytical indices of the project based on the project plan that was input into the model
during the first step. Clicking on the “Performance Graph” button in figure 5.25, the model
opens an Excel worksheet that includes all performance indices based on the project plan.
Integrated time and cost graphs help project managers to measure the current performance
of the project and forecast the future status.
Page 112
98
Figure 5.28 shows the three important values, BCWS, BCWP, and ACWP. As explained
earlier, BCWP indicates budgeted cost of the work performed at a specific point in time.
BCWS describes the budgeted cost of work as scheduled before starting the
implementation. It is a number that presents the budgeted work that is scheduled. ACWP is
the actual cost of the work performed to date.
Figure 5.28: Earned value main indices
In Figure 5.29, the model forecasts the future costs of this project if it continues with the
current performance. The red dot-line shows the forecast of the project cost to complete the
project.
Page 113
99
Figure 5.29: Earned value main indices with forecast
Two other graphs shown in figures 5.30 and 5.31 are generated by the model. The trend of
the cost performance index (CPI) and schedule performance index (SPI) are less than 1,
which is not good, and they were fluctuating between 0.5 and 0.9.
Also, the trend of Cost Variance (CV) and Schedule Variance (SV) shows negative values
for these two factors, which is not good for the project performance.
Page 114
100
Figure 5.30: Schedule performance index (SPI) and Cost performance index (CPI) trend
Figure 5.31: Schedule variance (SV) and Cost variance (CV) trend
The model as well can generate a comprehensive report of the project performance indices,
which contains useful data and an interpretation of these results. If users click on “All
Performance Data” button, two related data should be entered in the model: 1) audit ID; and
Page 115
101
2) audit date. For the real case project Audit ID is 201402 and 23/05/2014 is entered in the
box as shown in figure 5.32.
Figure 5.32: Project performance analytical report selection menu
For example, in August 2013, the project schedule variance (SV) is a negative number and
the Schedule Performance Index (SPI) is a number less than 1 as shown in figure 5.33.
These indices support the finding that the project is behind schedule. Also, indices related
to cost performance, project cost variance (CV) and Cost Performance Index (CPI) are
negative and less than 1 respectively. This means that the project is over budget. The value
of ETC (t), which represents the estimated time to completion, is 55 months. Computing 55
months to the project planned duration, of 48 months means that with the current
performance the project will take seven months more than had been planned. Cost forecast
value also show that the project needs $105,831,190 from the project audit date,
2013/06/01, to be completed. This means the project final cost will be $299,113,636 instead
of the $214,000,000 as planned, which means an extra cost of $85,113,636 from what is
estimated as seen in figure 5.33.
Page 116
102
Figure 5.33: Project performance analytical report with comment
The system provides a guideline for interpretation of earned value indices if the user clicks
on the blue question mark sign on the top-right of the form as shown in figure 5.34.
Figure 5.34: Project performance analytical guideline
Page 117
103
Whereas Figures 5.35 through 5.38 show another types of the analytical results of both the
project function and project process. These figures clearly show that only the Except
Quality/Safety and Human Resources have good status while the other project functions are
either in the medium or bad level. Also, all the project processes have a medium status.
That specific project has only the executing process scored more than 50% (58.12%)
whereas the rest of the processes scored less than 50%.
These graphs indicate that the project is not fully complying with the project management
standards. Appropriate project management policies, procedures, and templates should be
developed and applied to improve the scores of the project’s functions and processes. For
example, risk management procedures should be developed to identify, categorise, analyse,
respond, and monitor project risks.
Figure 5.35: Project function status model I
Page 118
104
Figure 5.36: Project function status model II
Figure 5.37: Project process status model I
Page 119
105
Figure 5.38: Project process status model II
Based on all the foregoing graphs and analytical reports generated for that specific project it
is recommended to take the following corrective actions:
Using crashing methods and techniques in order to shorten the project’s schedule by
adding resources, although, this may increase the risk and/or cost,
Reviewing all the direct and indirect costs ( labor, materials, equipment, services,
facilities, information technology, and special categories such as cost of financing
(including interest charges), an inflation allowance, exchange rates) for every single
activity on the project,
Reviewing the project’s time and cost contingency reserves,
Page 120
106
Monitoring all projects’ expenditures to ensure that they do not exceed the
authorized budget,
Managing the approved changes whenever they occur,
Preventing the implementation of unapproved changes,
Informing appropriate stakeholders about all the costs that are related to approved
changes,
Identifying and applying appropriate project management methodologies and
standards,
Providing continuous project management coaching, mentoring, training, and
oversight for the whole project team,
Performing periodic project audit to monitor the project performance trend,
Developing and applying appropriate project policies, procedures, and templates,
Developing procedures to control, receive, review, approve/reject, and validate
changes,
Developing procedures for risk management, including risk identification, risk
analysis, and risk control.
Finally, the model has a valuable functionality, which is able to export all the project data
to other formats such as XLS, PDF, and HTML as shown in figure 5.39. The XLS format
provides the opportunity to analyse the project performance more deeply and more
professionally. The PDF format is useful because it helps to combine different reports
together and present them in one report. The HTML format allows sharing the project data
with other departments and displaying it in different locations through the Internet.
Page 121
107
Figure 5.39: Data export selection menu
5.7. Summary
This chapter validated the capability and workability of the developed model by auditing an
actual project. The project audit results are generated through two sets of reports: 1) audit
questions; 2) progress performance. The model provided different analytical values (i.e.
CPI, CV, SPI, and SV) the results of which supported each other. Also, some other values
(i.e. ETC, EAC, VAC) are forecasted to predict the future situation of the project based on
the cost and time constraints. Therefore, this model not only assesses the project process
and function status but also calculates project performance through series of indices that
can help project managers make timely decisions. Furthermore, the model provides
valuable analytical information of the project that reflects the current status of the project.
Also, auditor can provide appropriate recommendations to address the project low
performance. Based on those recommendations and the audit results, several corrective
actions should be taken to improve the project performance.
Page 122
108
Chapter Six
Conclusion and Recommendations
6.1. Conclusion
A project audit provides the opportunity for the project team, especially the project
manager and project sponsor, to find the problems, concerns, and challenges raised during
the project life cycle including basic design, detail design, construction, and turn over. The
audit increases the chance for the project team to discover what has gone well and what
needs to be dealt with as soon as possible to successfully complete the project.
This thesis described the steps followed in developing an integrated model for construction
project audit during the project life cycle. The model is developed based on the advantages
and excluding the disadvantages of other project audit and improvement models. The
model provides the opportunity to design organized and integrated tables. With this model
all project data can be stored and pulled up anytime even after the project implementation.
Reviewing the project audit results during the project implementation helps the project
manager to find project problems, issues, and concerns and to try to address them on time.
Furthermore, the audit results are documented as lessons learned of each project for
consideration in future projects. The developed model has the following advantages:
1. Assessing all aspects of a project (process, function, progress performance),
2. Reporting critical project performance factors at the same time,
3. Ability to customise the audit to do a comprehensive audit or quick audit,
4. Applicable to all project stages and compatible with the project life cycle,
Page 123
109
5. Covers all project processes and functions,
6. Having a clear questionnaire and scoring system,
7. A workable and reliable model is developed by using Visual Basic programming
along with Microsoft Access 2010 and Microsoft Excel 2010,
8. The users can plan, schedule, and implement a project audit with this model and
analyse the results within a minimal time frame,
9. Different project stakeholders (i.e. owners, project manager, project team) can use
this model ,
10. The model can forecast the time and cost required to complete the project,
11. The model is able to store project historical data
12. The model is user friendly, flexible, reliable and executes quick calculations, and
13. The model has ability to modify and add information
14. The model can be used to audit any construction project regardless of its location
6.2- Research Contributions
The intention of developing this model is to help project stakeholders to track project
performance and find project issues, problems, and concerns through several types of
useful reports. Also, the model can accurately show the trend of the project’s performance
during its life cycle and it helps to find if the project is on the right track. This research has
the following contributions:
1. An integrated model has been developed in which project processes performance,
functions performance, and project indices are computed to audit projects.
2. Project processes and project functions are integrated and measured through series
of specific questions.
Page 124
110
3. A trend of project functions and processes performance can be showed during
project lifecycle. It represents project management weaknesses and strengths which
are very important factors for project oriented companies.
6.3- Limitations of the Developed Model
The developed model holds some limitations related to the lack of information and
explanation (structure, scoring system, specification, or questionnaire) for some project
audit models. This model has not been developed to provide cost estimation of the project
activities. Also, it cannot be used for technical audit such and civil or electrical audits
which need specific information related to project execution. The model can be used in
construction projects.
6.4- Recommendations for Future Expansion
Although a fully integrated project audit model was developed, the model can be enhanced
by adding the following features:
1. Adding other project functions to the model (i.e. claim, finance, environment)
2. Adding the fourth aspect of the construction project to the model (i.e. piping,
electrical, welding)
3. Using other forecasting models for project performance
4. Providing other type of reports based on the project’s Work Breakdown Structure
(WBS). In this case, the project can be divided to sub-projects (small projects) and
therefore the model would report the performance of each of them.
Page 125
111
References
Albrecht, J. and Spang, K. (2014), “Project Complexity as an Influence Factor on the
Balance of Costs and Benefits in Project Management Maturity Modeling” Social
and Behavioral Sciences Journal, 27th IPMA World Congress, Vol. 119, pp. 162 –
171
Atkinson, R. (1999), “Project Management: Cost, Time and Quality, Two Best Guesses and
A Phenomenon, Its Time to Accept Other Success Criteria” International Journal
of Project Management, Vol. 17 (6), pp. 337–342.
Bassioni, H.A., Price, A.D.F., Hassan, T.M. (2004), “Performance Measurement in
Construction” Journal of Management in Engineering 20 (2), ASCE, pp. 42–50.
Bates, A. and Coles, A. J. (2012), “Audit Provisions in Private Construction Contracts”
Journal of the American College of Construction (ACCL), Vol. 6, No 2
Bolles, D. (2002), “Building Project Management Centers of Excellence” AMACOM, Vol
1, US
Bureau of Indian Standards, (2003), “Quality Management Systems-Guidelines for Quality
Management in Projects - ISO10006”, India
Chou, J. and Yang, J. (2012), “Project Management Knowledge and Effects on
Construction Project Outcomes: An Empirical Study” Project Management
Journal, Vol. 43, No. 5, pp. 47–67
Devaux, S. A. (1999), “The Total Project Control: A Guide to Integrated Project Planning,
Measuring, and Control”, USA
Page 126
112
Din, S., Abd-Hamid, Z., Bryde, D. J. (2011), “ISO 9000 Certification and Construction
Project Performance: The Malaysian Experience” International Journal of Project
Management, Vol. 29, pp. 1044–1056
Hamedni, N. and Maddah, R. (2007), “Description of Process and Construction Units of
Sough Gas Refineries”, Iran
Jaafari, A. (2007), “Project and program diagnostics: A systemic approach” International
Journal of Project Management, Vol. 25, pp. 781–790
Kerzner, H (2004), “Advanced Project Management: Best Practices on Implementation”,
Second edition, USA
Kerzner, H. (2001), “Strategic Planning for Project Management Using a Project
Management Maturity Model”, USA
Kwak, Y. H. and C. W. Ibbs (2000), “Calculating Project Management's Return on
Investment” Project Management Journal, Vol. 31, Issue 2, p 38
Lester, A. (2014), “Project Management, Planning, and Control: Managing Engineering,
Construction, and Manufacturing Projects to PMI, APM, and BSI Standards”, UK
Marques, G., Gourc, D., Lauras, M. (2010), “Multi-criteria Performance Analysis for
Decision Making in Project Management” International Journal of Project
Management, Vol. 29, pp. 1057–1069
McDonald, J. (2002), “Project Management Audits: Update and Experience Report” The
Journal of Systems and Software, Vol. 64 (2002), pp. 247–255
Mian, D.M., Sherman, S. R., Humphreys, M. F., & Sidwell, A. C. (2004), “Construction
Projects Immediate Health Check: A CSF & KPI Approach” Project Management
Australia conference, Melbourne, 2004
Page 127
113
Michigan Office of Project Management, (2000), “Project Management Methodology”,
USA
Möller, T. (2005), “GPM – Deutsche Gesellschaft für Projekt Management”, Germany
Murray, A. (2006), “Capability Maturity Models – Using P3M3 to Improve Performance”,
Outperform UK Limited, UK
Nalewaika, A. and Millsb, A. (2014), “An Analysis of Project Performance
Methodologies,” Journal of Social and Behavioral Sciences, Vol. 119, pp. 105 –
114
Office of Government Commerce (OGC), (2006), “Portfolio, Programme & Project
Management Maturity Model (P3M3)”, UK, (http:/www.ogc.gov.uk/)
Project Management Institute, (2000), “Project Management Body of Knowledge”, USA
Project Management Institute, (2007), “Construction Extension to the Project Management
Body of Knowledge Guide”, USA
Project Management Institute, (2008), “Organizational Project Management Maturity
Model (OPM3)”, Second Edition, USA
Project Management Institute, (2012), “Project Management Body of Knowledge”, USA
Ruskin, A. M. and Estes, W. E. (1984), “The Project Management Audit: Its Role and
Conduct” Engineering Management International Journal, Vol. 2, pp. 279-286
Smith, N.J. (2002), “Engineering Project Management”, Second Edition, USA
Spinner M. P. (1997), “Project Management Principles and Practices”, USA
Takim, R. and Akintoye, A. (2002), “Performance Indicators for Successful Construction
Project Performance” Association of Researchers in Construction Management,
Vol. 2, pp. 545-55.
Page 128
114
The National Institute for Further Education, (2010), “Project Audit Methodology”,
Netherlands
Walker, A. (2002), “Project Management in Construction” Fourth edition, UK
Wang, Y. and Kong, S. (2012), “Applying Genetic Algorithms for Construction Quality
Auditor Assignment in Public Construction Projects” Automation in Construction
Journal, Vol. 22 (12), pp. 459–467
Westerveld, E. (2003), The Project Excellence Model: linking success criteria and critical
success factors, International Journal of Project Management, 21 (2003) 411–418
Williams, G. (2013), “PRINCE2 Maturity Model (P2MM)”, GSW Consultancy Limited,
UK
Woodward, J. F. (1997), “Construction Project Management: Getting it right first time”,
USA
Wysocki, R. K. (2004), “Project Management Process Improvement”, USA
Young, R and Poon, S (2013), “Top Management Support—Almost Always Necessary and
Sometimes Sufficient for Success: Findings from a Fuzzy Set Analysis”
International Journal of Project Management, Vol. 31, pp. 943–957