AC 2009-670: AN INTEGRATED UNDERGRADUATE BIOMEDICALENGINEERING LABORATORY COURSE
Conrad Zapanta, Carnegie Mellon UniversityConrad M. Zapanta is the Associate Department Head and an Associate Teaching Professor in theDepartment of Biomedical Engineering at Carnegie Mellon University in Pittsburgh, PA. Dr.Zapanta received his Ph.D. in Bioengineering from the Pennsylvania State University inUniversity Park, PA, and his B.S. in Mechanical Engineering (with an option in BiomedicalEngineering) from Carnegie Mellon University. Dr. Zapanta has served as a Visiting AssistantProfessor of Engineering at Hope College in Holland, MI, an Adjunct Professor of Engineering atAustin Community College in Austin, TX, and an Assistant Professor of Surgery andBioengineering at The Pennsylvania State University in Hershey, PA. He also worked forCarboMedics Inc. in Austin, TX, in the research and development of prosthetic heart valves.
Dr. Zapanta’s primary teaching responsibility is to develop laboratory classes for undergraduatesin the Department of Biomedical Engineering. Additional teaching interests include medicaldevice design education, biomedical engineering design, and professional issues in biomedicalengineering. Dr. Zapanta’s responsibilities as Associate Department head include coordination ofundergraduate curriculum, undergraduate student advising, and class scheduling.
Dr. Zapanta’s research interests are in developing medical devices to treat cardiovascular disease,focusing on the areas of cardiac assist devices and prosthetic heart valves.
Dr. Zapanta is an active member in the American Society for Artificial Internal Organs, AmericanSociety of Mechanical Engineers, and the American Society for Engineering Education. He is areviewer for several biomedical engineering journals. Dr. Zapanta also serves as a reviewer forthe National Institute of Health (NIH), Cardiovascular Sciences Small Business Special EmphasisPanel.
Warren Ruder, Carnegie Mellon UniversityWarren Ruder is a graduate student researcher at Carnegie Mellon University in Pittsburgh, PA.Warren is completing a Ph.D. in Biomedical Engineering at Carnegie Mellon where he previouslyearned an M.S. in Mechanical Engineering. He received his S.B. in Civil Engineering from theMassachusetts Institute of Technology. Previously, Warren served as a Health Science Specialistin the VA Boston Healthcare System, affiliated with Harvard Medical School, studying cellphysiology and signaling processes. Warren’s research interests include cell mechanics, stem celltherapy, bio-MEMS/NEMS design, microfluidics, and mechanotransduction.
Justin Newberg, Carnegie Mellon UniversityJustin Y. Newberg is a doctoral candidate in Biomedical Engineering at Carnegie MellonUniversity in Pittsburgh, PA. He received his B.S. in Biomedical Engineering at Johns HopkinsUniversity in Baltimore, MD. At Carnegie Mellon, Justin was a recipient of the BiomedicalEngineering Department's teaching assistant award in 2007. Justin's research interests includeusing machine learning to automatically analyze subcellular protein patterns in various differentconditions.
Paul Glass, Carnegie Mellon UniversityPaul Glass received the B.Eng. degree in mechanical engineering (with a minor in arts) fromMcGill University, Montreal, QC, Canada, in 2005. He is currently working toward the Ph.D.degree in biomedical engineering at the NanoRobotics Laboratory, Carnegie Mellon University,Pittsburgh, PA. His current research interests include medical robots, biologically inspiredadhesives, and minimally invasive surgical technologies. Mr. Glass was awarded a Dowd-ICESFellowship at Carnegie Mellon University in 2006.
Davneet Minhas, Carnegie Mellon UniversityDavneet Minhas is a Ph.D. candidate in Biomedical Engineering. He is developing a flexibleneedle steering system for percutaneous navigation within deep zones of the brain. He received aB.S. in Biomedical Engineering from Johns Hopkins University.
Elvira Garcia Osuna, Carnegie Mellon UniversityElvira Garcia Osuna is a Special Lecturer for the Ray and Stephanie Lane Center forComputational Biology and the Joint CMU-Pitt Ph.D. Program in Computational Biology. Dr.Garcia Osuna received her Ph.D. in Biomedical Engineering from Carnegie Mellon University inPittsburgh, PA. She received her B.E. degree in Engineering Science with a specialization inBiomedical Engineering from Hofstra University in Hempstead, NY. Dr. Garcia Osuna's researchinterests include Bioimage Processing, Machine Learning, Microscopy and Flow Cytometry.
Liang Tso Sun, Carnegie Mellon UniversityLiang Tso (Steve) Sun is a PhD candidate in Department of Biomedical Engineering at CarnegieMellon University in Pittsburgh, PA. Sun received his B.S. in Biochemistry from University ofWashington in Seattle, WA. Sun's research interests include bioactive materials and stem celldelivery for wound healing applications.
Alyssa Siefert, Carnegie Mellon UniversityAlyssa Siefert is a senior at Carnegie Mellon University who will graduate in May with a dualdegree in Chemical and Biomedical Engineering and a minor in Professional Writing. She will goon to pursue a Ph.D. in Biomedical Engineering at Yale University in the Fall of 2009.
Judy Shum, Carnegie Mellon UniversityJudy Shum is a doctoral candidate in Biomedical Engineering at Carnegie Mellon University inPittsburgh, PA. She received his B.S. in Electrical Engineering at Bucknell University and herM.E. at Worcester Polytechnic Institute. Judy's research interest include developing a diagnostictool to assess the rupture potential of abdominal aortic aneurysms through the use of imageprocessing techniques.
Portia Taylor, Carnegie Mellon UniversityPortia E. Taylor is a PhD student in the Biomedical Engineering Department at Carnegie MellonUniversity. Portia received her B.S. in Computer Science from Grambling State University in2007. Portia is a recipient of the NSF Graduate Research Fellowship as well as the GEMConsortium Graduate Fellowship. She serves as student leader and Recruitment Coordinator forthe NSF funded Quality of Life Technology Center. Portia's research interests includerehabilitation assistive devices, activity classification, and neural prothesis.
Arielle Drummond, Carnegie Mellon UniversityArielle Drummond is currently a Senior Scientist at Medtronic Cardiovascular in Danvers, MA inresearch and development of transcatheter therapies. Dr. Drummond received her Ph.D. inBiomedical Engineering from Carnegie Mellon University in Pittsburgh, PA and her B.S and M.Sfrom the University of North Carolina at Chapel Hill. Dr. Drummond’s research interest includecirculatory support devices, anatomic modeling and cardiovascular fluid dynamics.
Bur Chu, Carnegie Mellon UniversityBur Chu is a doctoral candidate in Biomedical Engineering at Carnegie Mellon University inPittsburgh, PA. She received her B.S. in Chemical Engineering with an additional degree inBiomedical Engineering. Her research interests include biomimetic tissue engineered materialsand muscoloskeletal tissue repair and regeneration.
Describes purpose of the experiment, key findings, /5
significance, and major conclusions
Introduction /15
Successfully establishes the scientific concept of the lab /5
Effectively presents the objectives and purpose of the lab /10
Materials and Methods /15
Lists all materials /5
Describes experimental procedure in paragraph form /10
Results /20
Summarizes all significant results explicitly in verbal form /5
Includes clear, easily read, and well labeled graphics /5
Provides sample calculations /5
Lists raw data or reference to raw data /5
Discussion /20
Relate results to your experimental objectives /5
Analyze the strengths and limitations of your experimental design /5
Sufficiently addresses other issues pertinent to lab /10
Conclusion /10
Convincingly describes what has been learned in the lab /5
Suggest future work /5
Presentation /10
Citations and references used appropriately /3
Report is written in scientific style: clear and to the point /2
Grammar and spelling are correct /5
Total Score /100
Table 4: Sample Lab Report Grading Rubric
Page 14.200.9
Additional introductory lectures cover Good Laboratory Practices, health and safety by the
University Biological Safety Officer, data recording and handling, and data analysis. The data
analysis lectures consist of a hands-on tutorial on MATLAB (, Natick, MA). These tutorials are
intended for those who have never used or have little experience with MATLAB. This
MATLAB tutorial consists of the online tutorials provided by The MathWorks (“Navigating the
MATLAB Desktop” and “MATLAB Fundamentals”) as well as using scripts that illustrate
functions and procedures that will be used in subsequent laboratory modules. These include
mathematical operators, trigonometric and exponential functions, how to use the HELP Menu,
assigning variables, manipulating vectors and matrices, plotting curves and surfaces, writing M-
files, and the use of the image processing and signal processing toolboxes.
3.2 Cellular and Molecular Biotechnology Module
The cellular and molecular biotechnology module is made up of two labs: Introduction to the
Biological Laboratory and GFP (Green Fluorescent Protein) Transformation of E. Coli using the
pGLO Plasmid.
3.2.1 Introduction to the Biological Laboratory: One of the keys to successfully culture
cells is the proper use of aseptic (sterile) techniques. Many of the tasks in this course (such as
cell transformation and cell plating) involve the sterile transfer of fluid from one container to
another. This typically involves the use of pipet aids and micropipettes. In this one-day
laboratory, the students practice the proper use of these instruments and other techniques
necessary in the biological laboratory environment.
In the first part of this lab, the density of water is calculated by dispensing volumes of water (10,
50, 250, and 1000 µL) using micropipettes for various ranges (0.1 to 10 µL, 10 to 100 µL, and
100 to 1000 µL). These volumes are then weighed using an analytical balance. The same
procedure is then followed, but instead using a pipet aid for 1 mL and 5 mL volumes of water.
Five measurements are taken for each volume of water (except for the 1000 µL volume) using
the micropipette and pipet aid. For the 1000 µL volume using the micropipette, ten
measurements are taken. The students then compute the mean and standard deviation of the
density of water for each volume. This permits the students to compare each volumetric
measurement to each other and standard density value, and determine the effect of sample size.
Figure 1 illustrates an example of the density results from this part of the lab.
Page 14.200.10
The second part of the laboratory involves practicing techniques that involve the manipulation of
cells. These techniques include feeding cells, media aspiration, cell resuspension, and cell
plating. These exercises are conducted in a biological safety cabinet under sterile conditions.
The process of feeding cells is replicated by adding 5 mL of the green sample solution (green
food coloring and water) into a T-25 flask in 0.5 mL aliquots using a pipet aid. The students are
instructed not to dispense liquid on the angled portion of the T-25 flask and not to turn the flask
upside down or shake it around vigorously. Media aspiration is simulated by aspirating green
sample solution from a T-25 flask with a 1 mL pipette and a pipet aid. The students are
instructed to suction liquid from the flask while minimizing contact of the pipet with the flask.
Cell resuspension is simulated by first filling a 5 mL pipet (using a pipet aid) with 4 mL of green
sample solution. A 1 mL volume is then released from pipet into a T-25 flask. The solution is
sucked back into the pipet. A 1 to 2 mL volume is then released from the pipet. The solution is
then sucked back into the pipet. This process is repeated three to five times. Finally, all liquid is
released into the T-25 flask. The students are instructed to suck up from the bottom of the flask
and release liquid to the top and to minimize mixing with air and bubble formation.
Cell plating is simulated by transferring 200 µL of yellow sample solution (yellow food coloring
and water) using a micropipette into all 12 wells of a 12-well plate. The students are instructed
to release the liquid in the center of the well. The addition of cell media is simulated by the
addition of 200 µL of the blue sample solution (blue food coloring and water) into each of the
wells with yellow sample solution. The aspiration of cell media from well plates is simulated by
aspirating the solution from the wells using a 1000 µL micropipette. The students are instructed
to tilt the well plate slightly toward them to pool liquid when aspirating from each well of the
Figure 1: Example of Densities of Water using Micropipettes and Pipet Aids
Error bars represent one standard deviation
Page 14.200.11
well plate and to place the micropipette tip as close to the wall of well as possible to minimize
disturbance of the cells attached to the bottom of the well.
3.2.2 GFP Transformation of E. Coli using the pGLO Plasmid: The second lab in the
cellular and molecular biotechnology module involves transforming bacteria. In this two-day
lab, the students perform a procedure known as genetic transformation. Genetic transformation
literally means change caused by genes, and involves the insertion of a gene into an organism in
order to change the organism’s trait. The students use a procedure to transform bacteria (E. coli
(HB101:K12)) with a gene that codes for Green Fluorescent Protein (GFP). This is a common
procedure used in biological laboratories. The real-life source of this gene is the bioluminescent
jellyfish Aequorea victoria. Green Fluorescent Protein causes the jellyfish to fluoresce and glow
in the dark. Following the transformation procedure, the bacteria should express their newly
acquired jellyfish gene and produce the fluorescent protein, which causes them to glow a brilliant
green color under ultraviolet light.
On the first day of the lab, the students label one micro centrifuge tube “+pGLO” and the other
tube “–pGLO.” A volume of 250 µL of the transformation solution (calcium chloride) is then
added to each of the micro centrifuge tubes. The calcium chloride solution prepares cell walls to
become permeable to plasmid DNA. The two tubes are placed on ice. A sterile loop is then used
to transfer a single E. coli colony from a starter plate and into each of the two micro centrifuge
tubes.
A volume of 10 µL of the pGLO plasmid/DNA solution is then added to the tube labeled
+pGLO. It should be noted that the pGLO plasmid is not added to the tube “–pGLO.” The
pGLO plasmid is manufactured by BioRad (Hercules, CA). This plasmid encodes both the gene
for GFP and the gene for resistance to ampicillin. The pGLO plasmid also incorporates a special
gene regulation system, which can be used to control expression of the fluorescent protein in
transformed cells. The gene for GFP can be switched on in transformed cells by adding the
sugar arabinose to the cells’ nutrient medium. The +pGLO and -pGLO tubes are then incubated
on ice for 10 minutes.
A heat-shock treatment is used to force the pGLO plasmid into the E. coli cells. Both tubes are
transferred from ice to a water bath at 42°C for 50 seconds and then transferred back to ice for
two minutes. Both tubes are then removed from the ice and transferred to the lab bench at room
temperature. A volume of 250 µL of LB (Luria and Bertani) liquid nutrient solution is then
added to each tube.
After incubating at 10 minutes at room temperature, 100 µL of the +pGLO solution is added to
an agar plate containing LB solid nutrients and ampicillin (an antibiotic) and another agar plate
containing LB solid nutrients, ampicillin, and arabinose (a sugar). A volume of 100 µL of the –
pGLO solution is added to an agar plate containing LB solid nutrients and ampicillin and another
agar plate containing LB solid nutrients only. All four agar plates are then stacked and taped
together and then placed upside down in an incubator at 37°C for 24 hours. The plates are then
stored in a refrigerator until the second day of the lab.
Page 14.200.12
On the second day of the lab, the plates are removed from the refrigerator and examined. Figure
2 illustrates the results that are observed if the experiment is successful.
Material on Agar Plates
Diagram Observations
pGLO plasmid
LB/ampicillin
E. coli colonies are visible. The color of the colonies is yellowish white under normal lighting, and does not change under ultraviolet lighting. The pGLO plasmid expresses antibiotic resistance that permits bacterial growth despite the presence of ampicillin.
Tra
nsf
orm
ati
on
Pla
tes
pGLO plasmid
LB/ampicillin/arabinose
E. coli colonies are visible. The color of the colonies is yellowish white under normal lighting, but turns green under ultraviolet lighting due to the presence of arabinose. The pGLO plasmid expresses antibiotic resistance that permits bacterial growth despite the presence of ampicillin.
LB/ ampicillin This plate had no bacterial growth. The plate is clear under both normal light and ultraviolet lighting. There is no bacteria colony on the plate due to the ampicillin.
Con
tro
l p
late
s
LB
Bacterial growth is prevalent over the entire plate. The color of the colonies is yellowish white under normal lighting, and does not change under ultraviolet lighting.
Figure 2: Results from Successful GFP Transformation of E. Coli using the pGLO Plasmid
A successful experiment is represented by the presence of colonies on the agar plates that
received the pGLO plasmid (LB/ampicillin and LB/ampicillin /arabinose) and the absence of
colonies on the LB/ampicillin plate that did not receive the pGLO plasmid. Moreover, the
colonies on the LB/ampicillin/arabinose plate should fluoresce green when exposed to UV
(ultraviolet) light. The students answer several discussion questions based on their results, as
well as compare their transformation efficiencies to a known range.
Page 14.200.13
3.3 Bioinstrumentation Module
The bioinstrumentation module introduces the basics of data acquisition through the
measurement and analysis of EKG (electrocardiography) signals. This is through the use of the
CleveLabs (Cleveland, OH) Biomedical Engineering Course Kit. This kit consists of the
BioRadio 150, and the CleveLabs Laboratory Course Software package. The BioRadio is a
wireless 12-channel programmable monitor that records both physiological signals and
transducer inputs. The Laboratory Course Software provides an interface to acquire, view, and
analyze signals that are recorded by the BioRadio 150. This is a one-day lab due to a limited
number of CleveLabs workstations. As a result, two class days are required to ensure that all
students complete the lab.
Snap electrodes are placed on the test subject on the right arm, left arm, right leg, and left leg
after the skin surface is mildly abraded. The electrodes are then attached to the BioRadio 150 to
measure and record a standard three lead EKG. Lead I is measured between the right arm and
left arm. Lead II is measured between the right arm and left leg. Lead III is measured between
the right arm and left leg. The right leg serves as the ground.
For the first part of the lab, the subject is reclined in a chair with his/her feet elevated. The
subject is then instructed to relax while EKG data from lead are recorded for a 10 second
interval. Next, filter parameters are selected to remove the 60Hz noise from the signal. Usually,
a lowpass filter with a corner frequency of 20 Hz is selected. The subject is then requested to
stand with his/her arms are hung at his side without any movements. Again, the subject is
instructed to relax and remain quiet. Another 10 second segment is saved. In order to
investigate the effects of motion artifact on the EKG signal, the subject is instructed to wave
his/her left hand around in space while a 10-second EKG segment is recorded. The subject is
then instructed to wave his/her right hand around in space while another 10-second EKG
segment is recorded.
For the second part of the lab, a standard three lead ECG is used to examine different methods to
automatically compute heart rate. In the first part of this section of the lab module, the subject
sits while resting and has his/her EKG recorded for 30 seconds. The subject’s pulse is also
manually recorded (at his/her wrist) while the 30 second recording is made.
The Heart Rate Detector module (part of the CleveLabs system) is then used to computationally
determine the heart rate. The filter parameters are selected to remove 60 Hz noise using a low
pass filter at approximately 20 Hz. The students then manually vary the signal amplitude
threshold, the time that the signal remains above the amplitude threshold, and the recording time
interval. The students typically choose an amplitude threshold of approximately 700 mV for and
a time threshold of five milliseconds to isolate the QRS complex for Lead I or II. The students
discover that the heart rate detector becomes more accurate as the recording time interval
increases, as a longer interval permits more heartbeats to be used to determine heart rate
Next, the subject is requested to perform some sort of physical activity for a few minutes to
increase his/her heart rate. After the subject sits down and relaxes, the heart rate detector is run
again as an EKG file is saved as “HRexercise.” The wrist pulse is recorded manually as well.
Page 14.200.14
This is the first lab in which the students are strongly encouraged to use MATLAB to perform
data analysis. This involves filtering the EKG data and determining of the heart rate using Fast
Fourier Transforms (FFTs). Filtering is performed to remove the 60 Hz noise and isolate the
motion artifact from waving arms around. FFTs on the resting and exercising data sets reveal
that the dominant peaks that occur between 0.5 and 2.5 Hz correspond to the heart rate.
Finally, the cardiac vector is calculated using the waveforms from the sitting and standing EKG
files. The cardiac vector demonstrates how the heart position changes from sitting to standing.
This is shown in Figure 3. The blue vector is the sitting ECG and the red vector is the standing
ECG. The clinical applicability of the cardiac vector is that it is often used to detect heart
position shift due to an enlarged heart.
Figure 3: Sample Sitting (Blue) and Standing (Red) Cardiac Vectors
3.4 Bioimaging Module
In the bioimaging module, the students analyze biological images that are collected from a
fluorescent microscope. These images are from CD-tagged NIH-3T3 (mouse fibroblast) cell
lines that have been modified to produce GFP.1
This is a three-day lab module. On the first day, the students use an automated microscope to
acquire phase contrast and fluorescent images from CD-tagged NIH-3T3 cells that have been
tagged with GFP against various proteins. The images are then analyzed to determine the
number of proteins that are tagged. On the second day, the students use a confocal microscope
to acquire images from NIH-3T3 cells that have been CD-tagged with GFP against alpha-tubulin.
LysoTracker dye is also added. This dye localizes to the acidic portions of the cell, namely the
lysosomes. This dye fluoresces red when excited with green light. Therefore, the green signal
from the alpha-tubulin and red signal from the lysosomes is observed.
Page 14.200.15
The third day of the lab is used to analyze the images using MATLAB. This is done by first
adding pseudo-color to each image. A FFT of the image is then computed and used to determine
the average pixel intensity, amount of fluorescence that overlapped with the nucleus, and the
amount of fluorescence per nucleus.
Sample images from the automated and confocoal microscopes follow.
Channel 0 Channel 1
Figure 4: Sample Images from the Automated Microscope
Figure 5: Percentage overlap vs. fluorescence per nucleus for automated microscope.
Page 14.200.16
Channel 0: Blue 20 Channel 1: Red 20
Figure 6: Sample Confocal Microscope Images
Figure 7: percentage overlap vs. fluorescence per nucleus for confocal microscope.
Using the post-processing capabilities of MATLAB the students learned that how to distinctly
graphically differentiate between the different types of proteins. Each point on the graph is an
image and each distinct region of points represents a different protein pattern.
Page 14.200.17
3.5 Biomaterials Module
The biomaterials module involves the fabrication of photopolymerizable monomers and adhesion
peptides to make hydrogels of varying peptide concentrations.2 The hydrogels are composed of
PEGDM (polyethylene glycol dimethacrylates) that are prepared by a reaction of PEG and
methalacrylate (MA). ACRL-PEG-GRGDS is composed of ACRL-PEG (Acryloyl-PEG) and
GRGDS (synthetic peptide Gly-Arg-Gly-Asp-Ser). This solution mimics the cellular binding
site of many adhesive proteins in the extracellular matrix and causes spreading and attachment of
fibroblasts. Three concentrations of ACRL-PEG-GRGDS are used: 0, 0.4, and 4.0 mM. I2959
is added to the hydrogel solution serves as an ultraviolet light-sensitive photoinitiator that cross-
links the hydrogel when exposed to UV light. These solutions are prepared prior to the first day
of lab by the teaching assistants. T he biomaterials laboratory module takes three lab periods to
complete.
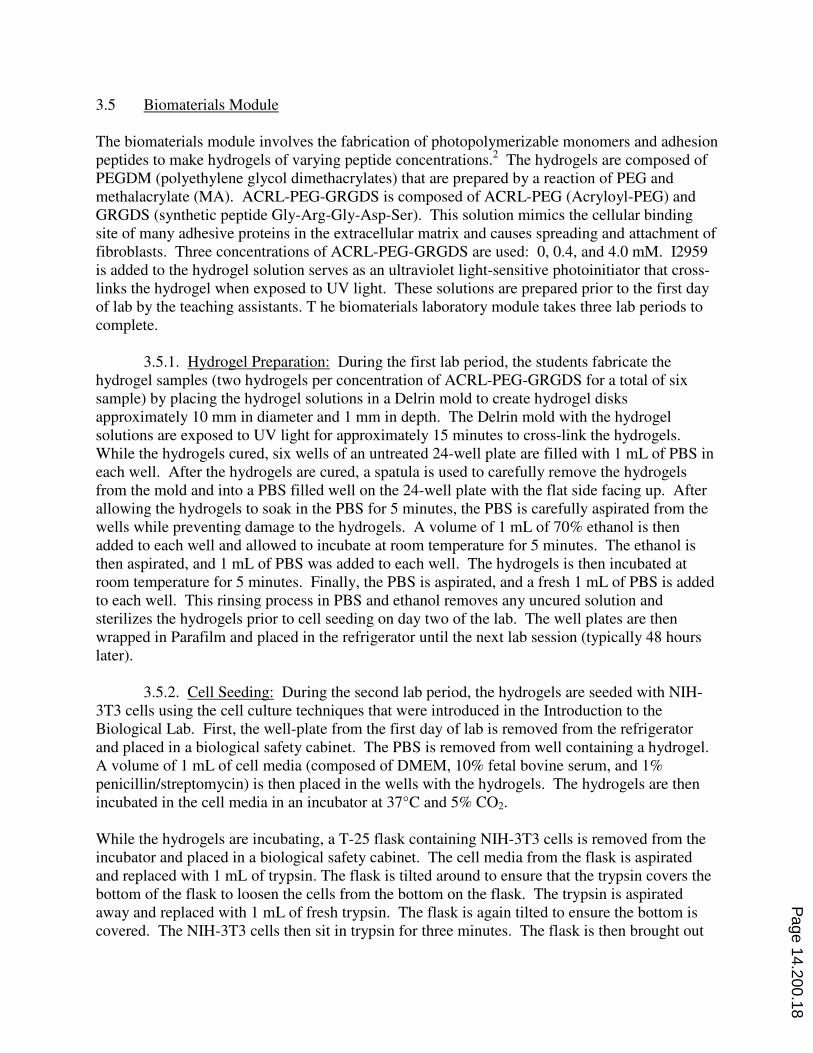
3.5.1. Hydrogel Preparation: During the first lab period, the students fabricate the
hydrogel samples (two hydrogels per concentration of ACRL-PEG-GRGDS for a total of six
sample) by placing the hydrogel solutions in a Delrin mold to create hydrogel disks
approximately 10 mm in diameter and 1 mm in depth. The Delrin mold with the hydrogel
solutions are exposed to UV light for approximately 15 minutes to cross-link the hydrogels.
While the hydrogels cured, six wells of an untreated 24-well plate are filled with 1 mL of PBS in
each well. After the hydrogels are cured, a spatula is used to carefully remove the hydrogels
from the mold and into a PBS filled well on the 24-well plate with the flat side facing up. After
allowing the hydrogels to soak in the PBS for 5 minutes, the PBS is carefully aspirated from the
wells while preventing damage to the hydrogels. A volume of 1 mL of 70% ethanol is then
added to each well and allowed to incubate at room temperature for 5 minutes. The ethanol is
then aspirated, and 1 mL of PBS was added to each well. The hydrogels is then incubated at
room temperature for 5 minutes. Finally, the PBS is aspirated, and a fresh 1 mL of PBS is added
to each well. This rinsing process in PBS and ethanol removes any uncured solution and
sterilizes the hydrogels prior to cell seeding on day two of the lab. The well plates are then
wrapped in Parafilm and placed in the refrigerator until the next lab session (typically 48 hours
later).
3.5.2. Cell Seeding: During the second lab period, the hydrogels are seeded with NIH-
3T3 cells using the cell culture techniques that were introduced in the Introduction to the
Biological Lab. First, the well-plate from the first day of lab is removed from the refrigerator
and placed in a biological safety cabinet. The PBS is removed from well containing a hydrogel.
A volume of 1 mL of cell media (composed of DMEM, 10% fetal bovine serum, and 1%
penicillin/streptomycin) is then placed in the wells with the hydrogels. The hydrogels are then
incubated in the cell media in an incubator at 37°C and 5% CO2.
While the hydrogels are incubating, a T-25 flask containing NIH-3T3 cells is removed from the
incubator and placed in a biological safety cabinet. The cell media from the flask is aspirated
and replaced with 1 mL of trypsin. The flask is tilted around to ensure that the trypsin covers the
bottom of the flask to loosen the cells from the bottom on the flask. The trypsin is aspirated
away and replaced with 1 mL of fresh trypsin. The flask is again tilted to ensure the bottom is
covered. The NIH-3T3 cells then sit in trypsin for three minutes. The flask is then brought out
Page 14.200.18
of the biological hood to an inverted light microscope. The cells are observed to make sure they
had begun detaching from the flask. Once most cells have detached from the flask, 5 mL of cell
medium is added to the flask. The cells are then resuspended by repeatedly sucking and
dispensing the cells and media into the pipet. Another 5 mL of cell medium is then added. A
100µL sample of the detached NIH-3T3 cells is removed from the flask and placed on
hemocytometer to determine the cell concentration in the flask. The appropriate amount of cell
media is then added to the flask to obtain a concentration of cells of approximately 1.5 x 10⁴
cells/mL.
The well plate with the hydrogels is removed from the incubator and placed into the biological
safety cabinet. A volume of 200 µL of the NIH-3T3 cells/cell medium solution is then placed
into of the wells containing hydrogels. Four wells without hydrogels are also filled with 200 µL
of the NIH-3T3 cells/cell medium solution to serve as controls. A volume of 1 mL of cell media
is then added to all wells with cells. Once the presence of cells in each well is verified with the
inverted light microscope, the well-plate is placed in the cell incubator for 48 hours.
3.5.3. Hydrogel/Cell Imaging: During the third lab period, the hydrogels are imaged
with an inverted microscope on the three different types of hydrogels to examine the differences
in cellular response. Sample images are shown in Figures 8 to 10.
Quantitative and qualitative observations of adhesion and spreading of the NIH-3T3 cells are
also performed. A sample analysis is included in Table 5.
Hydrogel Observations Adhesion
(cells per
1.2 nm)
Spreading (nm)
0.0 nM of
ACRL-
PEG-
GRGDS
Cells are bunched together, with very
little spread.
90 0.025
0.4 nM of
ACRL-
PEG-
GRGDS
Cells are bunched together, but in larger
groups than found in hydrogel 1. Also,
spread of cells is much larger for most
cells.
130 0.07
4.0 nM of
ACRL-
PEG-
GRGDS
Cells are still bunched together, however
less so than hydrogels 1 and 2. Cells
have a much larger spread and are
similar concentrations to hydrogel 2.
120 0.2
Table 5: Quantitative and qualitative observations of adhesion and spreading of NIH-3T3 cells
on hydrogels and control.
Spreading measurement is the average diameter of observed cells under 10x magnification.
Adhesion measurement is the number of cells observed in a given area under 10x magnification.
Page 14.200.19
Figure 8: Image of 0.0 nM of ACRL-PEG-GRGDS at 10x magnification
Figure 9: Image of 0.4 nM of ACRL-PEG-GRGDS at 10x magnification
Figure 10: Image of 4.0 nM of ACRL-PEG-GRGDS at 10x magnification
Page 14.200.20
3.6 Biomechanics Module
In the biomechanics module, students measure and analyze EMG (electromyography) signals
and relate force generation and limb movement to these signals. This laboratory module again
utilizes the CleveLab Biomedical Engineering Course Kit to record the EMG signals. This is a
two-day lab: EMG Signal Processing and Force Generation. Each part is run on a different day.
3.6.1 EMG Signal Processing: On the first day of the lab module, EMG signals from
the wrist and bicep muscles are measured under isometric and dynamic loads. Electrodes are
placed on mildly abraded skin of the subject. Two electrodes are placed on the bicep about an
inch apart. Two electrodes are placed on the wrist extensor muscles about an inch apart, and one
electrode is placed directly on the elbow to serve as a ground. The CleveLab EMG program is
then started. An isometric contraction is first performed by the subject. To perform an isometric
contraction, the subject places his/her opposing hand on top of the experimental hand and then
pulls up with his/her bicep against the opposing hand’s resistive force. The end result is a
contracted muscle without motion. Five seconds of data is saved. This is then repeated using the
wrist extensor muscles to pull up against the resistive opposing hand. Five seconds of data is
saved. Motion artifacts of the wrist and arm are also examined and recorded. Five seconds of
data are recorded while the subject uses the bicep to change the angle of the elbow. Next, five
seconds of data is recorded while the subject dynamically contracts the wrist extensor muscles.
In order to examine the effects of increased loads on muscle activation, a student holds a series
of calibrated weights. Data recording is started under the file name “weights.” After recording
five seconds of data with the arm at rest, each of the calibrated weights (3, 5, 10, and 15 pounds)
is placed in the hand of the subject for five seconds, with five seconds of rest in between each
weight placement. For the duration of this data recording, the subject keeps the experimental
arm at a 90 degree angle.
In order to examine how the EMG relates to muscle force and fatigue, the students hold a five
pound weight (or less or more, if necessary!) for 60 seconds. During this time, the wrist and
bicep signals are recorded. The students then conduct a joint-time frequency analysis (JFTA) of
the resulting EMG signal to identify changes in the FFT and EMG during the onset of fatigue.
This is done by dividing the 60 second file into approximately five second “windows.” For each
window, the RMS (root-means-squared) is computed and an FFT performed (using MATLAB)
for both the biceps and wrist muscles.
3.6.2 Force Generation: For the second part of the lab module, EMG recordings of the
right and left calves and quadriceps are simultaneously recorded with the output of a force plate
transducer to determine which leg muscles are active during the different phases of jumping and
how the different properties of muscle impact the ability to perform a jump. The students also
explore any correlations between the magnitude of the EMG and the length of the jump over
time. The force plate measurement for each jump trial is used to calculate the acceleration,
velocity, and position of the subject for each of the trials. The students use MATLAB to
complete these analyses.
Page 14.200.21
Nine electrodes are placed on mildly abraded skin of the subject. Two electrodes are placed on
the right quad muscle about an inch apart, two electrodes are placed on the left quad about an
inch apart. Two electrodes are placed on the left calf about an inch apart. Two electrodes are
placed on the right calf about an inch apart. The final electrode is placed on the knee to serve as
a ground. The electrode leads is taped up to the legs of the subject to minimize motion artifact
from induction on the wires are attached to the BioRadio. In addition, the force plate is attached
to the BioRadio.
The CleveLabs Biomechanics module is then started. The subject is instructed to stand still on
the force plate and the EMG from the left and right quadriceps and calves are simultaneously
recorded with the force signal. The subject is then instructed to squat down while recording
EMG and force data which is saved under the file “squat.” The subject then performs three
horizontal jumps. The first jump is saved under “smalljump” and is a short, vertical jump. The
length of the jump is recorded. This process is repeated for a “mediumjump” and a “bigjump.”
Figure 11 shows is a sample plot of the calibrated weights. It shows that the EMG amplitude
increases as the amount of weight increases.
Figure 11 - Raw biceps EMG signal vs. time
Figure 12 shows sample images from the force generation section of the lab.
Page 14.200.22
(a) Small jump right calf (b) Medium jump right quad
Figure 12. Sample EMG signals labeled with which phase the muscle is in over time.
The force trace are integrated to compute velocity and position, and illustrated in Figure 13.
Figure 13: The force, velocity, position, acceleration vs. time plot of the medium jump.
Page 14.200.23
3.7 Research Paper
Each student is required to complete a research paper that summarizes or proposes the
application of a technique presented in this course to biomedical research. Examples of
biomedical research include the development of a medical device, treatment of a disease, or
study of a biological process. No experiments are performed due to the lack of facilities to
perform the wide range of proposed experiments.
The final project is presented in poster and written formats and must contain the following items:
1. Clear definition of medical or biological problem to be addressed
2. Detailed description of technique to be applied
3. Description of how technique relates to some aspect of the biomedical engineering
laboratory course
4. Detailed explanation of how the technique has been be applied to address the medical
or biological problem
5. Complete bibliography that includes references from “key” journals (indexed in
MEDLINE) and follows accepted format
The poster session is a public event at which other students, faculty, and family members are
invited. Each student is required to give a three-minute summary of their poster, as well as grade
each other’s poster.
4. Results
4.1 Research Project
Selected research paper projects are listed in Table 6. Each research project is the result of
constant interaction between each student and the instructor. Each student is required to turn in
ideas for his/her research project early in the semester. After a project is selected, it is presented
to other students in a vetting session, and approved by the instructor. Several updates are turned
in over the course of the semester. This allows the students to receive constant feedback on their
project as well as identify any potential problems. The poster is due approximately two weeks
before the final report, allowing the poster to serve as a draft of the final project.
Page 14.200.24
1. Developing the Vaccine for Hepatitis C
2. Genetically Engineering Bacteria to treat Shiga toxins
3. New Gene Gun Design and Application for Cancer Treatment
4. Using Echo-planar Event-related fMRI to Measure Regional Brain Responses