An intersection turning movement estimation procedure based on path flow estimator Anthony Chen 1 * , Piya Chootinan 2 , Seungkyu Ryu 1 , Ming Lee 3 and Will Recker 4 1 Department of Civil and Environmental Engineering, Utah State University Logan, UT 84322-4110, USA 2 Bureau of Planning, Department of Highways, Bangkok 10400, Thailand 3 Department of Civil and Environmental Engineering, University of Alaska, Fairbanks AK 99775-5900, USA 4 Department of Civil Engineering, University of California, Irvine, CA 92697-3600, USA SUMMARY Estimation of intersection turning movements is one of the key inputs required for a variety of transportation analysis, including intersection geometric design, signal timing design, traffic impact assessment, and transportation planning. Conventional approaches that use manual techniques for estimation of turning movements are insensitive to congestion. The drawbacks of the manual techniques can be amended by integrating a network traffic model with a computation procedure capable of estimating turning movements from a set of link traffic counts and intersection turning movement counts. This study proposes using the path flow estimator, originally used to estimate path flows (hence origin–destination flows), to derive not only complete link flows, but also turning movements for the whole road network given some counts at selected roads and intersections. Two case studies using actual traffic counts are used to demonstrate the proposed intersection turning movement estimation procedure. Copyright # 2010 John Wiley & Sons, Ltd. KEY WORDS: transportation planning; network traffic model; turning movement estimation; path flow estimator 1. INTRODUCTION Network traffic models (i.e., the four-step modeling procedure) were originally developed to forecast link flows on the regional circulation network. In the past decade, with the ever-increasing availability of computer hardware and software, traffic models have been widely used by traffic engineers and regional planners. In addition, the increasing consciousness on environmental impacts has also prompted agencies to recommend the use of traffic models for the assessment of traffic impacts cumulated by continuous land use and network development on a 20–30 year horizon [1]. Traditionally, the estimation of future turning movements with a traffic model involves the application of factoring algorithms among which Furness Method [2] is the most commonly used. Regional traffic models first estimate future link volumes, in and out of an intersection, based on estimated future demands, which is in general difficult to obtain. Then, the base year turning movement counts at an intersection are multiplied by factors until the total inflows and outflows of the intersection closely match the estimated link volumes. An obvious limitation of the method is the inapplicability for intersections without existing turning counts. Although recent advanced traffic sensors (e.g., video detection) have the potential to automate such data collection processes, it is still expensive to fully instrument every intersection with sensors. In addition, the Furness method assumes that future turning movements will be proportional to their existing turning counterparts. However, this is not the case when a major change occurs in the land use pattern and transportation system. In fact, the volume on a particular movement of an intersection that is on a new ‘‘preferred’’ path may dramatically increase due to the corresponding changes of travel behavior. Another approach to incorporating turning movement estimation with a traffic model is to estimate and calibrate a baseline trip table from existing traffic counts with a special computation procedure that can reproduce turning movements at key JOURNAL OF ADVANCED TRANSPORTATION J. Adv. Transp. 2012; 46:161–176 Published online 9 November 2010 in Wiley Online Library (wileyonlinelibrary.com). DOI: 10.1002/atr.151 *Correspondence to: Anthony Chen, Department of Civil and Environmental Engineering, Utah State University Logan, UT 84322-4110, USA. E-mail: [email protected]Copyright # 2010 John Wiley & Sons, Ltd.
Transcript
An intersection turning movement estimation procedure basedon path flow estimator
Anthony Chen1*, Piya Chootinan2, Seungkyu Ryu1, Ming Lee3 and Will Recker4
1Department of Civil and Environmental Engineering, Utah State University Logan, UT 84322-4110, USA2Bureau of Planning, Department of Highways, Bangkok 10400, Thailand
3Department of Civil and Environmental Engineering, University of Alaska, Fairbanks AK 99775-5900, USA4Department of Civil Engineering, University of California, Irvine, CA 92697-3600, USA
SUMMARY
Estimation of intersection turning movements is one of the key inputs required for a variety of transportationanalysis, including intersection geometric design, signal timing design, traffic impact assessment, andtransportation planning. Conventional approaches that use manual techniques for estimation of turningmovements are insensitive to congestion. The drawbacks of the manual techniques can be amended byintegrating a network traffic model with a computation procedure capable of estimating turning movementsfrom a set of link traffic counts and intersection turning movement counts. This study proposes using the pathflow estimator, originally used to estimate path flows (hence origin–destination flows), to derive not onlycomplete link flows, but also turning movements for the whole road network given some counts at selectedroads and intersections. Two case studies using actual traffic counts are used to demonstrate the proposedintersection turning movement estimation procedure. Copyright # 2010 John Wiley & Sons, Ltd.
Network traffic models (i.e., the four-step modeling procedure) were originally developed to forecast
link flows on the regional circulation network. In the past decade, with the ever-increasing availability
of computer hardware and software, traffic models have been widely used by traffic engineers and
regional planners. In addition, the increasing consciousness on environmental impacts has also
prompted agencies to recommend the use of traffic models for the assessment of traffic impacts
cumulated by continuous land use and network development on a 20–30 year horizon [1].
Traditionally, the estimation of future turning movements with a traffic model involves the application
of factoring algorithms among which Furness Method [2] is the most commonly used. Regional traffic
models first estimate future link volumes, in and out of an intersection, based on estimated future
demands, which is in general difficult to obtain. Then, the base year turning movement counts at an
intersection are multiplied by factors until the total inflows and outflows of the intersection closely
match the estimated link volumes. An obvious limitation of the method is the inapplicability for
intersections without existing turning counts. Although recent advanced traffic sensors (e.g., video
detection) have the potential to automate such data collection processes, it is still expensive to fully
instrument every intersection with sensors. In addition, the Furness method assumes that future turning
movements will be proportional to their existing turning counterparts. However, this is not the case
when a major change occurs in the land use pattern and transportation system. In fact, the volume on a
particular movement of an intersection that is on a new ‘‘preferred’’ path may dramatically increase
due to the corresponding changes of travel behavior. Another approach to incorporating turning
movement estimation with a traffic model is to estimate and calibrate a baseline trip table from existing
traffic counts with a special computation procedure that can reproduce turning movements at key
JOURNAL OF ADVANCED TRANSPORTATIONJ. Adv. Transp. 2012; 46:161–176Published online 9 November 2010 in Wiley Online Library (wileyonlinelibrary.com). DOI: 10.1002/atr.151
*Correspondence to: Anthony Chen, Department of Civil and Environmental Engineering, Utah State University Logan,UT 84322-4110, USA. E-mail: [email protected]
Copyright # 2010 John Wiley & Sons, Ltd.
intersections. Implicit in the baseline trip table is the trip length distribution that reflects the destination
and route choice behavior in the region. Future trip addition can be estimated and added to the baseline
trip table. Turning movement forecasts can thus be obtained by assigning the future trip table to the
future network. With such an approach, the forecasting of turning movements with a future trip table
can account for the effects of both land use change and driver’s path choice behavior sensitive to
congestion and network changes.
Some earlier studies presented applicable procedures for turning movement estimation and
calibration with network traffic counts. Jeffreys and Norman [3] discussed some general properties
(i.e., total inflow equals to total outflow, zero diagonal elements, etc.) required for the turning
movement flow matrix to be realistic and feasible. They provided matrix manipulation schemes to
generate additional feasible and realistic matrices from the initial feasible pattern. Later, most of
studies on this topic have been focused on the application of mathematical models for identifying the
most probable turning movement flow matrix of which the row and column sums, respectively, satisfy
the known total inflow and outflow of intersection. Examples of these studies include Mekky [4], van
Zuylen [5], Hauer et al. [6], Bell [7], Maher [8], Schaefer [9], and others.
Mekky [4] proposed a well-known log-linear model, which was derived as the solution to the
constrained optimization problem (entropy maximization). Similar model was also obtained by van
Zuylen [5] using the minimum information approach. Based on work of van Zuylen [5], the most
probable matrix is defined by the matrix obtained with the minimum amount of information. Prior
turning movement probabilities can also be incorporated in these models. As reported by van Zuylen
[5] and some follow-up studies by Hauer et al. [6] and Schaefer [9], turning movement probabilities
(relative size of turning movement volumes) heavily affect the accuracy of turning movement flow
estimates and have been considered as one of critical inputs. This type of information is typically
obtained based on either long-term or short-term historical traffic data. It has been reported that a
higher degree of accuracy of turning movement flow estimate was obtained when turning movement
probabilities were specified according to intersection type and approach type (e.g., arterial or collector
street) rather than the average value for each turning movement [6]. In addition, the solution based on
historical data assumes that there is no substantial change in landuse or travel demand pattern. This
assumption may not be applicable for long-range forecasting of turning movements [9].
Interestingly, two aforementioned models can be solved using similar balancing procedures, which
resemble the Furness growth factor model [2]. The initial estimate of turning movement flows will
iteratively be scaled up or down to produce the total observed inflow and outflow on all intersection’s
approaches. Several studies mentioned earlier have demonstrated the capability of these models in
estimating the turning movement flow matrix of both a single intersection and a group of intersections in
the network. However, in the later case, the estimation of turning movements for each intersection is
performed independently as long as the observed inflow and outflow at each intersection is in
equilibrium. There is no consideration put toward the relationship of traffic flow running throughmultiple
intersections in the network.
Martin and Bell [10] adapted the network flow (NETFLO) algorithm, which is a linear programming
originally developed for optimizing flows of water and electricity networks, to derive turning movements
from traffic counts. As mentioned in their study, this technique cannot represent the behavior of road
network’s users as required in the conventional transportation modeling. However, with the ability of
quick estimation, it might be useful for real-time transportation applications. Mathematically, the
NETFLO algorithm is to minimize the summation of link flow estimates on all transportation links, which
is not exactly the transportation cost. The general transportation network is expanded to properly represent
all turning movements at each intersection. The flow continuities (flow conservations) at transportation
nodes, including intersections, aremodeled as a series of linear equations, while estimated link and turning
movement flows must satisfy the set of constraints defined by measured link flows. In general, due to the
variation of traffic measurements, it is difficult to fulfill flow continuity at every node. The requirement of
flow continuity can be handled by the introduction of error arcs. The error arcs are used to retain a portion
of inconsistent flows causing unsatisfied flow continuity. In a follow-up study by Martin [11], the
NETFLO algorithm was further investigated for the capability in estimating turning movement flows
within a shorter time period and the effects of several parameters associated with the model namely upper
limits of flows on error arcs on the quality of estimation were also examined.
Copyright # 2010 John Wiley & Sons, Ltd. J. Adv. Transp. 2012; 46:161–176
DOI: 10.1002/atr
162 A. CHEN ET AL.
Recently, Wu and Thnay [12] proposed the origin–destination (O–D) based method for estimating
turning movements. Instead of estimating turning movements directly, they estimate the O–D matrix
from a set of existing traffic and turning movement counts. Then, based on the current O–D matrix
estimated, the future O–D matrix, obtained by the traditional travel demand model, is adjusted
accordingly using the procedure similar to the Furness method. Finally, the adjusted future O–Dmatrix
is assigned onto the network based on any user equilibrium principle to obtain both future link and
turning movement flows. In their study, the gradient-based technique, which was developed by Spiess
[13] and implemented in EMME/2 macro, was used as the O–D estimator. By coupling the travel
demand model with O–D estimation, Wu and Thnay [12] reported that the proposed method could
represent changes in travel demand (landuse) pattern more properly.
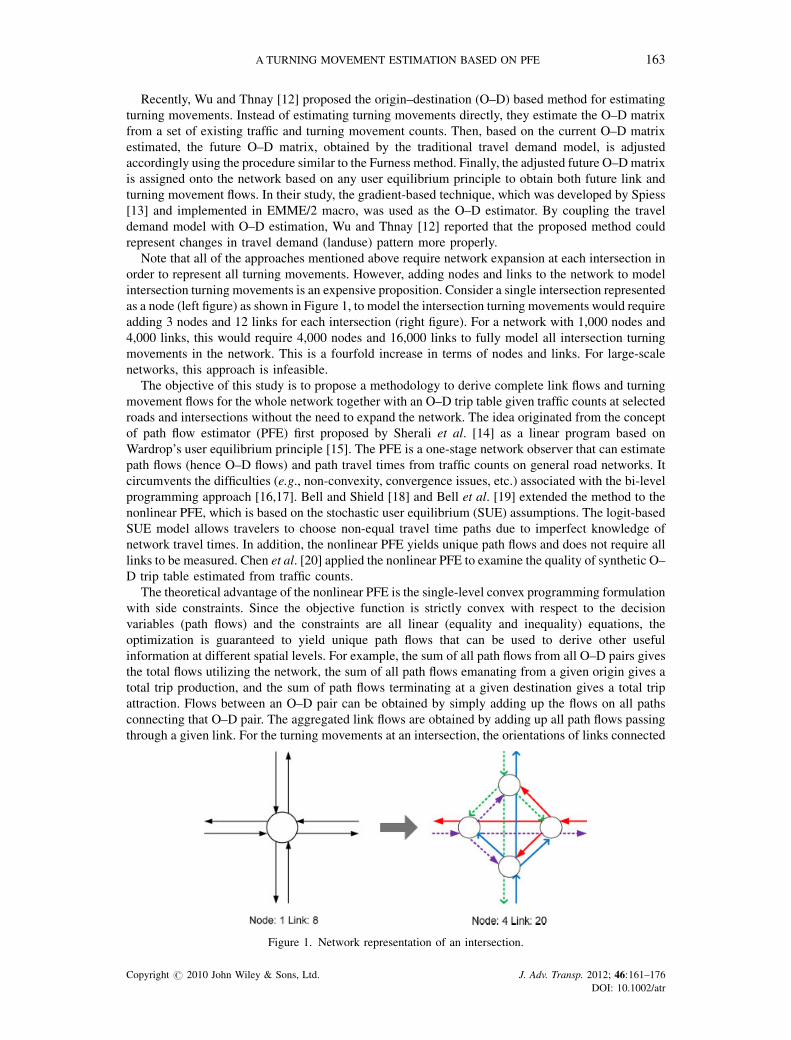
Note that all of the approaches mentioned above require network expansion at each intersection in
order to represent all turning movements. However, adding nodes and links to the network to model
intersection turning movements is an expensive proposition. Consider a single intersection represented
as a node (left figure) as shown in Figure 1, to model the intersection turning movements would require
adding 3 nodes and 12 links for each intersection (right figure). For a network with 1,000 nodes and
4,000 links, this would require 4,000 nodes and 16,000 links to fully model all intersection turning
movements in the network. This is a fourfold increase in terms of nodes and links. For large-scale
networks, this approach is infeasible.
The objective of this study is to propose a methodology to derive complete link flows and turning
movement flows for the whole network together with an O–D trip table given traffic counts at selected
roads and intersections without the need to expand the network. The idea originated from the concept
of path flow estimator (PFE) first proposed by Sherali et al. [14] as a linear program based on
Wardrop’s user equilibrium principle [15]. The PFE is a one-stage network observer that can estimate
path flows (hence O–D flows) and path travel times from traffic counts on general road networks. It
circumvents the difficulties (e.g., non-convexity, convergence issues, etc.) associated with the bi-level
programming approach [16,17]. Bell and Shield [18] and Bell et al. [19] extended the method to the
nonlinear PFE, which is based on the stochastic user equilibrium (SUE) assumptions. The logit-based
SUE model allows travelers to choose non-equal travel time paths due to imperfect knowledge of
network travel times. In addition, the nonlinear PFE yields unique path flows and does not require all
links to be measured. Chen et al. [20] applied the nonlinear PFE to examine the quality of synthetic O–
D trip table estimated from traffic counts.
The theoretical advantage of the nonlinear PFE is the single-level convex programming formulation
with side constraints. Since the objective function is strictly convex with respect to the decision
variables (path flows) and the constraints are all linear (equality and inequality) equations, the
optimization is guaranteed to yield unique path flows that can be used to derive other useful
information at different spatial levels. For example, the sum of all path flows from all O–D pairs gives
the total flows utilizing the network, the sum of all path flows emanating from a given origin gives a
total trip production, and the sum of path flows terminating at a given destination gives a total trip
attraction. Flows between an O–D pair can be obtained by simply adding up the flows on all paths
connecting that O–D pair. The aggregated link flows are obtained by adding up all path flows passing
through a given link. For the turning movements at an intersection, the orientations of links connected
Figure 1. Network representation of an intersection.
Copyright # 2010 John Wiley & Sons, Ltd. J. Adv. Transp. 2012; 46:161–176
DOI: 10.1002/atr
A TURNING MOVEMENT ESTIMATION BASED ON PFE 163
to intersection are needed so as to determine the individual turning movement (e.g., left, right, or
through movement) from the used paths without the need to expand the network for representing
turning movements. Since the aggregation is a one-to-one mapping, the resulting estimates at different
spatial levels (including the turning movement estimates) should be also unique. Note that this
uniqueness is different from the under-specified problem of the O–D estimation problem from traffic
counts, which is known to have multiple solutions since the number of independent observations (link
counts and turning movement counts) is generally less than the number of variables (O–D demands).
The multiplicity of the solutions (O–D estimates) should be quantified by some quality measures (e.g.,
the maximal possible relative error (MPRE), of Yang et al. [21], the expected relative error (ERE) of
Gan et al. [22], or the total demand scale (TDS) of Bierlaire [23].
In this paper, we demonstrate the derivation of turning movements as well as link flows for thewhole
network via PFE with incomplete traffic data for different network topologies. Two case studies
utilizing traffic data collected from the City of Logan, Utah, and the City of St. Helena, California, are
set up to demonstrate the application of the proposed method. The results also serve to identify the
shortcomings and the corresponding improvements for the methodology.
2. PATH FLOW ESTIMATOR WITH TURNING MOVEMENTS
The nonlinear PFE was originally developed by Bell and Shields [18] as a one-stage network observer.
It is able to estimate path flows and path travel times using incomplete traffic data from detection
devices partially installed in the network. The core component of PFE is a logit-based path choice
model in which the perception errors of path travel times are assumed to be independent Gumbel
variates [24]. The logit model interacts with link cost functions to produce a SUE traffic pattern. Based
on the equivalent formulation for a logit-based SUE problem [25], the PFE formulation with turning
where I and I are the sets of measured and all intersections; Mi is the set of turning movements at
intersection i; A, A^
and A are the sets of measured, unmeasured, and all links (A ¼ A[A^); RS and RS arethe sets of target (or prior) and all O–D pairs; Krs is the set of paths connecting origin r and destination
s; u is the dispersion parameter, INi and OUTi are the sets of links terminating into and originating out
of intersection i; "im, "a, and "rs the measurement errors [0,1] for turning movementm from intersection
Copyright # 2010 John Wiley & Sons, Ltd. J. Adv. Transp. 2012; 46:161–176
DOI: 10.1002/atr
164 A. CHEN ET AL.
i, flows on link a, and target O–D demands between origin r and destination s; gim and tim are the
observed and estimated flows on turning movement m at intersection i; va and xa are the observed and
estimated flows on link a; Ca, taðxaÞ are capacity and cost function of link a; zrs and qrs are the target
and estimated O–D flows between origin r and destination s; f rsk is the estimated flows on path k
connecting origin r and destination s; and drsak is the path-link indicator: 1 if link a is on path k between
origin r and destination s, and 0 otherwise.
The objective function (1) has two terms: an entropy term and a user equilibrium term. The entropy
term seeks to evenly distribute trips to multiple paths according to the dispersion parameter while the
user equilibrium term tends to cluster the trips on the minimum cost paths. As opposed to the traditional
logit-based SUEmodel, PFE finds path flows that minimize the SUE objective function in Equation (1)
while simultaneously reproducing turning movement counts on all observed intersections in
Equation (2), traffic counts on all observed links in Equation (3), and prior travel demands of certain O–
D pairs in Equation (5) within some predefined error bounds. For the unobserved links, the estimated
flows cannot exceed their capacities as indicated by Equation (4). This constraint is incorporated for the
same purpose as in the capacitated traffic assignment [26], which is to prevent producing unrealistically
high link flow estimates. Error bounds ("im, ea, and ers) are introduced in Equations (2), (3), and (5) to
account for measurement errors of turning movement counts, traffic counts, and the confidence
associated with prior O–D demands, respectively. More reliable information will constrain the
estimation (e.g., turning movement flows, link flows, or O–D flows) to be within a smaller tolerance,
whereas less reliable information will allow for a larger deviation. The introduction of the error bounds
in Equations (2), (3), and (5) enhances the flexibility of PFE by allowing the user to incorporate local
knowledge about the network conditions to the estimation process. Equation (6) constrains the path
flows to be non-negativity, while Equations (7), (8), and (9) are definitional constraints to obtain
turning movement flows for all intersections, link flows, and O–D flows from the path flow solution.
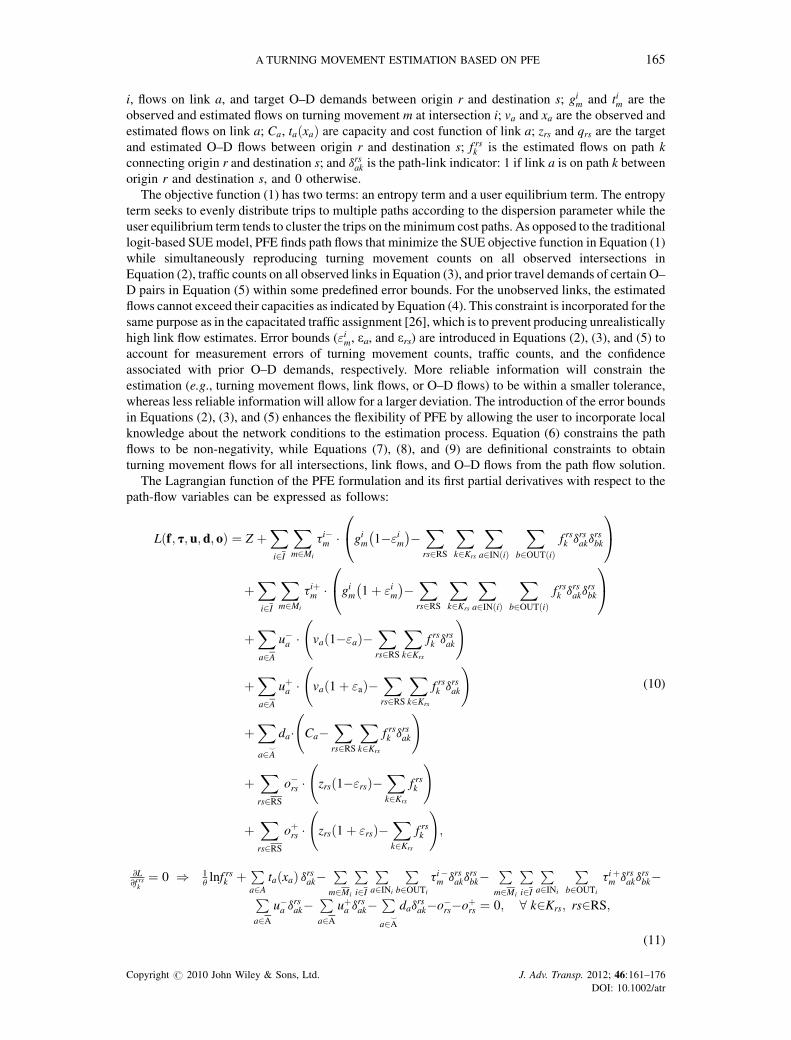
The Lagrangian function of the PFE formulation and its first partial derivatives with respect to the
path-flow variables can be expressed as follows:
Lðf; t; u; d; oÞ ¼ Z þXi2I
Xm2Mi
ti�m � gim 1�"im� �� X
rs2RS
Xk2Krs
Xa2IN ið Þ
Xb2OUT ið Þ
f rsk drsakdrsbk
0@
1A
þXi2I
Xm2Mi
tiþm � gim 1þ "im� �� X
rs2RS
Xk2Krs
Xa2IN ið Þ
Xb2OUT ið Þ
f rsk drsakdrsbk
0@
1A
þXa2A
u�a � va 1�"að Þ�Xrs2RS
Xk2Krs
f rsk drsak
!
þXa2A
uþa � va 1þ "að Þ�Xrs2RS
Xk2Krs
f rsk drsak
!
þXa2A^
da� Ca�Xrs2RS
Xk2Krs
f rsk drsak
!
þXrs2RS
o�rs � zrs 1�"rsð Þ�Xk2Krs
f rsk
!
þXrs2RS
oþrs � zrs 1þ "rsð Þ�Xk2Krs
f rsk
!;
(10)
@L@f rsk¼ 0 ) 1
ulnf rsk þ P
a2AtaðxaÞ drsak�
Pm2Mi
Pi2I
Pa2INi
Pb2OUTi
ti�m drsakdrsbk�
Pm2Mi
Pi2I
Pa2INi
Pb2OUTi
tiþm drsakdrsbk�P
a2Au�a d
rsak�
Pa2A
uþa drsak�
Pa2A^
dadrsak�o�rs�oþrs ¼ 0; 8 k2Krs; rs2RS;
(11)
Copyright # 2010 John Wiley & Sons, Ltd. J. Adv. Transp. 2012; 46:161–176
DOI: 10.1002/atr
A TURNING MOVEMENT ESTIMATION BASED ON PFE 165
where ti�m , tiþm , u�a , uþa , da, o
�rs, and oþrsare the dual variables of constraints (2), (3), (4), and (5),
respectively. The values of tiþm , uþa , da, and oþrs are restricted to be non-positive, while the value of t
i�m ,
u�a and o�rsmust be non-negative; ti�m , tiþm , u�a , and uþa can be viewed as the corrections to the intersection
turning movement delay and link travel time, respectively, by adjusting the estimated path flows to
match with the observed turning movement counts and link counts; similarly o�rs and oþrs can be
interpreted as corrections to the O–D travel times that can be used to steer the estimated path flow
pattern towithin the O–D interval constraints specified by Equation (5). These dual variables are zero if
the estimated values (e.g., turning movement flows, link flows, and O–D flows) are within an
acceptable range defined by the measurement error bound, non-zero if they are binding at one of the
limits, and infinity (or very large positive or negative values) if there exists no solution that can fulfill
the constraints [19]. Also see Ref. [27] on how to make use of the dual variables to adjust the error
bounds if they are initially mis-specified. da is related to the link queuing delay when the estimated link
flow reaches its capacity [28].
Similar to the logit-based SUE model, path flows can be derived analytically as a function of path
cost and dual variables associated with constraints (2), (3), (4), and (5), as follows.
f rsk ¼ exp u
�Pa2A
ta xað Þdrsak þP
m2Mi
Pi2I
Pa2INi
Pb2OUTi
ti�m þ tiþm� � � drsakdrsbkþP
a2Au�a d
rsak þ uþa d
rsak
� � þ Pa2A^
dadrsak þ oþrs þ o�rs
0B@
1CA
264
375; 8 k2Krs; rs2RS
(12)
3. SOLUTION ALGORITHM
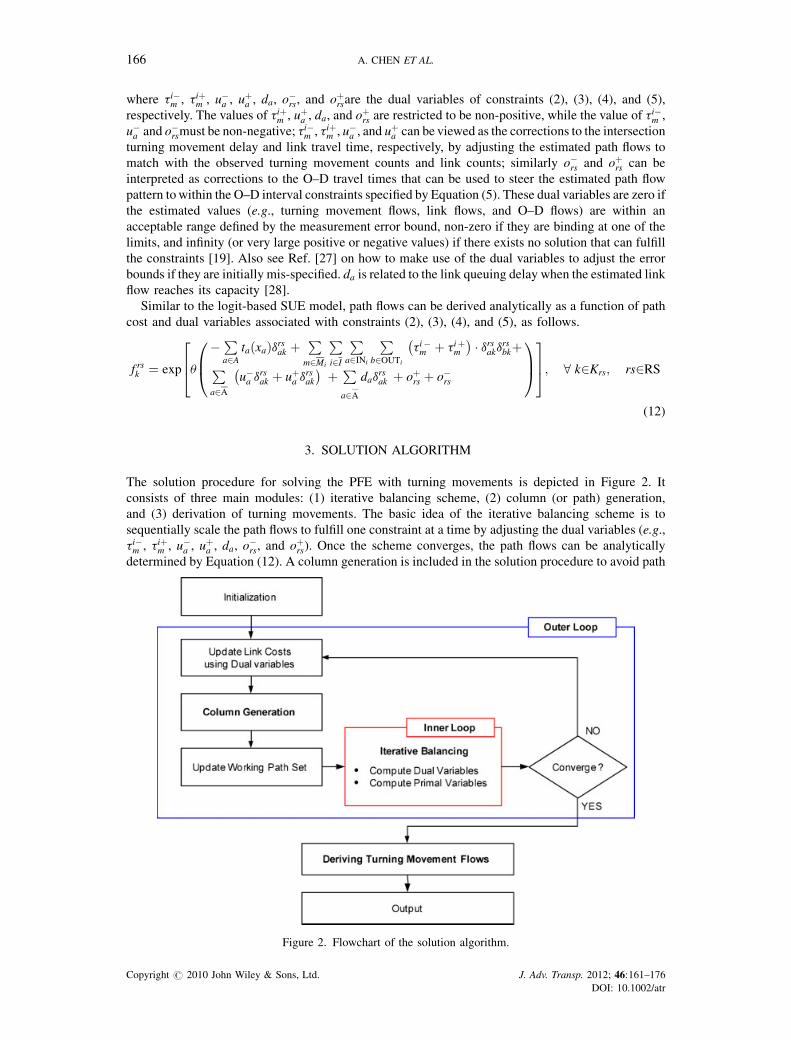
The solution procedure for solving the PFE with turning movements is depicted in Figure 2. It
consists of three main modules: (1) iterative balancing scheme, (2) column (or path) generation,
and (3) derivation of turning movements. The basic idea of the iterative balancing scheme is to
sequentially scale the path flows to fulfill one constraint at a time by adjusting the dual variables (e.g.,
ti�m , tiþm , u�a , uþa , da, o
�rs, and oþrs). Once the scheme converges, the path flows can be analytically
determined by Equation (12). A column generation is included in the solution procedure to avoid path
Figure 2. Flowchart of the solution algorithm.
Copyright # 2010 John Wiley & Sons, Ltd. J. Adv. Transp. 2012; 46:161–176
DOI: 10.1002/atr
166 A. CHEN ET AL.
enumeration for a general transportation network. Finally, an intersection turning movement
estimation procedure is used to derive turning movement flows for all intersections (including the
unobserved intersections).
3.1. Iterative balancing scheme
The iterative balancing scheme can be summarized as follows.
Step 1. Initialization. Set n¼ 0, ti�m� �n
; tiþm� �n
; ti; nm� �
; uþa� �n
; u�a� �n
; da� �n
; xna� �
; o�rs� �n
; oþrs� �n
,
and qnrs ¼ 0.
Step 2. Update Dual Variables and Compute Primal Variables
a. For each measured intersection (i2 I), update the dual variables
tiþm� �n¼Min 0; tiþm
� �n�1þ 1
uln
ð1þ"imÞ�gimtim
� �� �and ti�m
� �n¼Max 0; ti�m� �n�1þ 1
uln
ð1�"imÞ�gimtim
� �� �b. For each measured link (a2A), update the dual variables
uþa� �n¼Min 0; uþa
� �n�1þ1
uln
ð1þ"aÞ�vaxna
� �� �and u�a
� �n ¼ Max 0; u�a� �n�1 þ 1
uln
ð1�"aÞ�vaxna
� �� �:
c. For each unmeasured link (a2A^
), update the dual variables
da� �n ¼ Min 0; da
� �n�1 þ 1
uln
Ca
xna
� �� �:
d. For each target O-D flow (rs2RS), update the dual variables
oþrs� �n¼Min 0; oþrs
� �n�1þ1
uln
ð1þ"rsÞ�zrsqnrs
� �� �and o�rs
� �n¼Max 0; o�rs� �n�1þ 1
uln
ð1�"rsÞ�zrsqnrs
� �� �
Compute path flows using Equation (12), turning movement flows using Equation (7), link flows
using Equation (8), and O–D flows using Equation (9).
Step 3. Convergence Test.
If h0� Maxtiþm� �n� tiþm
� �n�1��� ��� ; ti�m
� �n� ti�m� �n�1
��� ��� ; uþa� �n� uþa
� �n�1��� ��� ; u�a
� �n� u�a� �n�1
��� ��� ;dað Þn� dað Þn�1�� �� ; oþrs
� �n� oþrs� �n�1
��� ��� ; o�rs� �n� o�rs
� �n�1��� ���
8<:
9=;< h,
where h0 is a convergence tolerance (e.g., 10�6) and h is the upper limit of change in dual variables,
then set all parameters of the next iteration equal to those of the current iteration, set n¼ nþ 1, and go
to step 2.
If Maxtiþm� �n� tiþm
� �n�1��� ��� ; ti�m
� �n� ti�m� �n�1
��� ��� ; uþa� �n� uþa
� �n�1��� ��� ; u�a
� �n� u�a� �n�1
��� ��� ;dað Þn� dað Þn�1�� �� ; oþrs
� �n� oþrs� �n�1
��� ��� ; o�rs� �n� o�rs
� �n�1��� ���
8<:
9=; � h,
then set all parameters of the next iteration equal to those of the current iteration, set n¼ nþ 1,
and terminate.
In the above procedure, we just provide the adjustment equations for different types of constraint
(e.g., observed intersections, observed links, unobserved links, and target O–D flows). The detailed
derivations of the adjustment equations can be found in Refs. [29,30], and convergence of the iterative
balancing scheme is discussed in detail in Refs. [19,28].
3.2. Column generation
The above iterative balancing scheme assumes that a working path set is given. For large networks, this
is not practical to enumerate a working path set in advance since the number of possible paths grows
exponentially with respect to network size. To circumvent path enumeration, a column (or path)
generation procedure can be augmented to the iterative balancing scheme. Basically, the algorithm
introduces an outer loop (or iteration) to iteratively generate paths to the working path set as needed to
replicate the observed link counts, turning movement counts, and selected prior O–D flows, and to
Copyright # 2010 John Wiley & Sons, Ltd. J. Adv. Transp. 2012; 46:161–176
DOI: 10.1002/atr
A TURNING MOVEMENT ESTIMATION BASED ON PFE 167
account for the capacity restraints for the unobserved links and congestion effects, while the iterative
balancing scheme iteratively adjusts the primal variables (path flows, link flows, intersection turning
movement flows, and O–D flows) and the dual variables in the inner loop for a given working path set
from the outer loop. Note that the working path set is generated by a column generation scheme (or a
shortest path algorithm) using the generalized link costs, which is based on not only the link costs but
also the dual variables from the active side constraints in Equations (2)–(5). The dual variables force
the column generation scheme to generate paths that satisfy the side constraints. See Refs. [19,29,30]
for additional discussions on the issue of using the generalized link costs to generate paths.
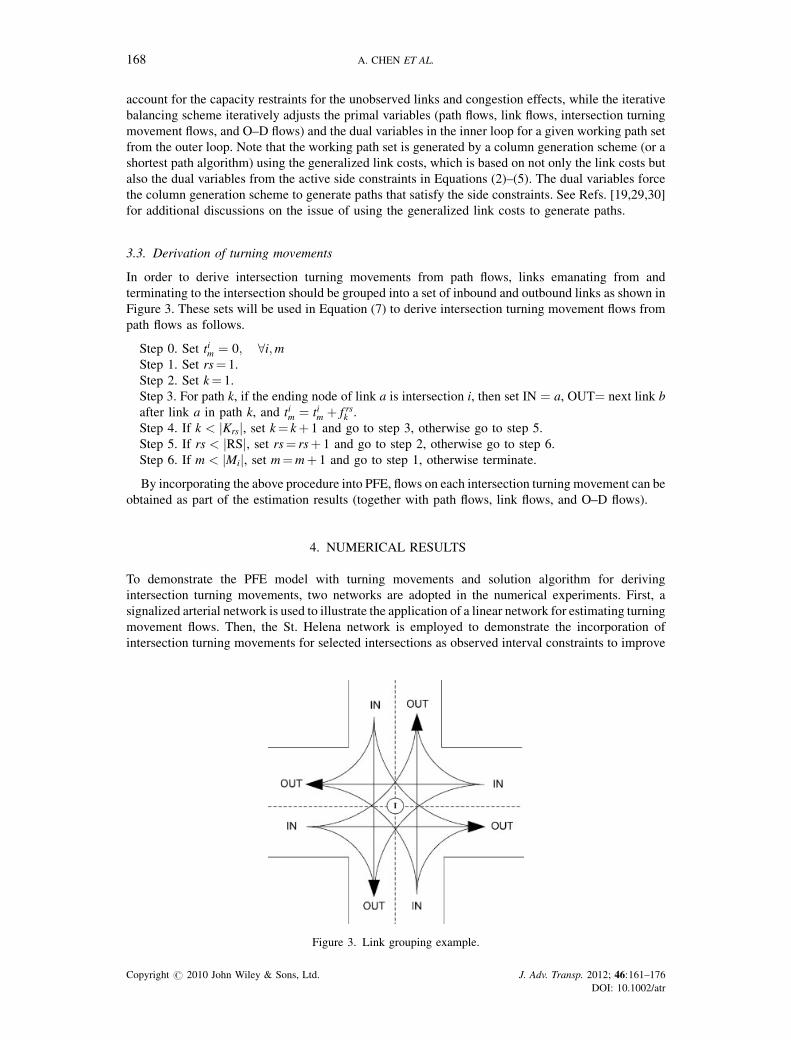
3.3. Derivation of turning movements
In order to derive intersection turning movements from path flows, links emanating from and
terminating to the intersection should be grouped into a set of inbound and outbound links as shown in
Figure 3. These sets will be used in Equation (7) to derive intersection turning movement flows from
path flows as follows.
Step 0. Set tim ¼ 0; 8i;mStep 1. Set rs¼ 1.
Step 2. Set k¼ 1.
Step 3. For path k, if the ending node of link a is intersection i, then set IN ¼ a, OUT¼ next link b
after link a in path k, and tim ¼ tim þ f rsk .
Step 4. If k < Krsj j, set k¼ kþ 1 and go to step 3, otherwise go to step 5.
Step 5. If rs < RSj j, set rs¼ rsþ 1 and go to step 2, otherwise go to step 6.
Step 6. If m < Mij j, set m¼mþ 1 and go to step 1, otherwise terminate.
By incorporating the above procedure into PFE, flows on each intersection turning movement can be
obtained as part of the estimation results (together with path flows, link flows, and O–D flows).
4. NUMERICAL RESULTS
To demonstrate the PFE model with turning movements and solution algorithm for deriving
intersection turning movements, two networks are adopted in the numerical experiments. First, a
signalized arterial network is used to illustrate the application of a linear network for estimating turning
movement flows. Then, the St. Helena network is employed to demonstrate the incorporation of
intersection turning movements for selected intersections as observed interval constraints to improve
Figure 3. Link grouping example.
Copyright # 2010 John Wiley & Sons, Ltd. J. Adv. Transp. 2012; 46:161–176
DOI: 10.1002/atr
168 A. CHEN ET AL.
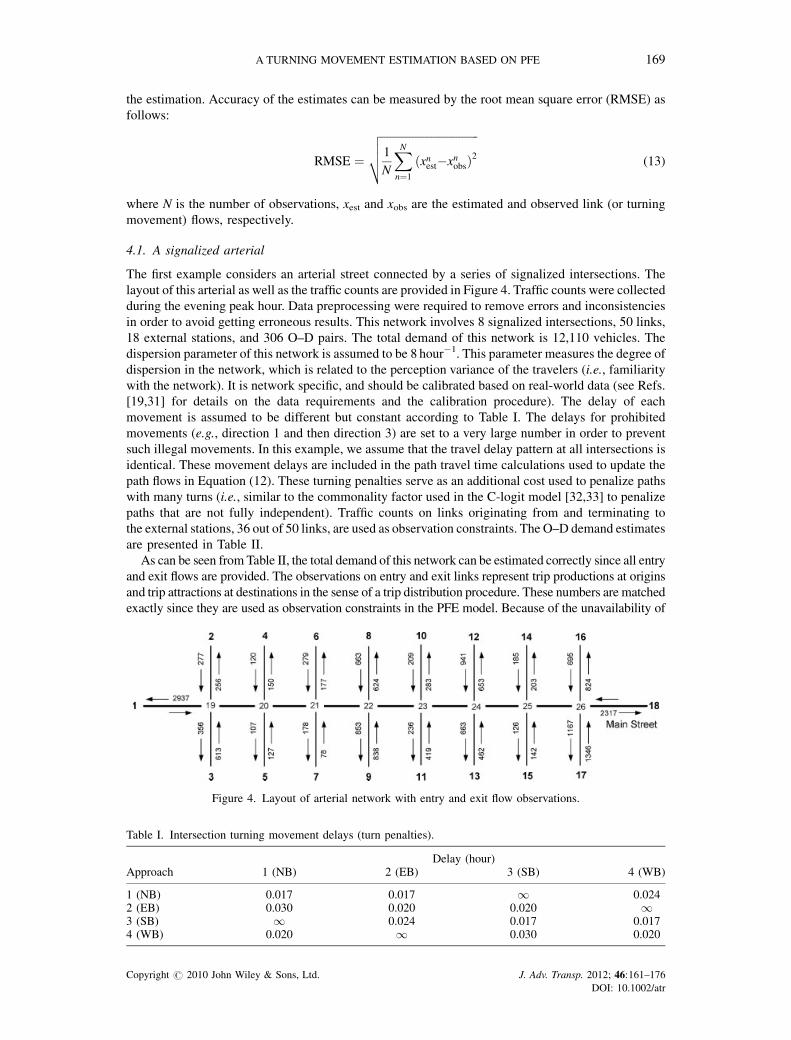
the estimation. Accuracy of the estimates can be measured by the root mean square error (RMSE) as
Copyright # 2010 John Wiley & Sons, Ltd. J. Adv. Transp. 2012; 46:161–176
DOI: 10.1002/atr
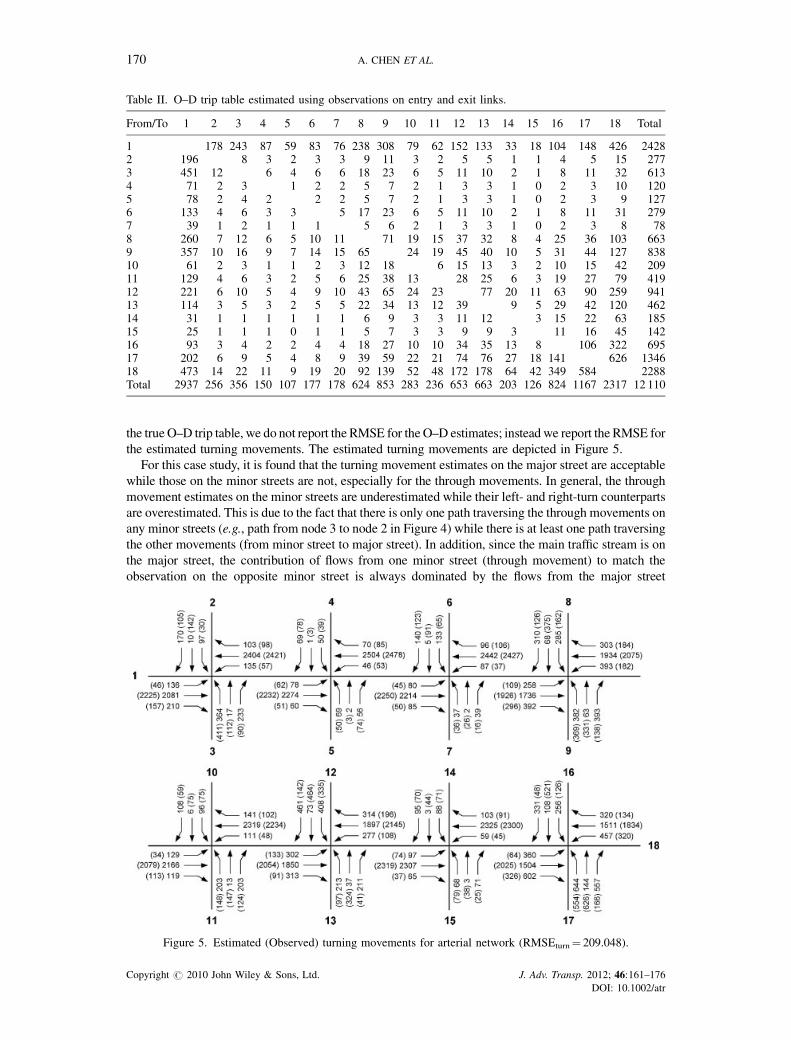
170 A. CHEN ET AL.
especially when the turn penalties at intersection are likely to be mis-specified. The observed (in
parenthesis) and estimated turning movement flows are shown in Figure 5 for comparison.
4.2. St. Helena network
The City of St. Helena is located in the famous wine-producing region of Napa Valley in California,
approximately 65miles north of San Francisco. St. Helena is a full service City with a population of
6,019 (as of January 1, 2002) within an area of 4 square miles. The City’s development pattern is
relatively compact, with commercial development and wineries concentrated along Highway 29 (Main
Street) corridor, and residential development radiating out from Main Street (see Figure 6).
Link volumes collected during the evening peak hour, the time of day when traffic congestion on
Highway 29 presents a serious issue, were assembled and a network with 28 TAZs was coded with the
observed link volumes. The network contains 113 links and 54 of the links do not have traffic count
data. Turn penalties, based on the actual traffic conditions, were also coded with the network such that
the shortest paths among TAZ centroids replicate actual travel patterns in the area. PFE was applied to
the network for estimation of the O–D table as well as turning movements.
For this set of experiments, link counts were aggregated from turning movement counts. As a result,
there are link counts on all approaches (both in-bounds and out-bounds) of each intersection. In
addition, turning movement counts at two intersections (Fulton/Main and Mitchell Dr./Oak Avenue)
were also considered to assist the estimation (used as constraints in addition to link observation
constraints). The following three sets of traffic counts were used for the estimations.
1. Link counts only (Base case).
2. Base case plus turning counts at Fulton/Main (Option A).
3. Option A plus turning counts at Mitchell Dr./Oak Avenue (Option B).
Figure 6. Topology of St. Helena network and locations of intersection turning movement counts.
Copyright # 2010 John Wiley & Sons, Ltd. J. Adv. Transp. 2012; 46:161–176
DOI: 10.1002/atr
A TURNING MOVEMENT ESTIMATION BASED ON PFE 171
For these sets of data, there exists flow inconsistency; the total inflow is not equal to the total outflow
at some intersections, especially at Fulton/Main and Madrona Street/Oak Avenue. The westbound
outflow from Fulton/Main (143 units) is quite different from the observed westbound inflow at
Madrona Street/Oak Avenue (171 units), about 17 percent error. For adjusting the measurement errors
of link counts, it was assumed that the turning movement counts at Fulton/Main and Mitchell Dr./Oak
Avenue intersections are error-free. The measurement errors of individual link counts were adjusted
differently dependent on their difficulty in matching the counts. These errors vary from 0 to 17 percent
of actual link counts.
Figure 6 depicts the map of St. Helena network and locations of two intersections (black circles) of
which turning movement counts were considered to assist the estimation. The turningmovement counts at
other intersections (hollow circles) were also collected for comparison purposes. Table III summarizes the
numbering systems, names, and observed turning movement counts of all considered intersections.
Table IV summarizes the estimation results in terms of link flow and turning flow estimates. Since
the same error bounds were used for all link measurements in all three cases, there is no significant
difference in terms of replicating the observed link counts. The maximum error of estimated link flows
is about 17 percent, while the RMSEs are about the same for all cases. However, it can be observed that
the ability of matching link counts is slightly deteriorated (higher RMSE) when turning movement
counts were also considered in the estimation. From Figure 7, it is found that, for all three cases, about
46–47 percent of estimated link flows are within �3 percent of observed values, and almost all
estimated link flows (98–99 percent) are within �12 percent of the observed values.
From Table IV (second column), when the turning movement counts were incorporated into the
estimation, the accuracies of turning flow estimates are generally improved. The RMSE is reduced
from 39.61 in the base case to 33.59 in Option A, and to 28.89 in Option B. The results imply the benefit
of incorporating partial turning movement counts in the estimation. However, the maximum errors of
estimated turning movement flows could be very large (�1,000 percent), this is due to the fact that
many small-observed turning movement volumes (e.g., 1 unit of flow) are highly overestimated. About
Table III. Numbering systems, names, and observed intersection turning movement counts.
ID Name Observation
NBL NBT NBR SBL SBT SBR EBL EBT EBR WBL WBT WBR
31 Fulton Ln and Main 46 609 32 32 563 70 148 46 13 8 27 15832 Sulphur Spring Ave and Main 81 817 844 35 7 7233 Madrona St and Oak Avenue 36 25 93 9 22 2 4 145 75 83 81 734 Mitchell Dr and Oak Avenue 241 11 35 33 31 14040 Bonita Ave and Main 30 794 858 49 19 2168 Mills Ln and Main 841 3 5 841 6 470 Grayson Ave and Main 125 807 760 87 37 7871 Dowdell Ln and Main 735 45 48 790 42 16773 Pine St and Main 1 685 13 4 570 10 1 16 3 1 175 Adams St and Main 43 607 40 67 490 32 60 118 27 72 58 3277 Adams St and Oak Avenue 18 139 111 26 167 10 12 47 26 76 41 3578 Hunt Ave and Main 504 141 41 637 24 3680 Spring St and Oak Avenue 39 160 12 36 213 44 62 52 59 13 63 4981 Spring St and Main 93 623 598 63 22 7282 Mitchell Dr and Main 607 63 93 602 232 10986 Vintage Ave and Main 742 71 30 823 84 66
Table IV. Accuracies of link flow and turning movement estimates.
Option Link flows Turning movements
RMSE Max error (percent) RMSE Max error (percent)
Base Case 27.13 17 39.61 901Option A 27.15 17 33.59 1053Option B 27.27 17 28.89 1234
Copyright # 2010 John Wiley & Sons, Ltd. J. Adv. Transp. 2012; 46:161–176
DOI: 10.1002/atr
172 A. CHEN ET AL.
73 percent of turning movement flows estimated in the base case, 80 percent of turning movement
flows estimated in Option A, and 76 percent of turning movement flows estimated in Option B are
within �12 percent of the observed values.
Figures 8a, 8b, and 8c display the estimation errors of turning movement flows at different
flow levels for the base case, Option A, and Option B, respectively. For all three cases, majority of the
Figure 7. Estimation errors of link flow estimates.
Figure 8. Estimation errors of the intersection turning movement flows estimated for all three cases.
Copyright # 2010 John Wiley & Sons, Ltd. J. Adv. Transp. 2012; 46:161–176
DOI: 10.1002/atr
A TURNING MOVEMENT ESTIMATION BASED ON PFE 173
high-observed turning movement volumes (e.g.,� 200 vph; more important) can be estimated within
�20 percent of the observed values. These figures also reveal the fact that a lot of the small-observed
turning movement volumes are highly overestimated (e.g., >100 percent).
5. CONCLUDING REMARKS
In this paper, we demonstrated how to derive complete link and turning movement estimates for the
whole network together with O–D trip table given some link counts and intersection turning movement
counts via the nonlinear PFE. In particular, we suggested an approach to derive intersection turning
movement flows without the need to expand the network. Two case studies with actual traffic count
data were used to test the intersection turning movement estimation using PFE. The results obtained
from the case studies are encouraging. PFE can estimate link volumes and turning movement flows
within an acceptable error bound. It is also found that estimation accuracy is better when more link
traffic counts (and intersection turning movement counts) are available. Despite the promising results,
additional work is needed to investigate the PFE model with more case studies and to refine the PFE to
better model the turning movements, leading to the improvement of the quality of O–D estimates as a
whole.
6. LIST OF SYMBOLS AND ABBREVIATIONS
6.1. Symbols
I, I Sets of measured and all intersections
Mi Set of turning movements at intersection i
A, A^
, A Sets of measured, unmeasured, and all links (A¼A[A^)RS, RS Sets of target (or prior) and all O-D pairs
Krs Set of paths connecting origin r and destination s
u Dispersion parameter
INi, OUTi Sets of links terminating into and originating out of intersection i
"im; "a; "rs Measurement errors [0,1] for turning movement m from intersection i, flows on link a,
and target O-D demands between origin r and destination s
gim; tim Observed and estimated flows on turning movement m at intersection i
va, xa Observed and estimated flows on link a
Ca, taðÞ Capacity and cost function of link a
zrs, qrs Target and estimated O-D flows between origin r and destination s
f rsk Estimated flows on path k connecting origin r and destination s
drsak Path-link indicator: 1 if link a is on path k between origin r and destination s, and 0
otherwise
xest; xobs Estimated and observed link or turning movement flows
6.2. Abbreviations
PFE Path Flow Estimator
NETFLO Network Flow
O-D Origin-Destination
SUE Stochastic User Equilibrium
MPRE Maximal Possible Relative Error
ERE Expected Relative Error
TDS Total Demand Scale
RMSE Root Mean Square Error
ACKNOWLEDGEMENTS
This research was supported in part by the California Partners for Advanced Transit and Highways
(PATH) Program through a grant (TO 5502). The contents of this paper reflect the views of the authors
Copyright # 2010 John Wiley & Sons, Ltd. J. Adv. Transp. 2012; 46:161–176
DOI: 10.1002/atr
174 A. CHEN ET AL.
who are responsible for the facts and the accuracy of the data presented herein and do not necessarily
reflect the views of our sponsor. Constructive comments and suggestions provided by two anonymous
referees are highly appreciated.
REFERENCES
1. Caltrans. ‘‘Guide for the preparation of traffic impact studies’’, Caltrans, State of California, Department
of Transportation. December 2002. http://www.dot.ca.gov/hq/traffops/developserv/operationalsystems/reports/
tisguide.pdf
2. Furness KP. Time function iteration. Traffic Engineering and Control 1965; 7(7): 458–460.3. Jeffreys M, Norman M. On finding realistic turning flows at road junctions. Traffic Engineering and Control 1977;
18(1): 19–25.4. Mekky A. On estimating turning flows at road junctions. Traffic Engineering and Control 1979; 20(10): 486–
487.
5. van Zuylen HJ. The estimation of turning flows on a junction. Traffic Engineering and Control 1979; 20(11): 539–541.
6. Hauer E, Pagitsas E, Shin BT. Estimation of turning flows from automatic counts. In Transportation Research Record
1981; 795: 1–7.7. Bell MGH. The estimation of junction tuning movements from traffic counts: the role of prior information. Traffic
Engineering and Control 1984; 25(5): 279–283.8. Maher MJ. Estimating the turning flows at a junction: A comparison of three models. Traffic Engineering and
Control 1984; 25(1): 19–22.9. Schaefer MC. Estimation of intersection turning movements from approach counts. ITE Journal 1988; 58(10): 41–
46.
10. Martin PT, Bell MC. Network programming to derive turning movements from link flows. Transportation Research
Record 1992; 1365: 147–154.11. Martin PT. Turning movement estimation in real time. Journal of Transportation Engineering 1997; 123(4): 252–
260.
12. Wu JH, Thnay C. An O–D based method for estimating link and turning volume based on counts. Paper presented at
ITE District 6 Annual Meeting, July 8–11, New Mexico, 2001.
13. Spiess H. ‘‘A Gradient Approach for the O–D Matrix Adjustment Problem’’ CRT-693, 1990. http://www.inro.ca/en/
pres_pap/international/ieug90/Paper01_ 1990.pdf
14. Sherali HD, Sivanandan R, Hobeika AG. A linear programming approach for synthesizing origin–destination trip
tables from link traffic volumes. Transportation Research Part B 1994; 28(3): 213–234.15. Wardrop JG. Some theoretical aspects of road traffic research. Proceedings of the Institution of Civil Engineering,
Part II (1), U.K. 1952: pp. 325–378.
16. Yang H, Iida Y, Sasaki T. Estimation of origin–destination matrices from traffic counts on congested networks.
Transportation Research Part B 1992; 26(6): 417–434.17. Maher M, Zhang X, van Vliet D. A bi-level programming approach for trip matrix estimation and traffic
control problems with stochastic user equilibrium link flows. Transportation Research Part B 2001; 35(1):23–40.
18. Bell MGH, Shield CM. A log-linear model for path flow estimation. Proceedings of the 4th International
Conference on the Applications of Advanced Technologies in Transportation Engineering, Carpi, Italy, 1995:
pp. 695–699.
19. Bell MGH, Shield CM, Busch F, Kruse G. A stochastic user equilibrium path flow estimator. Transportation
Research Part C 1997; 5(3/4): 197–210.20. Chen A, Chootinan P, Recker W. Examining the quality of synthetic origin–destination trip table estimated by path
flow estimator. Journal of Transportation Engineering 2005; 131(7): 506–513.21. Yang H, Iida Y, Sasaki T. An analysis of the reliability of an origin–destination trip matrix estimated from traffic
counts. Transportation Research Part B 1991; 25(5): 351–363.22. Gan L, Yang H, Wong SC. Traffic counting location and error bound in origin–destination matrix estimation
problems. Journal of Transportation Engineering 2005; 131(7): 524–534.23. Bierlaire M. The total demand scale: a new measure of quality for static and dynamic origin–destination trip tables.
Transportation Research Part B 2002; 36(9): 755–851.24. Dial R. A probabilistic multipath traffic assignment model that obviates path enumeration. Transportation Research
1971; 5: 83–113.25. Fisk C. Some developments in equilibrium traffic assignment. Transportation Research Part B 1980; 14(3): 243–
255.
26. Larsson T, Patriksson M. An augmented Lagrangian dual algorithm link capacity side constrained traffic assignment
problems. Transportation Research Part B 1995; 29(6): 433–455.27. Chootinan P, Chen A, Recker W. Improved path flow estimator for estimating origin–destination trip tables.
Transportation Research Record 2005; 1923: 9–17.28. Bell MGH, Iida Y. Transportation Network Analysis. Wiley: New York, 1997.
Copyright # 2010 John Wiley & Sons, Ltd. J. Adv. Transp. 2012; 46:161–176
DOI: 10.1002/atr
A TURNING MOVEMENT ESTIMATION BASED ON PFE 175
29. Chen A, Chootinan P, Recker W. Norm approximation method for handling traffic count inconsistencies in path flow
estimator. Transportation Research Part B 2009; 43(8): 852–872.30. Chen A, Ryu S, Chootinan P. L1-norm path flow estimator for handling traffic count inconsistencies: Formulation
and solution algorithm. ASCE Journal of Transportation Engineering 2010; 136(6): 565–575.31. Sheffi Y. Urban Transportation Networks: Equilibrium Analysis with Mathematical Programming Methods.