Page 1
ENG450 ENGINEERING INTERNSHIP
MURDOCH UNIVERSITY AUSENCO SCHOOL OF ENGINEERING AND ENERGY
AN INTRODUCTION TO COPPER EXTRACTION
ELECTRICAL ENGINEERING IN THE PROCESS
INDUSTRY: THEORETICAL FOUNDATIONS AND
PRACTICAL CONSIDERATIONS
ENG450 ENGINEERING INTERNSHIP
A report submitted to the School of Engineering and Energy, Murdoch University in partial fulfilment of the requirements for the degree of Bachelor of Engineering
Name: David Stewart
Student Number: 12005178
Academic Supervisor: Gregory Crebbin
Industrial Supervisor: Bruce Larcombe
November 2008
Page 2
ENG450 ENGINEERING INTERNSHIP
MURDOCH UNIVERSITY AUSENCO SCHOOL OF ENGINEERING AND ENERGY
i David Stewart 12005178
ABSTRACT The objective of this report is to provide an overview of copper extraction and demonstrate many
of the practical applications and considerations related to low voltage motor selection and the
implementation of a Control System to manage operation of a Ball Mill used in the copper
extraction process.
This report is an accompaniment to work conducted during my Internship placement at Ausenco
as part of ENG450 Engineering Internship. During my time spent in the Electrical division
assigned to Kinsevere I have gained experience and insight into the daily operations required for
practical engineering in the process industry, and some of these experiences are included where
relevant within the body of this report.
Page 3
ENG450 ENGINEERING INTERNSHIP
MURDOCH UNIVERSITY AUSENCO SCHOOL OF ENGINEERING AND ENERGY
ii David Stewart 12005178
DISCLAIMER I declare the following to be my own work, unless otherwise referenced, as defined by the University’s policy on plagiarism.
David Stewart
Page 4
ENG450 ENGINEERING INTERNSHIP
MURDOCH UNIVERSITY AUSENCO SCHOOL OF ENGINEERING AND ENERGY
iii David Stewart 12005178
ACKNOLEDGEMENTS
From Murdoch University
For all their work conducted in setting up the internship: Professor Parisa Bahri
(Head-Electrical, Energy and Process Engineer) Dr Greg Crebbin
(Senior Lecturer and Academic Supervisor) Roselina Stone
(School Administrative Assistant)
From Ausenco
For the opportunity to conduct my internship in an industrial placement and their experience guidance along the way: Mr Terry Robson
(Principal Engineer)
Mr Bruce Larcombe
(Kinsevere Lead Engineer and Academic Supervisor)
Mr Martin Cholkowski
(Senior Control Systems Engineer)
And Lastly: Mum and Dad
Page 5
ENG450 ENGINEERING INTERNSHIP
MURDOCH UNIVERSITY AUSENCO SCHOOL OF ENGINEERING AND ENERGY
iv David Stewart 12005178
TABLE OF CONTENTS
1 Introduction ........................................................................................................................... 1
2 Background Information...................................................................................................... 2
2.1 Introduction to the Kinsevere project .............................................................................. 2
2.2 Overview of copper extraction ........................................................................................ 4
2.3 Summary of the power system ........................................................................................ 7
3 Characteristics of an ac induction motor............................................................................ 9
3.1 Principles of operation..................................................................................................... 9
3.2 Squirrel cage motors...................................................................................................... 16
3.2.1 Torque ‐ speed curves ........................................................................................................20
3.2.2 Voltage and frequency relationship ...................................................................................21
3.3 Load characteristics and motors drives ......................................................................... 23
3.3.1 DOL drives...........................................................................................................................24
3.3.2 VVVF drives.........................................................................................................................25
4 Load flow study and LV cable selection............................................................................ 30
4.1 Load flow study............................................................................................................. 30
4.2 Summary of MCC loads................................................................................................ 32
4.3 LV cable selection ......................................................................................................... 32
4.4 Example demonstrating methodology........................................................................... 34
5 Processes involved in ore reduction................................................................................... 43
5.1 Crushers......................................................................................................................... 43
5.2 Conveyors...................................................................................................................... 44
Page 6
ENG450 ENGINEERING INTERNSHIP
MURDOCH UNIVERSITY AUSENCO SCHOOL OF ENGINEERING AND ENERGY
v David Stewart 12005178
5.3 Ball mill ......................................................................................................................... 44
5.3.1 Wound rotor motor............................................................................................................45
5.3.2 Liquid resistance starter .....................................................................................................45
5.3.3 Slip energy recovery ...........................................................................................................46
6 Mill operation and the control system............................................................................... 47
6.1 Overview of the peripheral processes............................................................................ 47
6.1.1 Hydraulic system ................................................................................................................47
6.1.2 Cyclone Separator...............................................................................................................48
6.2 Mill control strategy ...................................................................................................... 49
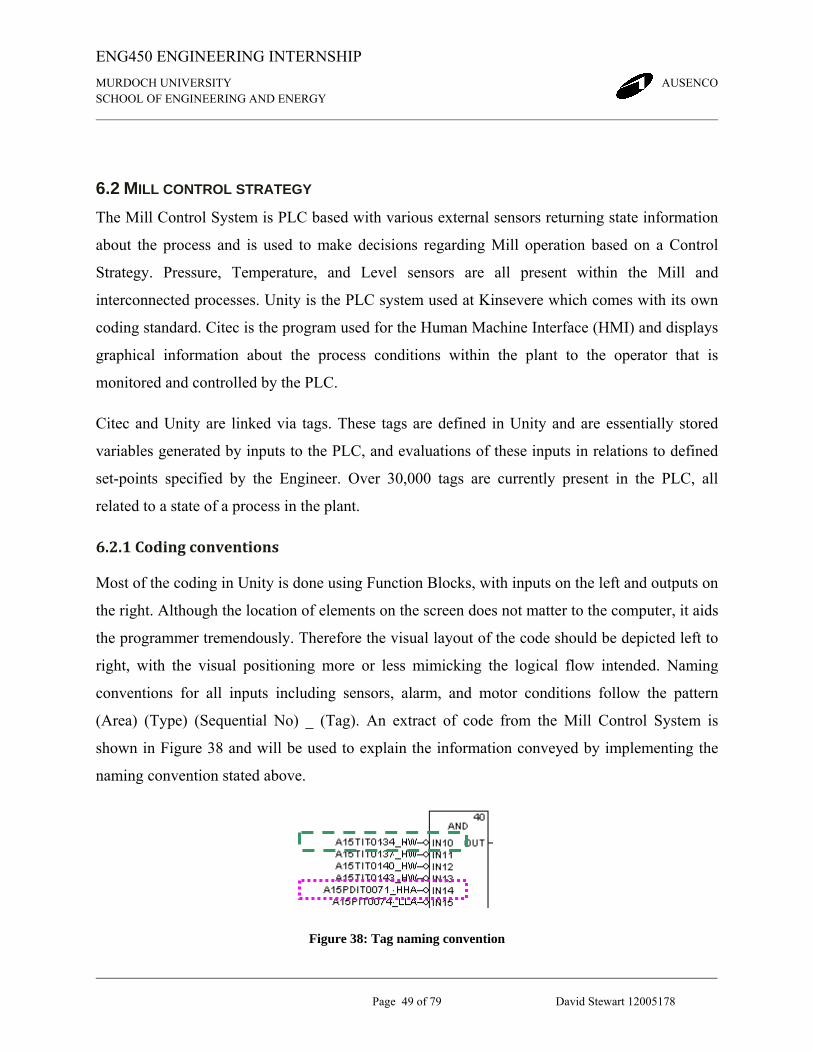
6.2.1 Coding conventions ............................................................................................................49
6.2.2 Interlocks ............................................................................................................................50
6.2.3 Modes of operation............................................................................................................51
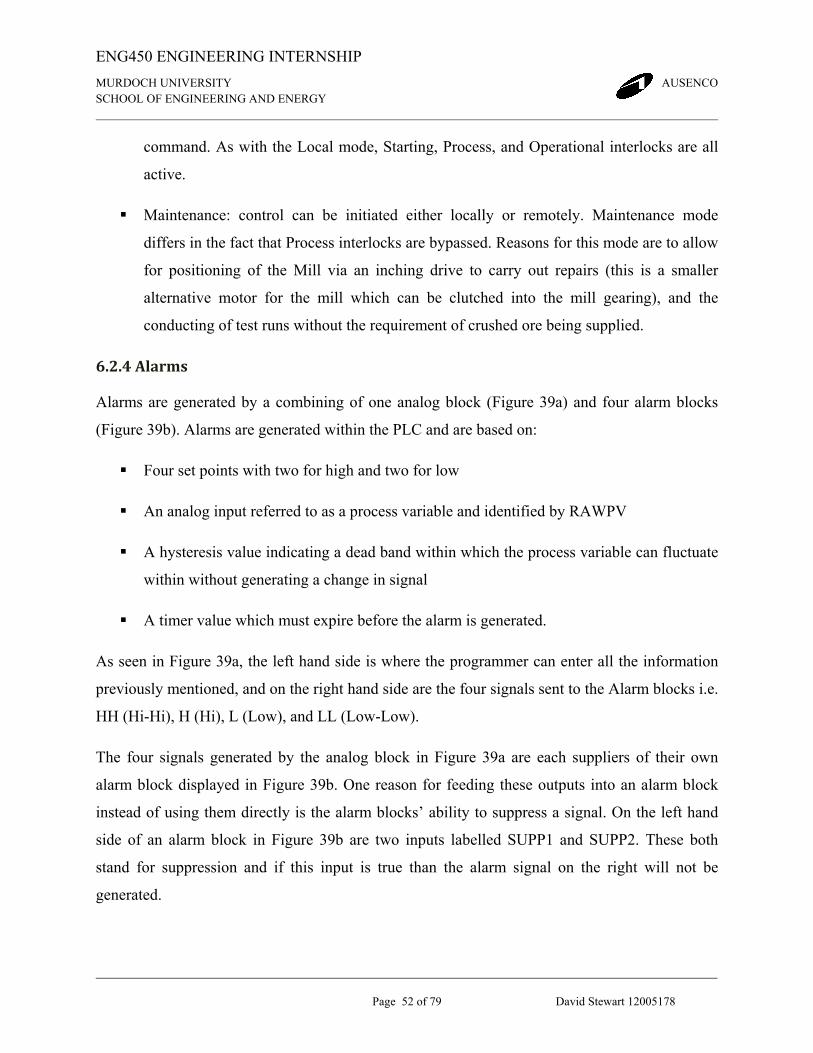
6.2.4 Alarms.................................................................................................................................52
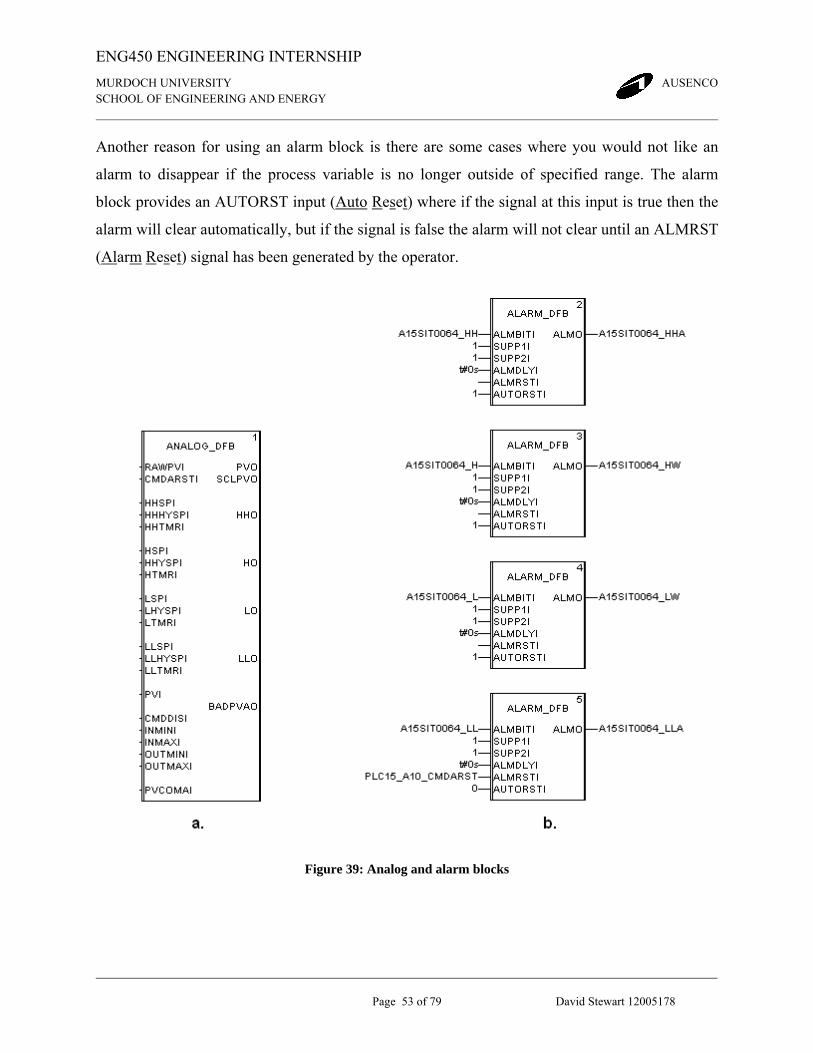
6.2.5 Start‐up procedure .............................................................................................................54
7 Discussion............................................................................................................................. 62
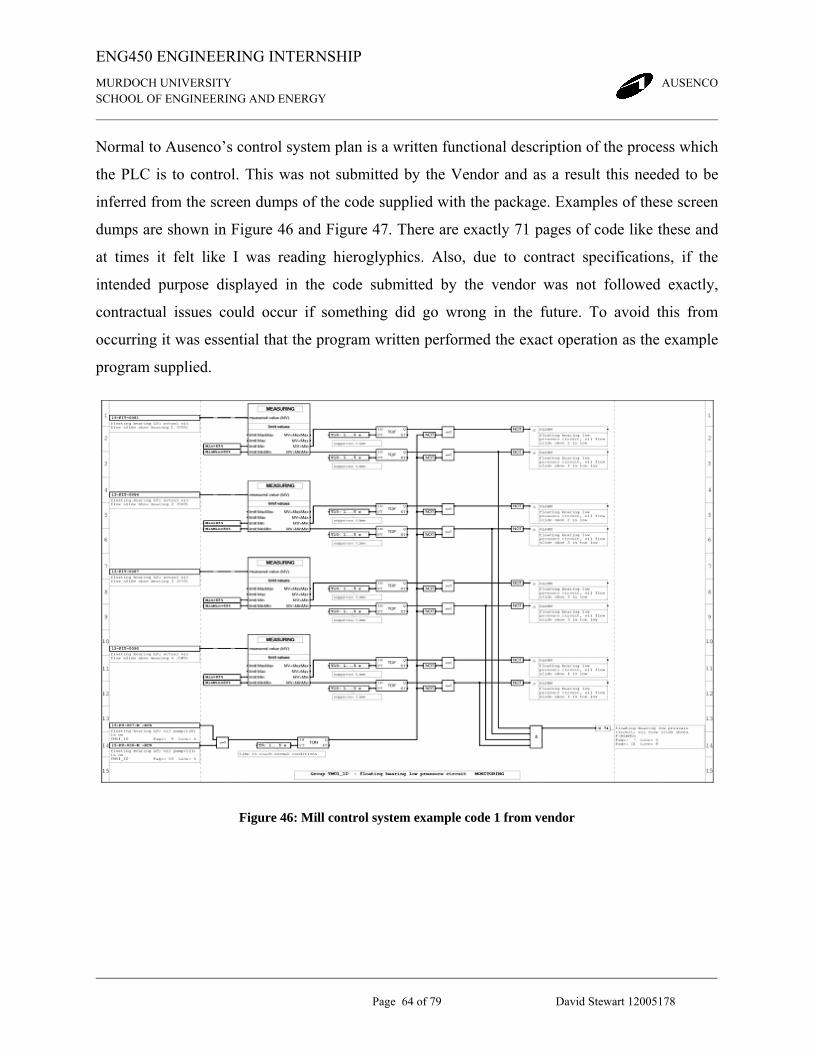
7.1 Problems faced during internship.................................................................................. 63
7.2 Future Work................................................................................................................... 66
8 Conclusion............................................................................................................................ 67
9 References ............................................................................................................................ 68
Page 7
ENG450 ENGINEERING INTERNSHIP
MURDOCH UNIVERSITY AUSENCO SCHOOL OF ENGINEERING AND ENERGY
vi David Stewart 12005178
TABLE OF FIGURE
Figure 1: Location map for Kinsevere project................................................................................ 2
Figure 2: General flow diagram of the copper extraction process.................................................. 6
Figure 3: Simplified Single line diagram of Kinsevere Electrical System ..................................... 8
Figure 4: Stator winding configuration of a two pole motor [10]................................................... 9
Figure 5: Three phase supply to the two pole motor [10]............................................................. 10
Figure 6: Visual impression of current and magnetic field strength [10] ..................................... 11
Figure 7: Visual indication of varying magnetic field strength [10] ............................................ 11
Figure 8: Three phase supply in 30° increments [7] ..................................................................... 12
Figure 9: Resultant Magnetic Flux lines from three phase stator [7] ........................................... 13
Figure 10: Torque induced on a rotor [7]...................................................................................... 14
Figure 11: Sketch of a typical cage rotor motor stator [9]............................................................ 16
Figure 12: Representation of a typical cage rotor design [10]...................................................... 16
Figure 13: Rotor resistance, starting torque, and starting current [7] ........................................... 17
Figure 14: Desired characteristic of a squirrel cage rotor [6] ....................................................... 18
Figure 15: Characteristics of a torque speed curve [6] ................................................................. 20
Figure 16: Torque speed curves of NEMA standard motors [9] .................................................. 21
Figure 17: Load Characteristics a) Constant Torque b) Variable Torque .................................... 23
Figure 18: Constant V/Hz control [7] ........................................................................................... 26
Page 8
ENG450 ENGINEERING INTERNSHIP
MURDOCH UNIVERSITY AUSENCO SCHOOL OF ENGINEERING AND ENERGY
vii David Stewart 12005178
Figure 19: Flux characteristic in constant V/Hz control [7] ......................................................... 27
Figure 20: Voltage boost characteristic in constant V/Hz control [7] .......................................... 27
Figure 21: Effect of frequency change on torque speed curve ..................................................... 28
Figure 22: Schematic of a VVVF drive connection...................................................................... 29
Figure 23: Load flow list for Tailings Area MCC 72-MC-007 and 72-MC-008 (1 of 2)............. 30
Figure 24: Load flow list for Tailings Area MCC 72-MC-007 and 72-MC-008 (2 of 2)............. 31
Figure 25: MCC load flow list from Electrowinning Area 60-MC-001....................................... 31
Figure 26: LV cable selection from Tailings Area MCCs (1 of 3)............................................... 33
Figure 27: LV cable selection from Tailings Area MCCs (2 of 3)............................................... 33
Figure 28: LV cable selection from Tailings Area MCCs (3 of 3)............................................... 34
Figure 29: Simplified process diagram of cyclone feed pump ..................................................... 34
Figure 30: Manufacturers motor data for 400kW squirrel cage motor (WEG) ............................ 35
Figure 31: Cable route and distance.............................................................................................. 36
Figure 32: Table 24 from AS/NZS 3008.1.1:1998 [12]................................................................ 37
Figure 33: Table 12 from AS/NZS 3008.1.1:1998 [12]................................................................ 38
Figure 34: Table 35 from AS/NZS 3008.1.1:1998 [12]................................................................ 39
Figure 35: Table 30 from AS/NZS 3008.1.1:1998 [12]................................................................ 40
Figure 36: Schematic of ROM bin, sublevel conveyor, and Mineral Sizer.................................. 43
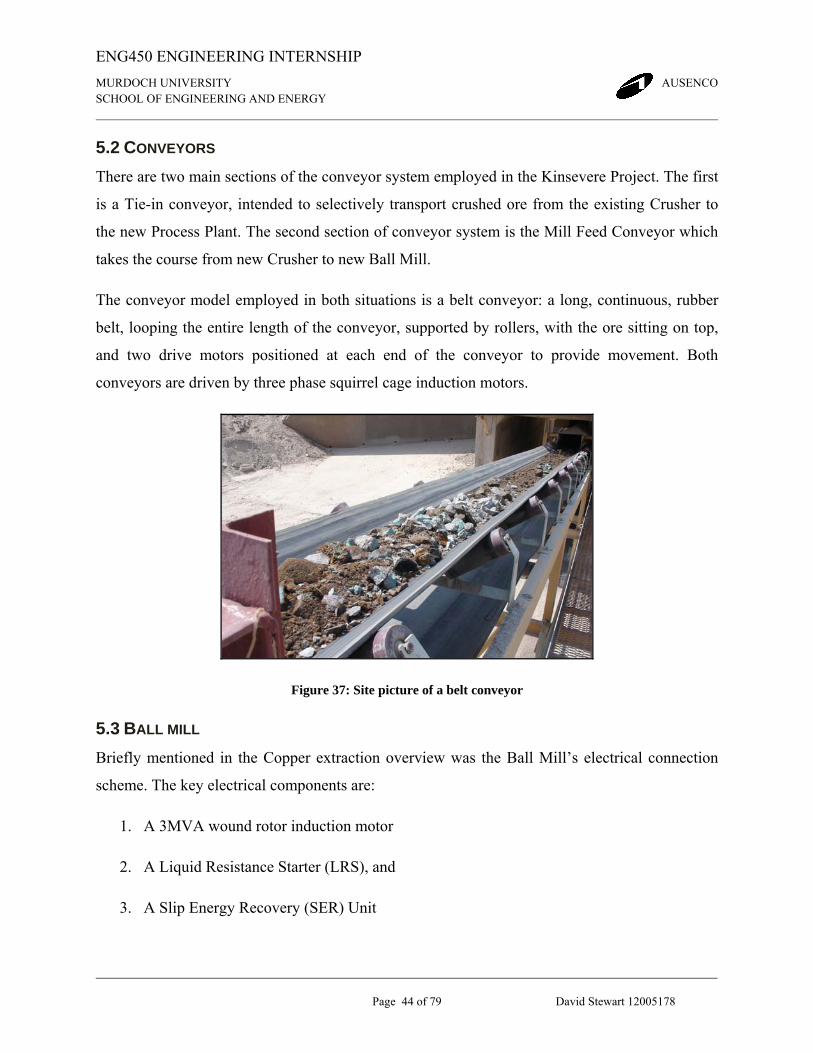
Figure 37: Site picture of a belt conveyor..................................................................................... 44
Figure 38: Tag naming convention ............................................................................................... 49
Page 9
ENG450 ENGINEERING INTERNSHIP
MURDOCH UNIVERSITY AUSENCO SCHOOL OF ENGINEERING AND ENERGY
viii David Stewart 12005178
Figure 39: Analog and alarm blocks............................................................................................. 53
Figure 40: Mill drive in PLC ........................................................................................................ 54
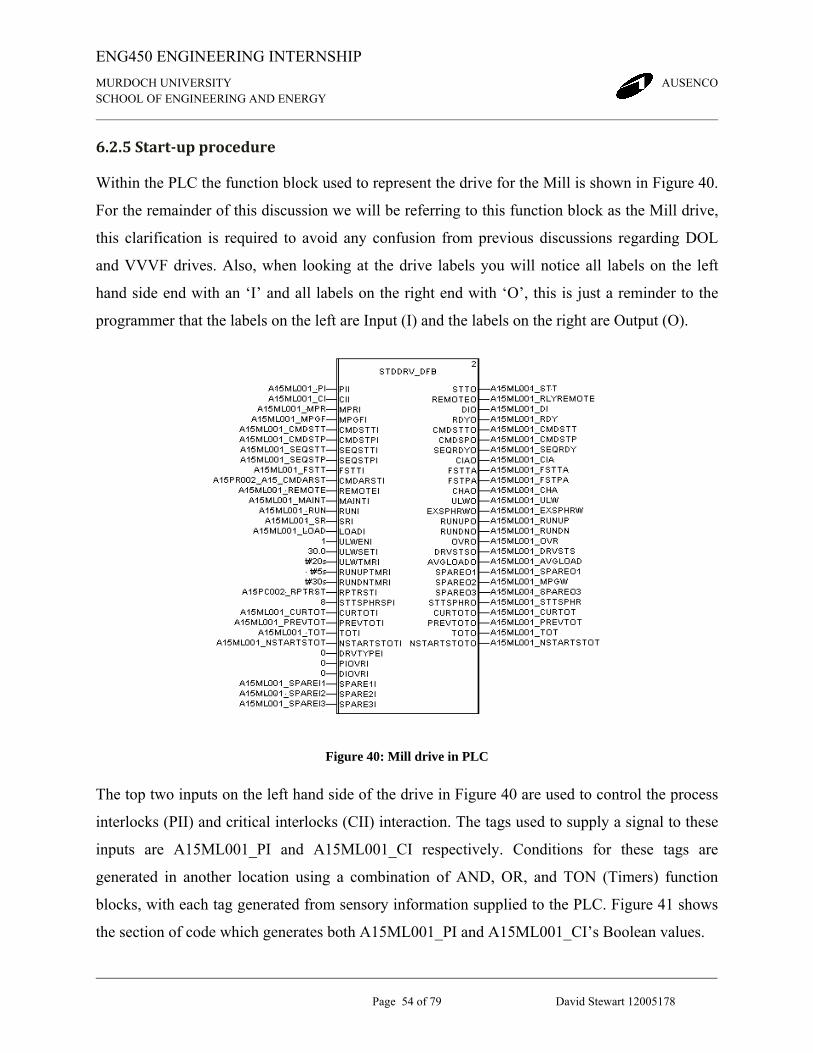
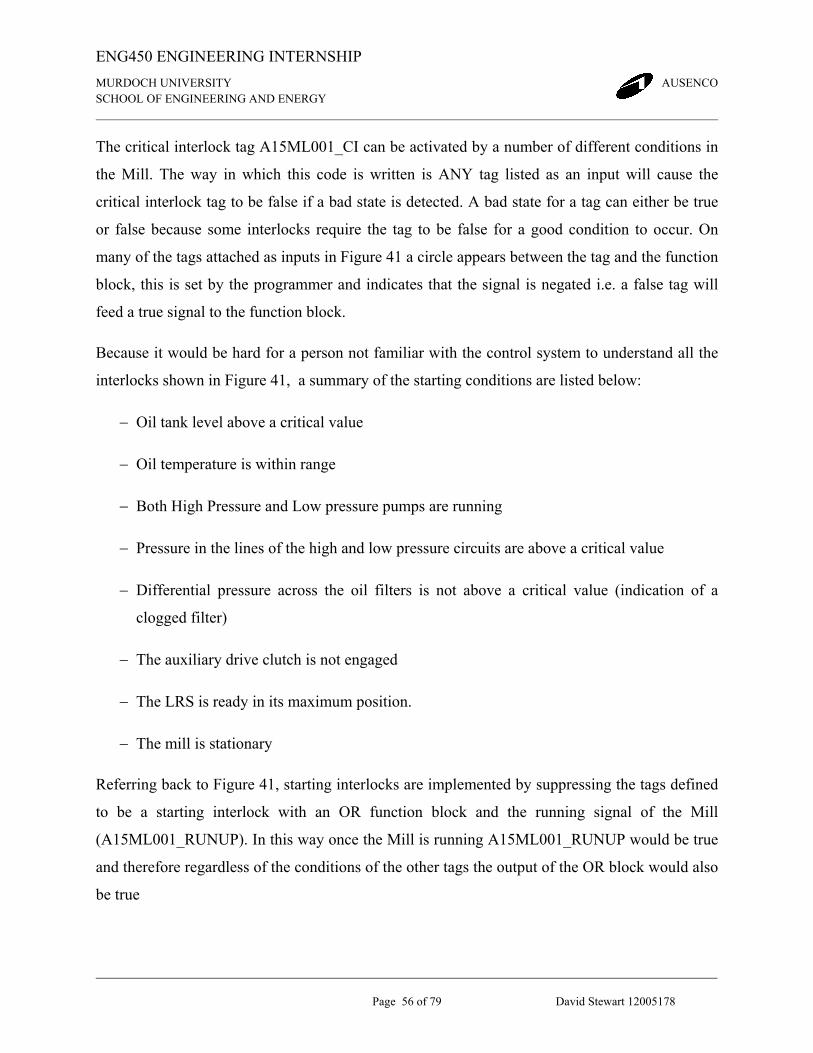
Figure 41: Critical and process interlocks for the mill ................................................................. 55
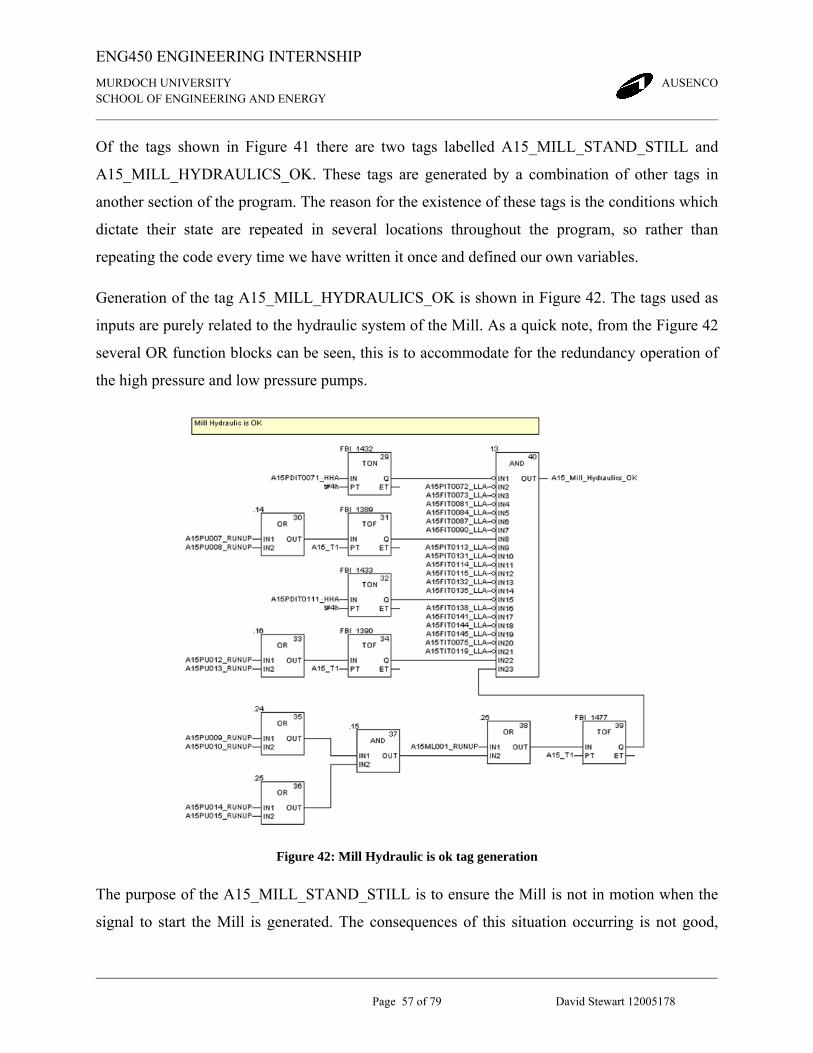
Figure 42: Mill Hydraulic is ok tag generation............................................................................. 57
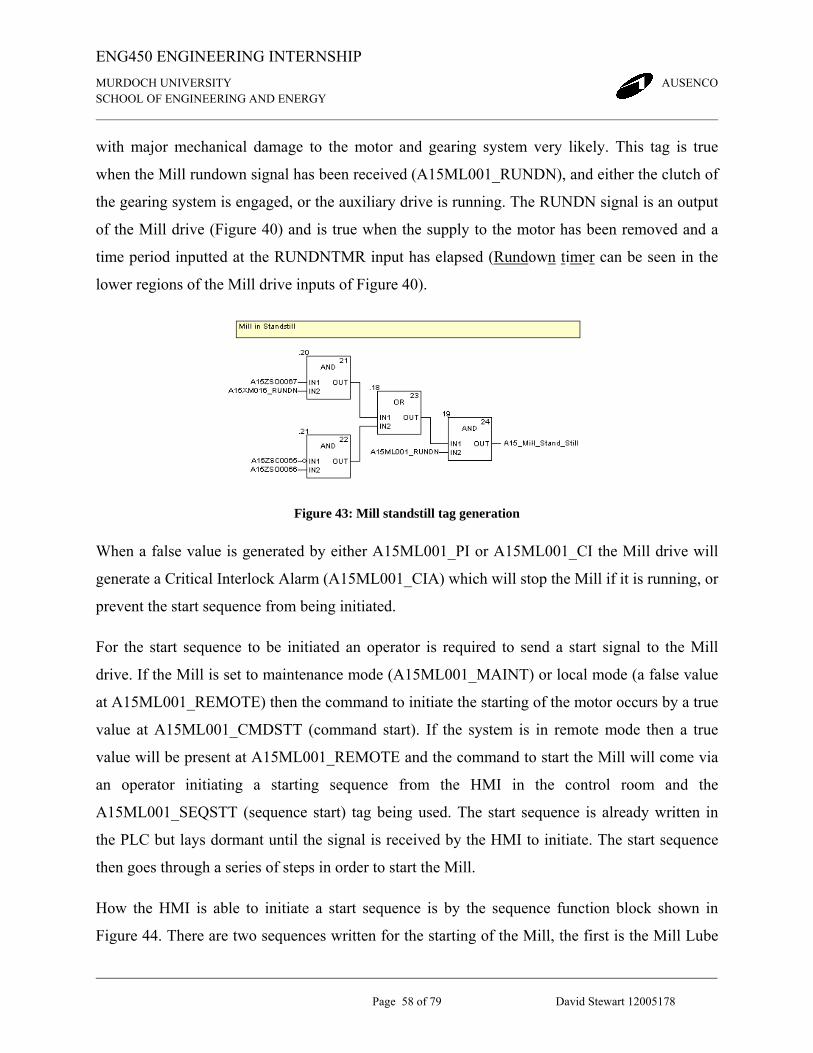
Figure 43: Mill standstill tag generation....................................................................................... 58
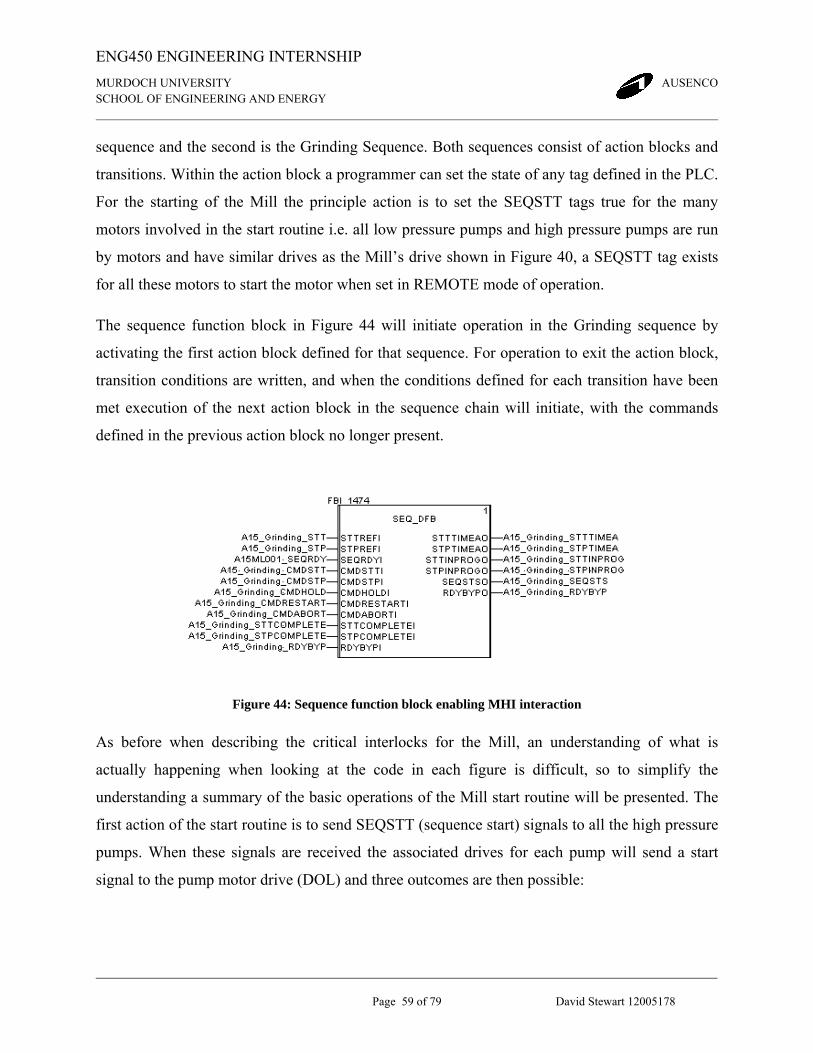
Figure 44: Sequence function block enabling MHI interaction.................................................... 59
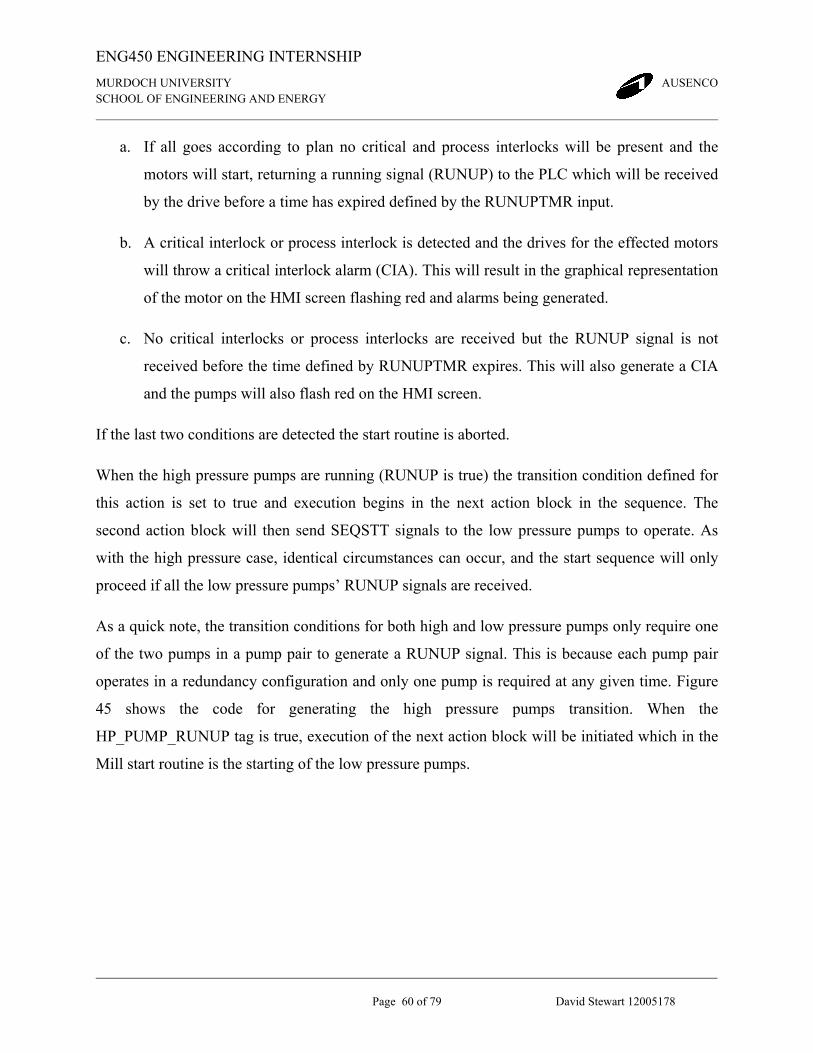
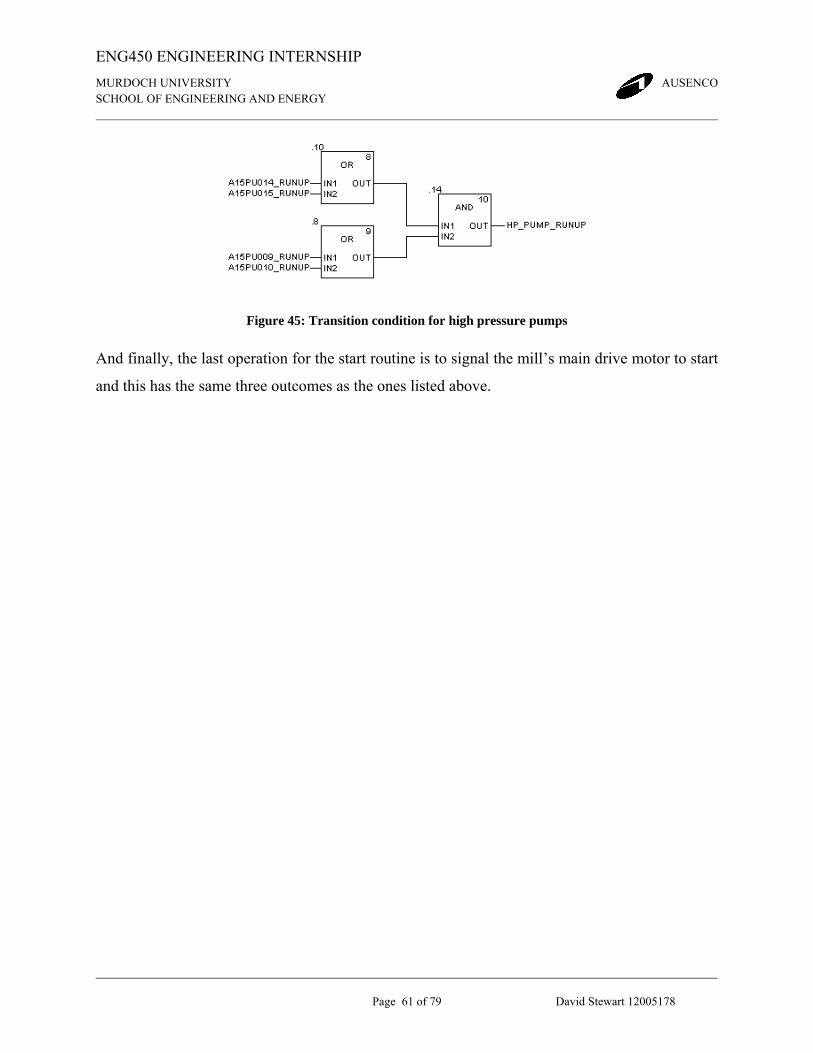
Figure 45: Transition condition for high pressure pumps............................................................. 61
Figure 46: Mill control system example code 1 from vendor....................................................... 64
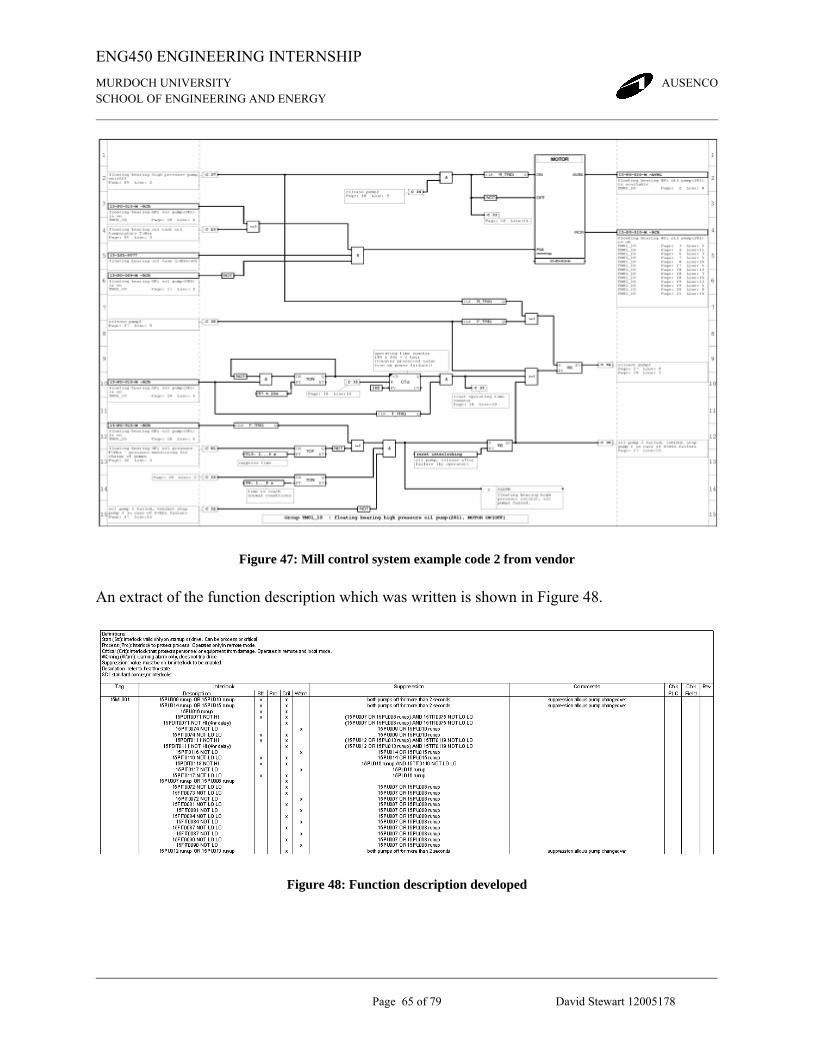
Figure 47: Mill control system example code 2 from vendor....................................................... 65
Figure 48: Function description developed................................................................................... 65
Page 10
ENG450 ENGINEERING INTERNSHIP
MURDOCH UNIVERSITY AUSENCO SCHOOL OF ENGINEERING AND ENERGY
ix David Stewart 12005178
TABLE OF EQUATIONS
Equation 1: Magnetomotive force ................................................................................................ 11
Equation 2: Frequency and rpm of a rotating magnetic flux ........................................................ 12
Equation 3: Induced voltage in a conductor moving in a magnetic field ..................................... 14
Equation 4: Slip percentage .......................................................................................................... 15
Equation 5: Slip and rotor speed................................................................................................... 15
Equation 6: Flux, voltage and frequency ...................................................................................... 22
Equation 7: Torque and voltage.................................................................................................... 24
Page 11
ENG450 ENGINEERING INTERNSHIP
MURDOCH UNIVERSITY AUSENCO SCHOOL OF ENGINEERING AND ENERGY
Page 1 of 79 David Stewart 12005178
1 INTRODUCTION During my Internship I was a member of the Electrical Engineering division at Ausenco and
assigned to the Kinsevere Project. This project involved the design of a Solvent Extraction and
Electrowinning process plant used for copper extraction. My internship was conducted during
Semester 2 of 2008.
The following report focuses on two projects completed during my Internship. The first is a Load
flow Study of all low voltage motors installed on site as well as drive and cable selections for
each. The second is the implementation of a Mill Control System to control the operation of a
3MVA Ball Mill used for secondary crushing in the copper extraction process.
Included in this report is background information regarding the Kinsevere Project, the principles
and processes involved in solvent extraction and electrowinning for copper extraction, and the
electrical connection scheme being implemented. Also included is a detailed analysis of ac
induction motors, and an introduction to the common loads and drive characteristics frequently
present in industrial processing plants. In regards to the Mill Control System I have included an
overview of the electrical conne3ction scheme employed with the Ball Mill, a discussion of the
peripheral processes required for operation, and explanations of key characteristics with a control
system and the reasons for the control strategy used.
It was my intention to proved sufficient information to assist other graduate engineers, like
myself, exposed to similar problems in similar circumstances. In this way the report is intended
to be a guide for future engineering students exposed for the first time to the electrical concerns
of practical engineering in an industrial workplace.
Page 12
ENG450 ENGINEERING INTERNSHIP
MURDOCH UNIVERSITY AUSENCO SCHOOL OF ENGINEERING AND ENERGY
Page 2 of 79 David Stewart 12005178
2 BACKGROUND INFORMATION This section is intended to provide a brief introduction to the copper extraction process and the
Kinsevere project. Additionally information is presented to provide a basic overview of the
electrical connection scheme employed.
2.1 INTRODUCTION TO THE KINSEVERE PROJECT The Kinsevere Copper Extraction Plant described in this report is a brown-field site located in
southern part of the Katanga Province in the Democratic Republic of the Congo (DRC),
approximately 20km north of the provincial capital, Lubumbashi.
Figure 1: Location map for Kinsevere project
The plant is a three stage development project with Stage 1 already completed and consisted of
the installation of a Primary Crusher and Arc Furnace Mineral Processing Plant. The ore is
supplied from an open cut mine producing 550,000 tonne of ore per annum (tpa) at a copper
Page 13
ENG450 ENGINEERING INTERNSHIP
MURDOCH UNIVERSITY AUSENCO SCHOOL OF ENGINEERING AND ENERGY
Page 3 of 79 David Stewart 12005178
grading of 7%. The existing facility is able to extract a 94% grade of copper at a throughput of
25,000 tpa. However this copper is required to be further treated before it is suitable for
commercial use.
Due to the vast quantities of copper ore and the relative inefficiency of the Stage 1 plant, a Stage
2 upgrade has been initiated. The Stage 2 upgrade is expected to increase copper output to
60,000 tpa while raising the purity of the copper to 99.9%. This will be achieved by replacing the
existing Arc Furnace plant with a new SX/EW plant, the principles of which will be explained in
the next section. Planned upgrades for Stage 2 include the addition of a second primary crushing
facility, a link conveyor between the existing crusher and the soon to be installed one, a
secondary crushing facility in the form of a Ball Mill, numerous leaching and thickening tanks, a
tailings disposal facility, and a Solvent Extraction and Electrowinning (SX/EW) plant. A brief
but thorough introduction to the meanings of these processes is provided in the following
section.
Page 14
ENG450 ENGINEERING INTERNSHIP
MURDOCH UNIVERSITY AUSENCO SCHOOL OF ENGINEERING AND ENERGY
Page 4 of 79 David Stewart 12005178
2.2 OVERVIEW OF COPPER EXTRACTION The copper extraction process begins at an open cut mine where Copper Ore is blasted and
removed via Excavators and Tip Trucks. The ore is fed to a Crusher where it is broken down to a
specified maximum size and passed through to a conveyor. When the crushed ore falls onto the
conveyor it is transported to a Ball Mill to have its particle size reduced further. During
transportation the ore on the conveyor has grinding medium added to it, with the quantity added
determined by the ores volumetric flow rate.
The Ball Mill is best seen as a large rotating drum on its side. The conveyor deposits crushed ore
and the included grinding medium inside the Mill at one end. As the Mill revolves, the grinding
medium smash and crush the ore into finer particles, until such time as the ore is of sufficient
size to exit the other end. Grinding medium is not removed from the Mill but smashed to pieces
and exits as part of the output feed. A cyclone separator is used on the Mill’s output feed to
remove the oversized particles. These are returned back to the Ball Mill for further crushing. The
sized particles are collected in leaching tanks where they are submerged in sulphuric acid to
begin the leaching process (where copper ions dissolve into the acid solution).
The sulphuric acid and crushed ore mixture is now referred to as a Process Slurry. The Slurry is
pumped first into a Thickener tank and then a Clarifier. The thickener tank is used to gravity
separate the clay particles from the desired leached solution. Flocculants and Coagulants
(artificial additives that promote amalgamation of fine particles into larger heavier ones) are
added to the mixture to decrease the settling time. Once enough time has expired for the clays to
sufficiently settle, the overflow (top part of the solution within the tank) is then pumped to the
Clarifier. As a general rule Clarifiers will have a lower residence time and produce a thicker
underflow solution. Flocculants will again be added and a settling time is allowed for. The end
result is the Clarifiers overflow stream consisting of a High Grade Copper Leached solution.
This solution is now referred to as a Pregnant Leach Solution and will be treated for copper
extraction. The underflow stream of the Clarifier is pumped back to the original Thickener for
further processing.
Page 15
ENG450 ENGINEERING INTERNSHIP
MURDOCH UNIVERSITY AUSENCO SCHOOL OF ENGINEERING AND ENERGY
Page 5 of 79 David Stewart 12005178
Returning to the original Thickener tank, let’s now address its underflow stream (the solution
within the tank pumped from the bottom). Here we have a much lower concentration and further
treatment needs to occur in order for high grade copper to be extracted. The underflow of the
Thickener tank is passed through a series of additional Thickeners (five in total, referred to as
CCD No.1 to No.5). More flocculants and coagulants are added and further separation occurs
between the clay and copper impregnated leached solution. A second Clarifier is introduced and
a Low Grade Copper Leach Solution is produced (also referred to as a Pregnant Leached
Solution, often prefixed with either LG or HG).
The final two stages of the copper extraction process are Solvent Extraction (SX) and
Electrowinning (EW).
The first stage (SX) is a two step process. First the Pregnant Leached Solution is injected with an
organic solvent which has the beneficial property of attracting copper atoms to its molecular
structure, especially in low acid - low copper leach solution. Copper ions transfer between the
two solutions and once completed, we declare the organic solution to be loaded. This step is
referred to as Extraction. Then the organic solution is contacted with a concentrated sulphuric
acid. Copper is released from the loaded organic and the end result is a sulphuric acid solution
containing very high concentrations of copper. This is referred to as Stripping. The final solution
after Stripping is called a Strong Electrolyte and it is this which will be used in the
Electrowinning process. The remaining solution, containing the now unloaded organic solvent,
goes through a recycling process to be reclaimed for later reuse.
The Electrowinning process is essentially a series of cell batteries. Each cell is comprised of
electrodes (in the form of removable anode and cathode plates), and is filled with the Strong
Electrolyte solution (from the Stripping process). A potential DC voltage is applied to the cells
and, much like the charge cycle of a battery, current flows. Current flows due to chemical
reactions occurring within the electrolyte, and a consequence of this action is the accumulation
of copper onto the electrode plates. When sufficiently coated, the plates are removed from the
solution by a system of hooks and overhead crane and taken to a stripping and washing bay
Page 16
ENG450 ENGINEERING INTERNSHIP
MURDOCH UNIVERSITY AUSENCO SCHOOL OF ENGINEERING AND ENERGY
Page 6 of 79 David Stewart 12005178
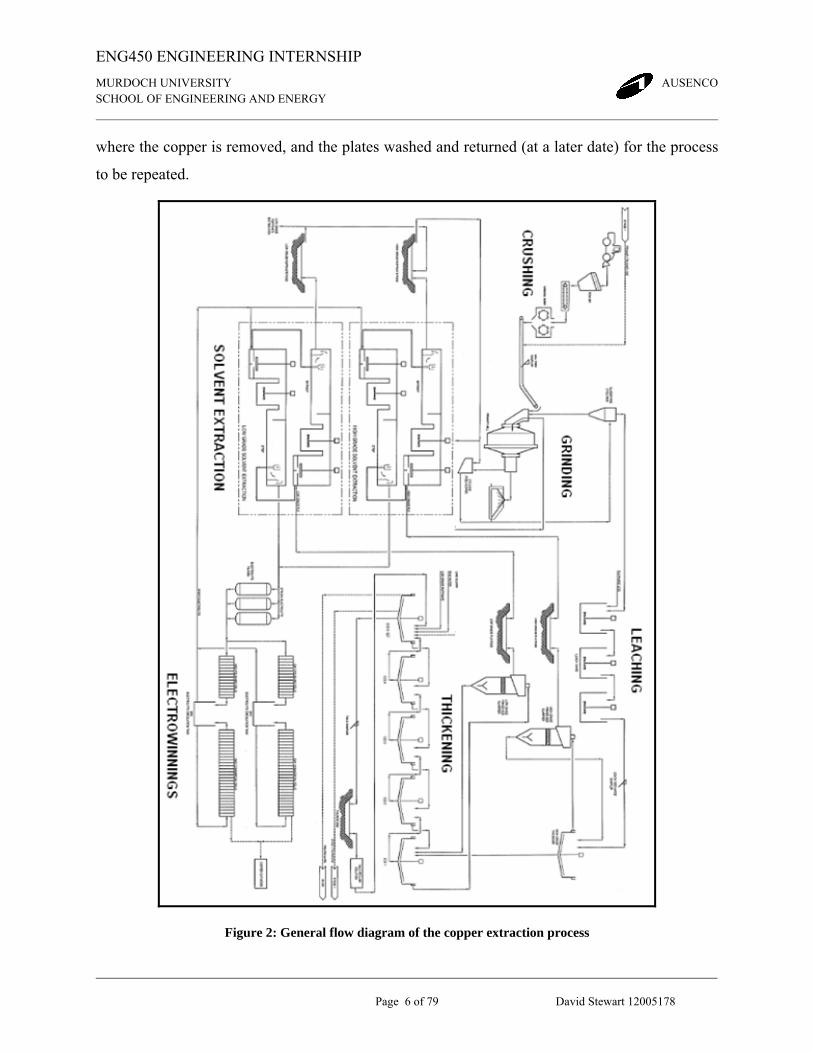
where the copper is removed, and the plates washed and returned (at a later date) for the process
to be repeated.
Figure 2: General flow diagram of the copper extraction process
Page 17
ENG450 ENGINEERING INTERNSHIP
MURDOCH UNIVERSITY AUSENCO SCHOOL OF ENGINEERING AND ENERGY
Page 7 of 79 David Stewart 12005178
2.3 SUMMARY OF THE POWER SYSTEM As this report has an Electrical Engineering perspective a quick introduction to the power system
being implemented at Kinsevere will now be given. Firstly there are two 33kV overhead
transmission lines supplying the site, fed from a 110kV/33kV substation. Each line terminates at
its own switch room. The configuration between the two switch rooms is a split bus, serving as a
contingency option for loss of supply of one incoming feeder.
Nine Motor Control Cubicles (MCCs) are located throughout the plant designated with the
primary function of supplying power to all low voltage motors with power. At a MCC,
depending on the total load connected, 33kV is stepped down to 525V by 0.5MVA, 1 MVA, or
2.5MVA transformers. Drives required for each motor and their protection circuits are stored
within the MCC cabinets. Exceptions to this rule are Variable Speed Drives, which are mounted
along an interior wall of the building housing the MCC.
Only a few cases exist on site where a medium or high voltage connection is required. The first
is the Ball Mill which requires a 3MVA wound rotor induction motor. This is supplied from a
33kV feeder and connected at 11kV by a 3.5MVA dedicated transformer. A Liquid Resistance
Starter (LRS) and a Slip Energy Recovery (SER) Unit will also be employed for this connection.
The other requirement for a medium to high voltage connection is at the Electrowinning plant,
where there are two applications present. The first is a 1.5MVA hot water system used to heat
the Strong Electrolyte solution, and again this will be supplied by a 33kV feeder to a dedicated
2.5MVA transformer with secondary voltage at 525V. The second application is the connection
of two 12 Pulse Rectiformers connected at 33kV generating 180V DC in parallel. It is this DC
voltage that will be applied to the cells of the Electrowinning plant.
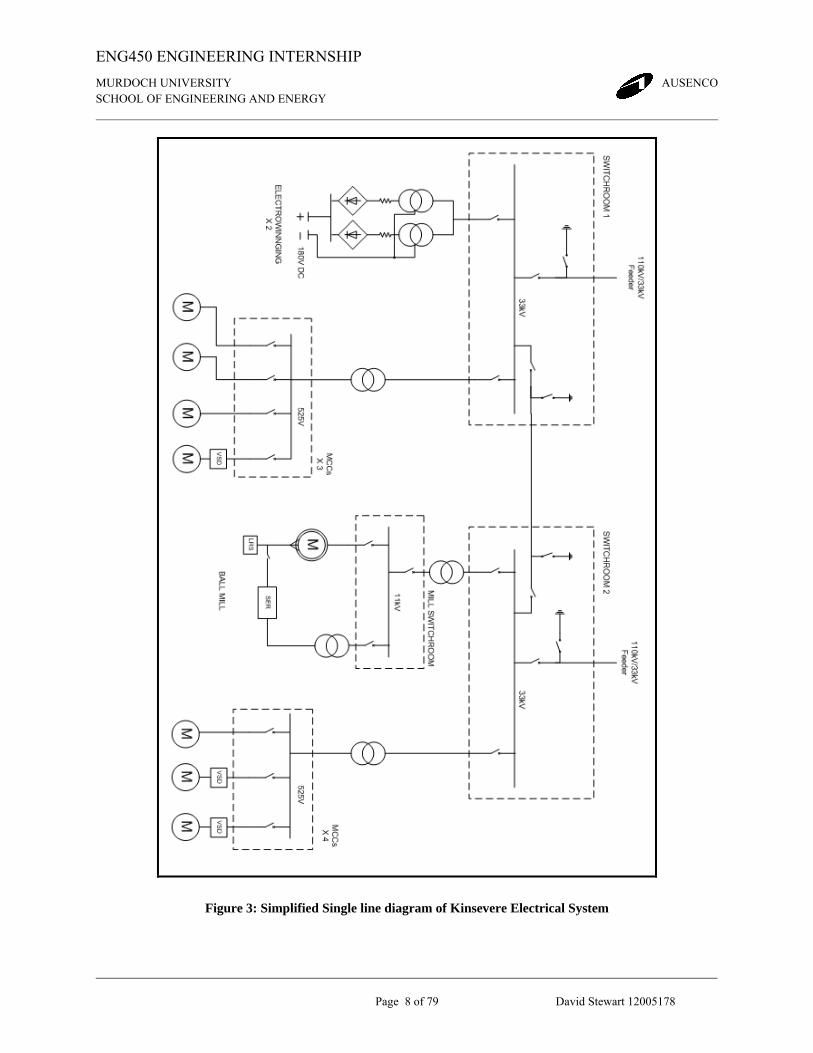
A simplified single line diagram (SLD) indicating the major components introduced in this
section, and the connection scheme employed, is shown in Figure 3.
Page 18
ENG450 ENGINEERING INTERNSHIP
MURDOCH UNIVERSITY AUSENCO SCHOOL OF ENGINEERING AND ENERGY
Page 8 of 79 David Stewart 12005178
Figure 3: Simplified Single line diagram of Kinsevere Electrical System
Page 19
ENG450 ENGINEERING INTERNSHIP
MURDOCH UNIVERSITY AUSENCO SCHOOL OF ENGINEERING AND ENERGY
Page 9 of 79 David Stewart 12005178
3 CHARACTERISTICS OF AN AC INDUCTION MOTOR The predominant type of motor employed in a process plant is the ac induction motor, converting
on average 70-80% of electrical power to mechanical energy. This is true in most process
applications, and very much so in the Copper Extraction Plant being developed in Kinsevere.
Over 90% of motors used at Kinsevere are ac induction motors. The Squirrel Cage motor makes
up the bulk of this percentage, with the Wound Rotor motor taking up the rest. Considering this
fact, it seemed necessary to conduct a detailed analysis of the principles of ac induction to be
conducted.
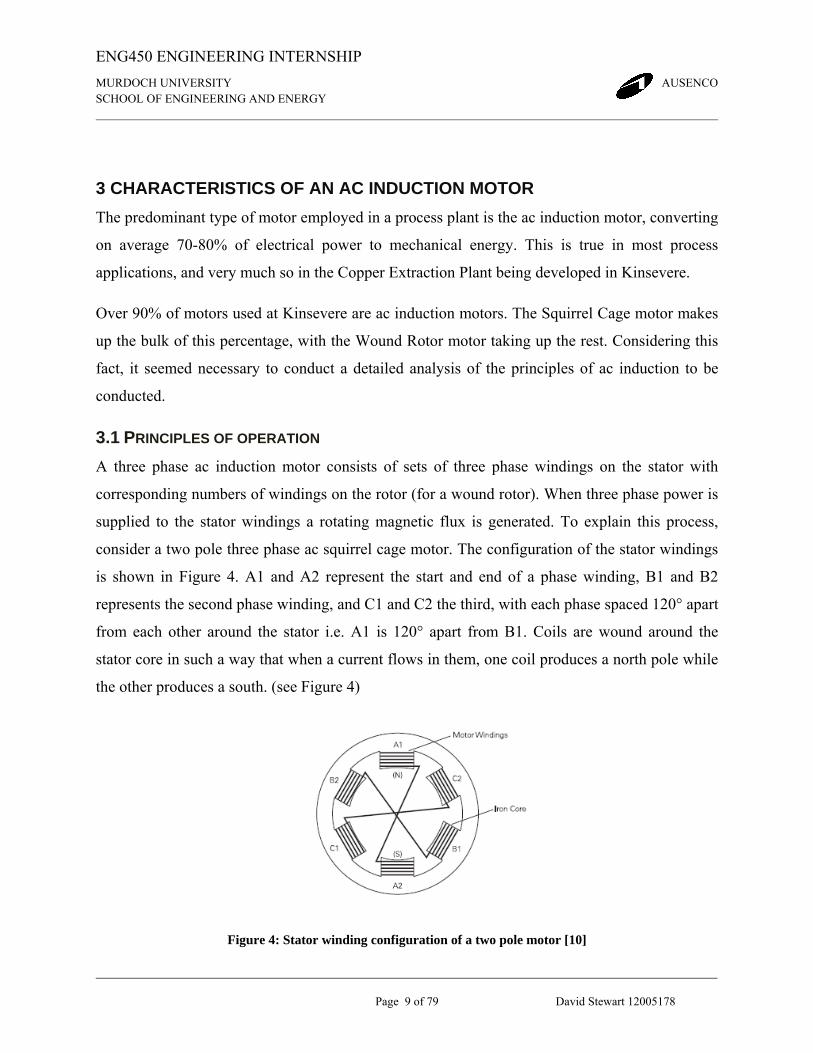
3.1 PRINCIPLES OF OPERATION A three phase ac induction motor consists of sets of three phase windings on the stator with
corresponding numbers of windings on the rotor (for a wound rotor). When three phase power is
supplied to the stator windings a rotating magnetic flux is generated. To explain this process,
consider a two pole three phase ac squirrel cage motor. The configuration of the stator windings
is shown in Figure 4. A1 and A2 represent the start and end of a phase winding, B1 and B2
represents the second phase winding, and C1 and C2 the third, with each phase spaced 120° apart
from each other around the stator i.e. A1 is 120° apart from B1. Coils are wound around the
stator core in such a way that when a current flows in them, one coil produces a north pole while
the other produces a south. (see Figure 4)
Figure 4: Stator winding configuration of a two pole motor [10]
Page 20
ENG450 ENGINEERING INTERNSHIP
MURDOCH UNIVERSITY AUSENCO SCHOOL OF ENGINEERING AND ENERGY
Page 10 of 79 David Stewart 12005178
A quick detour will now be taken to explain a common reference to three phase supplies.
According to AS3000 2007, installation wiring conductors should be clearly identified to
indicate their intended function. The insulation for neutral conductors shall be Black or light
blue, the insulation for earth conductors shall be green and yellow (with one colour not covering
more than 70% of the surface area), and for multiphase supplies (three phases), the
recommended identification colours for the active conductors are Red, White, and Blue. Because
of this last fact, each phase of a three phase supply is generally referred to by their insulation
colour.
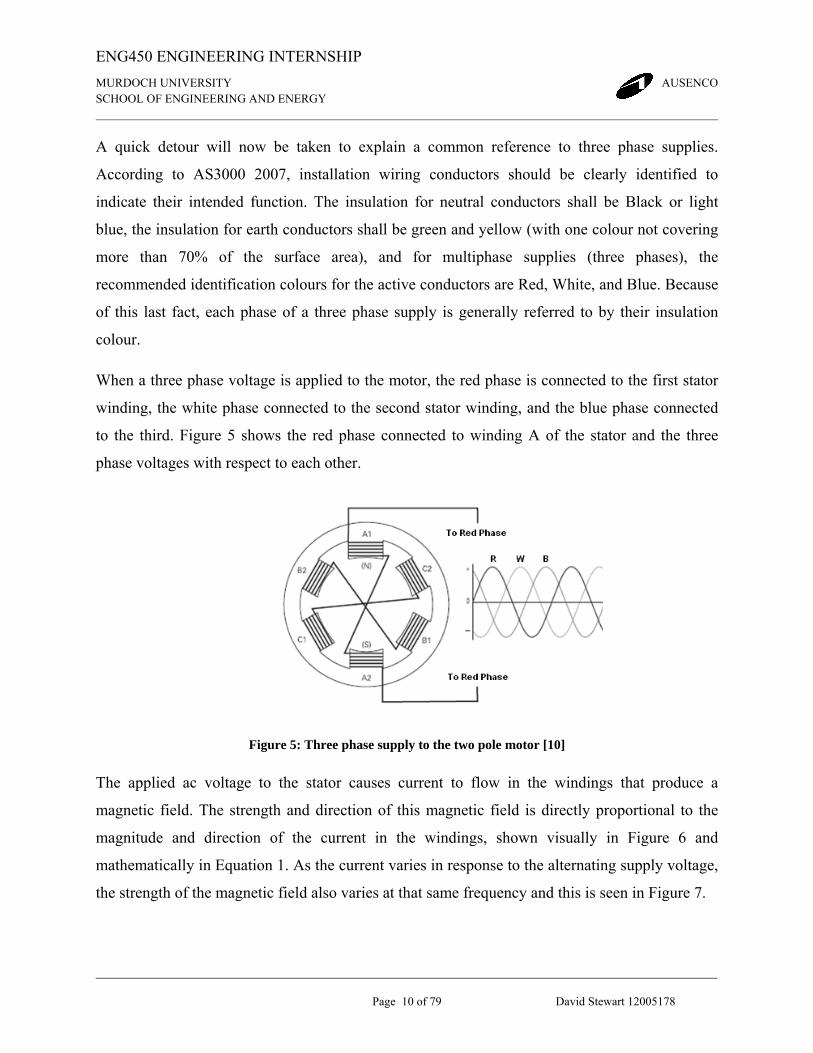
When a three phase voltage is applied to the motor, the red phase is connected to the first stator
winding, the white phase connected to the second stator winding, and the blue phase connected
to the third. Figure 5 shows the red phase connected to winding A of the stator and the three
phase voltages with respect to each other.
Figure 5: Three phase supply to the two pole motor [10]
The applied ac voltage to the stator causes current to flow in the windings that produce a
magnetic field. The strength and direction of this magnetic field is directly proportional to the
magnitude and direction of the current in the windings, shown visually in Figure 6 and
mathematically in Equation 1. As the current varies in response to the alternating supply voltage,
the strength of the magnetic field also varies at that same frequency and this is seen in Figure 7.
Page 21
ENG450 ENGINEERING INTERNSHIP
MURDOCH UNIVERSITY AUSENCO SCHOOL OF ENGINEERING AND ENERGY
Page 11 of 79 David Stewart 12005178
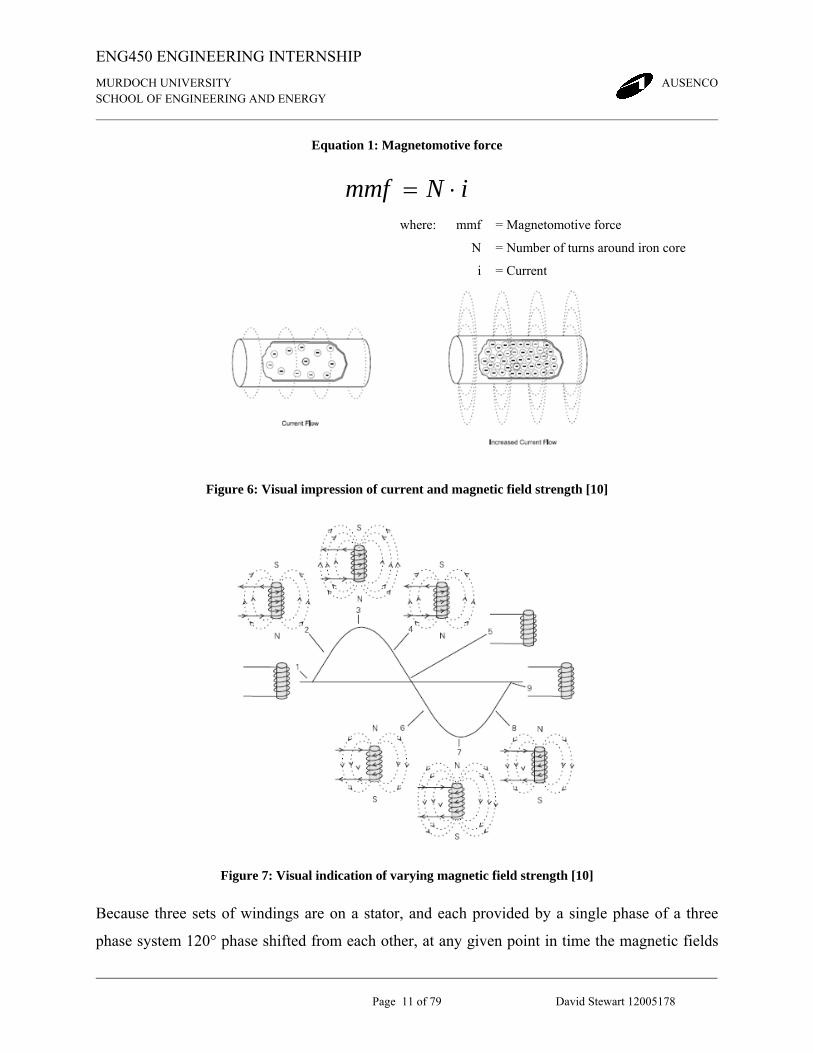
Equation 1: Magnetomotive force
iNmmf ⋅=
where: mmf
N
i
= Magnetomotive force
= Number of turns around iron core
= Current
Figure 6: Visual impression of current and magnetic field strength [10]
Figure 7: Visual indication of varying magnetic field strength [10]
Because three sets of windings are on a stator, and each provided by a single phase of a three
phase system 120° phase shifted from each other, at any given point in time the magnetic fields
Page 22
ENG450 ENGINEERING INTERNSHIP
MURDOCH UNIVERSITY AUSENCO SCHOOL OF ENGINEERING AND ENERGY
Page 12 of 79 David Stewart 12005178
of each winding differs. The result of these differing magnetic fields is a combining of the fields
to produce a resultant magnetic field which rotates around the stator at a frequency given by
Equation 2. It is this resultant field which will dictate the operation of a motor.
Equation 2: Frequency and rpm of a rotating magnetic flux
Pn
norP
ff Supply
StatorSupply
Stator
60⋅==
where: P
f
n
= Number of pole pairs
= speed in Hz
= speed in rpm
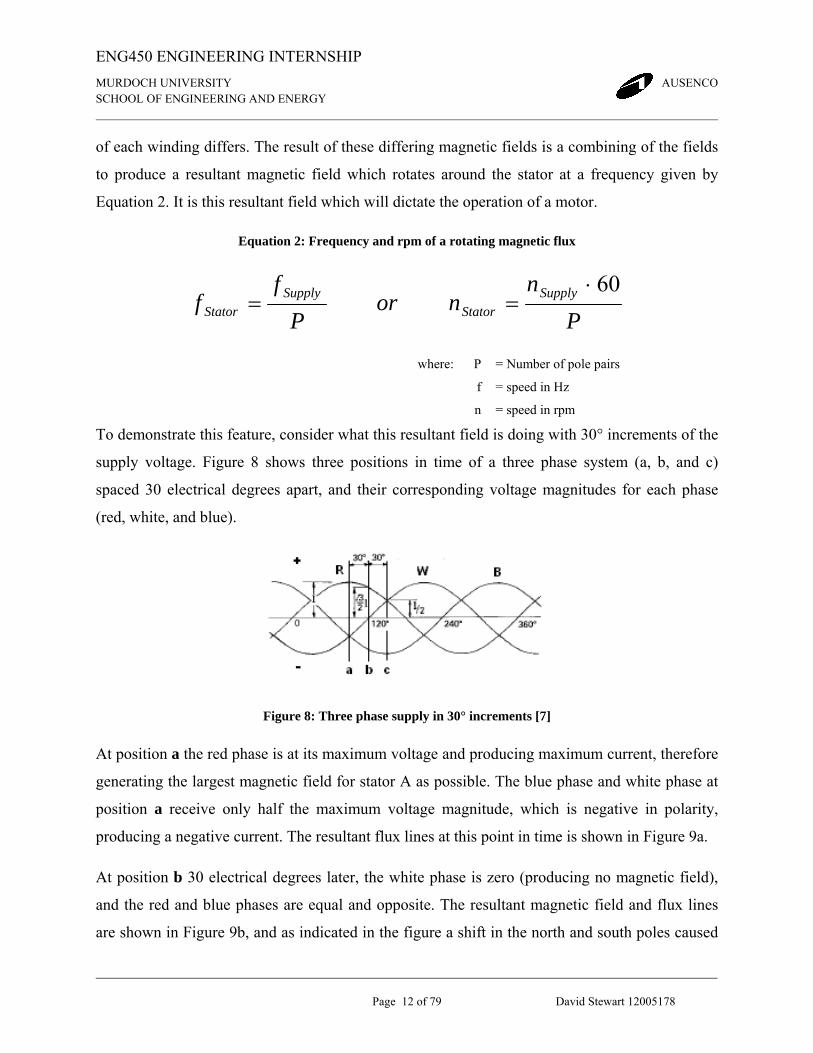
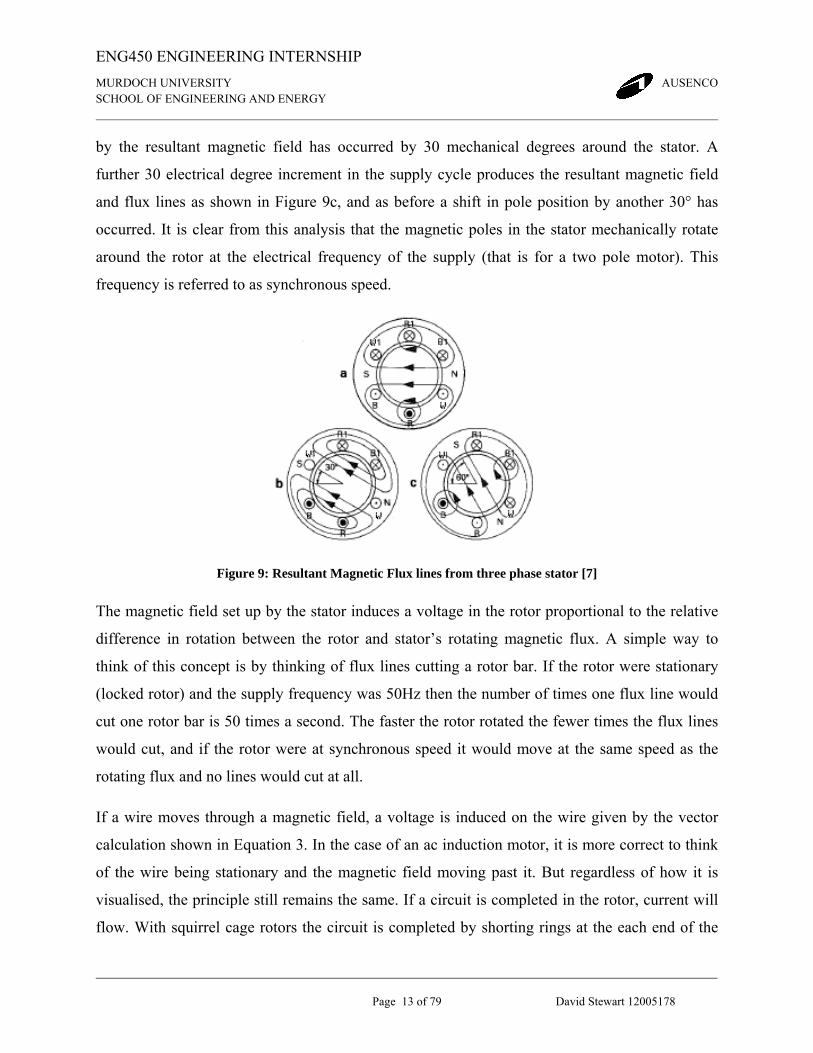
To demonstrate this feature, consider what this resultant field is doing with 30° increments of the
supply voltage. Figure 8 shows three positions in time of a three phase system (a, b, and c)
spaced 30 electrical degrees apart, and their corresponding voltage magnitudes for each phase
(red, white, and blue).
Figure 8: Three phase supply in 30° increments [7]
At position a the red phase is at its maximum voltage and producing maximum current, therefore
generating the largest magnetic field for stator A as possible. The blue phase and white phase at
position a receive only half the maximum voltage magnitude, which is negative in polarity,
producing a negative current. The resultant flux lines at this point in time is shown in Figure 9a.
At position b 30 electrical degrees later, the white phase is zero (producing no magnetic field),
and the red and blue phases are equal and opposite. The resultant magnetic field and flux lines
are shown in Figure 9b, and as indicated in the figure a shift in the north and south poles caused
Page 23
ENG450 ENGINEERING INTERNSHIP
MURDOCH UNIVERSITY AUSENCO SCHOOL OF ENGINEERING AND ENERGY
Page 13 of 79 David Stewart 12005178
by the resultant magnetic field has occurred by 30 mechanical degrees around the stator. A
further 30 electrical degree increment in the supply cycle produces the resultant magnetic field
and flux lines as shown in Figure 9c, and as before a shift in pole position by another 30° has
occurred. It is clear from this analysis that the magnetic poles in the stator mechanically rotate
around the rotor at the electrical frequency of the supply (that is for a two pole motor). This
frequency is referred to as synchronous speed.
Figure 9: Resultant Magnetic Flux lines from three phase stator [7]
The magnetic field set up by the stator induces a voltage in the rotor proportional to the relative
difference in rotation between the rotor and stator’s rotating magnetic flux. A simple way to
think of this concept is by thinking of flux lines cutting a rotor bar. If the rotor were stationary
(locked rotor) and the supply frequency was 50Hz then the number of times one flux line would
cut one rotor bar is 50 times a second. The faster the rotor rotated the fewer times the flux lines
would cut, and if the rotor were at synchronous speed it would move at the same speed as the
rotating flux and no lines would cut at all.
If a wire moves through a magnetic field, a voltage is induced on the wire given by the vector
calculation shown in Equation 3. In the case of an ac induction motor, it is more correct to think
of the wire being stationary and the magnetic field moving past it. But regardless of how it is
visualised, the principle still remains the same. If a circuit is completed in the rotor, current will
flow. With squirrel cage rotors the circuit is completed by shorting rings at the each end of the
Page 24
ENG450 ENGINEERING INTERNSHIP
MURDOCH UNIVERSITY AUSENCO SCHOOL OF ENGINEERING AND ENERGY
Page 14 of 79 David Stewart 12005178
rotor bars, in a wound rotor motor the windings are brought out to the housing by slip rings and
the circuit is required to be completed externally. In both cases, once the rotor circuit is
complete, it is the number of times the flux lines cut the rotor bars that determines the magnitude
of the current induced.
Equation 3: Induced voltage in a conductor moving in a magnetic field
lBveind ⋅×= )(
where: v
B
l
e
= velocity of the wire
= magnetic flux density vector
= length of the conductor
= voltage induced
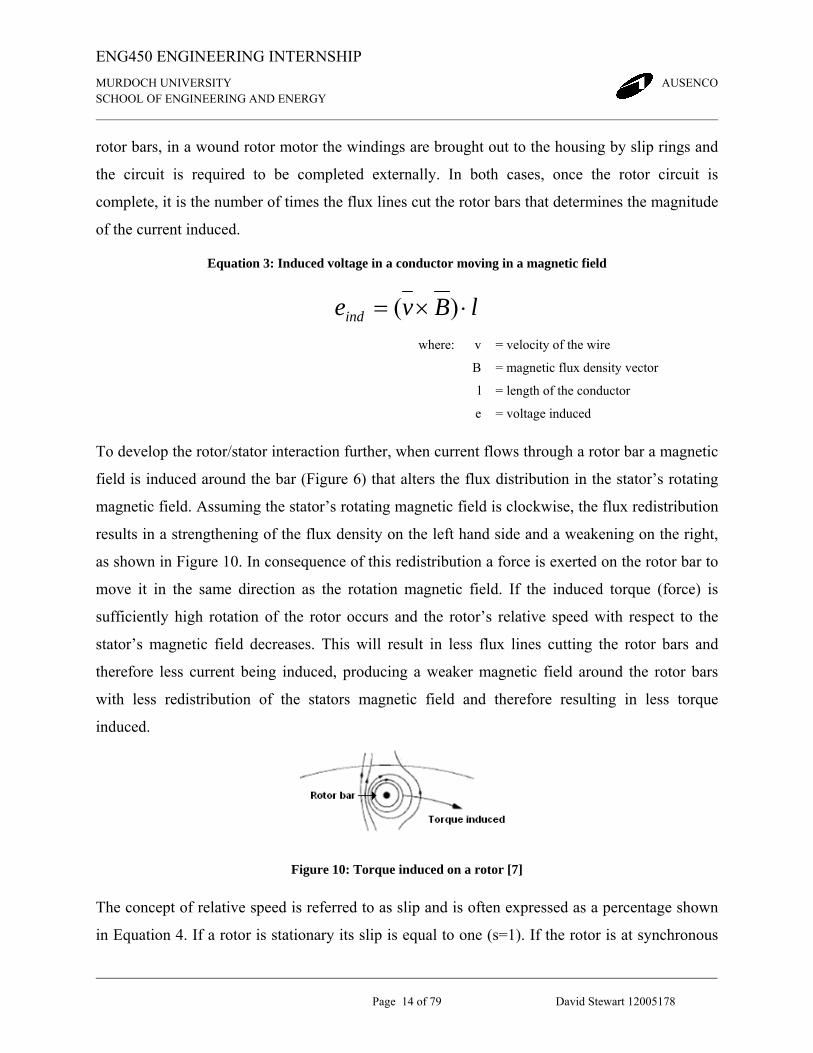
To develop the rotor/stator interaction further, when current flows through a rotor bar a magnetic
field is induced around the bar (Figure 6) that alters the flux distribution in the stator’s rotating
magnetic field. Assuming the stator’s rotating magnetic field is clockwise, the flux redistribution
results in a strengthening of the flux density on the left hand side and a weakening on the right,
as shown in Figure 10. In consequence of this redistribution a force is exerted on the rotor bar to
move it in the same direction as the rotation magnetic field. If the induced torque (force) is
sufficiently high rotation of the rotor occurs and the rotor’s relative speed with respect to the
stator’s magnetic field decreases. This will result in less flux lines cutting the rotor bars and
therefore less current being induced, producing a weaker magnetic field around the rotor bars
with less redistribution of the stators magnetic field and therefore resulting in less torque
induced.
Figure 10: Torque induced on a rotor [7]
The concept of relative speed is referred to as slip and is often expressed as a percentage shown
in Equation 4. If a rotor is stationary its slip is equal to one (s=1). If the rotor is at synchronous
Page 25
ENG450 ENGINEERING INTERNSHIP
MURDOCH UNIVERSITY AUSENCO SCHOOL OF ENGINEERING AND ENERGY
Page 15 of 79 David Stewart 12005178
speed its slip is equal to zero (s=0). At a slip of zero the induced voltage is zero and therefore the
current is zero, producing zero torque. In reality, rotational losses of the motor due to friction and
windage losses (hysteresis and eddy currents in the stator iron core) are always present, so if the
rotor did reach synchronous speed it would do so only momentarily as the rotational losses
would act to slow it down and induce torque in the rotor once again.
A point will be reached where the induced rotor torque matches that required by the rotational
losses and at that point the motor will remain at a fixed speed. If a load were placed on the
motor, then a lower speed would be reached where the induced torque again matches that
required by the rotational losses plus the torque requirement added by the load.
Equation 4: Slip percentage
%100×−
=sync
rotorsync
nnn
s
where: s
n
sync
= slip percentage
= rotational speed in rpm
= synchronous
When purchasing a motor the motor will be specified with a certain slip indicating the no load
speed which it will run at and therefore the rotational losses of that machine. A method for
determining the speed of a motor at any given slip is shown in Equation 5.
Equation 5: Slip and rotor speed
)1( snn syncrotor −=
where: s = slip in decimals
Page 26
ENG450 ENGINEERING INTERNSHIP
MURDOCH UNIVERSITY AUSENCO SCHOOL OF ENGINEERING AND ENERGY
Page 16 of 79 David Stewart 12005178
3.2 SQUIRREL CAGE MOTORS In industry the squirrel cage motor is the basic workhorse of the induction motor family. Having
a robust design it is reliable, has low operating costs, and is relatively cheap to construct.
The stator windings of a squirrel cage motor are wound on a laminated iron core inserted into
semi-enclosed slots within the inner walls of the stator housing. Wire used in the windings is
completely insulated from contact with itself when looped, from each phase, and from earth.
Figure 11 shows a typical design.
Figure 11: Sketch of a typical cage rotor motor stator [9]
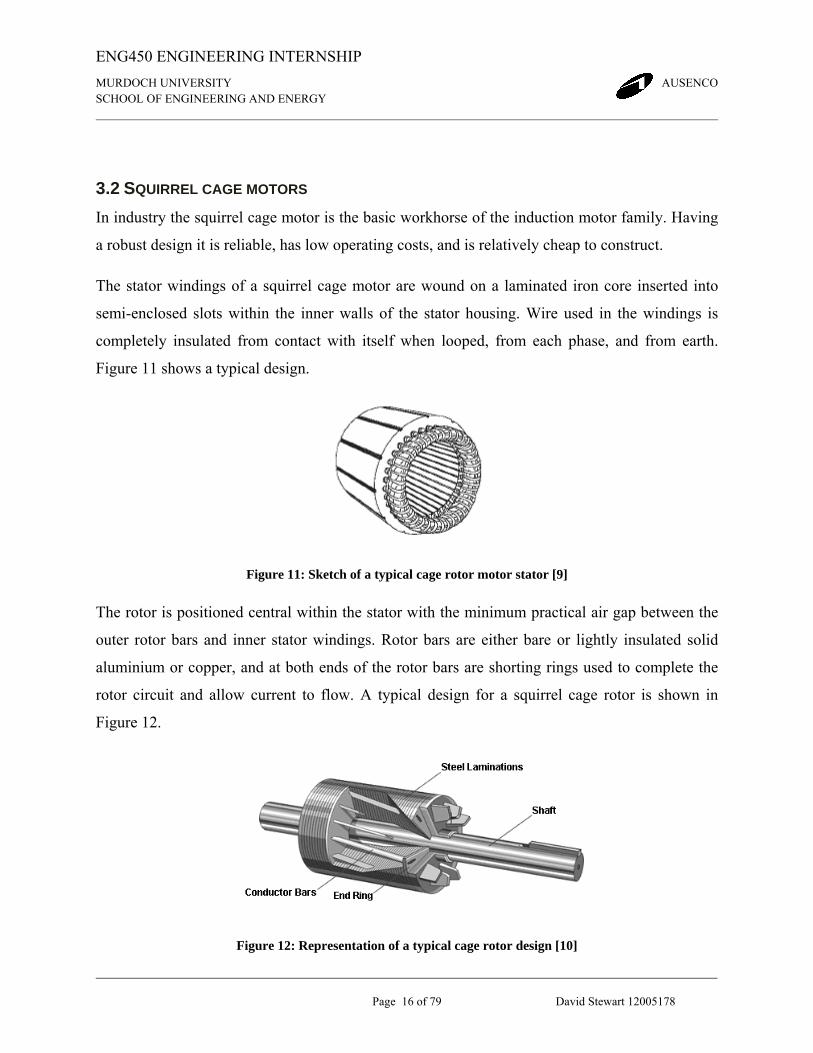
The rotor is positioned central within the stator with the minimum practical air gap between the
outer rotor bars and inner stator windings. Rotor bars are either bare or lightly insulated solid
aluminium or copper, and at both ends of the rotor bars are shorting rings used to complete the
rotor circuit and allow current to flow. A typical design for a squirrel cage rotor is shown in
Figure 12.
Figure 12: Representation of a typical cage rotor design [10]
Page 27
ENG450 ENGINEERING INTERNSHIP
MURDOCH UNIVERSITY AUSENCO SCHOOL OF ENGINEERING AND ENERGY
Page 17 of 79 David Stewart 12005178
As mentioned the no-load and full-load slip of a motor is determined by the rotational losses and
rotational losses plus connected load respectively in the rotor circuit. As the rotational losses
include i2R losses in the rotor (R = Rotor Resistance) slip is therefore dependent on the
impedance of the rotor circuit. Because a squirrel cage rotor uses shorting rings to short the rotor
bars to allow current to flow the resistance of the rotor circuit will always remain the same. This
is a disadvantage of a squirrel cage motor because the current through the rotor cannot be
controlled.
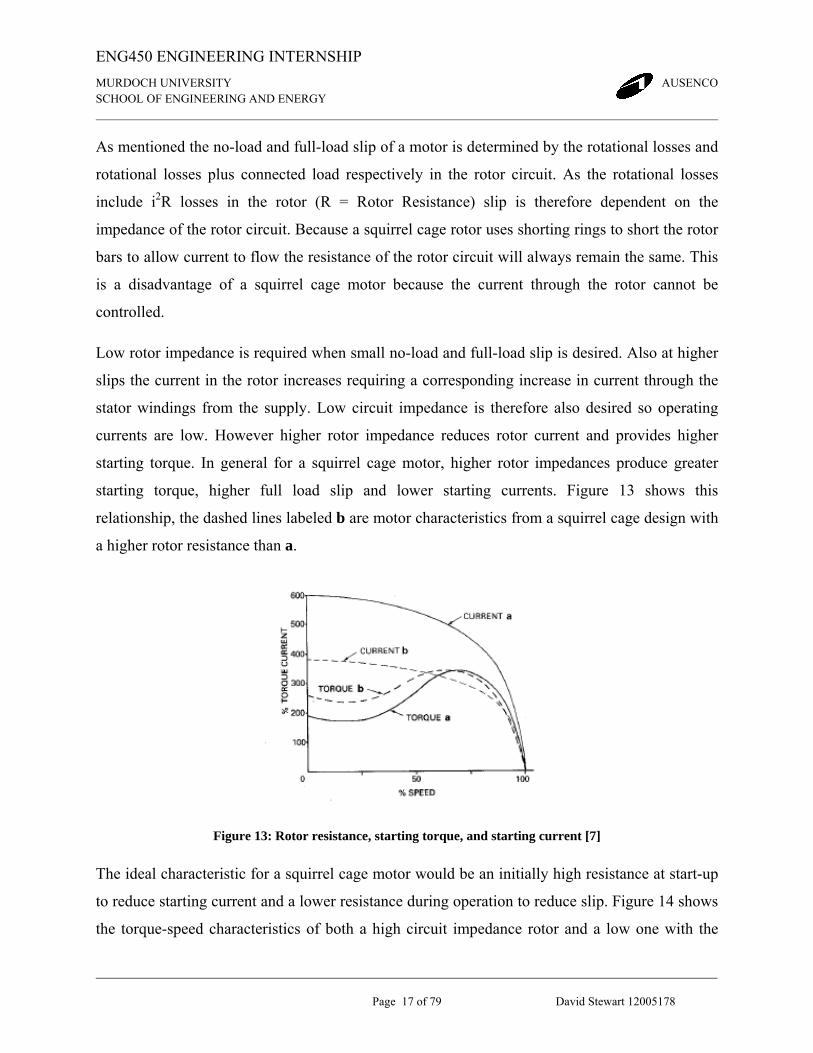
Low rotor impedance is required when small no-load and full-load slip is desired. Also at higher
slips the current in the rotor increases requiring a corresponding increase in current through the
stator windings from the supply. Low circuit impedance is therefore also desired so operating
currents are low. However higher rotor impedance reduces rotor current and provides higher
starting torque. In general for a squirrel cage motor, higher rotor impedances produce greater
starting torque, higher full load slip and lower starting currents. Figure 13 shows this
relationship, the dashed lines labeled b are motor characteristics from a squirrel cage design with
a higher rotor resistance than a.
Figure 13: Rotor resistance, starting torque, and starting current [7]
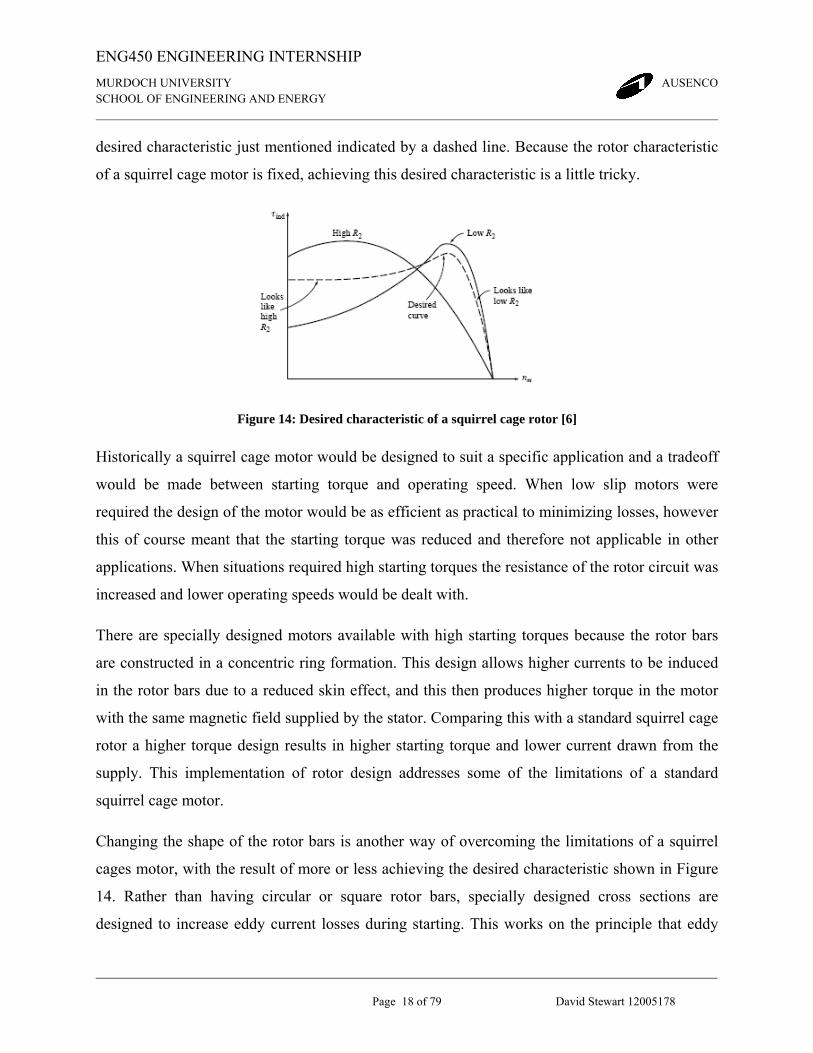
The ideal characteristic for a squirrel cage motor would be an initially high resistance at start-up
to reduce starting current and a lower resistance during operation to reduce slip. Figure 14 shows
the torque-speed characteristics of both a high circuit impedance rotor and a low one with the
Page 28
ENG450 ENGINEERING INTERNSHIP
MURDOCH UNIVERSITY AUSENCO SCHOOL OF ENGINEERING AND ENERGY
Page 18 of 79 David Stewart 12005178
desired characteristic just mentioned indicated by a dashed line. Because the rotor characteristic
of a squirrel cage motor is fixed, achieving this desired characteristic is a little tricky.
Figure 14: Desired characteristic of a squirrel cage rotor [6]
Historically a squirrel cage motor would be designed to suit a specific application and a tradeoff
would be made between starting torque and operating speed. When low slip motors were
required the design of the motor would be as efficient as practical to minimizing losses, however
this of course meant that the starting torque was reduced and therefore not applicable in other
applications. When situations required high starting torques the resistance of the rotor circuit was
increased and lower operating speeds would be dealt with.
There are specially designed motors available with high starting torques because the rotor bars
are constructed in a concentric ring formation. This design allows higher currents to be induced
in the rotor bars due to a reduced skin effect, and this then produces higher torque in the motor
with the same magnetic field supplied by the stator. Comparing this with a standard squirrel cage
rotor a higher torque design results in higher starting torque and lower current drawn from the
supply. This implementation of rotor design addresses some of the limitations of a standard
squirrel cage motor.
Changing the shape of the rotor bars is another way of overcoming the limitations of a squirrel
cages motor, with the result of more or less achieving the desired characteristic shown in Figure
14. Rather than having circular or square rotor bars, specially designed cross sections are
designed to increase eddy current losses during starting. This works on the principle that eddy
Page 29
ENG450 ENGINEERING INTERNSHIP
MURDOCH UNIVERSITY AUSENCO SCHOOL OF ENGINEERING AND ENERGY
Page 19 of 79 David Stewart 12005178
currents in the rotor can be approximated by an inductor in the rotor circuit. With the rotor at low
speed the frequency of the flux generated in the rotor is high and as eddy currents are being
approximated by an inductor the impedance of this rotor circuit will also be high. As the rotor
increases in speed the frequency of the flux generated in the rotor reduces, reducing the
impedance of the inductor and therefore lowering the rotor circuit impedance. The result of this
interaction is to produce high rotor impedance at start-up and a reduction in the rotor impedance
as the rotor approaches operating speed, therefore exhibiting a non-fixed rotor circuit impedance
characteristic.
Implementation of a wound rotor motor can be the alternative for some applications where a
fixed rotor characteristic is not applicable. Wound rotor motors have the ability to control the
rotor circuit impedance externally by connection of resistances in series with the rotor circuit.
However this option is more expensive due to the complexity of the rotor windings procedure
and the required inclusion of brushes and slip rings to bring the rotor circuit out to the stator for
access. The machine is also not as robust as a squirrel cage motor and requires higher
maintenance due to the wear of the brushes, and although this wear was designed to be at a
minimum the need for replacement added further costs to this implementation option.
Mechanically a fluid coupler can be connected between the load and motor. This allows the
motor to run-up to speed while only perceiving a fraction of the load torque while starting. With
a fluid coupling the motor shaft spins inside a compartment filled with a lubricant which causes
the fluid to rotate, creating a vortex. At low speed the velocity of the liquid is low and so too is
the frictional coefficient between the fluid and the stationary load shaft. This would result in less
‘grip’ on the load shaft by the fluid and therefore less torque imposed on the motor by the load.
As the motor increased in speed the friction between the fluid and the load shaft would increase
and the fluid coupling’s ‘grip’ would tighten, the motor shaft would then see more torque
imposed by the load but by this time its speed would be approaching operating speed and the
motor would be able to absorb it. And at high speeds it would be like the fluid coupling was not
there at all and that the motor was directly coupled with the load.
Page 30
ENG450 ENGINEERING INTERNSHIP
MURDOCH UNIVERSITY AUSENCO SCHOOL OF ENGINEERING AND ENERGY
Page 20 of 79 David Stewart 12005178
Finally advances in variable speed drives have allowed squirrel cage motors to be used in
applications where it would not otherwise be suited. Variable speed drives are to be discussed in
a later section of this report.
3.2.1 Torque speed curves
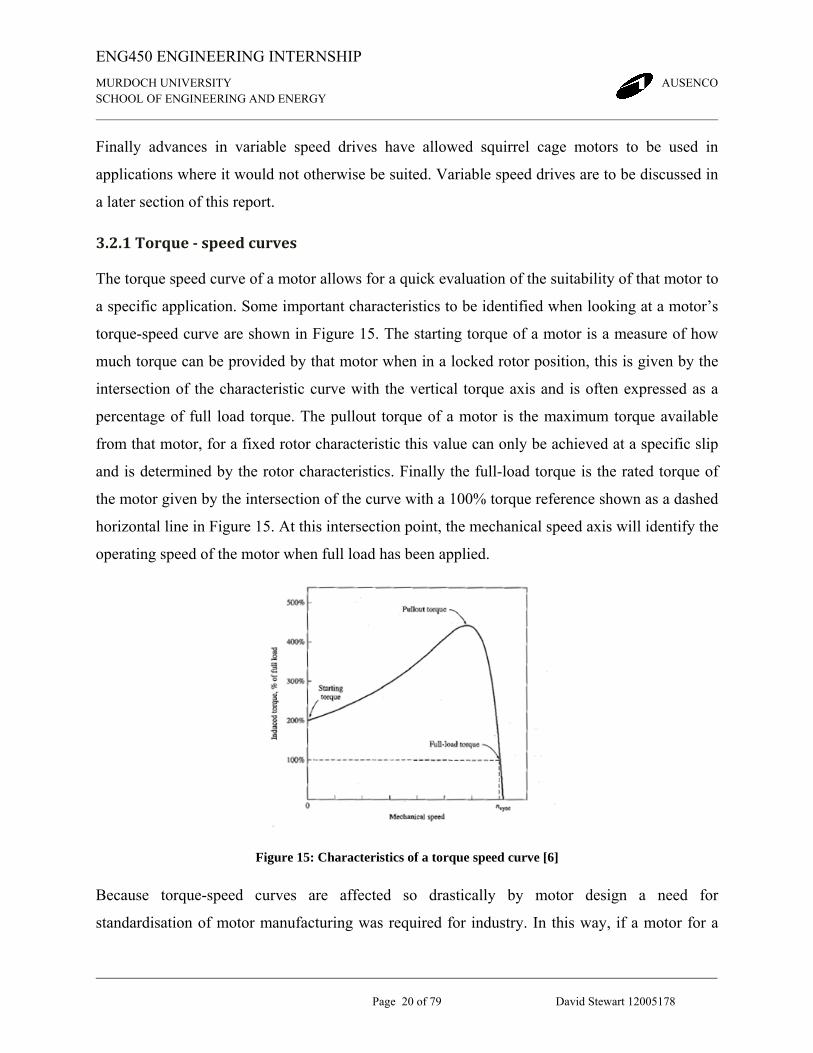
The torque speed curve of a motor allows for a quick evaluation of the suitability of that motor to
a specific application. Some important characteristics to be identified when looking at a motor’s
torque-speed curve are shown in Figure 15. The starting torque of a motor is a measure of how
much torque can be provided by that motor when in a locked rotor position, this is given by the
intersection of the characteristic curve with the vertical torque axis and is often expressed as a
percentage of full load torque. The pullout torque of a motor is the maximum torque available
from that motor, for a fixed rotor characteristic this value can only be achieved at a specific slip
and is determined by the rotor characteristics. Finally the full-load torque is the rated torque of
the motor given by the intersection of the curve with a 100% torque reference shown as a dashed
horizontal line in Figure 15. At this intersection point, the mechanical speed axis will identify the
operating speed of the motor when full load has been applied.
Figure 15: Characteristics of a torque speed curve [6]
Because torque-speed curves are affected so drastically by motor design a need for
standardisation of motor manufacturing was required for industry. In this way, if a motor for a
Page 31
ENG450 ENGINEERING INTERNSHIP
MURDOCH UNIVERSITY AUSENCO SCHOOL OF ENGINEERING AND ENERGY
Page 21 of 79 David Stewart 12005178
common applicable was required an order could be made for a motor which conformed to
specific standards suited to that application. The most widely used classifications of ac induction
motors are defined by the National Electrical Manufacturers Association (NEMA) and the
International Electrotechnical Commission (IEC). The NEMA classification is adopted by
American manufacturers while the IEC classification is widely adopted by the European
Industry, however both classifications will specify similar requirements.
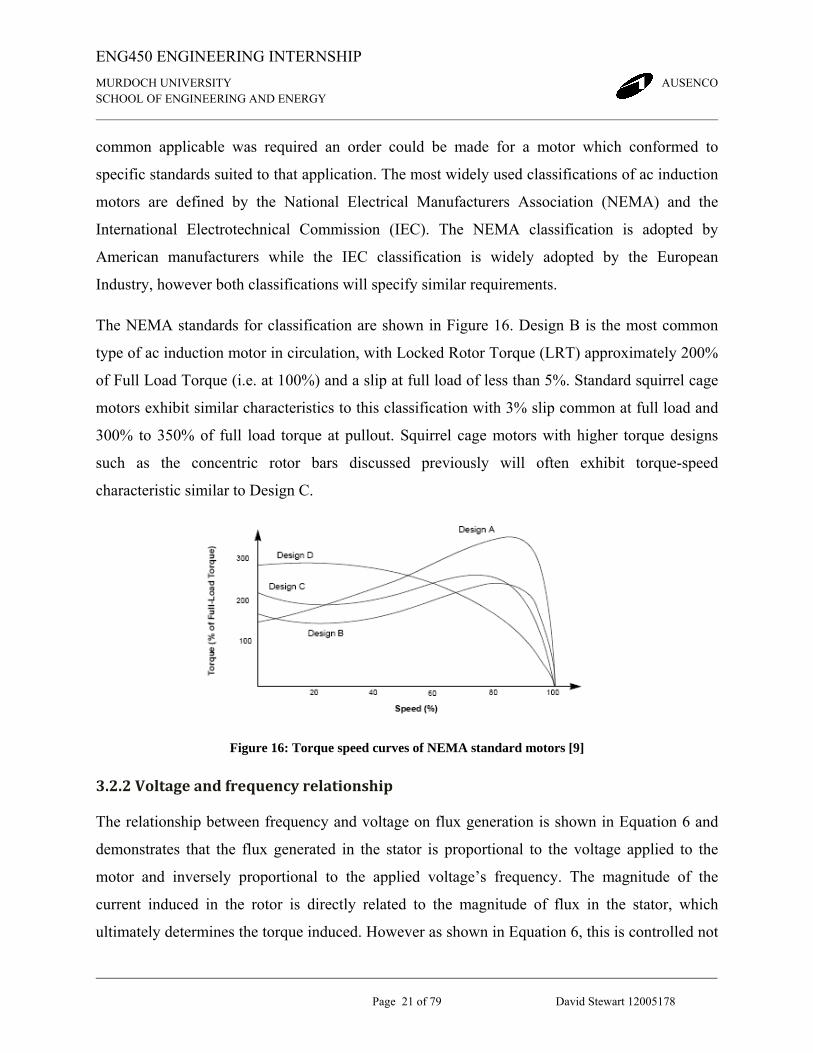
The NEMA standards for classification are shown in Figure 16. Design B is the most common
type of ac induction motor in circulation, with Locked Rotor Torque (LRT) approximately 200%
of Full Load Torque (i.e. at 100%) and a slip at full load of less than 5%. Standard squirrel cage
motors exhibit similar characteristics to this classification with 3% slip common at full load and
300% to 350% of full load torque at pullout. Squirrel cage motors with higher torque designs
such as the concentric rotor bars discussed previously will often exhibit torque-speed
characteristic similar to Design C.
Figure 16: Torque speed curves of NEMA standard motors [9]
3.2.2 Voltage and frequency relationship
The relationship between frequency and voltage on flux generation is shown in Equation 6 and
demonstrates that the flux generated in the stator is proportional to the voltage applied to the
motor and inversely proportional to the applied voltage’s frequency. The magnitude of the
current induced in the rotor is directly related to the magnitude of flux in the stator, which
ultimately determines the torque induced. However as shown in Equation 6, this is controlled not
Page 32
ENG450 ENGINEERING INTERNSHIP
MURDOCH UNIVERSITY AUSENCO SCHOOL OF ENGINEERING AND ENERGY
Page 22 of 79 David Stewart 12005178
by the current in the stator windings but by the voltage impressed upon the stator windings by
the supply. This is true due to the relatively low voltage drop occurring across the stator
windings, and therefore the magnitude of the magnetic field induced in the stator is required to
balance proportionally with the magnitude of the voltage applied at the motor terminals.
When too much flux is generated in the iron core of the stator the core is driven into saturation. It
is undesired to operate a motor in saturation because small increases in load requires large
increases in current drawn from the supply to produce the small increase in flux required to
match the load, and if a large increase in load were applied a very large increase in current would
occur because a large increase in flux would now be required to equal the load.
Equation 6: Flux, voltage and frequency
fV
∝φ
where: φ
V
f
= Flux
= Voltage
= Frequency
A motor is manufactured to operate at a rated voltage and rated frequency, these values referred
to as the motors base values i.e. base voltage and base frequency. When operating at base values
the motor is designed to produce high magnitudes of flux with as comfortable a margin as
possible between this operating point and the point where the motor approaches saturation.
Because efficient motors require minimal losses, a reduced material list is often the solution and
as a consequence of this, these machines will generally operate close to their saturation point.
From Equation 6 if frequency was fixed and an excessive voltage increase occurred above the
base voltage the flux in the stator would increase and the motor would be driven into saturation.
And if voltage was fixed and an excessive frequency reduction occurred below base frequency
the flux would again increase and the motor would again be driven into saturation. Therefore for
any changes in operating point away from base values, corresponding adjustments must be made
to avoid saturating the motor and the unwanted effects that this will produce.
Page 33
ENG450 ENGINEERING INTERNSHIP
MURDOCH UNIVERSITY AUSENCO SCHOOL OF ENGINEERING AND ENERGY
Page 23 of 79 David Stewart 12005178
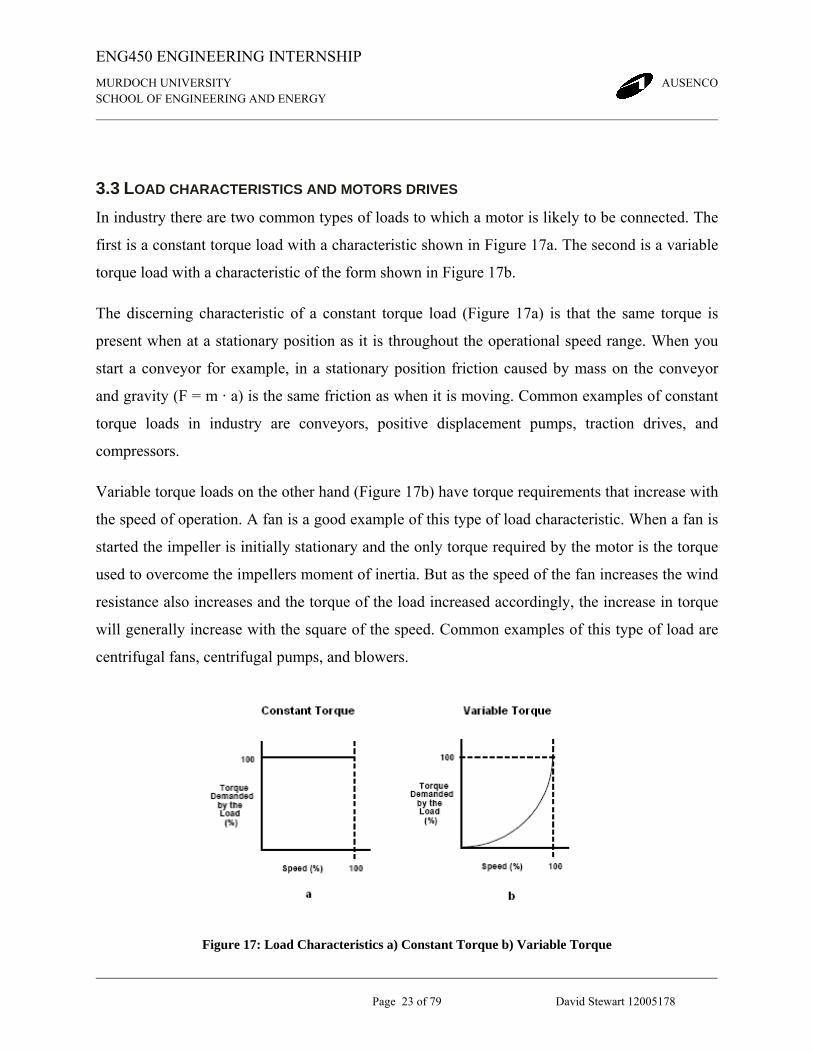
3.3 LOAD CHARACTERISTICS AND MOTORS DRIVES In industry there are two common types of loads to which a motor is likely to be connected. The
first is a constant torque load with a characteristic shown in Figure 17a. The second is a variable
torque load with a characteristic of the form shown in Figure 17b.
The discerning characteristic of a constant torque load (Figure 17a) is that the same torque is
present when at a stationary position as it is throughout the operational speed range. When you
start a conveyor for example, in a stationary position friction caused by mass on the conveyor
and gravity (F = m · a) is the same friction as when it is moving. Common examples of constant
torque loads in industry are conveyors, positive displacement pumps, traction drives, and
compressors.
Variable torque loads on the other hand (Figure 17b) have torque requirements that increase with
the speed of operation. A fan is a good example of this type of load characteristic. When a fan is
started the impeller is initially stationary and the only torque required by the motor is the torque
used to overcome the impellers moment of inertia. But as the speed of the fan increases the wind
resistance also increases and the torque of the load increased accordingly, the increase in torque
will generally increase with the square of the speed. Common examples of this type of load are
centrifugal fans, centrifugal pumps, and blowers.
Figure 17: Load Characteristics a) Constant Torque b) Variable Torque
Page 34
ENG450 ENGINEERING INTERNSHIP
MURDOCH UNIVERSITY AUSENCO SCHOOL OF ENGINEERING AND ENERGY
Page 24 of 79 David Stewart 12005178
3.3.1 DOL drives
A Direct Online (DOL) drive for a motor will be housed in the Machine Control Cubicle (MCC)
and is used to control the power supplied to a motor. It does so by opening and closing a
contactor which will either break or make the supply circuit to that motor. Using a DOL drive to
start a motor is like turning on a light switch i.e. bang! … and now the motor has power.
Except for when the stator’s iron core is in saturation, current in the rotor is proportional to
current through the stator (in saturation, as alluded to previously, small increases in rotor current
produce marked increases in stator current). Additionally torque is proportional to the square of
the voltage applied to the stator terminals as shown in Equation 7. A consideration when
selecting a DOL drive for an application is related to the torque / voltage relationship shown in
Equation 7, and will be developed with an example case of starting a standard squirrel cage
motor.
Equation 7: Torque and voltage
2V∝Γ
where: Γ
V
= Torque
= Voltage
With a Direct Online (DOL) start of a standard squirrel cage motor, the start-up current at full
load torque (FLT) is between 600% - 700% of full load current (FLC). Electrical designs for a
motor circuit will usually allow 3% to 5% voltage drop at the motor terminals at rated
conditions. Taking 3% as the conservative voltage drop at FLC, during normal operation, the
available torque from the motor based on Equation 7 would be 94% of FLT (dealing in p.u.
values a 3% voltage drop provides 97% of rated voltage at the motor terminals with corresponds
to 0.972 of rated torque equaling 0.94). This would normally be accommodated for by the
selection of a slightly oversized motor for the application.
The issue occurs when considering the voltage drop at start up due to the 6 to 7 x FLC required.
If the motor was connected to a constant torque load application for example, at the moment of
Page 35
ENG450 ENGINEERING INTERNSHIP
MURDOCH UNIVERSITY AUSENCO SCHOOL OF ENGINEERING AND ENERGY
Page 25 of 79 David Stewart 12005178
contact from the DOL, full load torque would be required and therefore 7 x FLC would be
drawn. The voltage drop at the terminals would then correspond to 21% (7x3%) and the voltage
at the terminals would be 79% of rated voltage, using Equation 7 this would results in 65%
(0.792) of FLT available at start up. To select an oversized drive to accommodate this starting
torque reduction would not be practical and alternative methods of connection must be
considered, many of which have been addressed in previous discussions during this report.
3.3.2 VVVF drives
The basic operation of a Variable Voltage - Variable Frequency (VVVF, pronounced ‘triple-V-
F’) drive is to first rectify the supply voltage into a DC voltage and then through high speed
semiconductor technology invert this DC voltage to an AC voltage at any desired frequency.
These forms of drives are often designed to control both voltage and frequency across the entire
operating range of the application. With this ability VVVF drives can be used with motors to
control applications which the motor may not have otherwise been suited to, such applications
are those requiring specific speed control and loads possessing constant torque characteristics
without the need to oversize the motor.
In the case of constant torque loads it is desired to maintain a constant level of flux in the stator
across the entire speed range of the motor. Referring back to Equation 6, at low frequencies of
operation the flux increases in the stator windings, and at very low frequencies of operation the
magnitude of this increase would most likely drive the motor into saturation. To avoid this from
occurring, an equal decrease in voltage is required to maintain a constant level of flux in the
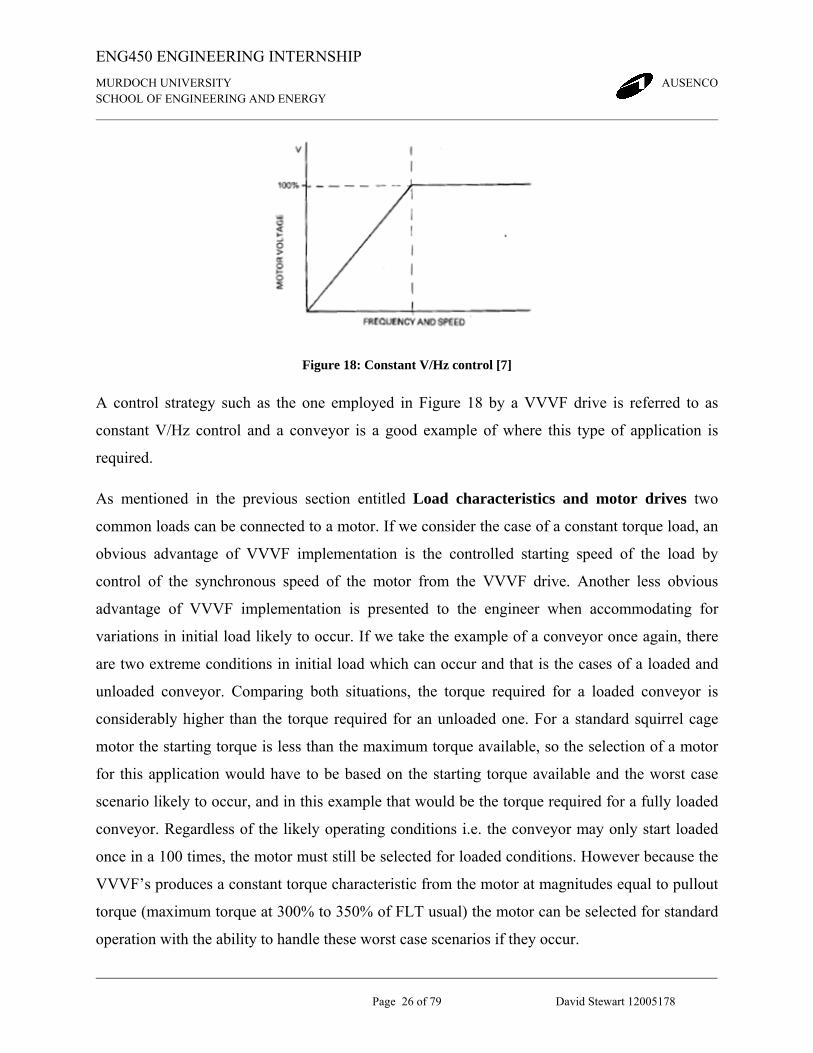
stator and avoid saturation. Figure 18 shows the desired linear relationship between voltage and
frequency with the base voltage and base frequency indicated by the dashed lines.
Page 36
ENG450 ENGINEERING INTERNSHIP
MURDOCH UNIVERSITY AUSENCO SCHOOL OF ENGINEERING AND ENERGY
Page 26 of 79 David Stewart 12005178
Figure 18: Constant V/Hz control [7]
A control strategy such as the one employed in Figure 18 by a VVVF drive is referred to as
constant V/Hz control and a conveyor is a good example of where this type of application is
required.
As mentioned in the previous section entitled Load characteristics and motor drives two
common loads can be connected to a motor. If we consider the case of a constant torque load, an
obvious advantage of VVVF implementation is the controlled starting speed of the load by
control of the synchronous speed of the motor from the VVVF drive. Another less obvious
advantage of VVVF implementation is presented to the engineer when accommodating for
variations in initial load likely to occur. If we take the example of a conveyor once again, there
are two extreme conditions in initial load which can occur and that is the cases of a loaded and
unloaded conveyor. Comparing both situations, the torque required for a loaded conveyor is
considerably higher than the torque required for an unloaded one. For a standard squirrel cage
motor the starting torque is less than the maximum torque available, so the selection of a motor
for this application would have to be based on the starting torque available and the worst case
scenario likely to occur, and in this example that would be the torque required for a fully loaded
conveyor. Regardless of the likely operating conditions i.e. the conveyor may only start loaded
once in a 100 times, the motor must still be selected for loaded conditions. However because the
VVVF’s produces a constant torque characteristic from the motor at magnitudes equal to pullout
torque (maximum torque at 300% to 350% of FLT usual) the motor can be selected for standard
operation with the ability to handle these worst case scenarios if they occur.
Page 37
ENG450 ENGINEERING INTERNSHIP
MURDOCH UNIVERSITY AUSENCO SCHOOL OF ENGINEERING AND ENERGY
Page 27 of 79 David Stewart 12005178
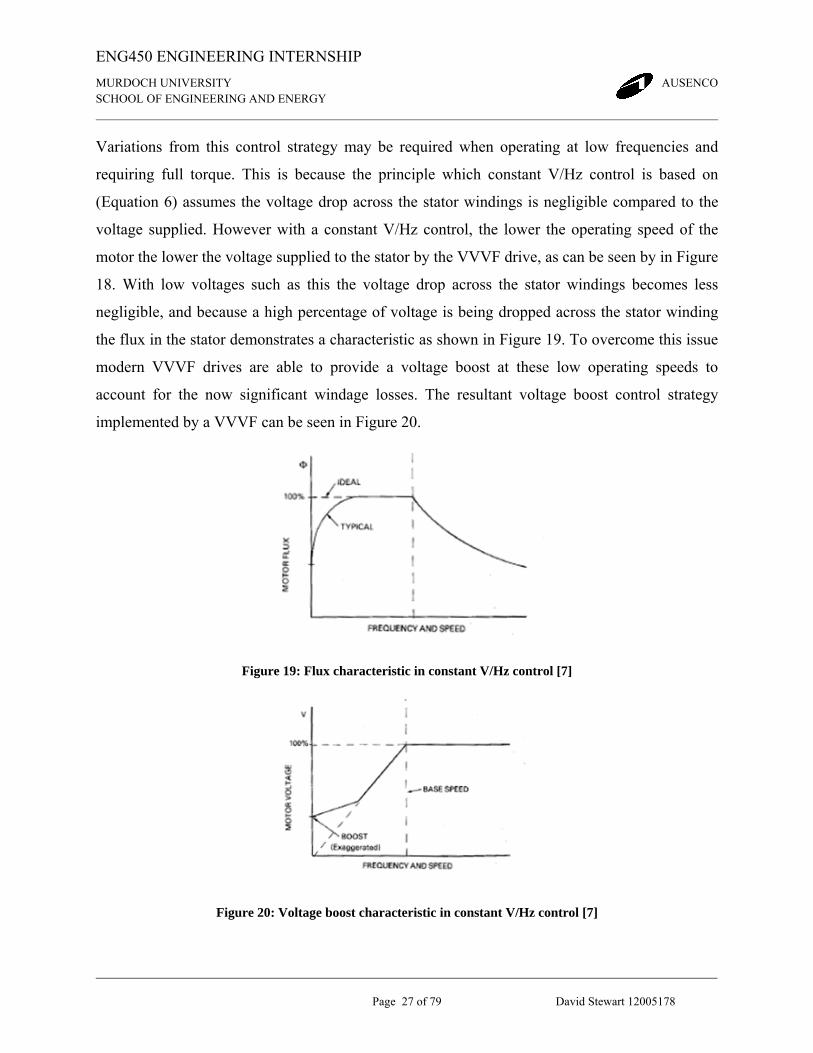
Variations from this control strategy may be required when operating at low frequencies and
requiring full torque. This is because the principle which constant V/Hz control is based on
(Equation 6) assumes the voltage drop across the stator windings is negligible compared to the
voltage supplied. However with a constant V/Hz control, the lower the operating speed of the
motor the lower the voltage supplied to the stator by the VVVF drive, as can be seen by in Figure
18. With low voltages such as this the voltage drop across the stator windings becomes less
negligible, and because a high percentage of voltage is being dropped across the stator winding
the flux in the stator demonstrates a characteristic as shown in Figure 19. To overcome this issue
modern VVVF drives are able to provide a voltage boost at these low operating speeds to
account for the now significant windage losses. The resultant voltage boost control strategy
implemented by a VVVF can be seen in Figure 20.
Figure 19: Flux characteristic in constant V/Hz control [7]
Figure 20: Voltage boost characteristic in constant V/Hz control [7]
Page 38
ENG450 ENGINEERING INTERNSHIP
MURDOCH UNIVERSITY AUSENCO SCHOOL OF ENGINEERING AND ENERGY
Page 28 of 79 David Stewart 12005178
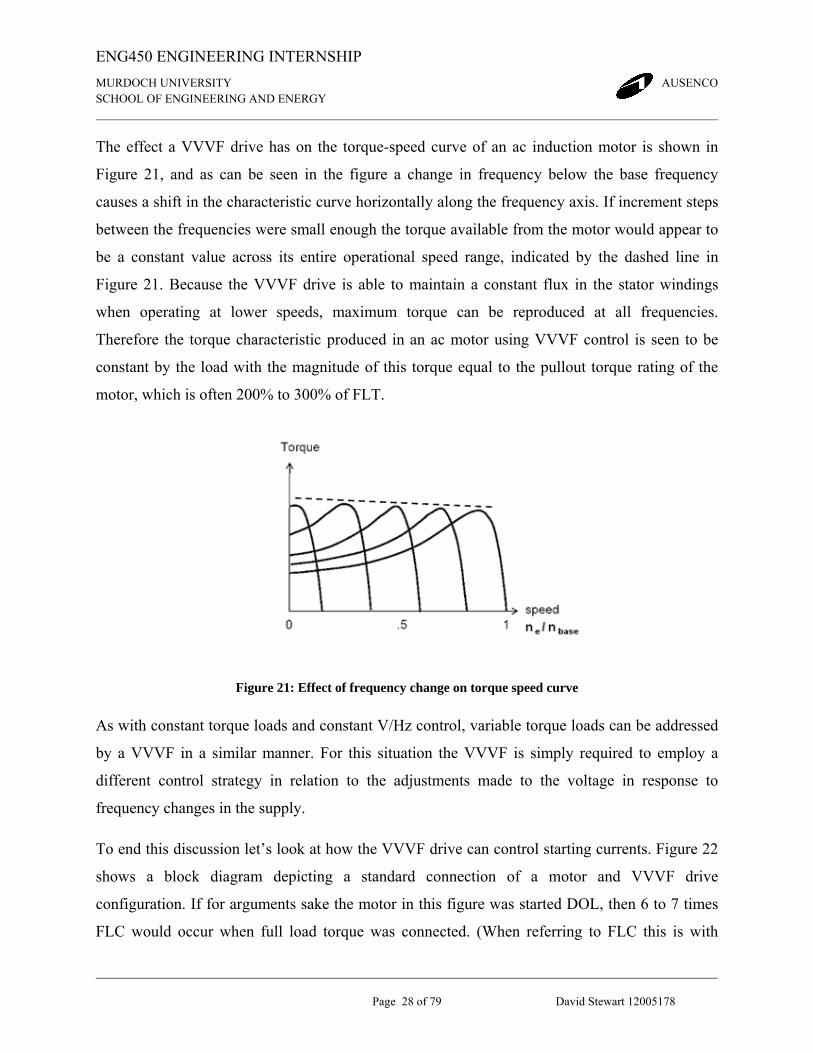
The effect a VVVF drive has on the torque-speed curve of an ac induction motor is shown in
Figure 21, and as can be seen in the figure a change in frequency below the base frequency
causes a shift in the characteristic curve horizontally along the frequency axis. If increment steps
between the frequencies were small enough the torque available from the motor would appear to
be a constant value across its entire operational speed range, indicated by the dashed line in
Figure 21. Because the VVVF drive is able to maintain a constant flux in the stator windings
when operating at lower speeds, maximum torque can be reproduced at all frequencies.
Therefore the torque characteristic produced in an ac motor using VVVF control is seen to be
constant by the load with the magnitude of this torque equal to the pullout torque rating of the
motor, which is often 200% to 300% of FLT.
Figure 21: Effect of frequency change on torque speed curve
As with constant torque loads and constant V/Hz control, variable torque loads can be addressed
by a VVVF in a similar manner. For this situation the VVVF is simply required to employ a
different control strategy in relation to the adjustments made to the voltage in response to
frequency changes in the supply.
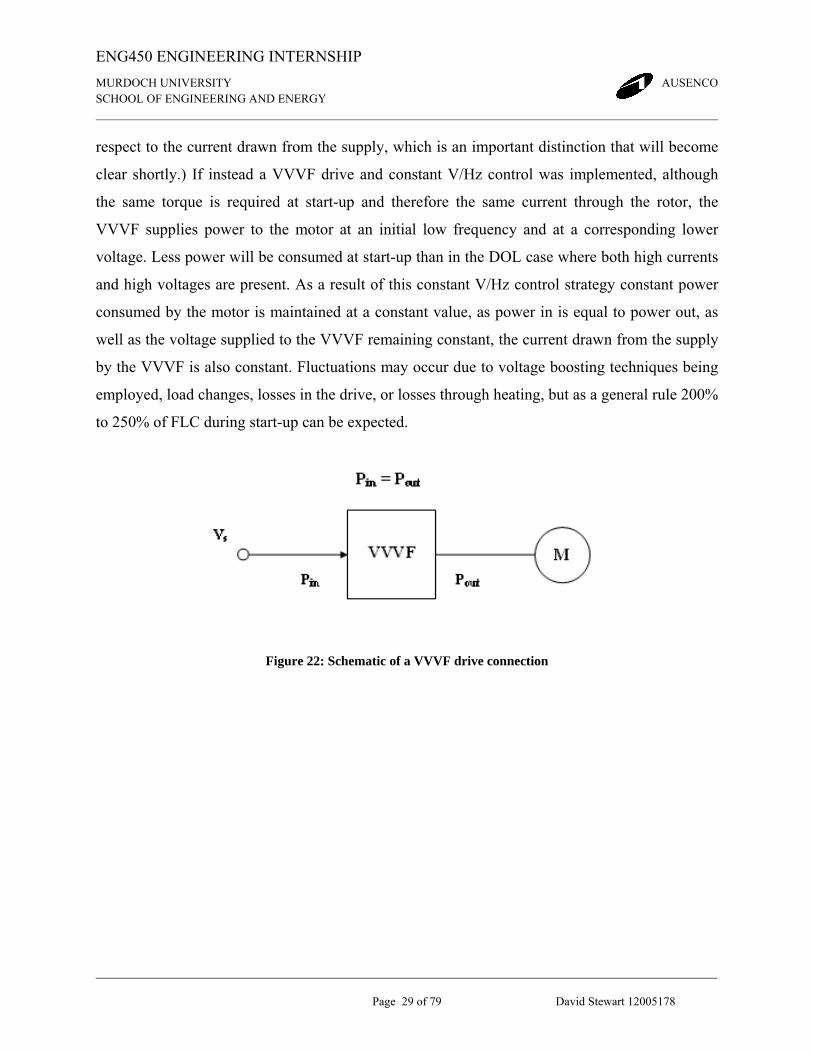
To end this discussion let’s look at how the VVVF drive can control starting currents. Figure 22
shows a block diagram depicting a standard connection of a motor and VVVF drive
configuration. If for arguments sake the motor in this figure was started DOL, then 6 to 7 times
FLC would occur when full load torque was connected. (When referring to FLC this is with
Page 39
ENG450 ENGINEERING INTERNSHIP
MURDOCH UNIVERSITY AUSENCO SCHOOL OF ENGINEERING AND ENERGY
Page 29 of 79 David Stewart 12005178
respect to the current drawn from the supply, which is an important distinction that will become
clear shortly.) If instead a VVVF drive and constant V/Hz control was implemented, although
the same torque is required at start-up and therefore the same current through the rotor, the
VVVF supplies power to the motor at an initial low frequency and at a corresponding lower
voltage. Less power will be consumed at start-up than in the DOL case where both high currents
and high voltages are present. As a result of this constant V/Hz control strategy constant power
consumed by the motor is maintained at a constant value, as power in is equal to power out, as
well as the voltage supplied to the VVVF remaining constant, the current drawn from the supply
by the VVVF is also constant. Fluctuations may occur due to voltage boosting techniques being
employed, load changes, losses in the drive, or losses through heating, but as a general rule 200%
to 250% of FLC during start-up can be expected.
Figure 22: Schematic of a VVVF drive connection
Page 40
ENG450 ENGINEERING INTERNSHIP
MURDOCH UNIVERSITY AUSENCO SCHOOL OF ENGINEERING AND ENERGY
Page 30 of 79 David Stewart 12005178
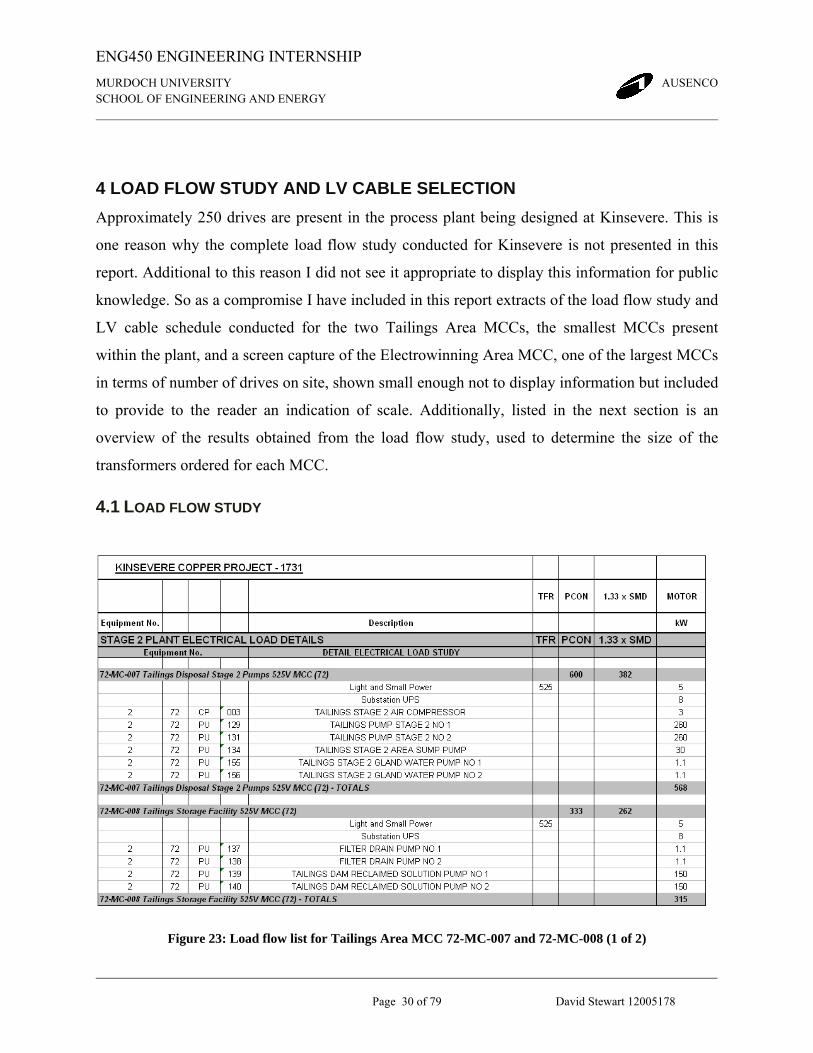
4 LOAD FLOW STUDY AND LV CABLE SELECTION Approximately 250 drives are present in the process plant being designed at Kinsevere. This is
one reason why the complete load flow study conducted for Kinsevere is not presented in this
report. Additional to this reason I did not see it appropriate to display this information for public
knowledge. So as a compromise I have included in this report extracts of the load flow study and
LV cable schedule conducted for the two Tailings Area MCCs, the smallest MCCs present
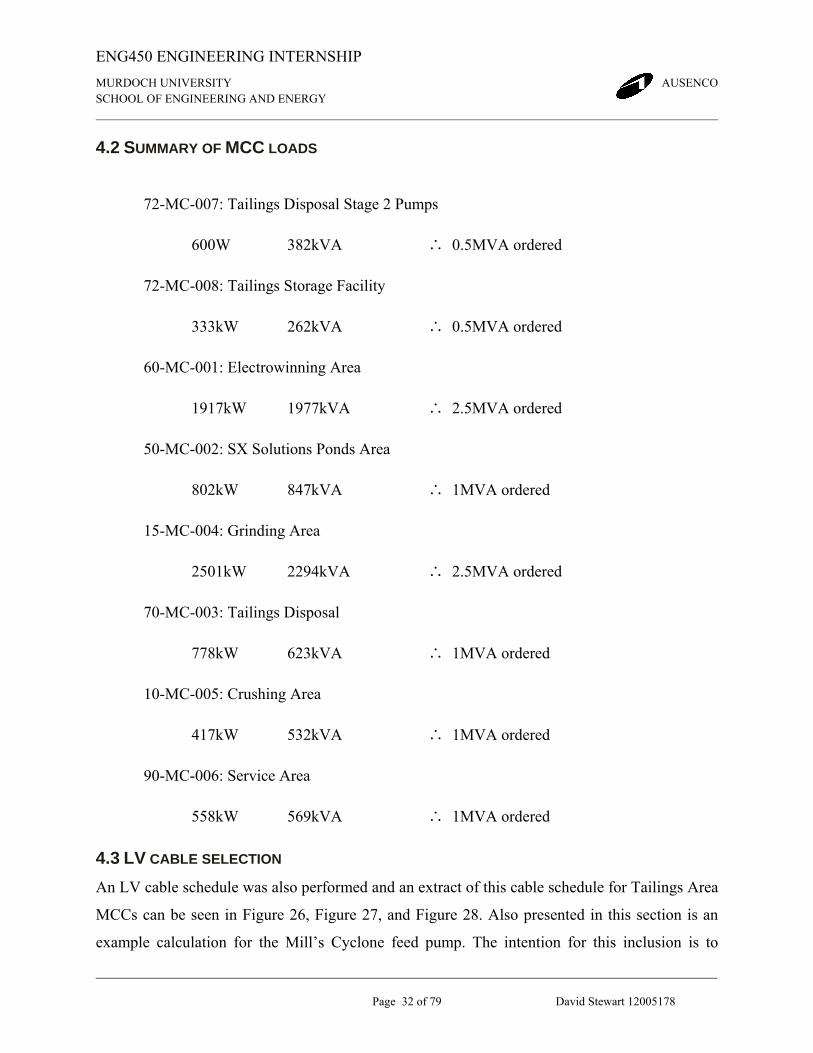
within the plant, and a screen capture of the Electrowinning Area MCC, one of the largest MCCs
in terms of number of drives on site, shown small enough not to display information but included
to provide to the reader an indication of scale. Additionally, listed in the next section is an
overview of the results obtained from the load flow study, used to determine the size of the
transformers ordered for each MCC.
4.1 LOAD FLOW STUDY
Figure 23: Load flow list for Tailings Area MCC 72-MC-007 and 72-MC-008 (1 of 2)
Page 41
ENG450 ENGINEERING INTERNSHIP
MURDOCH UNIVERSITY AUSENCO SCHOOL OF ENGINEERING AND ENERGY
Page 31 of 79 David Stewart 12005178
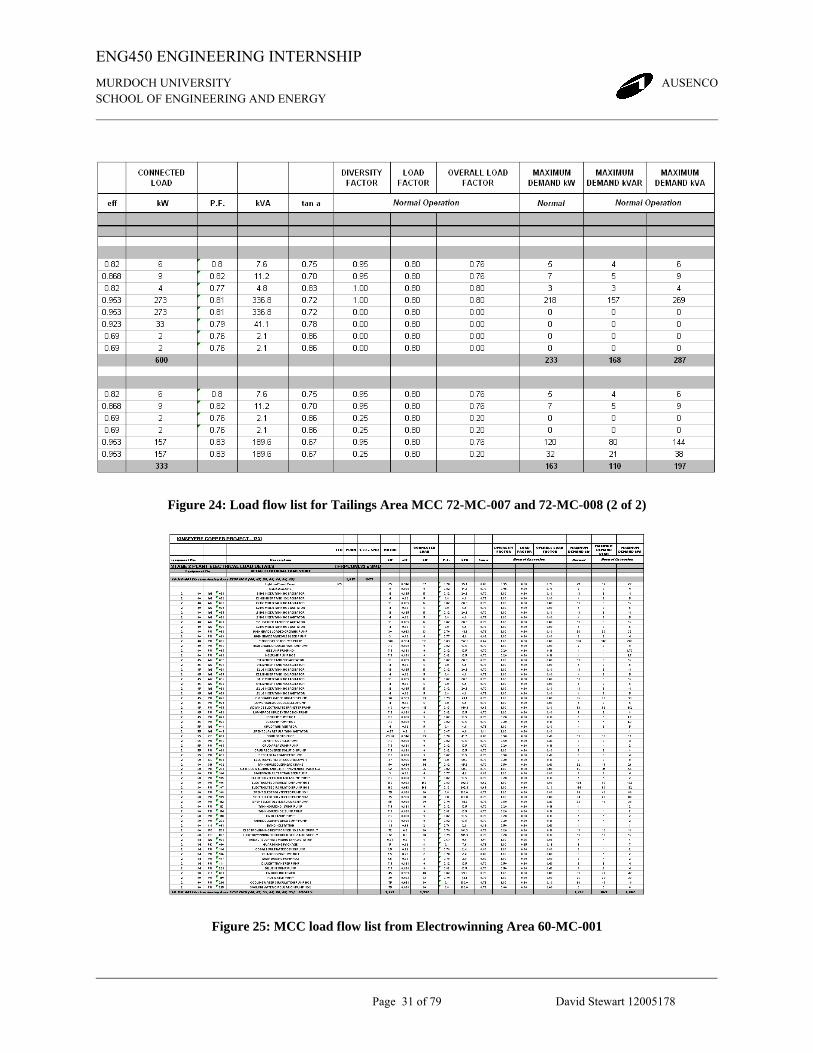
Figure 24: Load flow list for Tailings Area MCC 72-MC-007 and 72-MC-008 (2 of 2)
Figure 25: MCC load flow list from Electrowinning Area 60-MC-001
Page 42
ENG450 ENGINEERING INTERNSHIP
MURDOCH UNIVERSITY AUSENCO SCHOOL OF ENGINEERING AND ENERGY
Page 32 of 79 David Stewart 12005178
4.2 SUMMARY OF MCC LOADS
72-MC-007: Tailings Disposal Stage 2 Pumps
600W 382kVA ∴ 0.5MVA ordered
72-MC-008: Tailings Storage Facility
333kW 262kVA ∴ 0.5MVA ordered
60-MC-001: Electrowinning Area
1917kW 1977kVA ∴ 2.5MVA ordered
50-MC-002: SX Solutions Ponds Area
802kW 847kVA ∴ 1MVA ordered
15-MC-004: Grinding Area
2501kW 2294kVA ∴ 2.5MVA ordered
70-MC-003: Tailings Disposal
778kW 623kVA ∴ 1MVA ordered
10-MC-005: Crushing Area
417kW 532kVA ∴ 1MVA ordered
90-MC-006: Service Area
558kW 569kVA ∴ 1MVA ordered
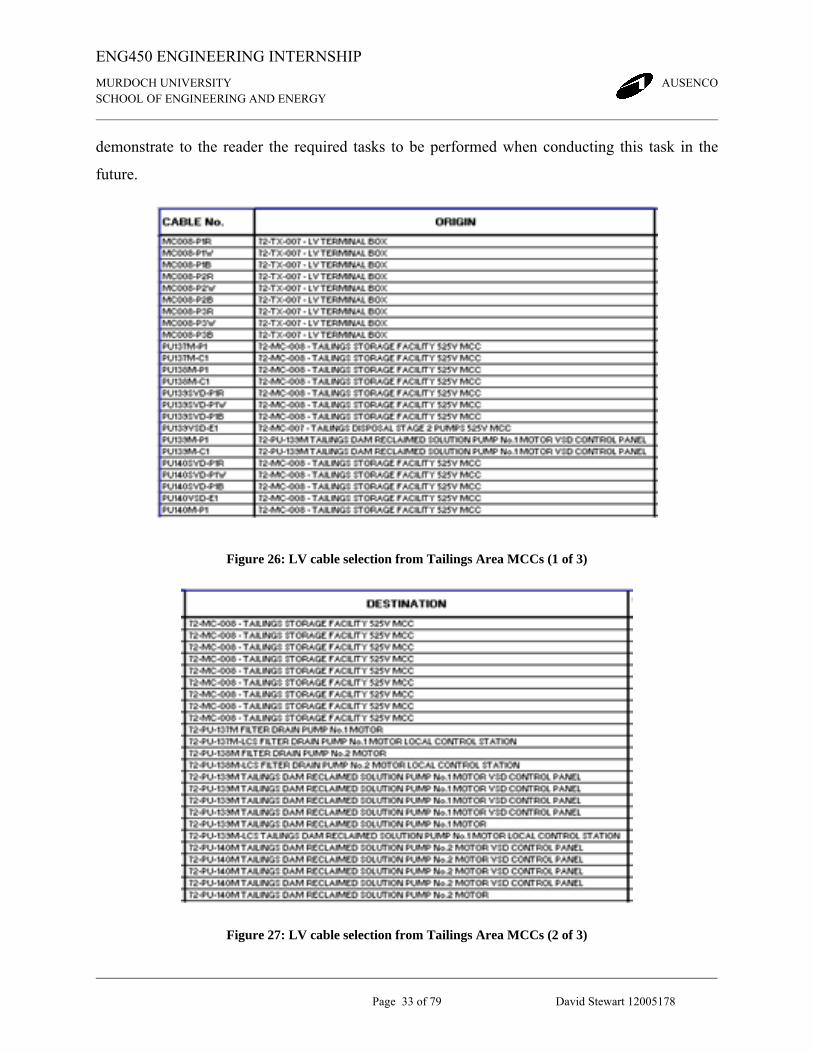
4.3 LV CABLE SELECTION An LV cable schedule was also performed and an extract of this cable schedule for Tailings Area
MCCs can be seen in Figure 26, Figure 27, and Figure 28. Also presented in this section is an
example calculation for the Mill’s Cyclone feed pump. The intention for this inclusion is to
Page 43
ENG450 ENGINEERING INTERNSHIP
MURDOCH UNIVERSITY AUSENCO SCHOOL OF ENGINEERING AND ENERGY
Page 33 of 79 David Stewart 12005178
demonstrate to the reader the required tasks to be performed when conducting this task in the
future.
Figure 26: LV cable selection from Tailings Area MCCs (1 of 3)
Figure 27: LV cable selection from Tailings Area MCCs (2 of 3)
Page 44
ENG450 ENGINEERING INTERNSHIP
MURDOCH UNIVERSITY AUSENCO SCHOOL OF ENGINEERING AND ENERGY
Page 34 of 79 David Stewart 12005178
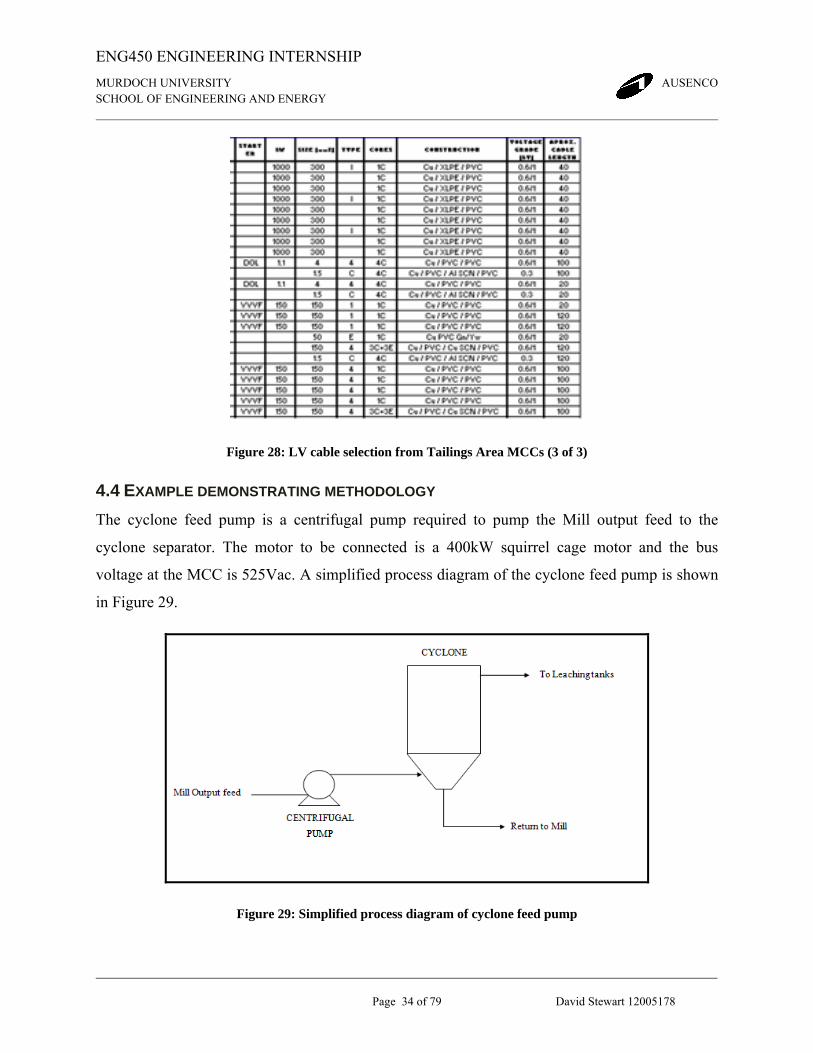
Figure 28: LV cable selection from Tailings Area MCCs (3 of 3)
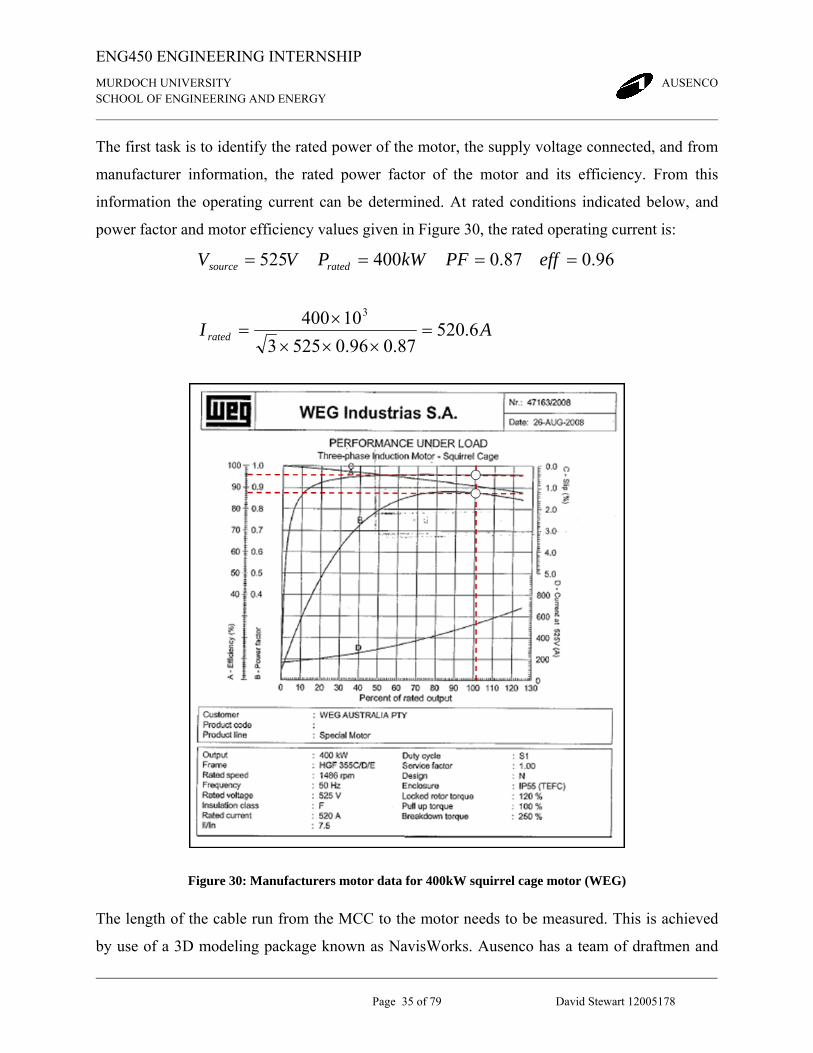
4.4 EXAMPLE DEMONSTRATING METHODOLOGY The cyclone feed pump is a centrifugal pump required to pump the Mill output feed to the
cyclone separator. The motor to be connected is a 400kW squirrel cage motor and the bus
voltage at the MCC is 525Vac. A simplified process diagram of the cyclone feed pump is shown
in Figure 29.
Figure 29: Simplified process diagram of cyclone feed pump
Page 45
ENG450 ENGINEERING INTERNSHIP
MURDOCH UNIVERSITY AUSENCO SCHOOL OF ENGINEERING AND ENERGY
Page 35 of 79 David Stewart 12005178
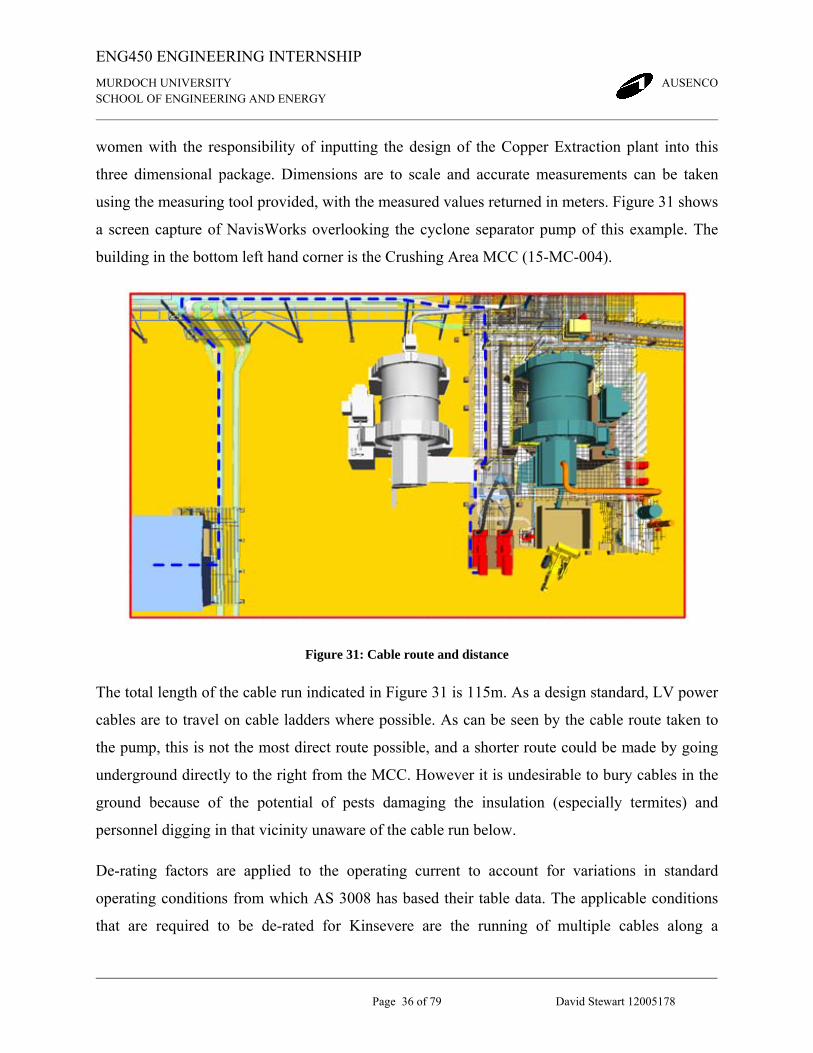
The first task is to identify the rated power of the motor, the supply voltage connected, and from
manufacturer information, the rated power factor of the motor and its efficiency. From this
information the operating current can be determined. At rated conditions indicated below, and
power factor and motor efficiency values given in Figure 30, the rated operating current is:
AI
effPFkWPVV
rated
ratedsource
6.52087.096.05253
10400
96.087.0400525
3
=×××
×=
====
Figure 30: Manufacturers motor data for 400kW squirrel cage motor (WEG)
The length of the cable run from the MCC to the motor needs to be measured. This is achieved
by use of a 3D modeling package known as NavisWorks. Ausenco has a team of draftmen and
Page 46
ENG450 ENGINEERING INTERNSHIP
MURDOCH UNIVERSITY AUSENCO SCHOOL OF ENGINEERING AND ENERGY
Page 36 of 79 David Stewart 12005178
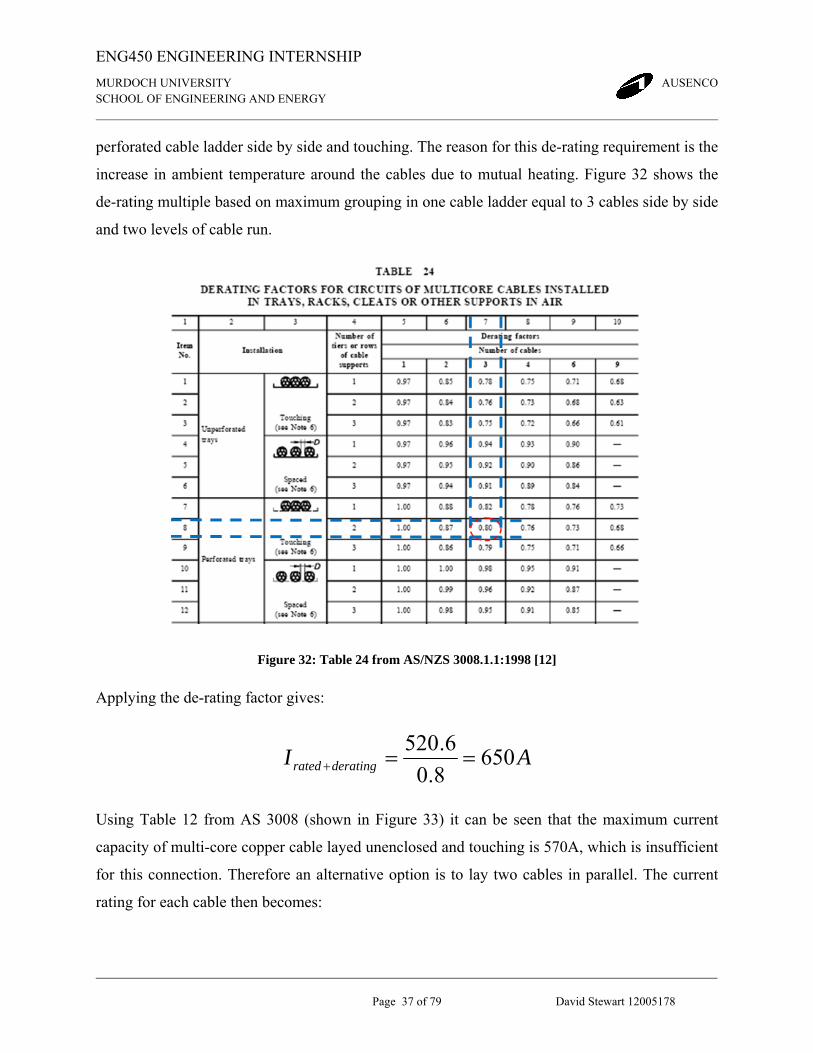
women with the responsibility of inputting the design of the Copper Extraction plant into this
three dimensional package. Dimensions are to scale and accurate measurements can be taken
using the measuring tool provided, with the measured values returned in meters. Figure 31 shows
a screen capture of NavisWorks overlooking the cyclone separator pump of this example. The
building in the bottom left hand corner is the Crushing Area MCC (15-MC-004).
Figure 31: Cable route and distance
The total length of the cable run indicated in Figure 31 is 115m. As a design standard, LV power
cables are to travel on cable ladders where possible. As can be seen by the cable route taken to
the pump, this is not the most direct route possible, and a shorter route could be made by going
underground directly to the right from the MCC. However it is undesirable to bury cables in the
ground because of the potential of pests damaging the insulation (especially termites) and
personnel digging in that vicinity unaware of the cable run below.
De-rating factors are applied to the operating current to account for variations in standard
operating conditions from which AS 3008 has based their table data. The applicable conditions
that are required to be de-rated for Kinsevere are the running of multiple cables along a
Page 47
ENG450 ENGINEERING INTERNSHIP
MURDOCH UNIVERSITY AUSENCO SCHOOL OF ENGINEERING AND ENERGY
Page 37 of 79 David Stewart 12005178
perforated cable ladder side by side and touching. The reason for this de-rating requirement is the
increase in ambient temperature around the cables due to mutual heating. Figure 32 shows the
de-rating multiple based on maximum grouping in one cable ladder equal to 3 cables side by side
and two levels of cable run.
Figure 32: Table 24 from AS/NZS 3008.1.1:1998 [12]
Applying the de-rating factor gives:
AI deratingrated 6508.06.520==+
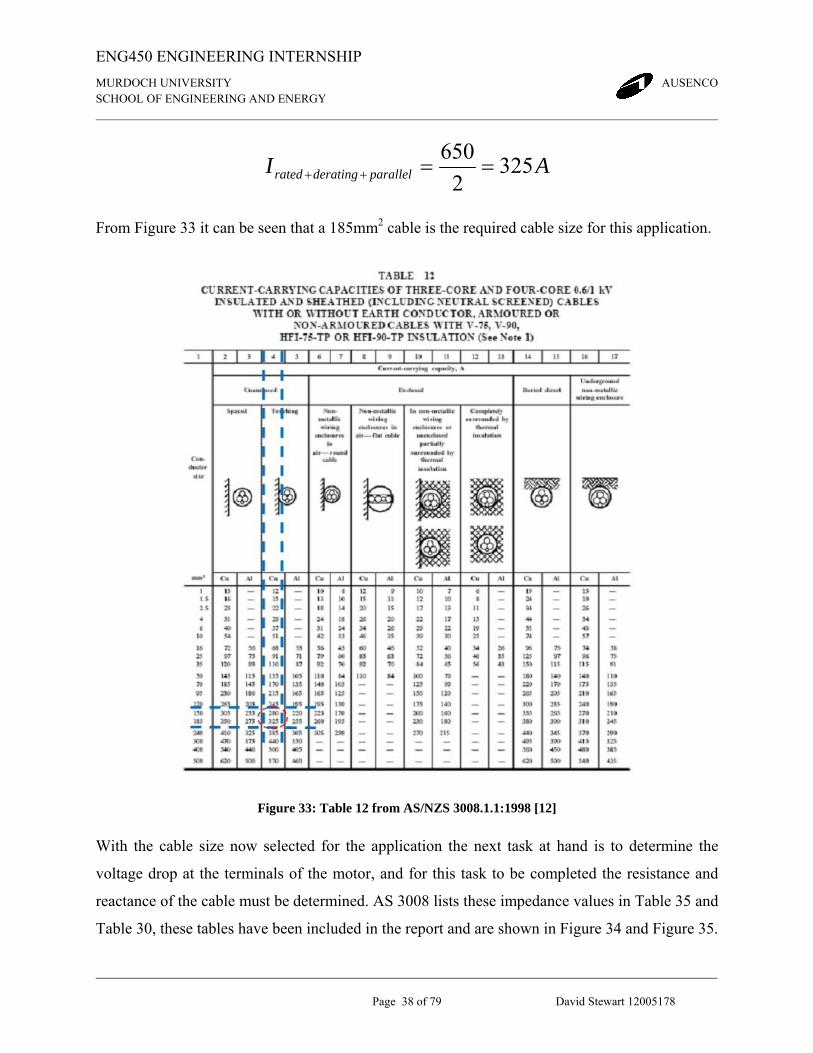
Using Table 12 from AS 3008 (shown in Figure 33) it can be seen that the maximum current
capacity of multi-core copper cable layed unenclosed and touching is 570A, which is insufficient
for this connection. Therefore an alternative option is to lay two cables in parallel. The current
rating for each cable then becomes:
Page 48
ENG450 ENGINEERING INTERNSHIP
MURDOCH UNIVERSITY AUSENCO SCHOOL OF ENGINEERING AND ENERGY
Page 38 of 79 David Stewart 12005178
AI parallelderatingrated 3252
650==++
From Figure 33 it can be seen that a 185mm2 cable is the required cable size for this application.
Figure 33: Table 12 from AS/NZS 3008.1.1:1998 [12]
With the cable size now selected for the application the next task at hand is to determine the
voltage drop at the terminals of the motor, and for this task to be completed the resistance and
reactance of the cable must be determined. AS 3008 lists these impedance values in Table 35 and
Table 30, these tables have been included in the report and are shown in Figure 34 and Figure 35.
Page 49
ENG450 ENGINEERING INTERNSHIP
MURDOCH UNIVERSITY AUSENCO SCHOOL OF ENGINEERING AND ENERGY
Page 39 of 79 David Stewart 12005178
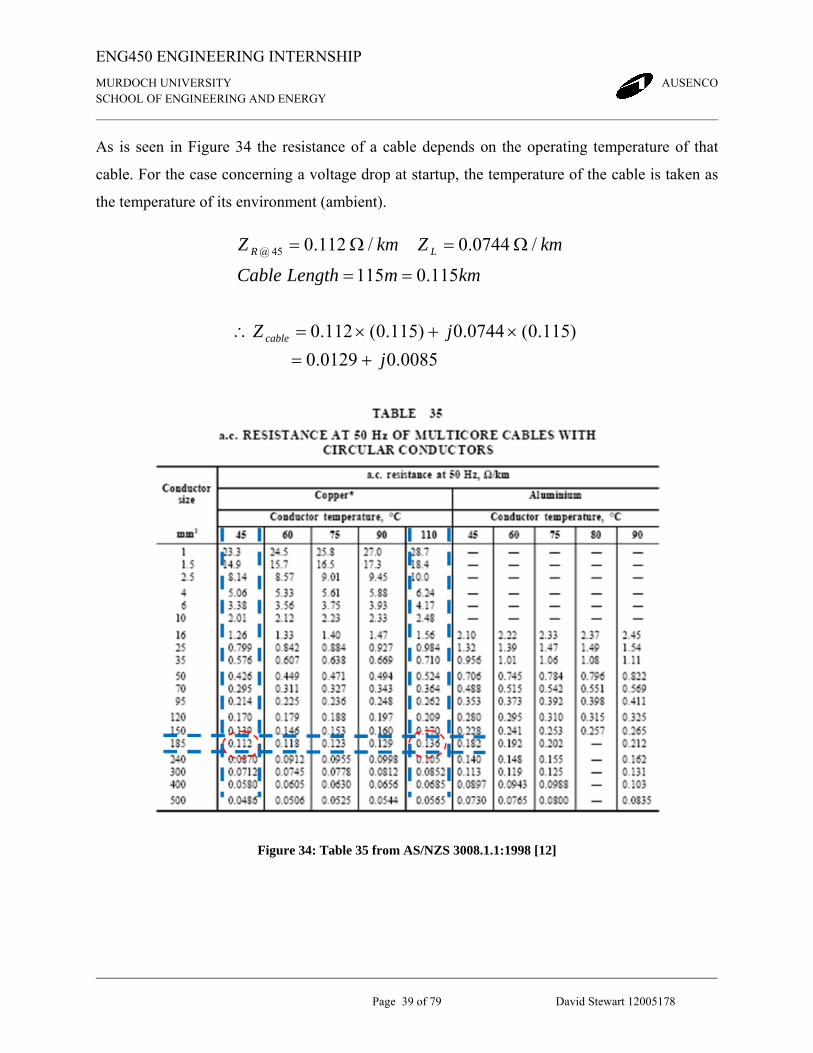
As is seen in Figure 34 the resistance of a cable depends on the operating temperature of that
cable. For the case concerning a voltage drop at startup, the temperature of the cable is taken as
the temperature of its environment (ambient).
0085.00129.0)115.0(0744.0)115.0(112.0
115.0115
/0744.0/112.045@
jjZ
kmmLengthCable
kmZkmZ
cable
LR
+=×+×=∴
==
Ω=Ω=
Figure 34: Table 35 from AS/NZS 3008.1.1:1998 [12]
Page 50
ENG450 ENGINEERING INTERNSHIP
MURDOCH UNIVERSITY AUSENCO SCHOOL OF ENGINEERING AND ENERGY
Page 40 of 79 David Stewart 12005178
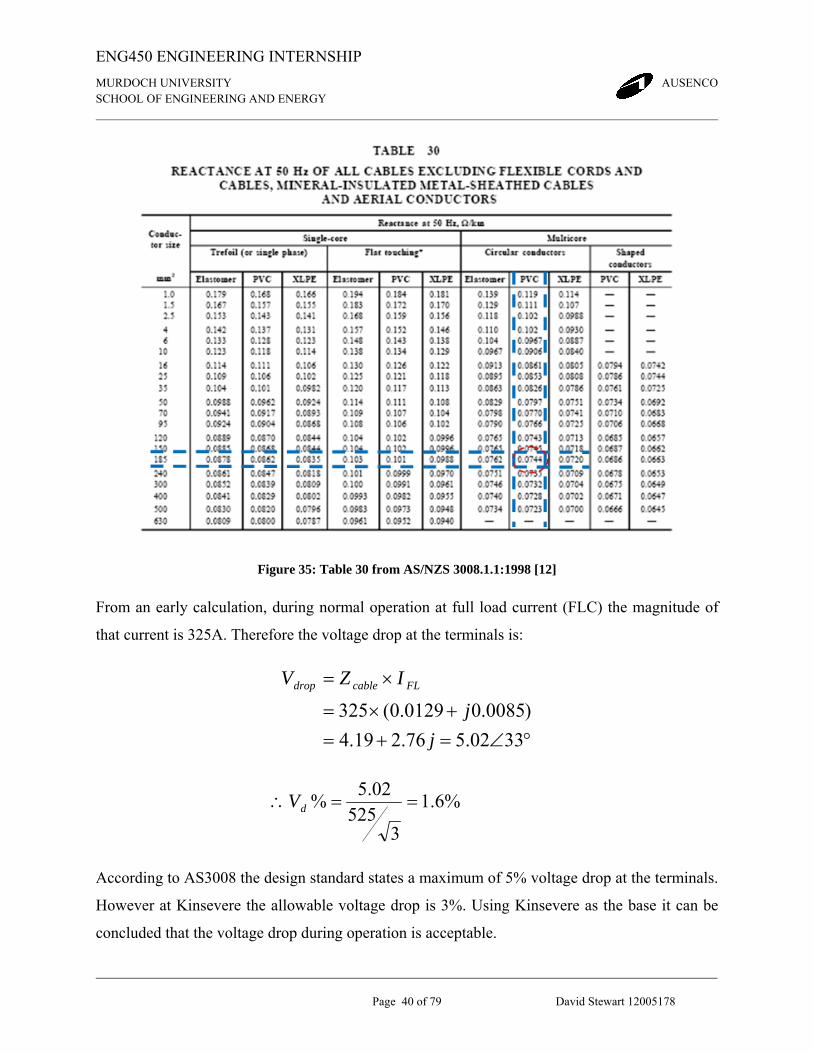
Figure 35: Table 30 from AS/NZS 3008.1.1:1998 [12]
From an early calculation, during normal operation at full load current (FLC) the magnitude of
that current is 325A. Therefore the voltage drop at the terminals is:
°∠=+=+×=
×=
3302.576.219.4)0085.00129.0(325
jj
IZV FLcabledrop
%6.1
3525
02.5% ==∴ dV
According to AS3008 the design standard states a maximum of 5% voltage drop at the terminals.
However at Kinsevere the allowable voltage drop is 3%. Using Kinsevere as the base it can be
concluded that the voltage drop during operation is acceptable.
Page 51
ENG450 ENGINEERING INTERNSHIP
MURDOCH UNIVERSITY AUSENCO SCHOOL OF ENGINEERING AND ENERGY
Page 41 of 79 David Stewart 12005178
From Figure 30 a figure is listed labeled II/In. The value of this figure is 7.5 and the meaning of
this figure is the percentage of full load current which will occur during startup. Therefore at
start-up the designer must accommodate for 7.5xFLC. Therefore at locked rotor (start-up) the
current through the cable is:
A
II FLCupstart
24383255.7
5.7
=×=
×=−
°∠=+=
+×=
×= −
337.3772.2045.31)0085.00129.0(2438
jj
IZV upstartcabledrop
%4.12
3525
7.37% ==∴ dV
From Equation 7 the start-up torque available to the motor is then:
FLTofupstart %7.76100
6.87 2
=⎟⎠⎞
⎜⎝⎛=Γ −
For the case of the cyclone pump as per Figure 29, the load attached to the motor is a variable
torque load (Figure 17b) and therefore loss of torque at start-up is not as significant. Therefore a
DOL drive for this application would be acceptable. However a process requirement for this
application is the ability to vary the flow rate of this pump. This can be achieved either through
gearing or alternatively through a VVVF drive installed. The choice was made for the latter.
One final note on this situation is related to motor ratings and VVVF operation. A usual cooling
method for squirrel cage motors is forced ventilation from a fan coupled to the drive shaft of the
motor. When insulating this type of motor, manufacturers will account for the heat dissipation
provided by the cooling system at rated speeds. If the operating speed of the motor is lower than
Page 52
ENG450 ENGINEERING INTERNSHIP
MURDOCH UNIVERSITY AUSENCO SCHOOL OF ENGINEERING AND ENERGY
Page 42 of 79 David Stewart 12005178
rated, the ability of the cooling system to remove heat from the windings is drastically reduced.
Therefore when using a VVVF drive to reduce the operating speed of a motor for an application
this must be referred the manufacturer so the reduced cooling ability is accounted for.
Page 53
ENG450 ENGINEERING INTERNSHIP
MURDOCH UNIVERSITY AUSENCO SCHOOL OF ENGINEERING AND ENERGY
Page 43 of 79 David Stewart 12005178
5 PROCESSES INVOLVED IN ORE REDUCTION
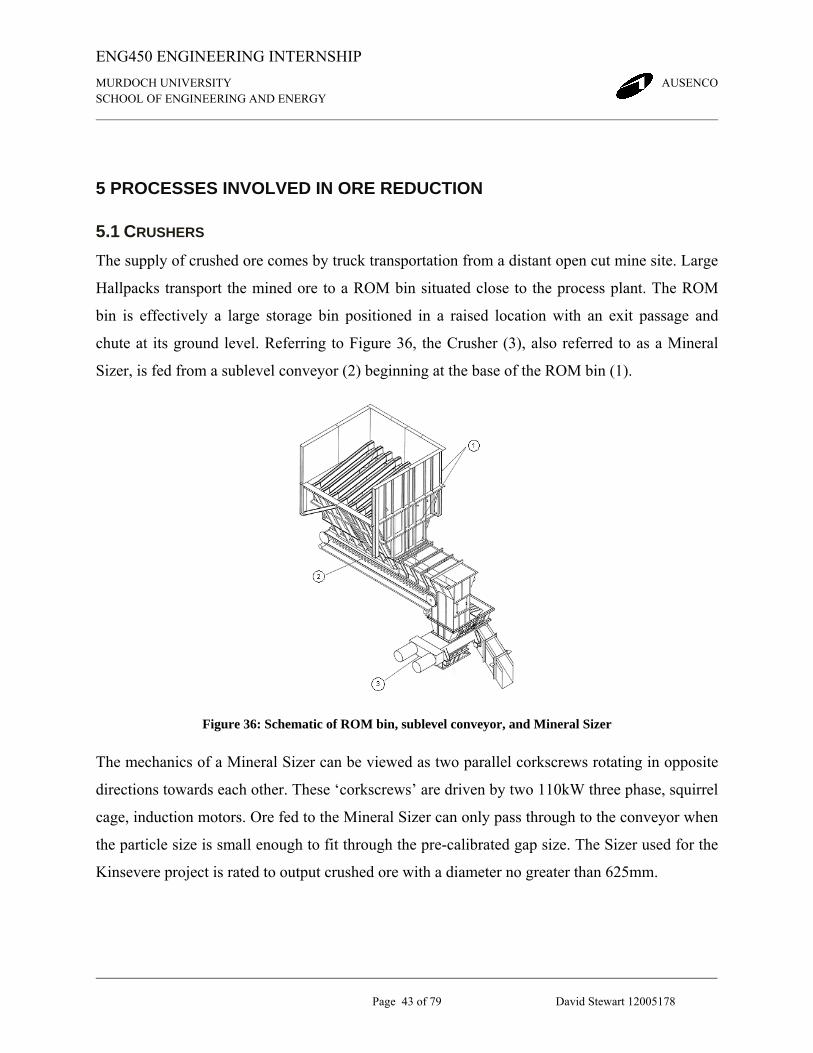
5.1 CRUSHERS The supply of crushed ore comes by truck transportation from a distant open cut mine site. Large
Hallpacks transport the mined ore to a ROM bin situated close to the process plant. The ROM
bin is effectively a large storage bin positioned in a raised location with an exit passage and
chute at its ground level. Referring to Figure 36, the Crusher (3), also referred to as a Mineral
Sizer, is fed from a sublevel conveyor (2) beginning at the base of the ROM bin (1).
Figure 36: Schematic of ROM bin, sublevel conveyor, and Mineral Sizer
The mechanics of a Mineral Sizer can be viewed as two parallel corkscrews rotating in opposite
directions towards each other. These ‘corkscrews’ are driven by two 110kW three phase, squirrel
cage, induction motors. Ore fed to the Mineral Sizer can only pass through to the conveyor when
the particle size is small enough to fit through the pre-calibrated gap size. The Sizer used for the
Kinsevere project is rated to output crushed ore with a diameter no greater than 625mm.
Page 54
ENG450 ENGINEERING INTERNSHIP
MURDOCH UNIVERSITY AUSENCO SCHOOL OF ENGINEERING AND ENERGY
Page 44 of 79 David Stewart 12005178
5.2 CONVEYORS There are two main sections of the conveyor system employed in the Kinsevere Project. The first
is a Tie-in conveyor, intended to selectively transport crushed ore from the existing Crusher to
the new Process Plant. The second section of conveyor system is the Mill Feed Conveyor which
takes the course from new Crusher to new Ball Mill.
The conveyor model employed in both situations is a belt conveyor: a long, continuous, rubber
belt, looping the entire length of the conveyor, supported by rollers, with the ore sitting on top,
and two drive motors positioned at each end of the conveyor to provide movement. Both
conveyors are driven by three phase squirrel cage induction motors.
Figure 37: Site picture of a belt conveyor
5.3 BALL MILL Briefly mentioned in the Copper extraction overview was the Ball Mill’s electrical connection
scheme. The key electrical components are:
1. A 3MVA wound rotor induction motor
2. A Liquid Resistance Starter (LRS), and
3. A Slip Energy Recovery (SER) Unit
Page 55
ENG450 ENGINEERING INTERNSHIP
MURDOCH UNIVERSITY AUSENCO SCHOOL OF ENGINEERING AND ENERGY
Page 45 of 79 David Stewart 12005178
5.3.1 Wound rotor motor
The 3MVA motor is the main drive of the Mill during operation. It is an ac induction motor with
a six pole stator and its rotor circuit brought out for resistance insertion. Connection to the stator
is at 11kV and during normal operation the rated current is 160A. The principle of operation of
this machine is the same as the squirrel cage motor and has been explained in depth in previous
sections.
5.3.2 Liquid resistance starter
A simplified description of a LRS is a variable resistor placed in series with the rotor circuit.
Initially the resistance is at its maximum and is gradually reduced as the motor starts up.
Physically, the device is more like a battery i.e. terminals (electrodes) submerged in battery
solution (electrolyte). How the LRS differs from a battery is it possesses the mechanical means
to raise and lower its electrodes in and out of the electrolyte.
In essence, it is the amount of contact between the electrode and electrolyte which determines the
resistance. Practically, as the rotor is three phase, the LRS has three electrodes, with the
resistance being seen between the phases. Starting position is when the electrodes are fully
submerged in the electrolyte and at this point the resistance is at its greatest. As the motor runs
up to full speed the LRS raises its terminals, lifting the electrodes out of the electrolyte, and
reducing the resistance. When in its maximum vertical position the LRS is completely shorted
and effectively removed from the rotor circuit.
A major advantage of the LRS over other methods such as a staged resistances technique is its
controllability of the resistance value during operation. For a staged resistance implementation
the steps which occur when resistance change is requested are fixed at the minimum resistance
size installed which can be shorted from the circuit. With a LRS implementation, the resistance
change is smooth and analogue, based on the height of the electrode removed from the
electrolyte. The implementation design for height adjustment of the LRS electrodes is via a
worm drive configuration, a squirrel cage motor, and a VVVF drive controlling the speed of
operation of the motor. In this method of height adjustment any desired resistance change
characteristic during operation of the LRS can be programmed to occur.
Page 56
ENG450 ENGINEERING INTERNSHIP
MURDOCH UNIVERSITY AUSENCO SCHOOL OF ENGINEERING AND ENERGY
Page 46 of 79 David Stewart 12005178
Also, as the current is being controlled via resistance in the rotor circuit, a consequence of this
method of control is the generation of heat in the resistors. For metallic resistance starters this
heat would have to be absorbed by the resistors installed without causing damage, therefore high
power ratings would be required and fast and efficient cooling methods included. However with
the LRS, the mass of electrolyte can store this heat and dissipate it after the starting procedure
via natural ventilation.
5.3.3 Slip energy recovery
A Slip Energy Recovery Unit is installed on the rotor circuit to control the speed of the Mill
between 80% and 110% of synchronous speed, while also utilising the rotor current by feeding
this energy back into the grid.
Page 57
ENG450 ENGINEERING INTERNSHIP
MURDOCH UNIVERSITY AUSENCO SCHOOL OF ENGINEERING AND ENERGY
Page 47 of 79 David Stewart 12005178
6 MILL OPERATION AND THE CONTROL SYSTEM The control system of the Ball Mill is by far the most complex system associated with the copper
extraction plant and was one of three projects identified for completion in my Project Plan. This
chapter is intended to provide information about the Control System of the Mill and its
peripheral processes. Before this discussion takes place, an overview of the Mill hydraulic
system and the cyclone separator is required.
6.1 OVERVIEW OF THE PERIPHERAL PROCESSES
6.1.1 Hydraulic system
To visualise what the situation is, think for a moment of a front bicycle wheel. Here the frame
supports a central axle from which the wheel revolves around. In this situation, the axle is
stationary and internal bearings allow the wheel to rotate freely. For a Ball Mill, turn this concept
upside down and weld the wheel to the axle. So rather than the wheel rotating around the axle,
the axle rotates with the wheel. Now, add 100 tonne of downward pressure to the wheel and
you’ll find movement virtually impossible. And any movement which does occur resulting in
excessive wear on the axle and support frame.
In the lubrication system employed in Kinsevere, four slide shoe bearings are present at each end
of the Mill, and a combination of high and low pressure pumps supply these bearings with oil.
High pressure pumps provide hydrostatic lubrication. Fundamentally this works by way of a
constant supply of high pressure oil providing an upward force which equals the downward force
of the rotating Mill to float the Mill above the bearings. Low pressure pumps provide
hydrodynamic lubrication. The necessary prerequisite for this form of lubrication is velocity.
Hydrostatic lubrication must be present during starting and stopping (static meaning stationary)
and hydrodynamic lubrication must be present when the Mill is in operation (dynamic meaning
moving).
To avoid overheating issues with the lubrication oil, the temperature is regulated by a
combination of heating and cooling facilities. For heating, two movable skids (one for each end)
Page 58
ENG450 ENGINEERING INTERNSHIP
MURDOCH UNIVERSITY AUSENCO SCHOOL OF ENGINEERING AND ENERGY
Page 48 of 79 David Stewart 12005178
support an oil tank storing the lubricant, with the aforementioned pumps mounted vertically on
top. Heaters mounted within the tank switch on when the oil temperature falls below 30ºC, and
switch off when the temperature reaches 35ºC. For cooling of the lubrication oil three chilling
units provide chilled water to a heat exchanger. Circulation pumps move oil to this heat
exchanger when the oil temperature exceeds 45ºC and ceases operation when the oil temperature
is below 40ºC. The two systems work in tandem to regulate the oil temperature between 30 and
45ºC.
6.1.2 Cyclone Separator
Although the Mill is effective in reducing particle size, it is not capable of ensuring all output is
below this dimension. Consequently a Cyclone Separator has been installed downstream of the
Mill so oversized particles can be returned to the Mill for further grinding.
The principal of operation of a cyclone separator involves a vortex of air inside a conical
structure which is injected with ground ore from the Mill. As the air (infused with the ore
particles of varying size) rotates upwards the vortex widens and the velocity reduces. From the
reduction in velocity, heavier particles cannot overcome the effects of gravity and fall to the
inner walls. Here they slide down the sides of the conical structure away from the vortex of air
and fall out the bottom. The top feed of the Cyclone Separator ejects the finer, sized particles to
be used in the leaching process. The bottom feed containing the heavier particles are returned to
the Mill for further grinding.
Page 59
ENG450 ENGINEERING INTERNSHIP
MURDOCH UNIVERSITY AUSENCO SCHOOL OF ENGINEERING AND ENERGY
Page 49 of 79 David Stewart 12005178
6.2 MILL CONTROL STRATEGY The Mill Control System is PLC based with various external sensors returning state information
about the process and is used to make decisions regarding Mill operation based on a Control
Strategy. Pressure, Temperature, and Level sensors are all present within the Mill and
interconnected processes. Unity is the PLC system used at Kinsevere which comes with its own
coding standard. Citec is the program used for the Human Machine Interface (HMI) and displays
graphical information about the process conditions within the plant to the operator that is
monitored and controlled by the PLC.
Citec and Unity are linked via tags. These tags are defined in Unity and are essentially stored
variables generated by inputs to the PLC, and evaluations of these inputs in relations to defined
set-points specified by the Engineer. Over 30,000 tags are currently present in the PLC, all
related to a state of a process in the plant.
6.2.1 Coding conventions
Most of the coding in Unity is done using Function Blocks, with inputs on the left and outputs on
the right. Although the location of elements on the screen does not matter to the computer, it aids
the programmer tremendously. Therefore the visual layout of the code should be depicted left to
right, with the visual positioning more or less mimicking the logical flow intended. Naming
conventions for all inputs including sensors, alarm, and motor conditions follow the pattern
(Area) (Type) (Sequential No) _ (Tag). An extract of code from the Mill Control System is
shown in Figure 38 and will be used to explain the information conveyed by implementing the
naming convention stated above.
Figure 38: Tag naming convention
Page 60
ENG450 ENGINEERING INTERNSHIP
MURDOCH UNIVERSITY AUSENCO SCHOOL OF ENGINEERING AND ENERGY
Page 50 of 79 David Stewart 12005178
‘Area’ is used to designate a location in the plant that serves a specific function so in one glance
you can immediately narrow your search for an item to within a rough location. The two
examples in Figure 38 are both A15 which indicates the location of this tag is Area 15, which is
grinding i.e. the Ball Mill. Other examples of area naming are A10 indicating Crushing and A60
indicating Electrowinning.
‘Type’ describes the motor or instrument to which the tag is associated with. The first example in
green of Figure 38 is TIT which identifies the sensor to be a Temperature Indicator Transmitter,
the second example in pink is PDIT indicating the sensor is a Pressure Differential Indicator
Transmitter. The meaning of ‘Indicator’ is that the device will have some sort of display
mounted locally on the instrument, which in many cases will be an LCD screen or some other
variation. Other examples of code words include PU for Pump, LIT for Level Indicator
Transmitter, and PIT indicating a Pressure Indicator Transmitter.
‘Sequential No’ is a unique number with respect to ‘Type’. This means that no other device of
that type will have the same identifier.
And lastly ‘Tag’ is used to convey the various state conditions of the device. These will be
generated within the PLC based on sensory information. The example in green from Figure 38 is
HW indicating that it is a High Warning. The example in pink is HHA which notifies that the
tag is a High-High Alarm. Other examples include RUNUP indicating the motor has reach its
running speed, CIA meaning Critical Interlock Alarm, and SEQRDY indicating that all starting
interlocks are in their correct state and the Sequence is Ready to be started.
6.2.2 Interlocks
An Interlock is a certain condition that when detected will prevent or trip operation of a system.
To achieve this, the motors concerned with that system have to be isolated from operating.
Regarding isolation, in a general sense there are two different forms, Electrical and Electronic.
An emergency stop button is an example of electrical isolation because when pressed a relay will
open circuit the power supply to all motors concerned. Programmable Logic Controllers (PLCs)
Page 61
ENG450 ENGINEERING INTERNSHIP
MURDOCH UNIVERSITY AUSENCO SCHOOL OF ENGINEERING AND ENERGY
Page 51 of 79 David Stewart 12005178
utilise electronic isolation because the software written to control the PLC ensures Start signals
are not sent, and Stop signals are.
Three forms of interlocks are used in the Kinsevere project:
Operation interlocks are used to trip the motor during operation, hence its name. When an
undesired state or condition has been detected from a sensor or motor protection device
the motor will trip and cease operation. Once an operational interlock has been tripped,
the drive concerned is locked out from restarting until the situation has been addressed.
Process interlocks are used when the condition of an upstream process determines Mill
operation, or the condition of a downstream process is dependent on Mill operation.
Process interlocks will trip the drive during operation, however they are often not
instantaneous but initiated after a period of time has expired. An example of this is the
feed conveyor to the Mill. If this was detected to be empty or stopped, only once stopped
for a period of time will the Mill have to stop operation, because there would still be
charge in the Mill at the time the situation was detected.
Starting Interlocks are all conditions which must be met before the Mill is started. They
are specific conditions that if not present will cause damage to equipment or introduce
safety concerns. A starting interlock can also be an operational interlock, but if it is not
then it is no longer of concern once the mill is running.
6.2.3 Modes of operation
The different forms of interlocks are a good lead in to discussing the various modes of operation
in the Mill Control System. All modes serve varying purposes and are affected by each interlock
differently.
Local: control is initiated by an Operator directly on site by a Local Control Station
(LCS). All Starting, Process, and Operational interlocks are active.
Remote: control is initiated by command signals from the Control Room by an Operator.
The advantage of this mode of operation is multiple events can be initiated by one
Page 62
ENG450 ENGINEERING INTERNSHIP
MURDOCH UNIVERSITY AUSENCO SCHOOL OF ENGINEERING AND ENERGY
Page 52 of 79 David Stewart 12005178
command. As with the Local mode, Starting, Process, and Operational interlocks are all
active.
Maintenance: control can be initiated either locally or remotely. Maintenance mode
differs in the fact that Process interlocks are bypassed. Reasons for this mode are to allow
for positioning of the Mill via an inching drive to carry out repairs (this is a smaller
alternative motor for the mill which can be clutched into the mill gearing), and the
conducting of test runs without the requirement of crushed ore being supplied.
6.2.4 Alarms
Alarms are generated by a combining of one analog block (Figure 39a) and four alarm blocks
(Figure 39b). Alarms are generated within the PLC and are based on:
Four set points with two for high and two for low
An analog input referred to as a process variable and identified by RAWPV
A hysteresis value indicating a dead band within which the process variable can fluctuate
within without generating a change in signal
A timer value which must expire before the alarm is generated.
As seen in Figure 39a, the left hand side is where the programmer can enter all the information
previously mentioned, and on the right hand side are the four signals sent to the Alarm blocks i.e.
HH (Hi-Hi), H (Hi), L (Low), and LL (Low-Low).
The four signals generated by the analog block in Figure 39a are each suppliers of their own
alarm block displayed in Figure 39b. One reason for feeding these outputs into an alarm block
instead of using them directly is the alarm blocks’ ability to suppress a signal. On the left hand
side of an alarm block in Figure 39b are two inputs labelled SUPP1 and SUPP2. These both
stand for suppression and if this input is true than the alarm signal on the right will not be
generated.
Page 63
ENG450 ENGINEERING INTERNSHIP
MURDOCH UNIVERSITY AUSENCO SCHOOL OF ENGINEERING AND ENERGY
Page 53 of 79 David Stewart 12005178
Another reason for using an alarm block is there are some cases where you would not like an
alarm to disappear if the process variable is no longer outside of specified range. The alarm
block provides an AUTORST input (Auto Reset) where if the signal at this input is true then the
alarm will clear automatically, but if the signal is false the alarm will not clear until an ALMRST
(Alarm Reset) signal has been generated by the operator.
Figure 39: Analog and alarm blocks
Page 64
ENG450 ENGINEERING INTERNSHIP
MURDOCH UNIVERSITY AUSENCO SCHOOL OF ENGINEERING AND ENERGY
Page 54 of 79 David Stewart 12005178
6.2.5 Startup procedure
Within the PLC the function block used to represent the drive for the Mill is shown in Figure 40.
For the remainder of this discussion we will be referring to this function block as the Mill drive,
this clarification is required to avoid any confusion from previous discussions regarding DOL
and VVVF drives. Also, when looking at the drive labels you will notice all labels on the left
hand side end with an ‘I’ and all labels on the right end with ‘O’, this is just a reminder to the
programmer that the labels on the left are Input (I) and the labels on the right are Output (O).
Figure 40: Mill drive in PLC
The top two inputs on the left hand side of the drive in Figure 40 are used to control the process
interlocks (PII) and critical interlocks (CII) interaction. The tags used to supply a signal to these
inputs are A15ML001_PI and A15ML001_CI respectively. Conditions for these tags are
generated in another location using a combination of AND, OR, and TON (Timers) function
blocks, with each tag generated from sensory information supplied to the PLC. Figure 41 shows
the section of code which generates both A15ML001_PI and A15ML001_CI’s Boolean values.
Page 65
ENG450 ENGINEERING INTERNSHIP
MURDOCH UNIVERSITY AUSENCO SCHOOL OF ENGINEERING AND ENERGY
Page 55 of 79 David Stewart 12005178
Figure 41: Critical and process interlocks for the mill
The process interlock A15ML001_PI shown in the top portion of Figure 41 is determined by two
conditions, the first condition A15_Mill_Lube_STTCOMPLETE is there to ensure the Mill’s
hydraulic system is up and ready before the Mill start sequence is initiated. The second input
A10WCIT0031_LW is a tag generated from a weight-o-meter installed on the Mill Feed
Conveyor. Within the PLC a Low Warning (LW) alarm is generated when the conveyor is
empty. This event will trip the Mill but only when the conveyor is empty for a defined period of
time. The time period shown in Figure 41 is 3 minutes (t#3m) but this value was used to
facilitate debugging with the true time closer to 30 minutes.
Page 66
ENG450 ENGINEERING INTERNSHIP
MURDOCH UNIVERSITY AUSENCO SCHOOL OF ENGINEERING AND ENERGY
Page 56 of 79 David Stewart 12005178
The critical interlock tag A15ML001_CI can be activated by a number of different conditions in
the Mill. The way in which this code is written is ANY tag listed as an input will cause the
critical interlock tag to be false if a bad state is detected. A bad state for a tag can either be true
or false because some interlocks require the tag to be false for a good condition to occur. On
many of the tags attached as inputs in Figure 41 a circle appears between the tag and the function
block, this is set by the programmer and indicates that the signal is negated i.e. a false tag will
feed a true signal to the function block.
Because it would be hard for a person not familiar with the control system to understand all the
interlocks shown in Figure 41, a summary of the starting conditions are listed below:
− Oil tank level above a critical value
− Oil temperature is within range
− Both High Pressure and Low pressure pumps are running
− Pressure in the lines of the high and low pressure circuits are above a critical value
− Differential pressure across the oil filters is not above a critical value (indication of a
clogged filter)
− The auxiliary drive clutch is not engaged
− The LRS is ready in its maximum position.
− The mill is stationary
Referring back to Figure 41, starting interlocks are implemented by suppressing the tags defined
to be a starting interlock with an OR function block and the running signal of the Mill
(A15ML001_RUNUP). In this way once the Mill is running A15ML001_RUNUP would be true
and therefore regardless of the conditions of the other tags the output of the OR block would also
be true
Page 67
ENG450 ENGINEERING INTERNSHIP
MURDOCH UNIVERSITY AUSENCO SCHOOL OF ENGINEERING AND ENERGY
Page 57 of 79 David Stewart 12005178
Of the tags shown in Figure 41 there are two tags labelled A15_MILL_STAND_STILL and
A15_MILL_HYDRAULICS_OK. These tags are generated by a combination of other tags in
another section of the program. The reason for the existence of these tags is the conditions which
dictate their state are repeated in several locations throughout the program, so rather than
repeating the code every time we have written it once and defined our own variables.
Generation of the tag A15_MILL_HYDRAULICS_OK is shown in Figure 42. The tags used as
inputs are purely related to the hydraulic system of the Mill. As a quick note, from the Figure 42
several OR function blocks can be seen, this is to accommodate for the redundancy operation of
the high pressure and low pressure pumps.
Figure 42: Mill Hydraulic is ok tag generation
The purpose of the A15_MILL_STAND_STILL is to ensure the Mill is not in motion when the
signal to start the Mill is generated. The consequences of this situation occurring is not good,
Page 68
ENG450 ENGINEERING INTERNSHIP
MURDOCH UNIVERSITY AUSENCO SCHOOL OF ENGINEERING AND ENERGY
Page 58 of 79 David Stewart 12005178
with major mechanical damage to the motor and gearing system very likely. This tag is true
when the Mill rundown signal has been received (A15ML001_RUNDN), and either the clutch of
the gearing system is engaged, or the auxiliary drive is running. The RUNDN signal is an output
of the Mill drive (Figure 40) and is true when the supply to the motor has been removed and a
time period inputted at the RUNDNTMR input has elapsed (Rundown timer can be seen in the
lower regions of the Mill drive inputs of Figure 40).
Figure 43: Mill standstill tag generation
When a false value is generated by either A15ML001_PI or A15ML001_CI the Mill drive will
generate a Critical Interlock Alarm (A15ML001_CIA) which will stop the Mill if it is running, or
prevent the start sequence from being initiated.
For the start sequence to be initiated an operator is required to send a start signal to the Mill
drive. If the Mill is set to maintenance mode (A15ML001_MAINT) or local mode (a false value
at A15ML001_REMOTE) then the command to initiate the starting of the motor occurs by a true
value at A15ML001_CMDSTT (command start). If the system is in remote mode then a true
value will be present at A15ML001_REMOTE and the command to start the Mill will come via
an operator initiating a starting sequence from the HMI in the control room and the
A15ML001_SEQSTT (sequence start) tag being used. The start sequence is already written in
the PLC but lays dormant until the signal is received by the HMI to initiate. The start sequence
then goes through a series of steps in order to start the Mill.
How the HMI is able to initiate a start sequence is by the sequence function block shown in
Figure 44. There are two sequences written for the starting of the Mill, the first is the Mill Lube
Page 69
ENG450 ENGINEERING INTERNSHIP
MURDOCH UNIVERSITY AUSENCO SCHOOL OF ENGINEERING AND ENERGY
Page 59 of 79 David Stewart 12005178
sequence and the second is the Grinding Sequence. Both sequences consist of action blocks and
transitions. Within the action block a programmer can set the state of any tag defined in the PLC.
For the starting of the Mill the principle action is to set the SEQSTT tags true for the many
motors involved in the start routine i.e. all low pressure pumps and high pressure pumps are run
by motors and have similar drives as the Mill’s drive shown in Figure 40, a SEQSTT tag exists
for all these motors to start the motor when set in REMOTE mode of operation.
The sequence function block in Figure 44 will initiate operation in the Grinding sequence by
activating the first action block defined for that sequence. For operation to exit the action block,
transition conditions are written, and when the conditions defined for each transition have been
met execution of the next action block in the sequence chain will initiate, with the commands
defined in the previous action block no longer present.
Figure 44: Sequence function block enabling MHI interaction
As before when describing the critical interlocks for the Mill, an understanding of what is
actually happening when looking at the code in each figure is difficult, so to simplify the
understanding a summary of the basic operations of the Mill start routine will be presented. The
first action of the start routine is to send SEQSTT (sequence start) signals to all the high pressure
pumps. When these signals are received the associated drives for each pump will send a start
signal to the pump motor drive (DOL) and three outcomes are then possible:
Page 70
ENG450 ENGINEERING INTERNSHIP
MURDOCH UNIVERSITY AUSENCO SCHOOL OF ENGINEERING AND ENERGY
Page 60 of 79 David Stewart 12005178
a. If all goes according to plan no critical and process interlocks will be present and the
motors will start, returning a running signal (RUNUP) to the PLC which will be received
by the drive before a time has expired defined by the RUNUPTMR input.
b. A critical interlock or process interlock is detected and the drives for the effected motors
will throw a critical interlock alarm (CIA). This will result in the graphical representation
of the motor on the HMI screen flashing red and alarms being generated.
c. No critical interlocks or process interlocks are received but the RUNUP signal is not
received before the time defined by RUNUPTMR expires. This will also generate a CIA
and the pumps will also flash red on the HMI screen.
If the last two conditions are detected the start routine is aborted.
When the high pressure pumps are running (RUNUP is true) the transition condition defined for
this action is set to true and execution begins in the next action block in the sequence. The
second action block will then send SEQSTT signals to the low pressure pumps to operate. As
with the high pressure case, identical circumstances can occur, and the start sequence will only
proceed if all the low pressure pumps’ RUNUP signals are received.
As a quick note, the transition conditions for both high and low pressure pumps only require one
of the two pumps in a pump pair to generate a RUNUP signal. This is because each pump pair
operates in a redundancy configuration and only one pump is required at any given time. Figure
45 shows the code for generating the high pressure pumps transition. When the
HP_PUMP_RUNUP tag is true, execution of the next action block will be initiated which in the
Mill start routine is the starting of the low pressure pumps.
Page 71
ENG450 ENGINEERING INTERNSHIP
MURDOCH UNIVERSITY AUSENCO SCHOOL OF ENGINEERING AND ENERGY
Page 61 of 79 David Stewart 12005178
Figure 45: Transition condition for high pressure pumps
And finally, the last operation for the start routine is to signal the mill’s main drive motor to start
and this has the same three outcomes as the ones listed above.
Page 72
ENG450 ENGINEERING INTERNSHIP
MURDOCH UNIVERSITY AUSENCO SCHOOL OF ENGINEERING AND ENERGY
Page 62 of 79 David Stewart 12005178
7 DISCUSSION As time was spent in my internship placement, I became aware that there was a lot of general
knowledge and simple concepts which I did not fully understand. It may have been the case that
the meanings were not clearly understood, or I had simply heard of these things in passing and
assumed knowledge based on common reference. When I became aware of this I decided that if I
did not know the exact meaning of an instrument, concept, or application, I would research it. In
most situations this act was simply a confirmation of my ideas, but on occasions I found that my
understanding was incorrect, either slightly or completely, or totally lacking. Because of this fact
I have presented in this report explanations of common concepts and practical applications that,
from my experience, on most occasions are not fully understood.
Another realisation I had during my internship, which I find important to mention, is related to
engineering design. The best way to introduce this point is by use of a common expression:
‘there is always more than one way to skin a cat’ (apologies to all cat lovers). To address this,
let’s look at an issue concerning start-up of a conveyor, and the prevention of personnel in close
proximity to it.
One possible solution is the installation of barriers along the entirety of the conveyor preventing
access. This is an effective solution. However in the case where access is required for
maintenance the original issue resurfaces. To overcome this we can implement a lockout system,
initiated by the maintenance crew and only removed by that maintenance crew. And again we
have solved the new issue which surfaced, but what if access were required during operation?
Another possible solution is to introduce proximity sensors along the entirety of the conveyor
and prevent the start-up procedure from initiating if personnel are detected. Again this is an
effective solution. In fact it could be considered ideal, but it is not. With this solution the
complexity of the system is high: communication wires, PLCs, sensors, calibration, mounting,
coding, all required. And what if a bird was sitting on a pole near the conveyor, or a dusty
situation was present, would the sensors then trip?
Page 73
ENG450 ENGINEERING INTERNSHIP
MURDOCH UNIVERSITY AUSENCO SCHOOL OF ENGINEERING AND ENERGY
Page 63 of 79 David Stewart 12005178
These examples highlight two key points. Firstly, you can often get engrossed in a series of
cascading, reactive, problem solving techniques. With the end result not applicable for normal
operation. The second is it is very easy to overdesign a solution. The more complex a system is
the more things can go wrong. At Kinsevere, to address this issue an early warning system is
employed, with sirens that can be heard anywhere along the conveyor. The sirens sound for a
predetermined time before the start up procedure is initiated. This option was considered
sufficient as the likelihood of personnel not hearing this siren is remote. Additionally, emergency
stop buttons are located along the entire length of the conveyor which will electrically isolate the
motors from their supply.
And for my final discussion point, it is important for a graduate engineer who comes out of
university not to assume they are now complete in knowledge in their field of study. Because in
actual fact once you finish your degree you effectively start your apprenticeship, and it is only
after years of learning and listening that you become capable of performing your work
competently and reliably. If you do not put in the hard yards to bring your skills up to industrial
standards at the start, you are in a sense being negligent in your actions. One of the ethical
guidelines for Engineers states ‘one should not act outside of their discipline’, from this it can be
implied that one should not act in areas where they are not competent. And this is the reason for
the previous statement because one should not underestimate the responsibility bestowed on an
Engineer to perform the tasks correctly.
7.1 PROBLEMS FACED DURING INTERNSHIP One of the problems which occurred was in relation to the Mill Control System. The Mill was a
vendor package bought by the client before Ausenco’s involvement. When this package was
bought very little vendor data was collected. Additionally the PLC program written for the Mill
was not included with the purchase but instead a screen capture of an example program was
supplied. This example program was not written in the same code language as Unity which is the
code language accompanying the PLC’s purchased. As a result several weeks were required
reading this code and understanding its operations.
Page 74
ENG450 ENGINEERING INTERNSHIP
MURDOCH UNIVERSITY AUSENCO SCHOOL OF ENGINEERING AND ENERGY
Page 64 of 79 David Stewart 12005178
Normal to Ausenco’s control system plan is a written functional description of the process which
the PLC is to control. This was not submitted by the Vendor and as a result this needed to be
inferred from the screen dumps of the code supplied with the package. Examples of these screen
dumps are shown in Figure 46 and Figure 47. There are exactly 71 pages of code like these and
at times it felt like I was reading hieroglyphics. Also, due to contract specifications, if the
intended purpose displayed in the code submitted by the vendor was not followed exactly,
contractual issues could occur if something did go wrong in the future. To avoid this from
occurring it was essential that the program written performed the exact operation as the example
program supplied.
Figure 46: Mill control system example code 1 from vendor
Page 75
ENG450 ENGINEERING INTERNSHIP
MURDOCH UNIVERSITY AUSENCO SCHOOL OF ENGINEERING AND ENERGY
Page 65 of 79 David Stewart 12005178
Figure 47: Mill control system example code 2 from vendor
An extract of the function description which was written is shown in Figure 48.
Figure 48: Function description developed
Page 76
ENG450 ENGINEERING INTERNSHIP
MURDOCH UNIVERSITY AUSENCO SCHOOL OF ENGINEERING AND ENERGY
Page 66 of 79 David Stewart 12005178
As a result, the time required to complete this task was understated. However this did not end up
being an issue with the Mill control system as this task was completed successfully.
The second issue which I faced during my internship was basically I did not have enough time to
finish the short electrical analysis of the process plant and perform power factor correction
calculations based on results of the load study. This was due to a combination of factors, one was
the additional time required for the Mill and another reason was that I was unaware of the sheer
size of the plant and the number of drives, motors and transformers that existed. The third reason
is related to this last point, and that is as a result of underestimating the size of the project I
inadvertently overstated the tasks to be completed for my internship. But, in saying that, I did get
pretty close.
As a side note, a short circuit analysis was conducted using a computer package known as ETAP.
However it was desired to perform this task by hand and for this reason results have not been
included in the report. Additionally, also stated in my project plan was the conducting of an
operator training program. However, because this was a proof of concepts project that did not get
the go ahead to continue, I have not included it in the report.
7.2 FUTURE WORK Incomplete tasks identified for completion in my project plan is a short circuit analysis of the
electrical system and power factor compensation id required. As a result for future works it is
recommended that these tasks are performed.
Page 77
ENG450 ENGINEERING INTERNSHIP
MURDOCH UNIVERSITY AUSENCO SCHOOL OF ENGINEERING AND ENERGY
Page 67 of 79 David Stewart 12005178
8 CONCLUSION This report is a detailing of the task performed during my Internship placement at Ausenco.
Accompanied with this information are the principles involved in copper extraction, an overview
of the Kinsevere project and its electrical system, low voltage motor selection with respect to ac
induction motors, as well as common drives characteristics and varying load applications.
Extracts from the LV load flow study and cable selection are included for viewing and some not
so common considerations have been added for interest. Additionally the successful completion
of the Mill Control system has been notified and the methods employed for this task have been
explained, with extracts of code shown and common coding practices and styles discussed and
justified.
Within the discussion section of this report I have included some thoughts and realisations I have
had during my internship and identified some of the limitations and issued required to be
resolved to complete the tasks defined. And finally for future works, I have identified a short
circuit analysis of the power system to be conducted by hand, and based on results from the load
flow study, any power factor compensation requirements to be addressed.
Page 78
ENG450 ENGINEERING INTERNSHIP
MURDOCH UNIVERSITY AUSENCO SCHOOL OF ENGINEERING AND ENERGY
Page 68 of 79 David Stewart 12005178
9 REFERENCES
[1] Clement & Dutrizac, 2003. Copper Electrorefining and Electrowinning. Volume 5.
Canadian Institute of Mining, Metallurgy and Petroleum. Pg 421-521
[2] Taylor, A., 2007. Copper SX/EW basic principles, & detailed plant design. ALTA
Metallurgical services presentation, Library Reference 669.3 alt 2007. Pg 7-121
[3] Austin, Klimpel & Luckie, 1984. Process Engineering of Size Reduction: Ball Mill.
Guinn Printing Inc. Hoboken, New Jersey. Pg 1-15
[4] Biswas & Davenport, 1976. Extractive Metallurgy of Copper. Pergamon Press. Pg 1-
16, 254-281
[5] Jewell & Fourie, 2006. Paste and Thickened Tailings – A Guide. Australian Centre
for Geomechanics. Pg 5-161
[6] Chapman, S., 2005. Electrical Machinery Fundamentals. 4th Edition. Ed McGraw
Hill
[7] Richmond, A,. 1990. Drives and Servos Yearbook 1990-91. Control Techniques
[8] Glover, Sarma & Overby, 2008. Power System Analysis and Design. 4th Edition.
Thomson Learning.
[9] Parekh, R., 2003. AC Induction Motor Fundamentals. Microchip Technology Inc.
Accessed: 10 October 2008,
http://www.industrialcontrols.eetchina.com/PDF/2007JUL/ICCOL_2007JUL12_IODR_TA_
02.pdf?SOURCE=DOWNLOAD
[10] Anon, nd., Step 2000 Ac Motors. Siemens.
Accessed: 26 September 2008,
http://www.iranfluidpower.com/pdf/e%20motors/ACM_1.pdf
Page 79
ENG450 ENGINEERING INTERNSHIP
MURDOCH UNIVERSITY AUSENCO SCHOOL OF ENGINEERING AND ENERGY
Page 69 of 79 David Stewart 12005178
[11] Anon (1991). AS3851 - The calculation of short-circuit currents in three-phase a.c.
systems. Standards Australia
[12] Anon (1998). AS3008.1.1. – Electrical Installation – Selection of Cables. Part 1.1:
Cables for alternating voltages up to and including 0.6/1kV – Typical Australian
installation conditions. Standards Australia / Standards New Zealand
[13] Anon (2007). AS3000 – Wiring Rules. Standards Australia / Standards New Zealand