20
An Introduction to Logistic and Probit Regression Models Chelsea Moore
An Introduction to Logistic and Probit Regression Models Chelsea Moore
Goals
• Brief overview of logistic and probit models
• Example in Stata
• Interpretation within & between models

Binary Outcome
• Examples:
• Yes/No
• Success/Failure
• Heart Attack/No Heart Attack
• In/Out of the Labor Force

Modeling a Binary Outcome
• Latent Variable Approach • We can think of y* as the underlying latent propensity that
y=1 • Example 1: For the binary variable, heart attack/no heart
attack, y* is the propensity for a heart attack. • Example 2: For the binary variable, in/out of the labor force, y*
is the propensity to be in the labor force.
𝑦𝑦∗ = 𝛼𝛼 + 𝛽𝛽𝛽𝛽 + 𝜀𝜀
Where τ is the threshold
yi =10
ifif
yi* > τ
yi* ≤ τ
Logit versus Probit
• Since y* is unobserved, we use do not know the distribution of the errors, ε
• In order to use maximum likelihood estimation (ML), we need to make some assumption about the distribution of the errors.
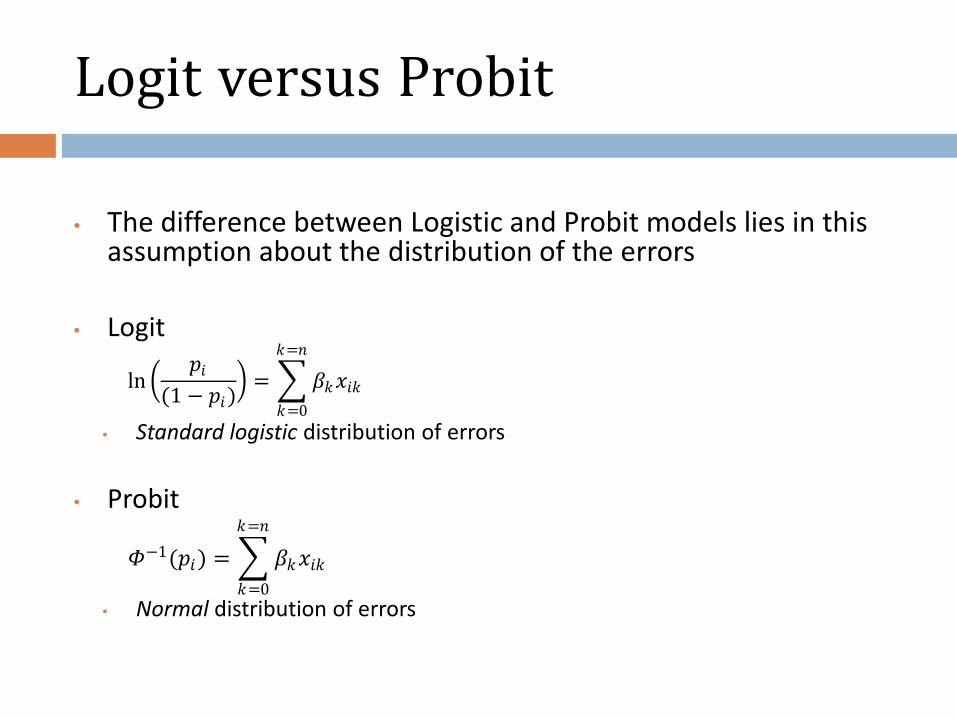
Logit versus Probit • The difference between Logistic and Probit models lies in this
assumption about the distribution of the errors • Logit
• Standard logistic distribution of errors
• Probit
• Normal distribution of errors
ln �𝑝𝑝𝑖𝑖
(1 − 𝑝𝑝𝑖𝑖)� = �𝛽𝛽𝑘𝑘𝛽𝛽𝑖𝑖𝑘𝑘
𝑘𝑘=𝑛𝑛
𝑘𝑘=0
𝛷𝛷−1(𝑝𝑝𝑖𝑖) = �𝛽𝛽𝑘𝑘𝛽𝛽𝑖𝑖𝑘𝑘
𝑘𝑘=𝑛𝑛
𝑘𝑘=0

Source: Park (2010)
Probability Density Function (PDF)and Cumulative Distribution Function (CDF)
Which to choose?
• Results tend to be very similar
• Preference for one over the other tends to vary by discipline
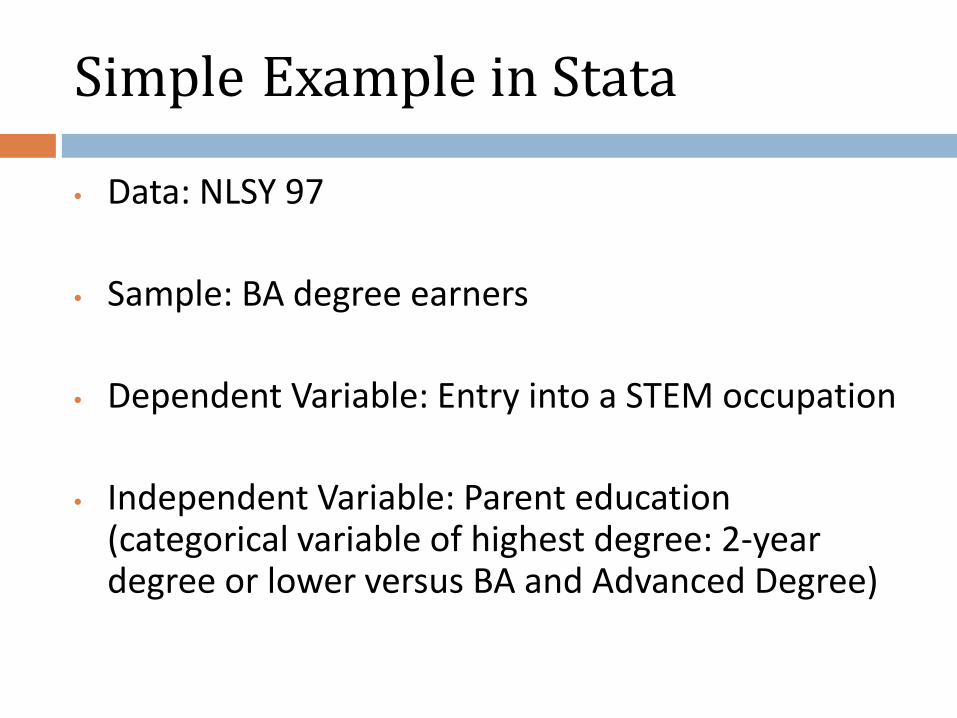
Simple Example in Stata
• Data: NLSY 97
• Sample: BA degree earners
• Dependent Variable: Entry into a STEM occupation
• Independent Variable: Parent education (categorical variable of highest degree: 2-year degree or lower versus BA and Advanced Degree)
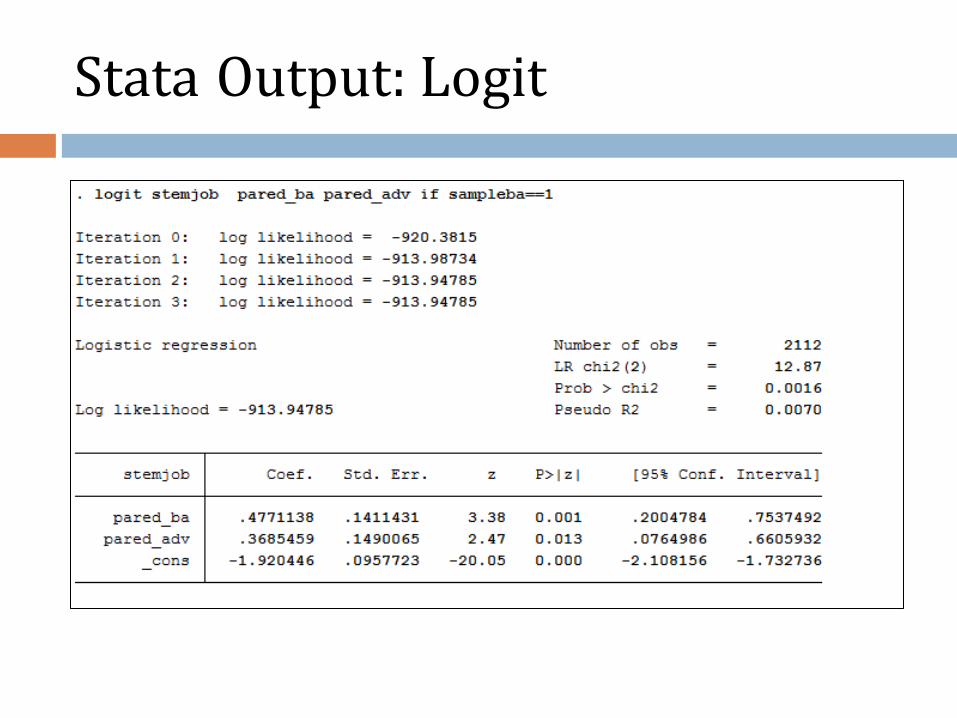
Stata Output: Logit
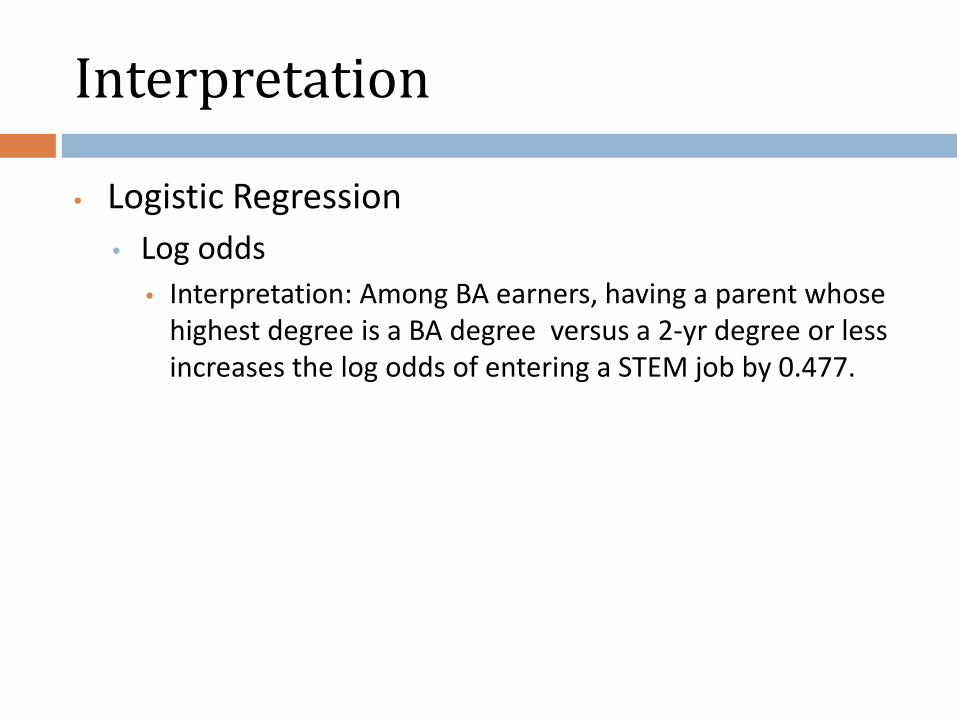
Interpretation
• Logistic Regression • Log odds
• Interpretation: Among BA earners, having a parent whose highest degree is a BA degree versus a 2-yr degree or less increases the log odds of entering a STEM job by 0.477.
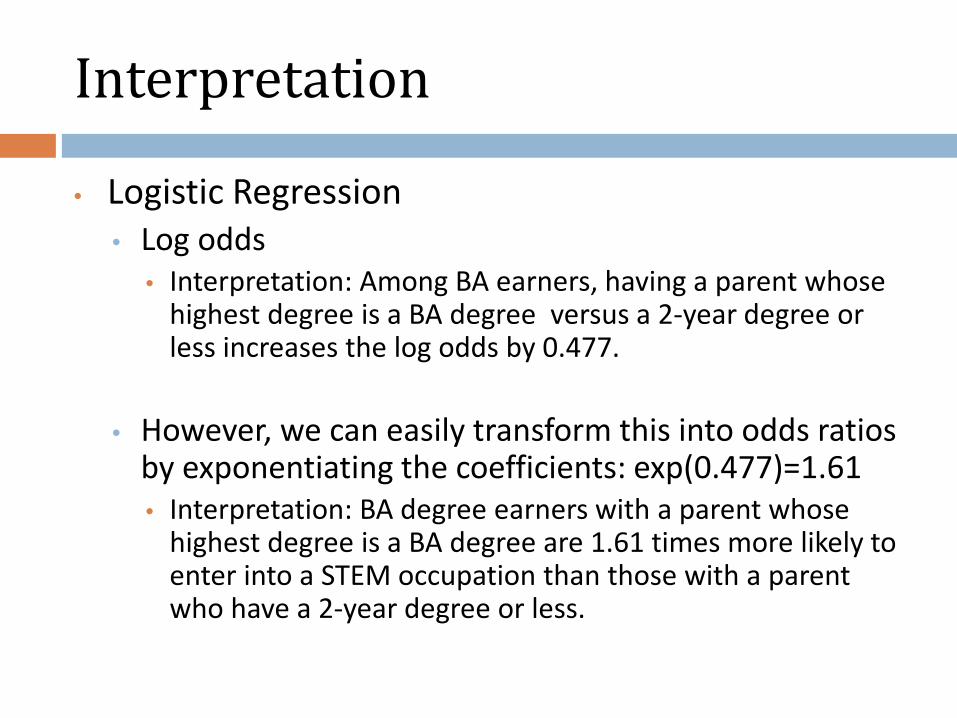
Interpretation
• Logistic Regression • Log odds
• Interpretation: Among BA earners, having a parent whose highest degree is a BA degree versus a 2-year degree or less increases the log odds by 0.477.
• However, we can easily transform this into odds ratios by exponentiating the coefficients: exp(0.477)=1.61 • Interpretation: BA degree earners with a parent whose
highest degree is a BA degree are 1.61 times more likely to enter into a STEM occupation than those with a parent who have a 2-year degree or less.
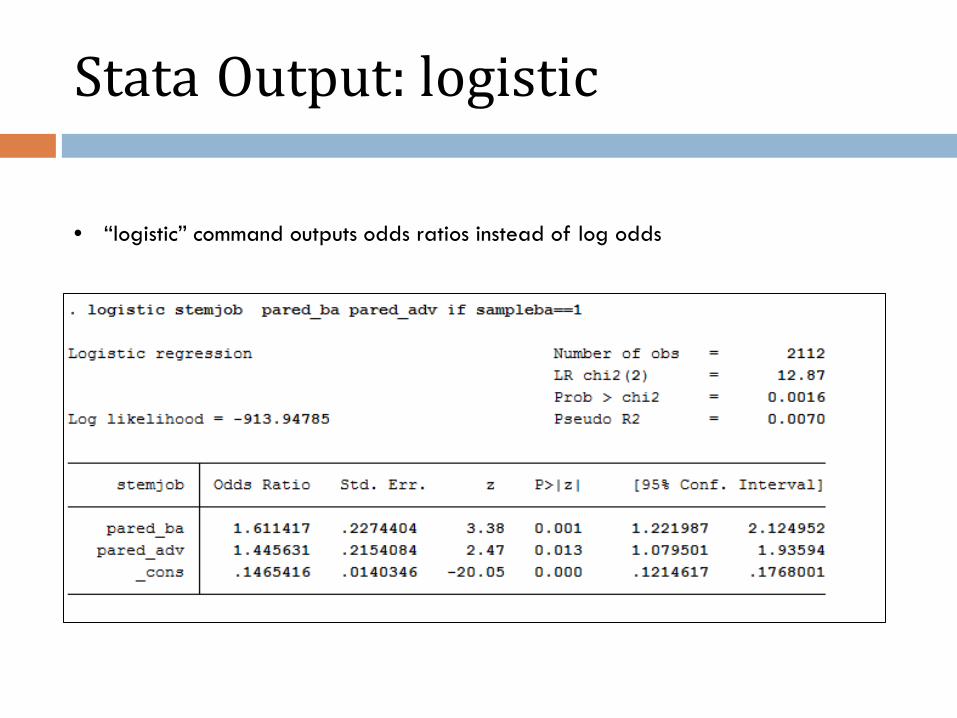
Stata Output: logistic
• “logistic” command outputs odds ratios instead of log odds
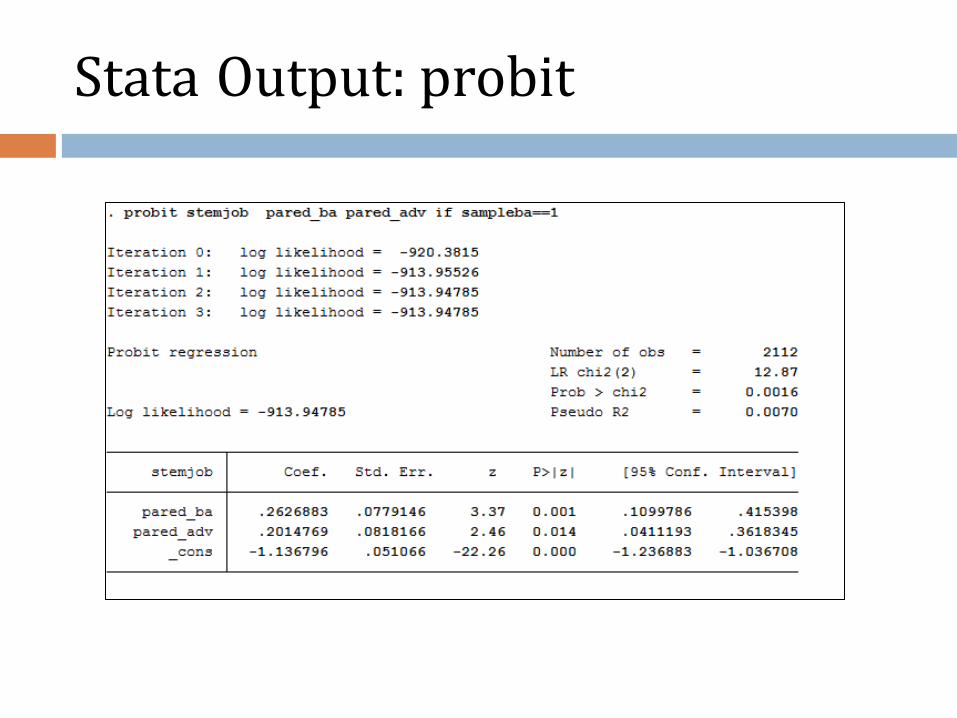
Stata Output: probit
Interpretation
• Probit Regression • Z-scores
• Interpretation: Among BA earners, having a parent whose highest degree is a BA degree versus a 2-year degree or less increases the z-score by 0.263.
• Researchers often report the marginal effect, which is the change in y* for each unit change in x.
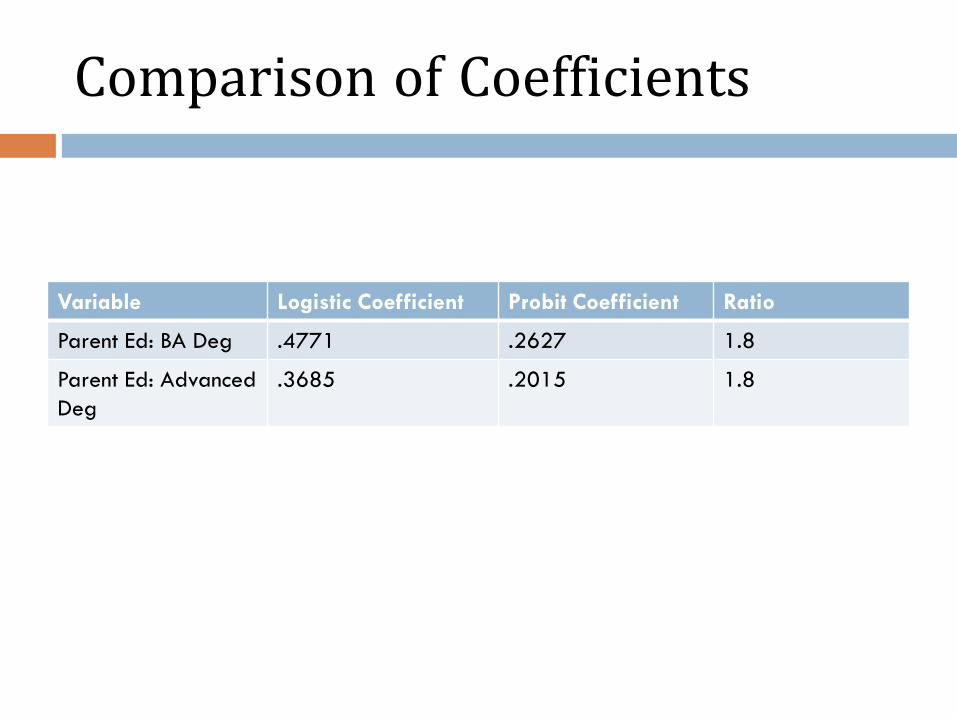
Comparison of Coefficients
Variable Logistic Coefficient Probit Coefficient Ratio
Parent Ed: BA Deg .4771 .2627 1.8
Parent Ed: Advanced Deg
.3685 .2015 1.8
Comparing Across Models
• It can be misleading to compare coefficients across models because the variance of the underlying latent variable (y*) is not identified and can differ across models.

Some Possible Solutions to this Problem:
• Predicted Probabilities • Gives predicted values at substantively meaningful values of xk
• y*-standardized coefficients • Bk
sy* gives the standard deviation increase in y* given a one unit increase in xk,, holding all other variables constant.
• Fully standardized coefficients • Bk
s gives the standard deviation increase in in y*, given a one standard deviation increase in xk, holding all other variables constant.
• Marginal effects • The slope of the probability curve relating x to Pr(y=1|x), holding
all other variables constant
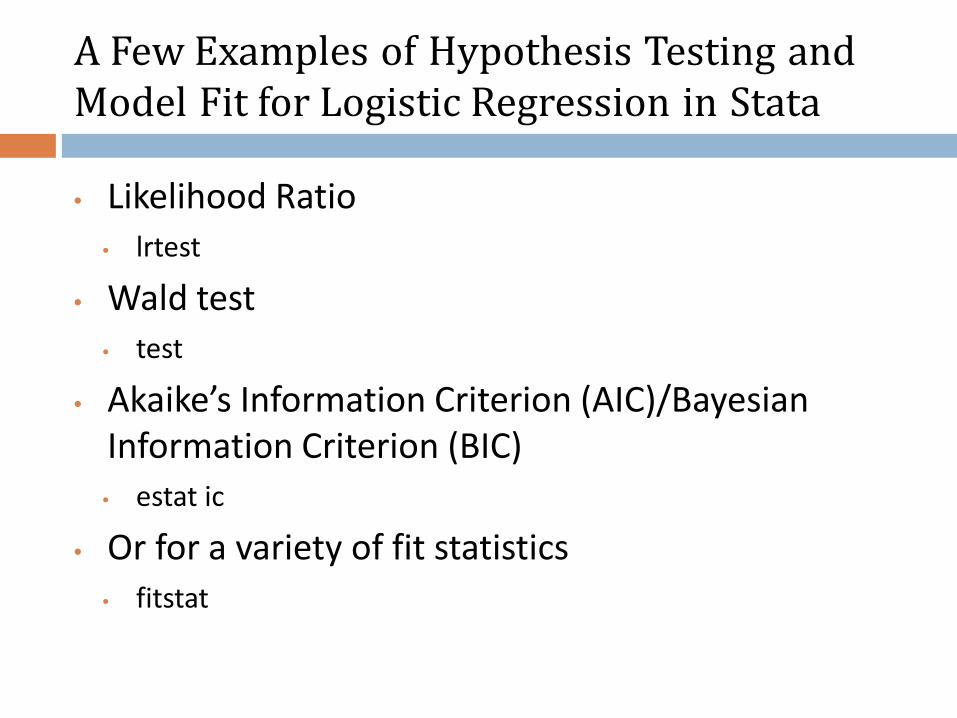
A Few Examples of Hypothesis Testing and Model Fit for Logistic Regression in Stata
• Likelihood Ratio • lrtest
• Wald test • test
• Akaike’s Information Criterion (AIC)/Bayesian Information Criterion (BIC) • estat ic
• Or for a variety of fit statistics • fitstat
References
• Agresti, Alan. An introduction to categorical data analysis. Vol. 423. Wiley-Interscience, 2007.
• Long, J. Scott. Regression models for categorical and limited dependent variables. Vol. 7. Sage, 1997.
• Powers, D., and Y. Xie. "Statistical method for categorical data analysis Academic Press." San Deigo, CA (2000).


![CURVILINEAR EFFECTS IN LOGISTIC REGRESSION · Curvilinear Effects in Logistic Regression – –203 [note we cover probit regression in Chapter 9]), one assumes the relation-ship](https://static.documents.pub/doc/80x56/5f7f674a23f789499665e7f2/curvilinear-effects-in-logistic-regression-curvilinear-effects-in-logistic-regression.jpg)

![Day 4 [03 Sept€¦ · Web view2012/03/04 · GENMOD – generalized linear models LOGISTIC – [grouped] binary regression PROBIT – [grouped] binary regression (INVERSECL) CATMOD](https://static.documents.pub/doc/80x56/5f6460262813764a924bb395/day-4-03-web-view-20120304-genmod-a-generalized-linear-models-logistic-a.jpg)


