27
An Introduction to Pathway Enrichment Analysis Lei Kong, Ph.D.
An Introduction to Pathway Enrichment Analysis
Lei Kong, Ph.D.
What is Pathway ?
• Wikipedia:
• Genetic pathway - a group of interacting genes
• Metabolic pathway - a series of cellular chemical reactions
• Signalling pathway - a series of interactions to affect gene expression
• In summary, a pathway has a set of genes related to a specific biological
function and describes the relationships between the genes.
KEGG Pathway Database
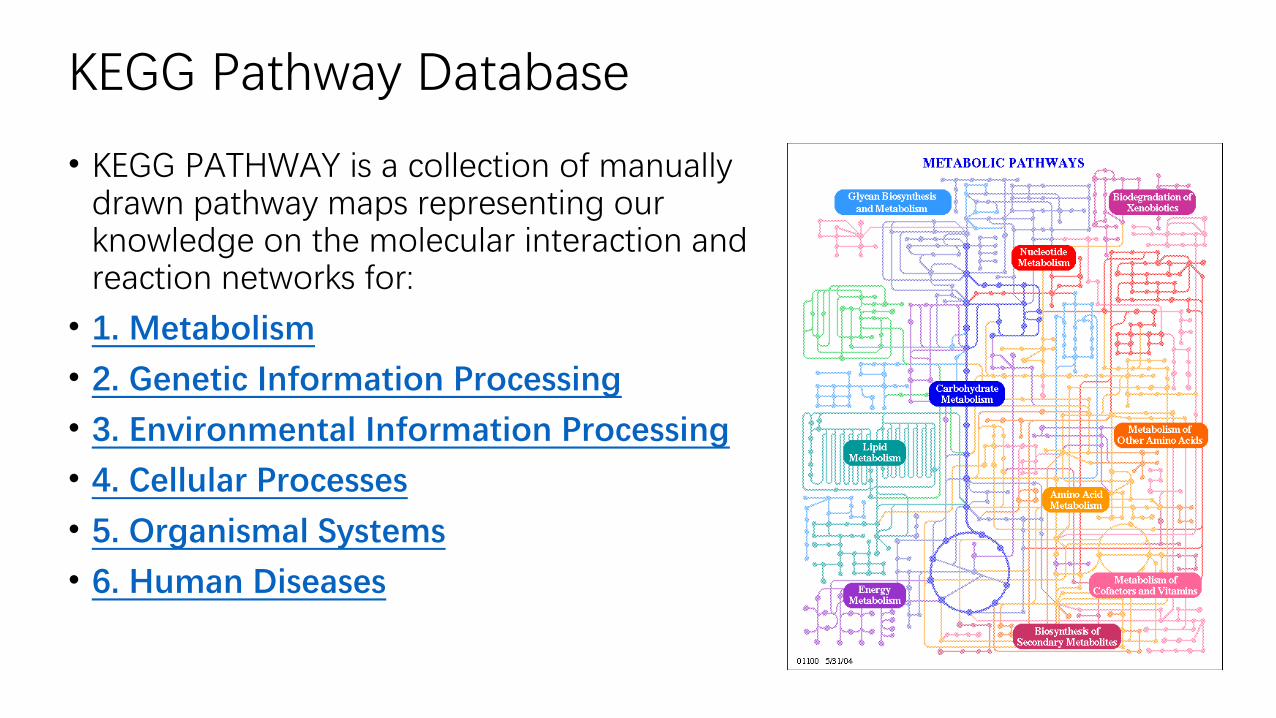
• KEGG PATHWAY is a collection of manually drawn pathway maps representing our knowledge on the molecular interaction and reaction networks for:
• 1. Metabolism
• 2. Genetic Information Processing
• 3. Environmental Information Processing
• 4. Cellular Processes
• 5. Organismal Systems
• 6. Human Diseases
What is Pathway Enrichment Analysis
• The aim is to give a number (score, p-value) to a pathway
• Compared to other pathways, are there more genes in the pathway
differentially expressed (up-regulated/downregulated) ?
• Can we give a number (p-value) to the probability of observing these
changes just by chance?
Pathway and Gene Set Analysis of Microarray Data, Claus-D. Mayer, Biomathematics & Statistics Scotland (BioSS)
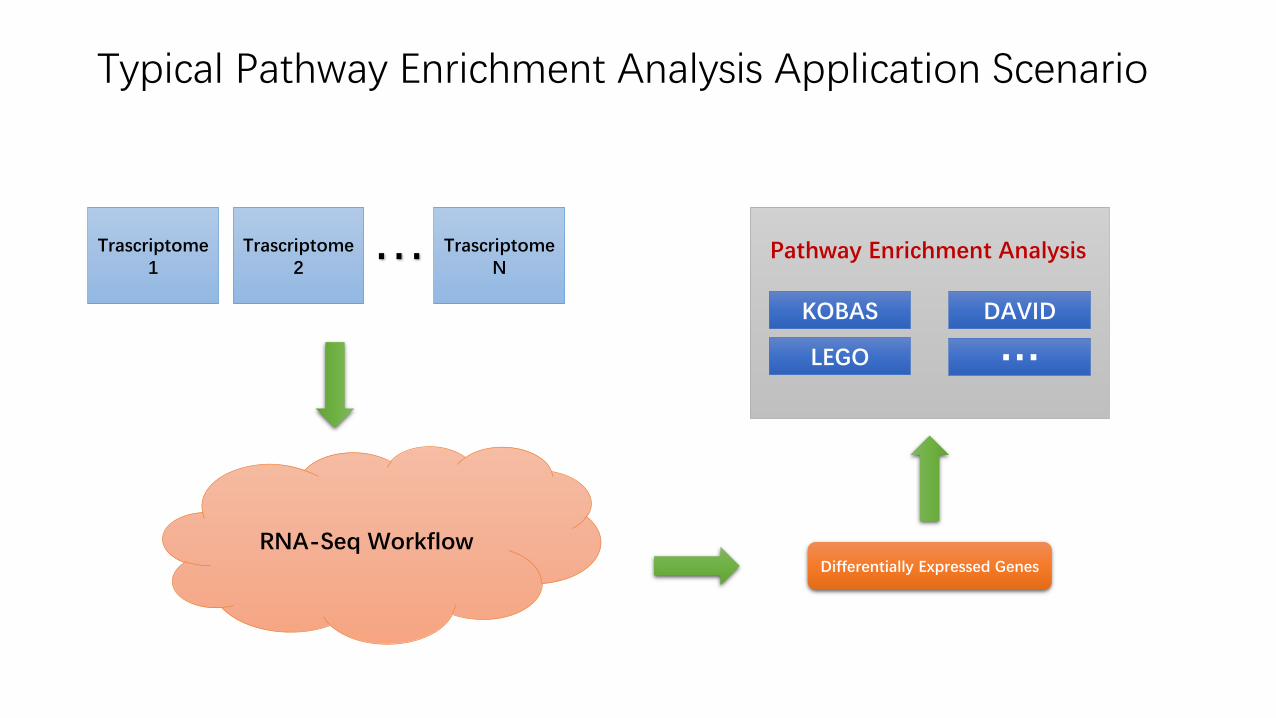
Differentially Expressed Genes
KOBAS DAVID
LEGO …
Pathway Enrichment Analysis
Typical Pathway Enrichment Analysis Application Scenario
Trascriptome1
Trascriptome2
TrascriptomeN…
RNA-Seq Workflow
Phenotypes & Diseases
Annotated to Pathway
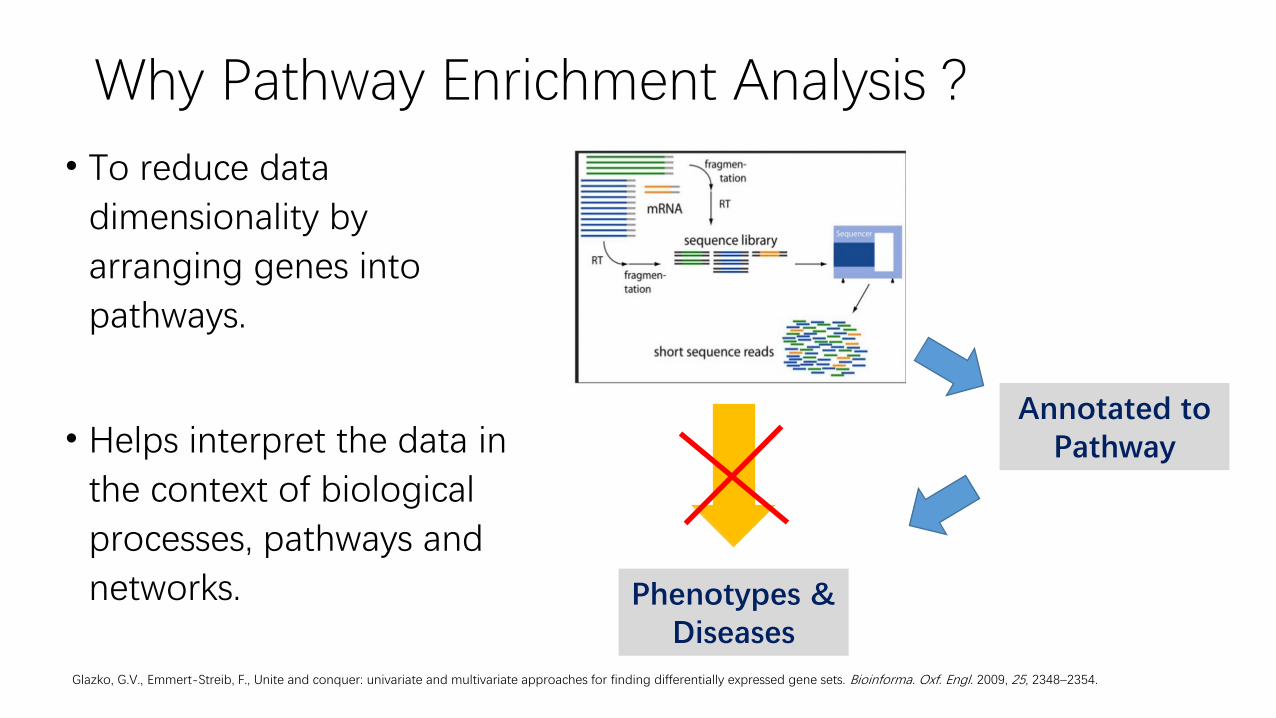
Glazko, G.V., Emmert-Streib, F., Unite and conquer: univariate and multivariate approaches for finding differentially expressed gene sets. Bioinforma. Oxf. Engl. 2009, 25, 2348–2354.
Why Pathway Enrichment Analysis ?
• To reduce data
dimensionality by
arranging genes into
pathways.
• Helps interpret the data in
the context of biological
processes, pathways and
networks.
Basic Assumption
• Genes involved in the same biological processes, functions, or localizations present correlated behaviors in terms of expression levels, signal intensities, allele occurrences, and so on.
•
• We can therefore apply statistical tests to find perturbed pathways.
Methods Mol Biol. 2013;939:201-13. doi: 10.1007/978-1-62703-107-3_13. Gene Set/Pathway enrichment analysis. Hung JH.
Overview of existing pathway analysis methods• Pathway analysis has become the first choice for gaining insight
into the underlying biology of differentially expressed genes and proteins, as it reduces complexity and has increased explanatory power.

Khatri P, Sirota M, Butte AJ (2012) Ten Years of Pathway Analysis: Current Approaches and Outstanding Challenges. PLoS Comput Biol8(2): e1002375. doi:10.1371/journal.pcbi.1002375http://journals.plos.org/ploscompbiol/article?id=info:doi/10.1371/journal.pcbi.1002375
Overview of existing pathway analysis methods
First Generation: Over-Representation Analysis (ORA) Approaches• First, an input gene list is created using a certain threshold or
criteria.
• Then, for each pathway, input genes that are part of the pathway are counted.
• Next, every pathway is tested for over- or under-representation in the list of input genes.
• The most commonly used tests are based on the hypergeometric, chi-square, or binomial distribution.
Limitations of ORA• First, the different statistics used by ORA (e.g., hypergeometric
distribution, binomial distribution, chi-square distribution, etc.) are independent of the measured changes.• However, the information about the extent of regulation (e.g., fold-changes,
significance of a change, etc.) can be useful in assigning different weights to input genes
• Second, ORA typically uses only the most significant genes and discards the others.• With this method, marginally less significant genes (e.g., fold-change = 1.999
or p-value = 0.051) are missed, resulting in information loss.
• Third, by treating each gene equally, ORA assumes that each gene is independent of the other genes.• However, biology is a complex web of interactions between gene products that
constitute different pathways.
Second Generation: Functional Class Scoring (FCS) Approaches• First, a gene-level statistic is computed using the molecular
measurements from an experiment.
• Second, the gene-level statistics for all genes in a pathway are aggregated into a single pathway-level statistic.
• The final step in FCS is assessing the statistical significance of the pathway-level statistic.
FCS methods address three limitations of ORA• First, they do not require an arbitrary threshold for dividing
expression data into significant and non-significant pools. Rather, FCS methods use all available molecular measurements for pathway analysis.
• Second, while ORA completely ignores molecular measurements when identifying significant pathways, FCS methods use this information in order to detect coordinated changes in the expression of genes in the same pathway.
• Finally, by considering the coordinated changes in gene expression, FCS methods account for dependence between genes in a pathway, which ORA does not.
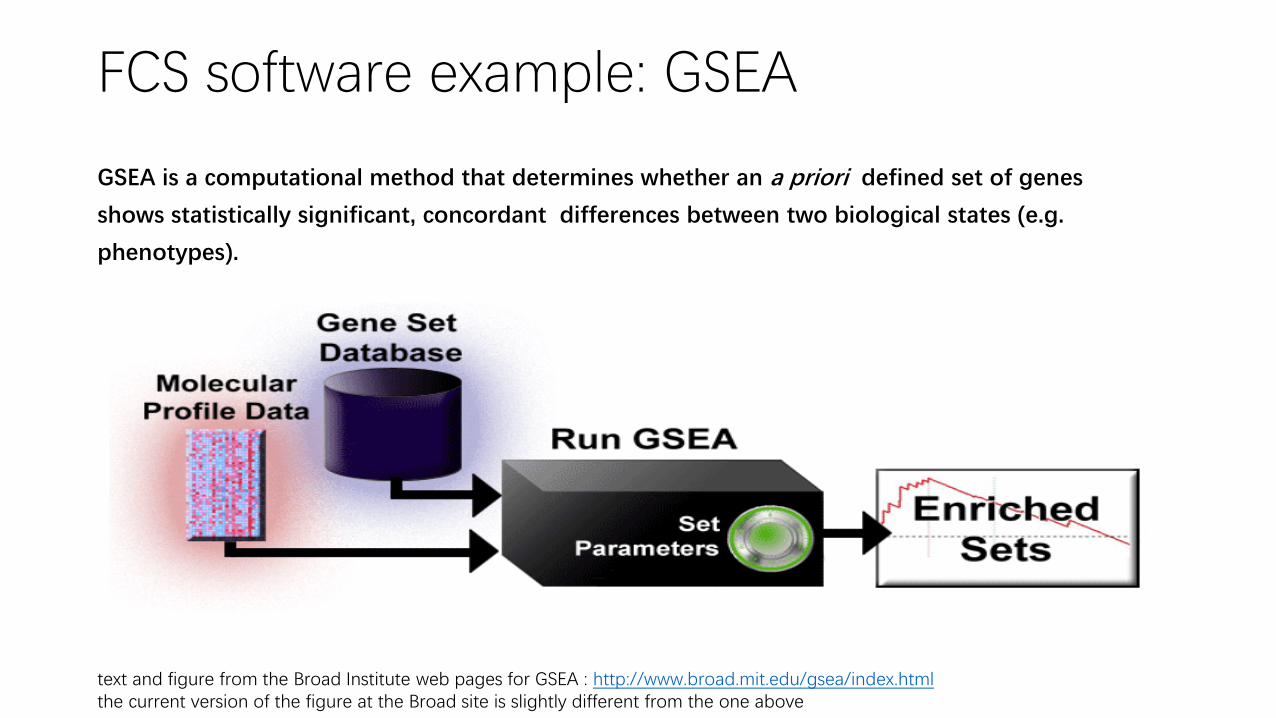
FCS software example: GSEA
GSEA is a computational method that determines whether an a priori defined set of genes
shows statistically significant, concordant differences between two biological states (e.g.
phenotypes).
text and figure from the Broad Institute web pages for GSEA : http://www.broad.mit.edu/gsea/index.htmlthe current version of the figure at the Broad site is slightly different from the one above
• BIOS6660 shRNAseq Gene Set Enrichment Analysis, Tzu L Phang, Robert Stearman, April 16, 2014
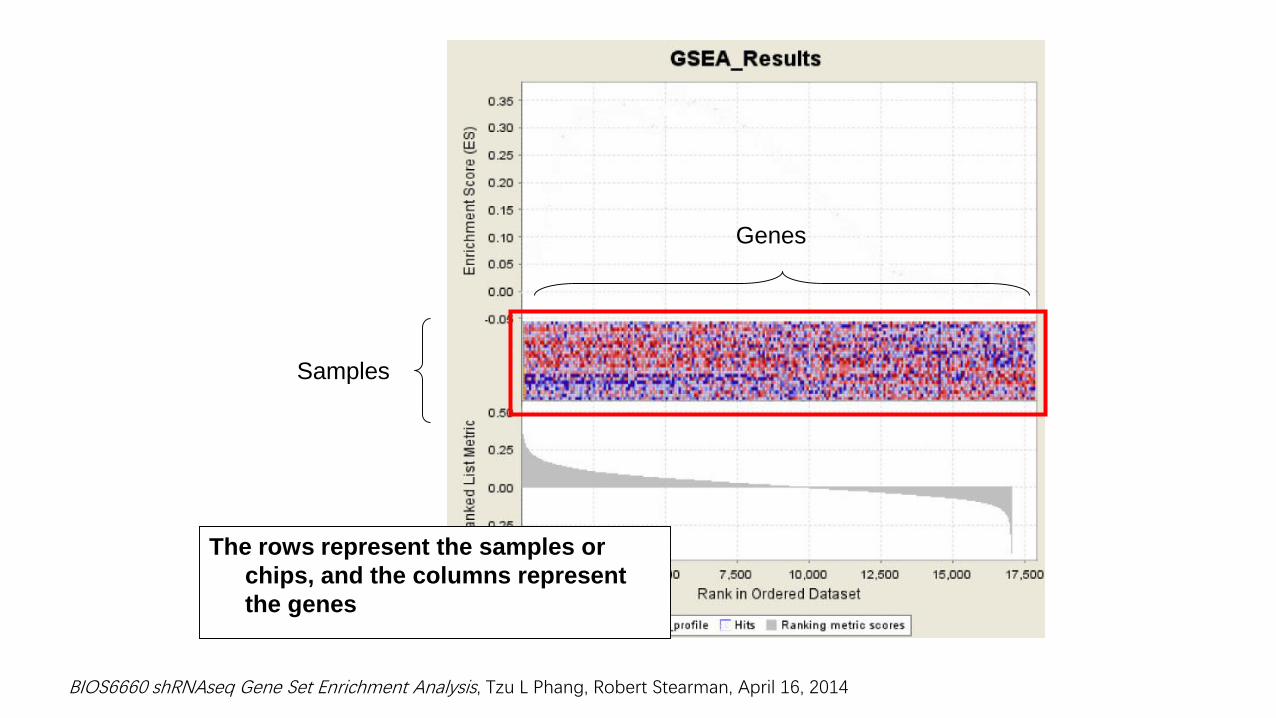
The rows represent the samples or
chips, and the columns represent
the genes
Samples
Genes
BIOS6660 shRNAseq Gene Set Enrichment Analysis, Tzu L Phang, Robert Stearman, April 16, 2014
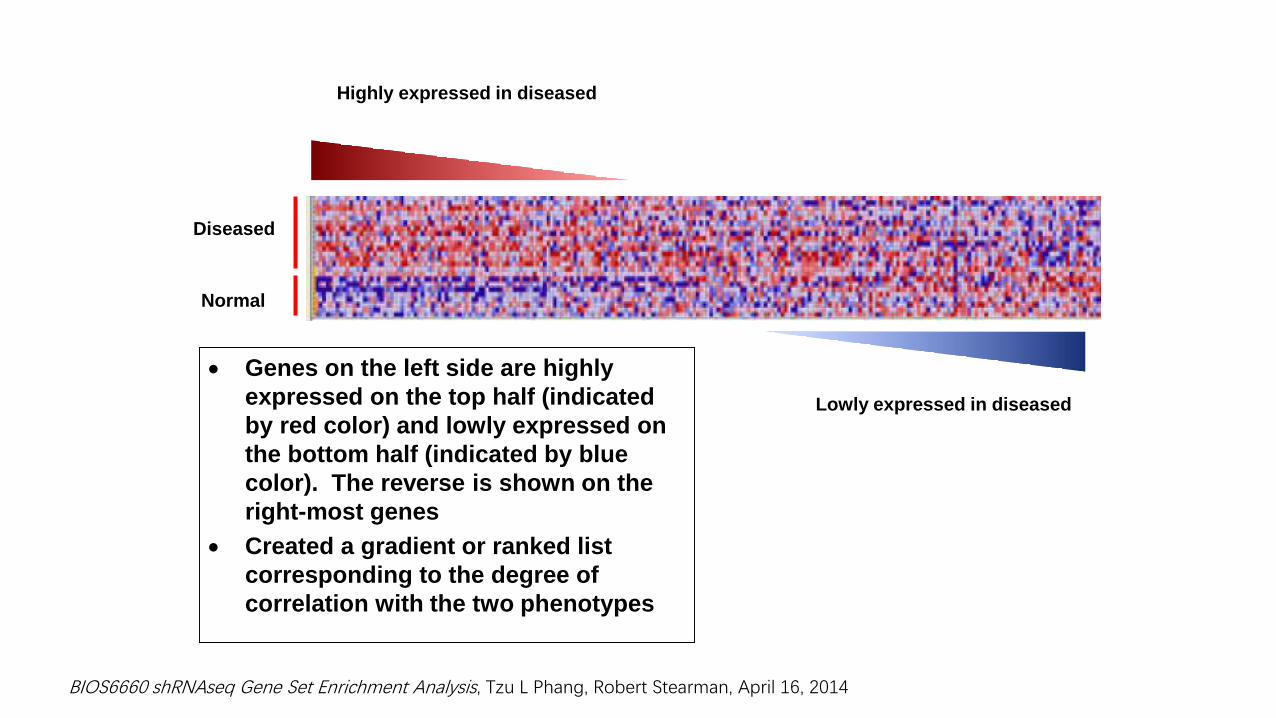
Genes on the left side are highly
expressed on the top half (indicated
by red color) and lowly expressed on
the bottom half (indicated by blue
color). The reverse is shown on the
right-most genes
Created a gradient or ranked list
corresponding to the degree of
correlation with the two phenotypes
Diseased
Normal
Highly expressed in diseased
Lowly expressed in diseased
BIOS6660 shRNAseq Gene Set Enrichment Analysis, Tzu L Phang, Robert Stearman, April 16, 2014
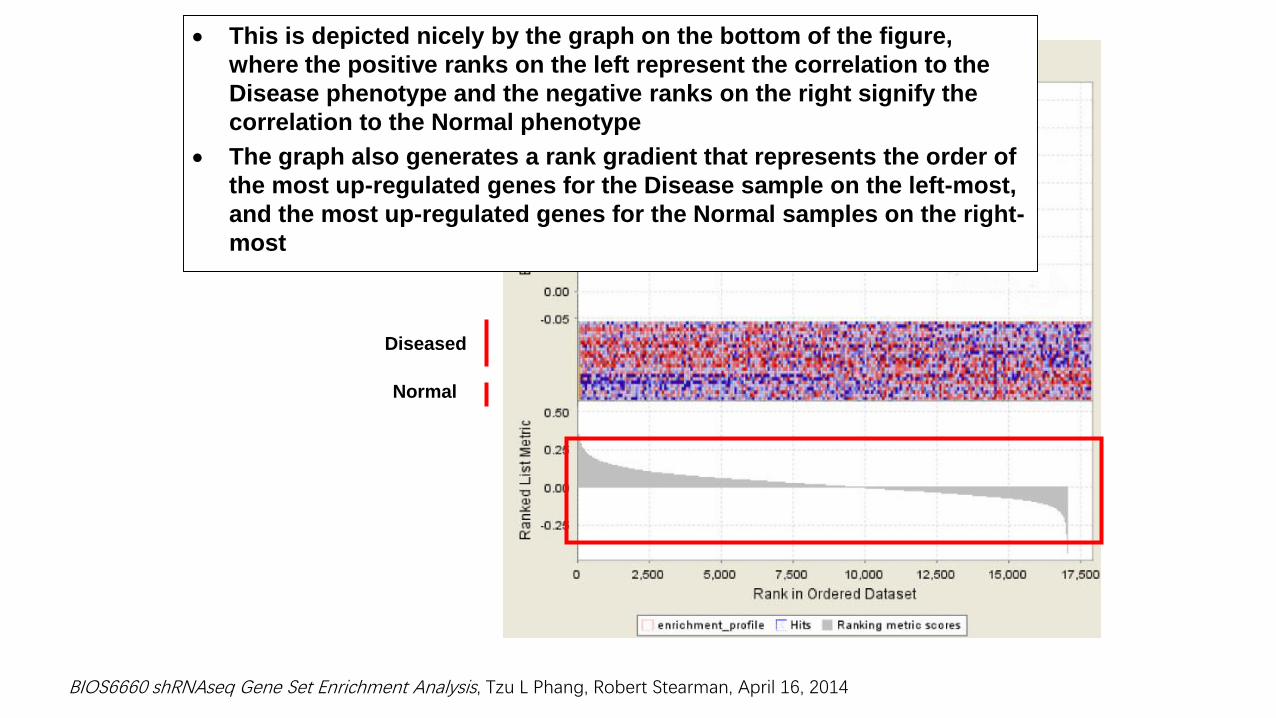
This is depicted nicely by the graph on the bottom of the figure,
where the positive ranks on the left represent the correlation to the
Disease phenotype and the negative ranks on the right signify the
correlation to the Normal phenotype
The graph also generates a rank gradient that represents the order of
the most up-regulated genes for the Disease sample on the left-most,
and the most up-regulated genes for the Normal samples on the right-
most
Diseased
Normal
BIOS6660 shRNAseq Gene Set Enrichment Analysis, Tzu L Phang, Robert Stearman, April 16, 2014
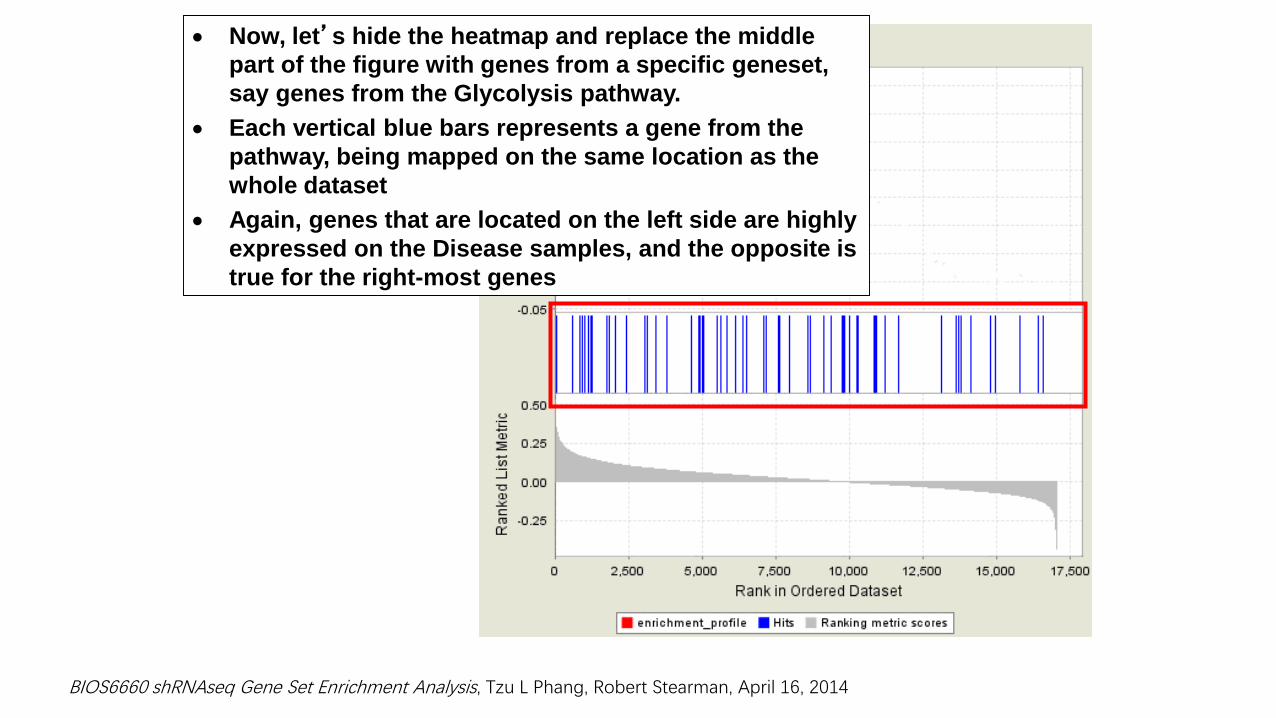
Now, let’s hide the heatmap and replace the middle
part of the figure with genes from a specific geneset,
say genes from the Glycolysis pathway.
Each vertical blue bars represents a gene from the
pathway, being mapped on the same location as the
whole dataset
Again, genes that are located on the left side are highly
expressed on the Disease samples, and the opposite is
true for the right-most genes
BIOS6660 shRNAseq Gene Set Enrichment Analysis, Tzu L Phang, Robert Stearman, April 16, 2014
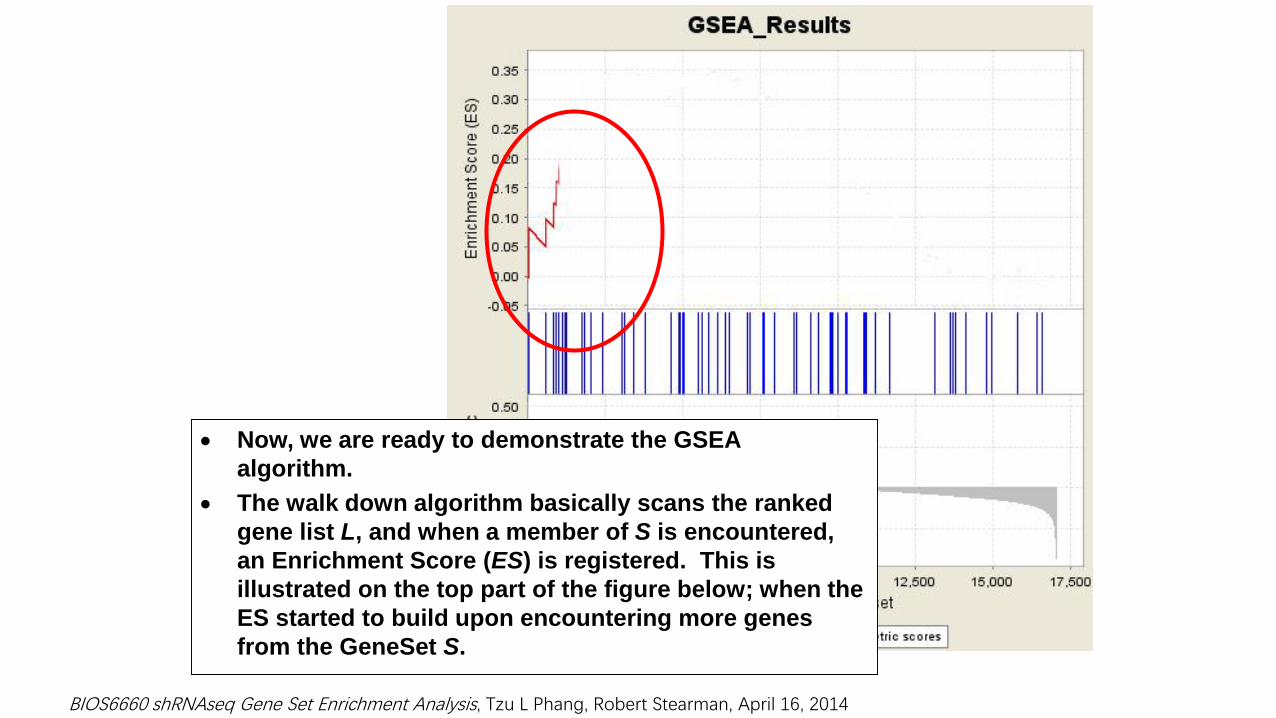
Now, we are ready to demonstrate the GSEA
algorithm.
The walk down algorithm basically scans the ranked
gene list L, and when a member of S is encountered,
an Enrichment Score (ES) is registered. This is
illustrated on the top part of the figure below; when the
ES started to build upon encountering more genes
from the GeneSet S.
BIOS6660 shRNAseq Gene Set Enrichment Analysis, Tzu L Phang, Robert Stearman, April 16, 2014
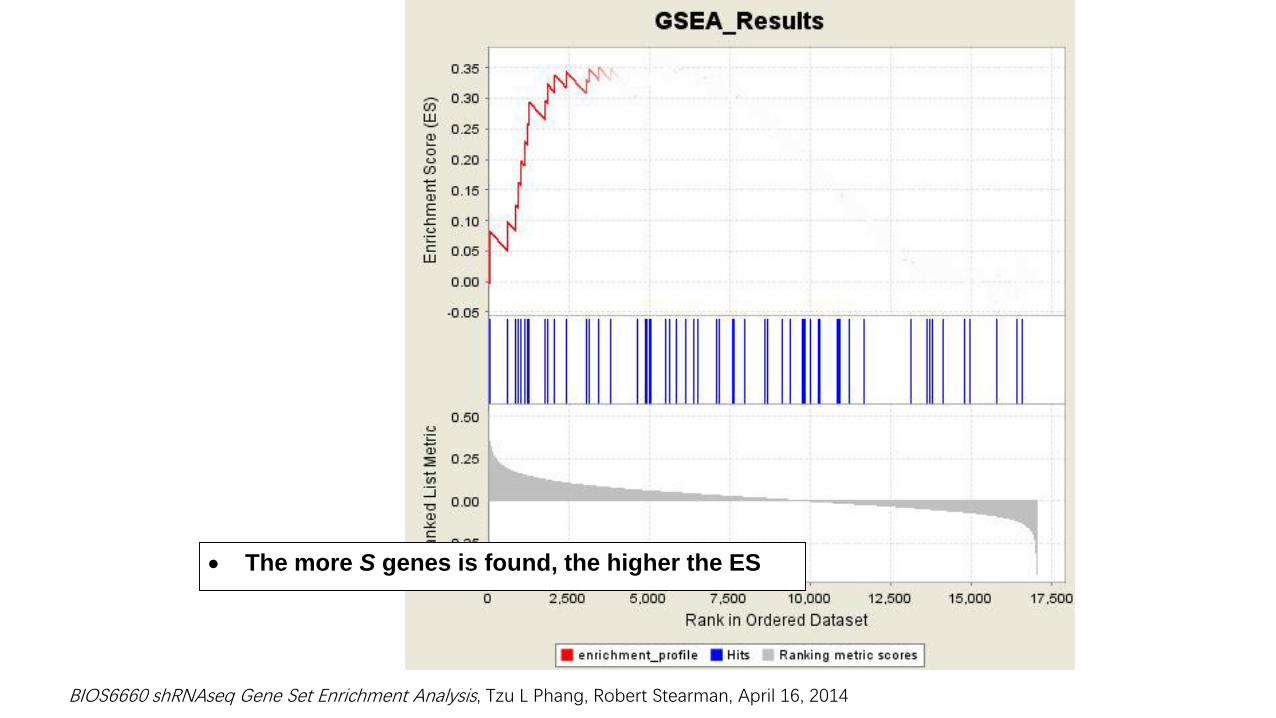
The more S genes is found, the higher the ES
BIOS6660 shRNAseq Gene Set Enrichment Analysis, Tzu L Phang, Robert Stearman, April 16, 2014
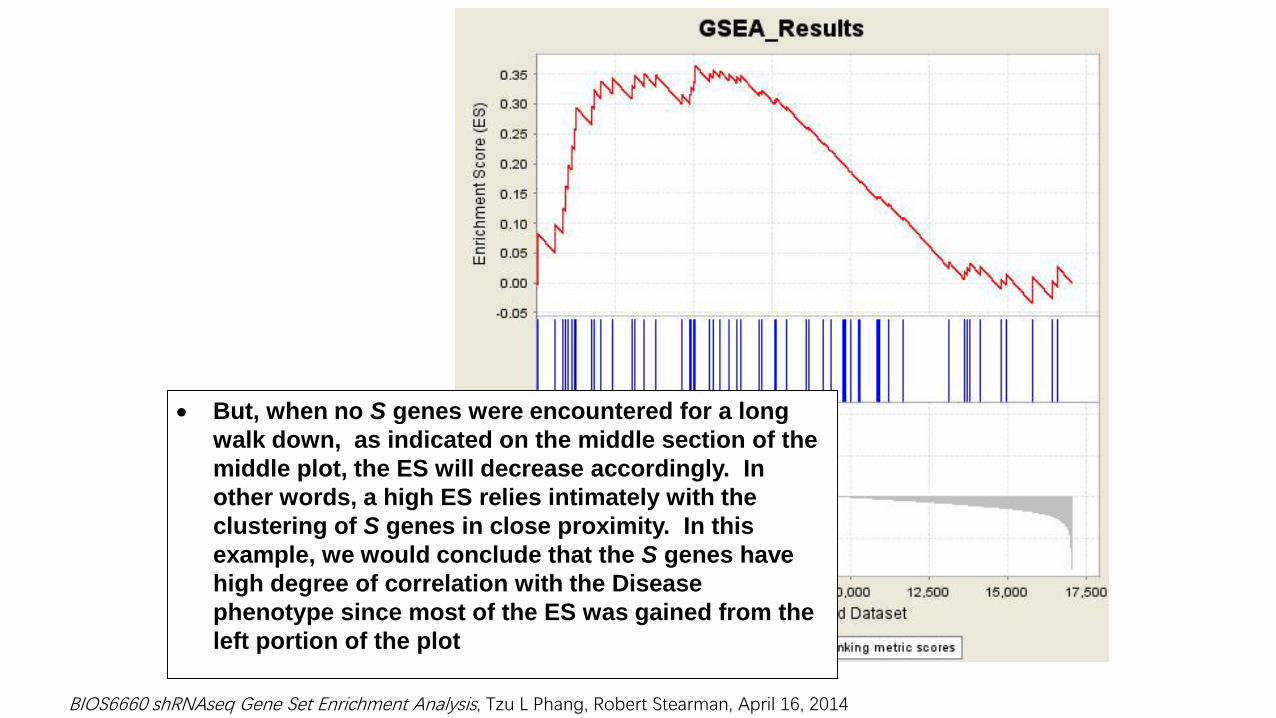
But, when no S genes were encountered for a long
walk down, as indicated on the middle section of the
middle plot, the ES will decrease accordingly. In
other words, a high ES relies intimately with the
clustering of S genes in close proximity. In this
example, we would conclude that the S genes have
high degree of correlation with the Disease
phenotype since most of the ES was gained from the
left portion of the plot
BIOS6660 shRNAseq Gene Set Enrichment Analysis, Tzu L Phang, Robert Stearman, April 16, 2014

GSEA References
Subramanian, A., Tamayo, P., Mootha, V. K., Mukherjee, S., Ebert, B. L., Gillette, M. A., Paulovich, A., Pomeroy, S. L., Golub, T. R., Lander, E. S. & Mesirov, J. P. (2005) Proc. Natl. Acad. Sci. USA 102, 15545-15550. Gene set enrichment analysis: A knowledge-based approach for interpreting genome-wide expression profiles
FCS Limitations• First, similar to ORA, FCS analyzes each pathway independently.
• Second, many FCS methods use changes in gene expression to rank genes in a given pathway, and discard the changes from further analysis.• For instance, assume that two genes in a pathway, A and B, are changing
by 2-fold and 20-fold, respectively. As long as they both have the same respective ranks in comparison with other genes in the pathway, most FCS methods will treat them equally, although the gene with the higher fold-change should probably get more weight.
• However, considering only the ranks of genes is also advantageous, as it is more robust to outliers.
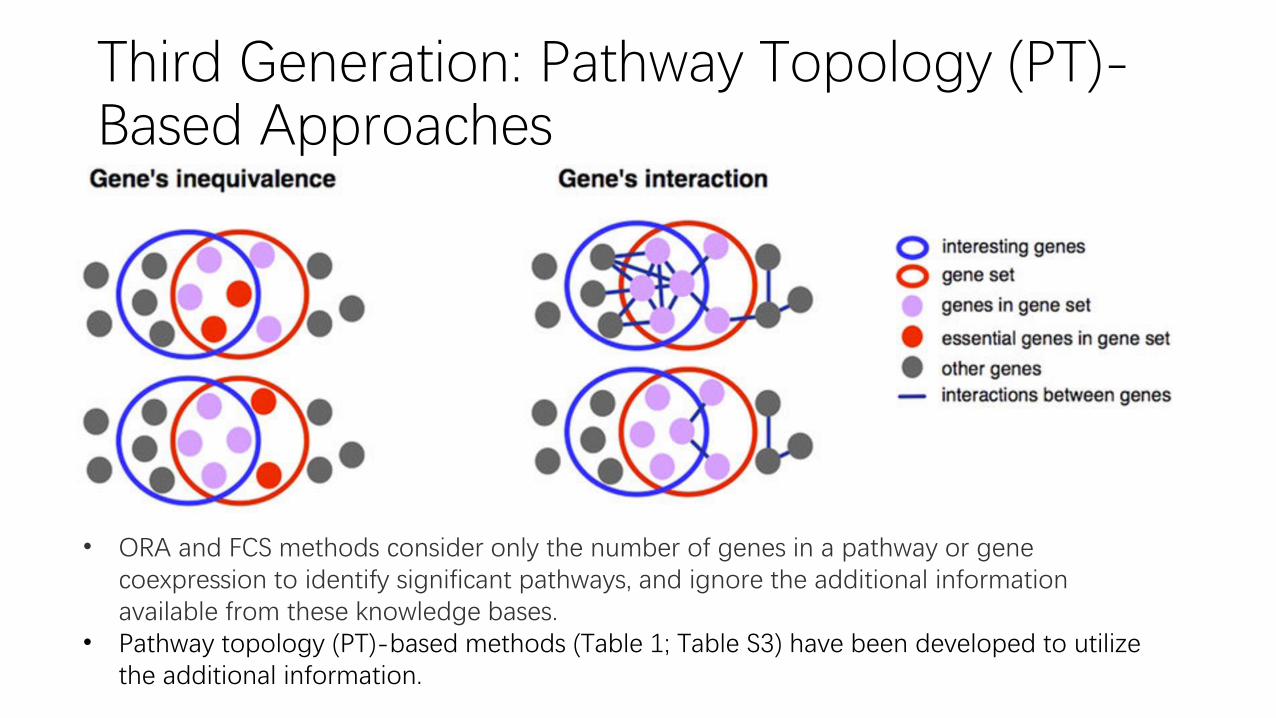
Third Generation: Pathway Topology (PT)-Based Approaches
• ORA and FCS methods consider only the number of genes in a pathway or gene coexpression to identify significant pathways, and ignore the additional information available from these knowledge bases.
• Pathway topology (PT)-based methods (Table 1; Table S3) have been developed to utilize the additional information.
Limitations
•True pathway topology is dependent on the type
of cell due to cell-specific gene expression profiles
and condition being studied. However, this
information is rarely available and is fragmented in
knowledge bases.
Thanks for Your Attention


