1 Pre-Conference Workshop at the Society for Prevention Research: Systems Science Methodologies for Prevention Research An Introduction to System Dynamics Kristen Hassmiller Lich, Ph.D., MHSA Assistant Professor Department of Health Policy and Management UNC – Chapel Hill, Gillings School of Global Public Health [email protected]With thanks to: Andrew Jones, at the Sustainability Institute, who provided a bunch of these slides (most of the entertaining ones!!!); www.sustainabilityinstitute.org
Transcript
1
Pre-Conference Workshop at the Society for Prevention Research: Systems Science Methodologies for Prevention Research
An Introduction to System Dynamics
Kristen Hassmiller Lich, Ph.D., MHSAAssistant Professor
Department of Health Policy and ManagementUNC – Chapel Hill, Gillings School of Global Public Health
• Complex problems (what and why)• System Dynamics (what and why)• The general approach• Key tools for building models
– Causal loop diagrams– Stock and flow models
• Conclusions and resources
• GOAL: To share my perspective on the value of System Dynamics and to teach you enough so that you can read more!
3
Complex problems
• Many of the problems we deal with today in public health and prevention are complex, not “owned” by a single stakeholder (each with differing perspectives and/or objectives), and can often seem completely overwhelming:
– How best can we alleviate the hypertension problem in Durham county, North Carolina?
– How should we invest as a nation to address diabetes? What are reasonable policy targets?
– Why can’t we get tuberculosis under control in India despite substantial investment and improvement in control efforts?
– How can current resources be used more effectively to provide mental health services locally?
– How can we reengineer our hospital system to better handle surges in demand following a disaster?
4
Complex problems
• There is a difference between detail complexity and dynamic complexity
• Dynamic complexity arises because of:– Dynamic behavior (things change over time)– Time delays between cause and effect
5
How Do You Cover Problems That Show Up So Gradually???
“Say, Thag . . . Wall of ice closer today?”
6
Complex problems
• There is a difference between detail complexity and dynamic complexity
• Dynamic complexity arises because of:– Dynamics (things change over time)– Time delays between cause and effect– Nonlinear relationships– Interactions– Feedback loops (x increases y, which
increases x…)– Emergence of often counterintuitive system
behavior
7
Tendency: Decompose and study…(Industrial Revolution to Today)
• “All complex systems, like the human body, the Earth’s atmosphere, Mozart’s Jupiter symphony, and Japan’s foreign policy, are better understood by slicing big things into small things. “ – Five Star Mind, by Tom Wujec, 1995
Thanks to Linda Booth Sweeney for pointing out this quote.
Hirsch GB, Levine R, and Miller RL (2007). Using system dynamics modeling to understand the impact of social change initiatives. Am J Community Psychol ; 39:239-253.
12
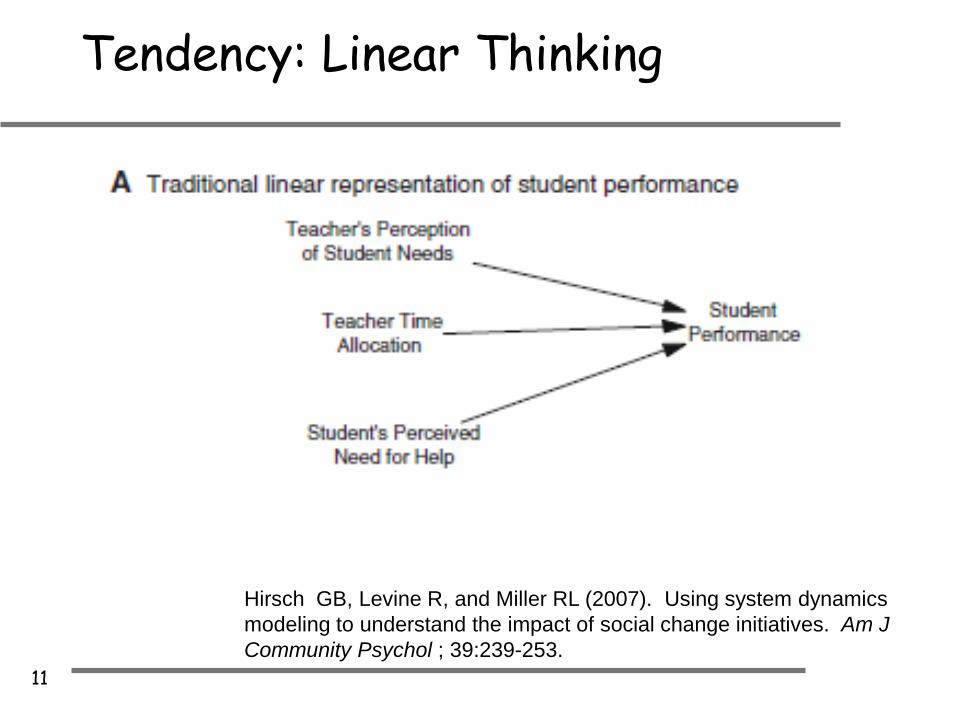
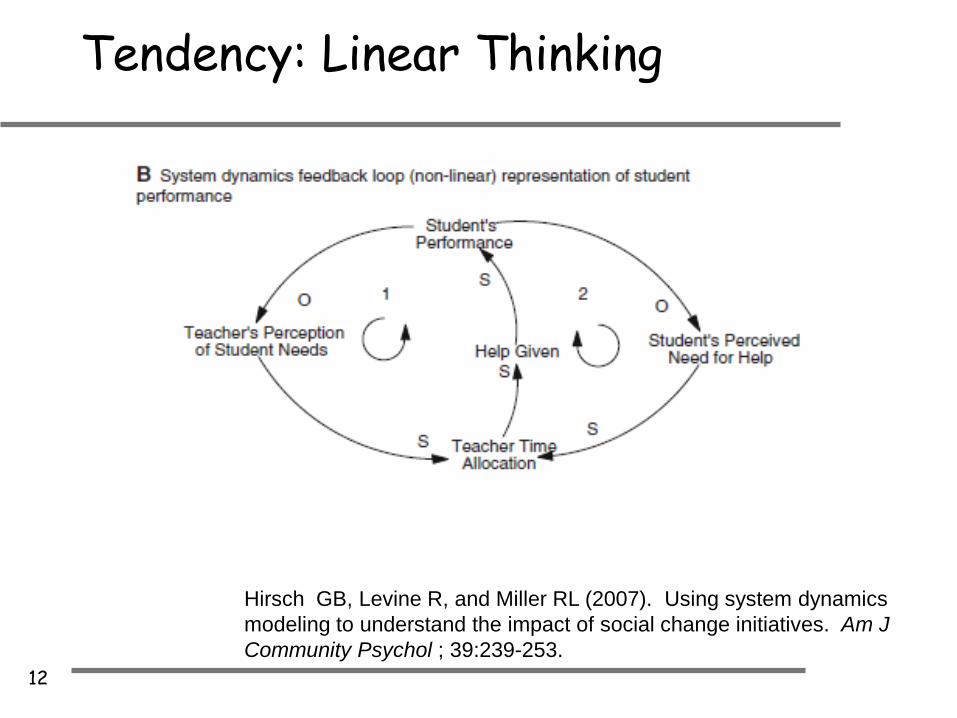
Tendency: Linear Thinking
Hirsch GB, Levine R, and Miller RL (2007). Using system dynamics modeling to understand the impact of social change initiatives. Am J Community Psychol ; 39:239-253.
13
The result…Sometimes the Cause of Problems Is Solutions
14
We Humans Have A Long History of Unintended Consequences
• Low tar and low nicotine cigarettes actually increase intake of carcinogens, CO, etc.
• Manufacturing -- Having employees who actively used the product made it more difficult to improve product quality.
• Paving dirt roads in mountain areas leads to decrease in safety; similarly, anti-lock brakes create safety decrease for some
• Fourth highest cause of death in U.S. is medical treatments• Despite widespread use of labor-saving devices, Americans have
less leisure today than 50 years ago• US policy of fire suppression has increased the size and strength
forest fires in many areas• Road building programs designed to reduce congestion have
increased traffic, delays, and pollution.
15
But We Have Begun to See That We Are the Source of Many of Our Own Problems
16
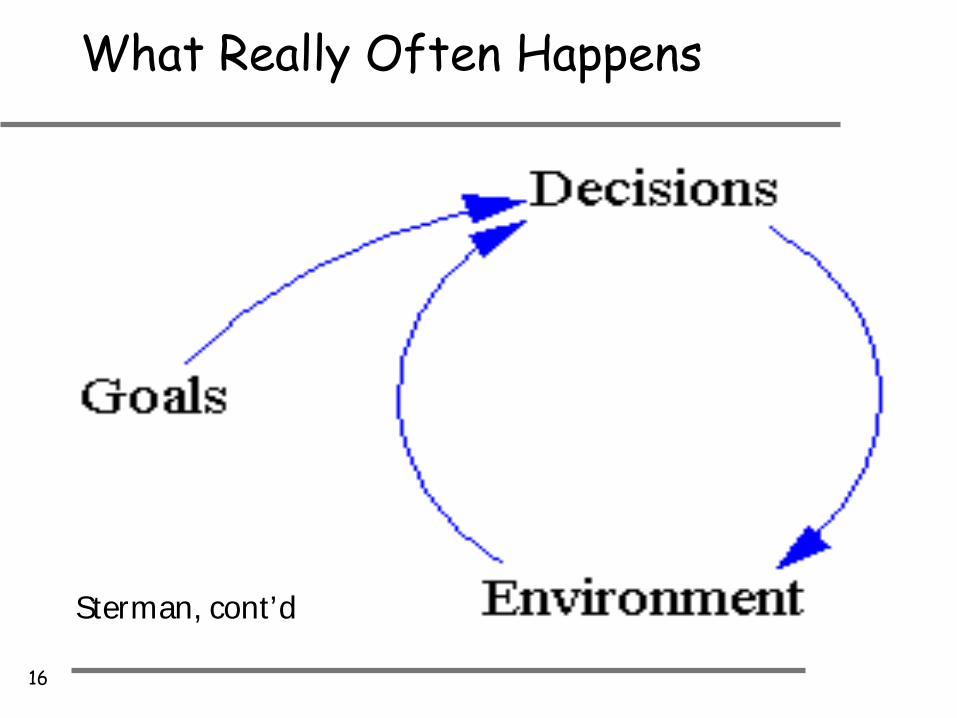
What Really Often Happens
Sterman, cont’d
17
What Really Often Happens…
Sterman, cont’d
18
Complex problems
• How can you get anywhere with so much complexity?
• How do you build a shared understanding?
• How do you get anyone to agree on a course of action?
• How do we improve anything in a timely manner?
19
System Dynamics Methods can help!
• System: – “A functional whole, composed of a set of components, coupled
together to function in a way that might not be apparent from the functioning of the separate component parts.
Levine and Fitzgerald, 1992
• System Dynamics is a set of methods to help us map and model dynamically complex systems -- to learn about why they behave the way they do and how to improve them.– Encourages a different way of thinking about system behavior– Two key “tools” -- causal loop diagrams and stock and flow models– Rich, standardized language to describe and conceptualize systems– 50+ years’ of work improving methods to involve stakeholders in model
building and utilization
20
General Approach…
1. Define ProblemWhat is happening over
time that we are concerned about?
• First be sure to identify your “client”
• Clearly articulate the problem you would like to focus on– What is the purpose of
building and studying a model?
– DO NOT focus on a symptom!– DO NOT model a whole
system, just because you can!
21
General Approach…
1. Define ProblemWhat is happening over
time that we are concerned about?
2. List FactorsWhat are important drivers? Write as
variables. Indicate any known direct causal
connections.
• Of particular interest is your “reference mode” -- variables you will focus on over time to characterize your problem
• Consider developing a model boundary chart:
22
General Approach…
1. Define ProblemWhat is happening over
time that we are concerned about?
2. List FactorsWhat are important drivers? Write as
variables. Indicate any known direct causal
connections.
3. Draw Reference ModeGraph behavior over time.
Any other factors needed to explain trends? Does the
pattern suggest any familiar structures?
23
General Approach…
1. Define ProblemWhat is happening over time that we are concerned about?
2. List FactorsWhat are important drivers? Write as variables. Indicate any known direct causal connections.
3. Draw Reference ModeGraph behavior over time. Any other factors needed to explain trends? Does the pattern suggest any familiar structures?
4. Build A Dynamic Hypothesis and System Map
This could be a causal loop diagram, a stock and flow model (or a combination of the two). In any case, it is a causal hypothesis about system behavior.
24
Causal Loop Diagrams Give a Language to Talk about Feedback and Make Our Assumptions Explicit
AWhen A increases, B will tendTo increase, all else equal. Or when A decreases B will tend to decrease, all else equal. They change in the same direction.
+B
Change in the SAME direction Change in the Opposite direction
A-
BWhen A increases, B will tend to decrease, all else equal. Or when A decreases B will tend to increase, all else equal” They move in the opposite direction.
Houses Residents Traffic+ + Reported
Desirablyof Community
Traffic- + New
Construction
We start by looking for important causal relationships
25
Parts of a “Feedback Loop Diagram”
1. Variable --Important factors in the systems. Can go up or
down.
2. Arrow -- Means one variable
affects the next one in some
direction, all else being equal.
4. Type of loop --R for reinforcing. B for balancing.
5. Name for the loop
3. Sign - “S” or “+”means the second variable
changes in the Same direction as the first.
“O” or “-” would mean the Opposite directionR
Word ofmouth
Investment in innovation
Positiveresults
Shared support for innovation
Awarenessof positive
results
++
++
26
A Feedback Loop That Builds On Itself Is Called a “Reinforcing Loop”
• They are also called positive feedback loops, virtuous cycles, vicious cycles, bandwagon effects, snowball effects Changing a variable in one direction
produces a response in the same direction of that variable.
Results
Effort allocated
Commitment to the innovation
+
+
+
R
Figure 1 in RepenningPositive loop of reinforcement
reinforcementRepenning, N. P., A Simulation-Based Approach to Understanding the Dynamics of Innovation Implementation. Organization Science. 13(2):109-127.
27
Behavior Over Time: Reinforcing Loops Are the Engines Behind Exponential Growth
REcon
GrowthEngine
Sawmillcapacity
Lumber productionReinvestment
Revenue
++
++
Lumber Production
0
500
1000
1500
2000
2500
1970 1980 1990 2000M
MB
FData: U.S. Census -- Lumber Prod. and Mill Stocks
• Reinforcing loops create growth, usually exponential growth. They give a system the potential for growth.
• The bigger something is, the faster it grows
28
More Than One Loop Can Intersect
Results
Effort allocated
Commitment to the innovation
+
+
+
R1
Figure 2 in RepenningThe diffusion process
Observation of the effort-results linkage by others+
+
R2
Reinforcement
Diffusion
29
Balancing Loops Seek Balance or Equilibrium
• Balancing loops are created when there are an odd number of negative links.
• Balancing loops move the system towards a goal. They counteract change.
Com
mitm
en to
in
nova
tion
Desired
Time
B1
Normative pressures
Commitment gap
Managers’ goal for commitment
Actual
Normative pressure from managers
Commitment to innovation
+
-
+
+
30
… and Balancing Loops Can Calibrate the System
Results
Effort allocated
Commitment to the innovation
+
+
+
R1
Figure 3 in RepenningExternal sources of commitment as a balancing loop
Observation of the effort-results linkage by others+
+
R2
Reinforcement
Diffusion
Commitment gap
Normative pressure from managers
-
Managers’ goal for commitment
+
++
B1Normative pressures
31
Delays Can Have Profound Effects on Feedback Loops
• Dampen feedback by weakening signal
Results
Effort allocated
Commitment to the innovation
+
+
+
R
Modified Figure 1 in RepenningPositive loop of reinforcement
reinforcement
32
Hints On Choosing Variables
• There is generally no final solution – no “right” number of variables
• How to pick which to include– Would the same basic dynamic exist if I took this
out?– Would people understand the sequence better if I
left it in?– Is this something I might be able to change?
33
Hints On Choosing Good Variable Names
• Use nouns or noun phrases– They can clearly go “up” or “down” -- it would work as an
indicator on a behavior over time graph– For example, “interest in surgery” not “people became more
interested in surgery” (which is a verb phrase)– “annual number of surgeries” not “more people got the
surgery”
• Use phrases with a clear sense of direction– E.g., “interest in surgery” not “attitude towards surgery”– “Positive word of mouth” not “word of mouth”
• If you have picked good names an observer will assign the same - and + signs that you do.
34
• Clouds represent factors outside our consideration at this point
Stock and Flow Diagrams
• Stocks represent accumulations and are generally measured in units (gallons, people, tons, etc.,)
• Flows change the level of stocks and must be measured in units per time (gallons/day, people/month, tons/year, etc.,) They often are verbs.
35
0
5
10
15
20
25
30
35
40
0 2 4 6 8 10 12 14 16 18 20 22 24 26 28 30M inute
Entering Leaving
Peop
le/M
inut
eACTIVITY: Sketch Out What Is Happening To The Stock Of People Over This 30-Minute Period
36
Examples of Stock/Flow Diagrams
People who areobese who do not do
vigorous physicalactivity
People who areobese who do
vigorous physicalactivity
Adopting physicalactivity routine
Dropping routine
37
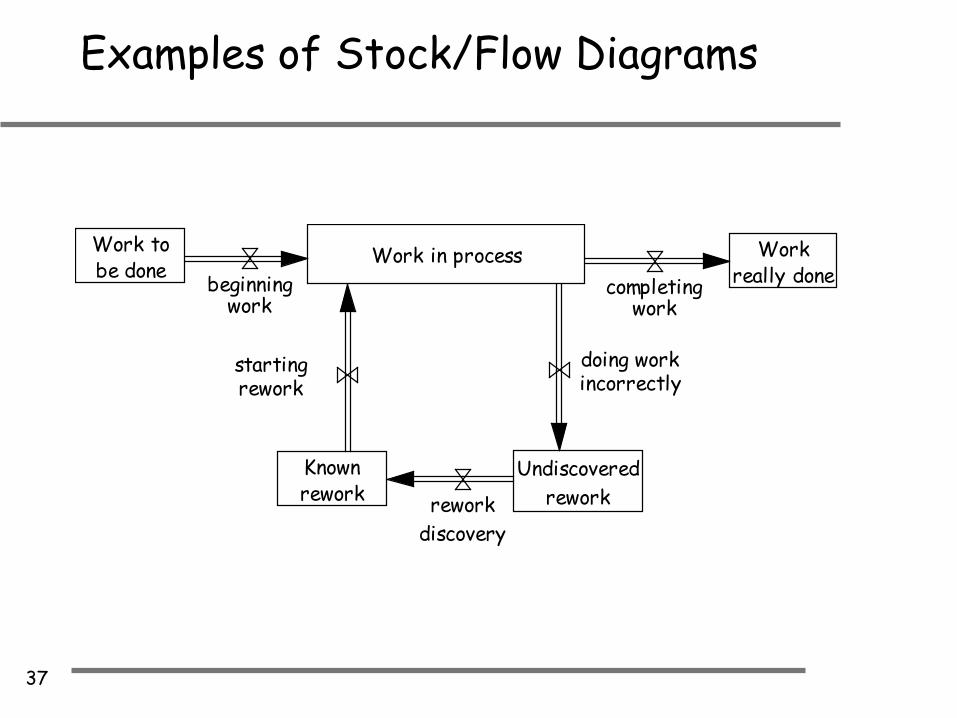
Examples of Stock/Flow Diagrams
Work tobe done
Workreally done
Undiscoveredrework
Knownrework rework
discovery
Work in processbeginning
workcompleting
work
doing workincorrectly
startingrework
38
Robust equation forms
CumulativeprogressProgress
Rockefeller Collegeof Public Affairs and Policy
University at AlbanyState University of New York
George Richardson
39
Causal mish-mash
CumulativeprogressProgress
WorkersHours per person
per day
Normal effectiveness(tasks/hour)
Effect ofmotivation
Effect ofschedulepressure
Effect of ...
Workweek(days)
Rockefeller Collegeof Public Affairs and Policy
University at AlbanyState University of New York
George Richardson
40
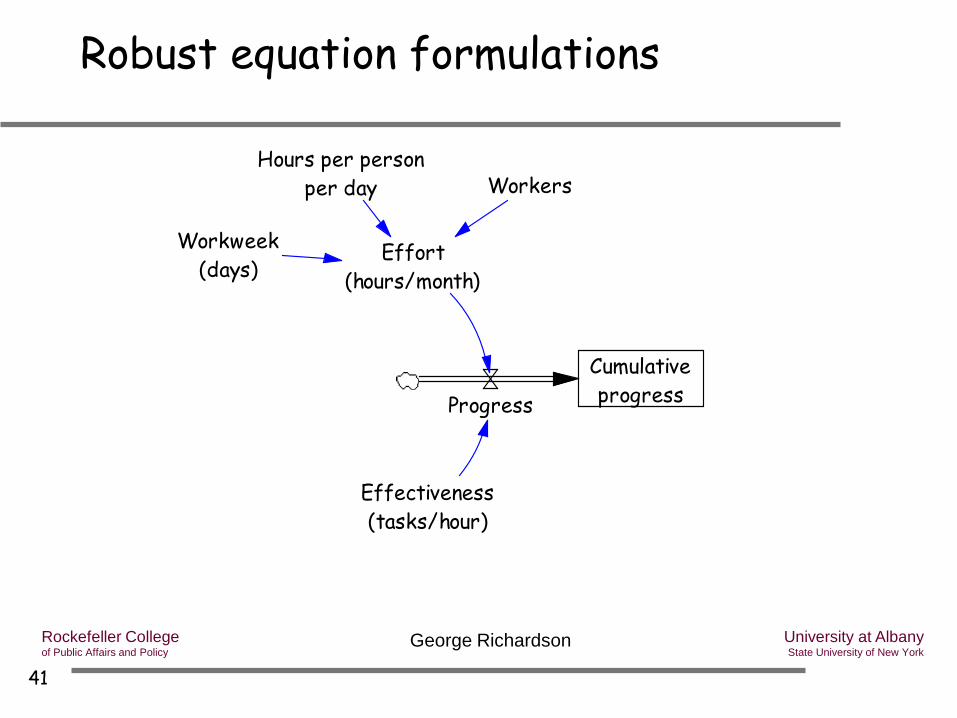
Robust equation formulations
CumulativeprogressProgress
Effort(hours/month)
Effectiveness(tasks/hour)
Rockefeller Collegeof Public Affairs and Policy
University at AlbanyState University of New York
George Richardson
41
Robust equation formulations
CumulativeprogressProgress
Effort(hours/month)
Effectiveness(tasks/hour)
WorkersHours per person
per day
Workweek(days)
Rockefeller Collegeof Public Affairs and Policy
University at AlbanyState University of New York
George Richardson
42
Robust equation formulations
CumulativeprogressProgress
Effort(hours/month)
Effectiveness(tasks/hour)
Normal effectiveness(tasks/hour)
Effect ofmotivation
Effect ofschedulepressure
Effect of ...
Rockefeller Collegeof Public Affairs and Policy
University at AlbanyState University of New York
George Richardson
43
Robust equation formulations
CumulativeprogressProgress
Effort(hours/month)
Effectiveness(tasks/hour)
WorkersHours per person
per day
Normal effectiveness(tasks/hour)
Effect ofmotivation
Effect ofschedulepressure
Effect of ...
Workweek(days)
Rockefeller Collegeof Public Affairs and Policy
University at AlbanyState University of New York
George Richardson
44
You can integrate CLD and stock and flow models…
Hovmand PS, Ford DN (2009). Sequence and Timing of Three Community Interventions to Domestic Violence. American Journal of Comuunity Psychology; 44(3-4): 261-272.
45
General Approach…
1. Define ProblemWhat is happening over time that we are concerned about?
2. List FactorsWhat are important drivers? Write as variables. Indicate any known direct causal connections.
3. Draw Reference ModeGraph behavior over time. Any other factors needed to explain trends? Does the pattern suggest any familiar structures?
4. Build A Dynamic Hypothesis and System Map
This could be a causal loop diagram, a stock and flow model (or a combination of the two). In any case, it is a causal hypothesis about system behavior.
5. ID Leverage PointsWhat are the levers for change (add to map)?What changes would lead to a more desirable behavior? What strategy could you use to achieve these changes?
46
Sometimes We Find “Leverage Points” -- Where Small Actions Yield Large Results
“Maybe we should write that spot down.”
47
We Get to Stop Following Rules That Don't Really Exist
“Hey! They’re lighting their arrows!...Can they do that?”
48
How can CLDs motivate intervention?
• Think about ways to:– Reverse causal direction somewhere– Change a sign– Remove directionality– Decouple two variables– Tighten or loosen the connection between two
variables– Alter delays– Add a loop whose effect cancels out the original
one
49
How can CLDs motivate intervention?
50
How can CLDs motivate intervention?
51
How Can Stock-Flow Models Motivate Intervention?
• Consider each model flow– What variables affect that rate of flow?– Are any of these variables (or flows themselves)
amenable to change?• Draw these “leverage points” and related
interventions right on the stock and flow diagram
• Simulate impact of intervention “scenarios” under alternate possible “realities” about the future
52Jones, Homer, et al. 2006
Possible interventions
53
General Approach…
1. Define ProblemWhat is happening over time that we are concerned about?
2. List FactorsWhat are important drivers? Write as variables. Indicate any known direct causal connections.
3. Draw Reference ModeGraph behavior over time. Any other factors needed to explain trends? Does the pattern suggest any familiar structures?
4. Build A Dynamic Hypothesis and System Map
This could be a causal loop diagram, a stock and flow model (or a combination of the two). In any case, it is a causal hypothesis about system behavior.
6. Test & Improve TheoryGet feedback from others. Find data. Act and observe real world results. Reflect.
5. ID Leverage PointsWhat are the levers for change (add to map)?What changes would lead to a more desirable behavior? What strategy could you use to achieve these changes?
54
Why Use System Dynamics Methods…
• Help us develop a shared understanding of the system• Teach us to think differently about how systems
behave (that is, in terms dynamics, circular causal feedbacks, accumulations, etc)
• Allow stakeholders to view the larger system they are embedded within
• Provide a framework for integrating what we know, and determining importance of what we don’t know
• Support identification of high impact leverage points• Offer a virtual world in which to “try out” and compare
policies
55
How Do I Build CLD and Stock And Flow Models?
• Diagrams– Paper and pencil (or whiteboard)– Powerpoint– Visio– Isee/Ithink, http://www.iseesystems.com/– Vensim, http://www.vensim.com/
• Simulation models– Excel (with add-ons for simulation, such as Palisade @Risk