Page 1
AN INVESTIGAlION OF THE HI,A CLASS IT POLYMORPHISM IN
THE MALAGASY.
Angela Anne Turner.
A dissertation submitted to the Faculty of Medicine, University of the
Witwatersrand, Johannesburg, for the degree of Master of Science.
Johannesburg, 1999.
Page 2
ABSTRACT:
Madagascar, the last large landmass to be colonized, has been described as a
laboratory of evolution, but due to the partially restricted entry of Western
scientists in the past, little is known about the natural history of the island. A
major aim of the Human Genetics Department at the SAIMR, is to determine
who the forerunners of the Malagasy were. Linguistic, cultural, physical and
some genetic evidence suggests that Indonesians and Africans are likely to
have been the two main population groups who contributed to the Malagasy.
The present study sought to make the genetic characterization of the Malagasy
more complete and to further explore their origins. This was done by typing the
alleles present at two major histocompatibility complex gene loci and analysing
data gathered on several serogenetic systems. Alleles present at the DQA1
locus were typed with the aid of a commercially available DQA1 typing kit and
DPB1 alleles were typed by DNA sequencing and comparison to sequences
reported in the literature. Three possibly novel DPB1 alleles were found in this
study. DQA1 andDPBl allele frequencies, DQA1-DPB1 estimated haplotype
frequencies, as well as some non-HLA serogenetic loci allele frequencies were
used in various statistical calculations. Global linkage equilibrium was found
between the DQA1 and DPB1 loci of Indonesians and the Tsonga; while
global linkage disequilibrium was found amongst the three Malagasy groups
studied (the Merina, Antemoro and Tsimihety). This is an indication of a recent
admixture in the Malagasy. Admixture estimations revealed that Africans,
represented here by the Tsonga, were the major contributors to the weighted
average of the three Malagasy groups, followed by an Indonesian and a small
Arab contribution. Principal coordinate analysis, as well as the phylogenetic
trees constructed using Ds genetic distance matrices, showed the highland
group, the Merina, to be closest to the Indonesians. The two lowland groups,
Page 3
the Antemoro and Tsimihety, were closest to the Tsonga. Arabs fell
approximately midway between the Indonesians and Tsonga and were quite
close to the three Malagasy groups studied. Although the Merina appeared
closest to the Indonesians, the DPB 1*0501 allele which occurred at a
frequency of 0.1809 in Indonesians was absent from the Merina sample and
suggests that Indonesians may not be as important a contributor to the Merina
as once thought. Other allele frequencies indicate the possible existence of
additional “parental” groups. A substantial African contribution to the
Tsimihety was evident from this study.
Page 4
iv
DECLARATION:
I declare that this dissertation is my own unaided work. It is being submitted
for the degree of Master of Science in Human Genetics at the University of the
Witwatersrand, Johannesburg. It has not been submitted for any other degree
or examination at any other University.
Angela Anne Turner
day of N member, 1999
Page 5
V
DEDICATION:
To my family
for their unconditional support and encouragement over the years
Page 6
vi
ACKNOWLEDGEMENTS:
I would sincerely like to thank the following people:
My supervisor Dr Tony Lane for all his time and advice.
Professor T. Jenkins, Prof. G. Campbell, Dr. P. Willem, Dr. T. de Ravel and
Prof. A. Flemming who collected the blood samples used during this study.
Dr. J. Clegg, Oxford, for allowing the use of the Indonesian samples and Dr.
H. Soodyall for corresponding with Dr. Clegg on my behalf.
The individuals in the serogenetics laboratory who performed all the
serological testing on the samples used for the analyses.
Michelle Thompson and the other members of the Molecular Biology Unit
(under the direction of Prof. V. Mizrahi) for their time and assistance
concerning the cloning technique.
My fellow students and colleagues for their support and help.
The SAIMR and University of the Witwatersrand for financial support and
laboratory facilities.
All of the individuals who kindly donated blood.
Page 7
vii
TABLE OF CONTENTS: PAGE
ABSTRACT ........................................................................................ii
DECLARATION ...................................................................................iv
DEDICATION......................... v
ACKNOWLEDGEMENTS...................... vi
TABLE OF CONTENTS........................................................................... vii
LIST OF TABLES................... xi
LIST OF FIGURES...................................................................................
LIST OF ABBREVIATIONS ..................... xiv
CHAPTER ONE: INTRODUCTION......................................................... 1
1.1 MADAGASCAR............................................................... 1
1.2 THE PEOPLE OF MADAGASCAR.........................................................3
1.2.1 Physical features................................................................. 4
1.2.2 Language......................................................................................6
1.2.3 Culture and customs...................................................... 8
1.2.4 Malagasy groups studied............................................................ 10
1.3 SETTLEMENT HISTORY......................................................................11
1.4 PREVIOUS STUDIES CONCERNING THE ORIGINS OF THE
MALAGASY..........................................................................................17
1.5 THE CONCEPT OF ADMIXTURE AND ITS EFFECT ON
LINKAGE DISEQUILIBRIUM............................................................20
1.6 THE MAJOR HISTOCOMPATIBILITY COMPLEX............................23
1.6.1 Gene location and layout............................................................ 23
1.6.2 Structure of human leucocyte antigens........................................25
1.6.3 Assembly and intracellular transport of class E molecules 30
1.6.4 Antigen presentation...................................................................31
Page 8
viii
1.6.5 Mal&nctioning of class II expression....................................... 33
1.7 EVOLUTION OF THE MHC................................................................. 34
1.8 HLA INVOLVEMENT IN MATE SELECTION....................................38
1.9 HLA AND AUTOIMMUNITY.............................................................. 39
1.10 HLA AND TRANSPLANTATION.......................................................41
1.11 HLA AND ITS ROLE IN FOETAL TOLERANCE AND
INTOLERANCE..................................................................................43
1.12 HLA AND INFECTIOUS DISEASES.................................................. 45
1.13 USES FOR HLA TYPING.................................................................... 48
1.14 AIMS OF THE PRESENT STUDY...................................................... 48
CHAPTER TWO: SUBJECTS AND METHODS................................... 49
2.1 SUBJECTS..............................................................................................49
2.1.1 Malagasy individuals.................................................................. 49
2.1.2 African individuals.......................................... 50
2.1.3 Indonesian individuals................................................................ 50
2.2 METHODS............................................................................................. 51
2.2.1 Processing of blood.....................................................................51
2.2.2 DQA1 typing..............................................................................52
2.2.2.1 DQA1 typing using a chemiluminescent dot blot
procedure.....................................................................52
2.2.2.1.1 PCR amplification............................................52
2.2.2.1.2 Dot blot procedure...........................................54
2.2.2.1.3 Hybridization to biotinylated probes and
Chemiluminescent detection of bound
probe............................................................. 54
2.2.2.1.4 Reprobing of the membrane.............................57
2.2.22 DQA1 typing using a colorimetric reverse dot blot
Page 9
procedure.......................... 57
2.2.3 DPB1 typing............................................................................... 58
2.2.3.1.1 Sample preparation.....................................................59
2.2.3.1.2 Single stranded cloning of PCR product..................... 62
2.2.3.2 Automated DNA sequencing.........................................63
2.2.4 Statistical analyses...................................................................... 66
2.2.4.1 Frequency distributions................................................. 66
2.2.4.2 Hardy-Weinberg equilibrium......................................... 70
2.2.4.3 Gene diversity............................................................... 70
2.2A4 Pairwise linkage disequilibrium..................................... 70
2.2.4.5 Exact tests of population differentiation.........................71
2.2.4.6 Population admixture estimations.................................. 71
2.2A.1 Principal coordinate analysis..........................................72
2.2.4.S Genetic distance and phylogenetic tree construction 73
CHAPTER THREE: RESULTS AND DISCUSSION............................. 74
3.1 DQA1 typing procedures......................................................................... 74
3.2 DPB 1 typing procedure............................................................................75
3.3 Statistical analyses................................................................................... 81
3.3.1 Frequency distributions .................................................. 81
3.3.1.1 Allele frequencies..........................................................81
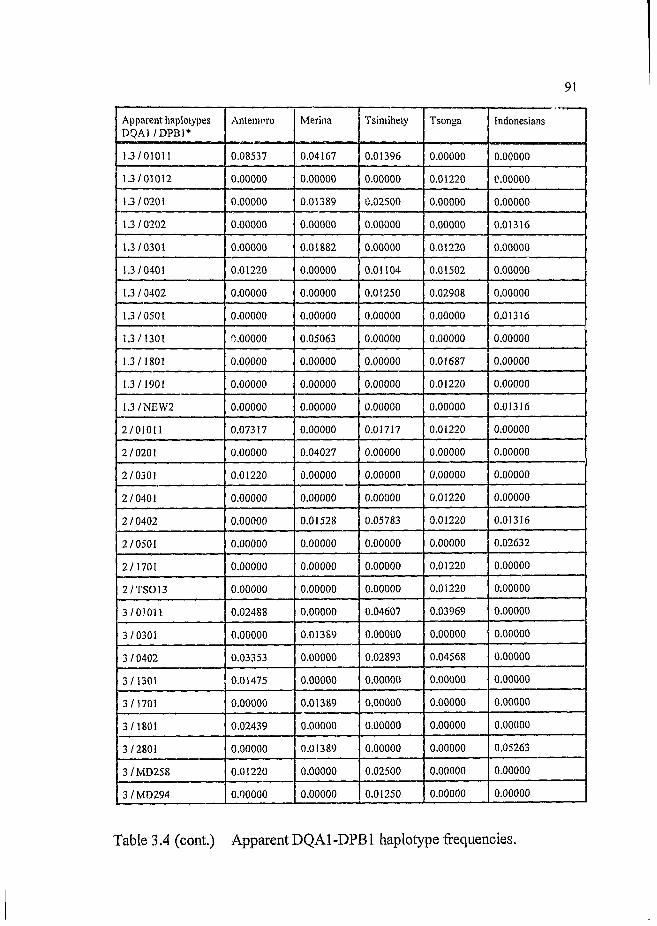
3.3.1.2 Haplotype frequencies................................................... 89
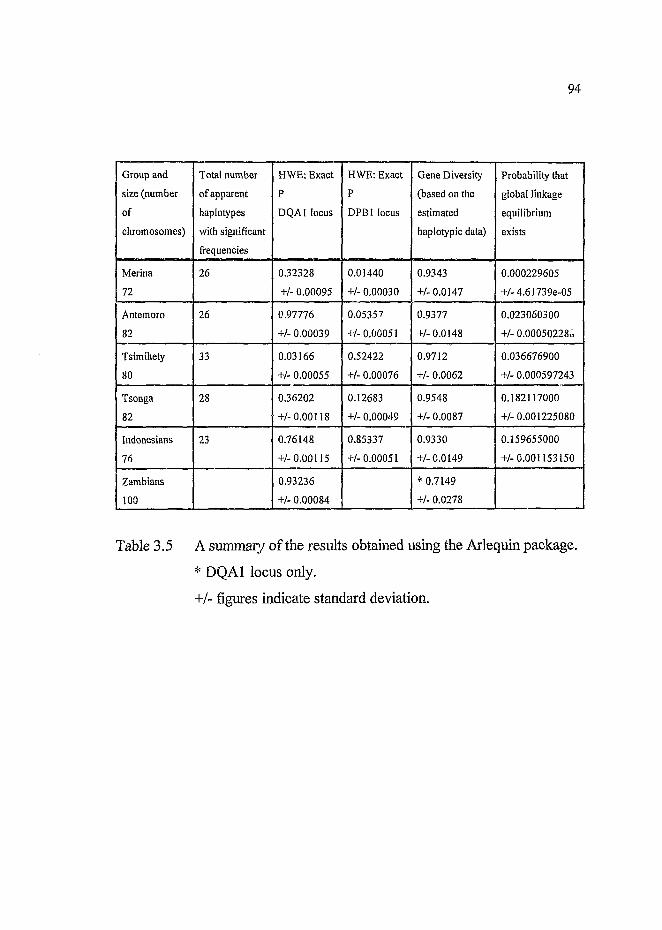
3.3.2 Hardy-Weinberg equilibrium, gene diversity and linkage
disequilibrium............................................................................93
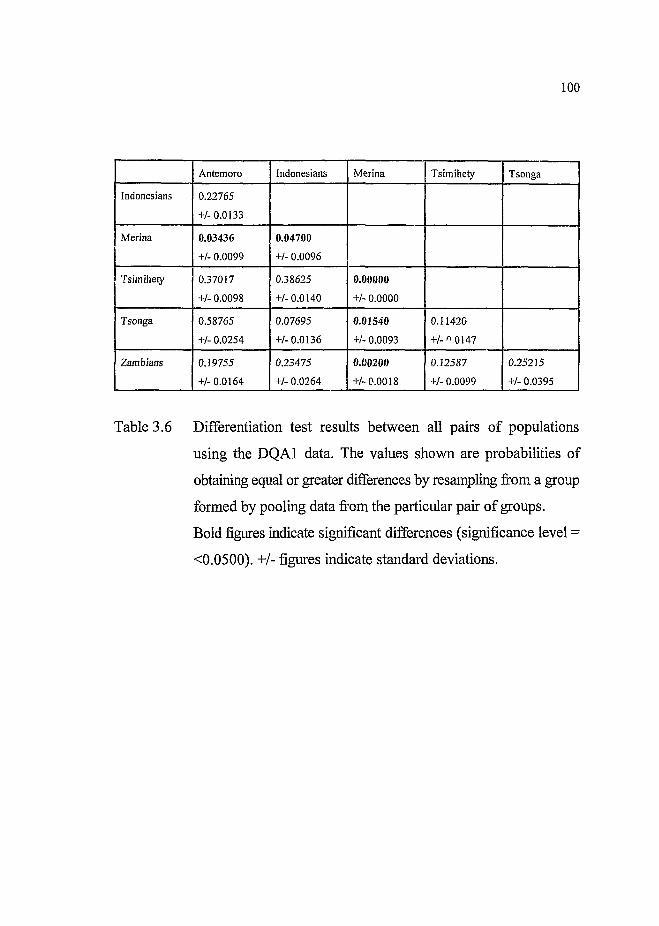
3.3.3 Population differentiation............................................................99
3.3.4 Admixture calculations..............................................................102
3.3.5 Principal coordinate analysis.....................................................104
3.3.6 Genetic distance and phylogenetic trees.................................... 107
Page 10
X
CONCLUSIONS................ I l l
REFERENCES..........................................................................................113
APPENDIX A1................. 141
A2................. 146
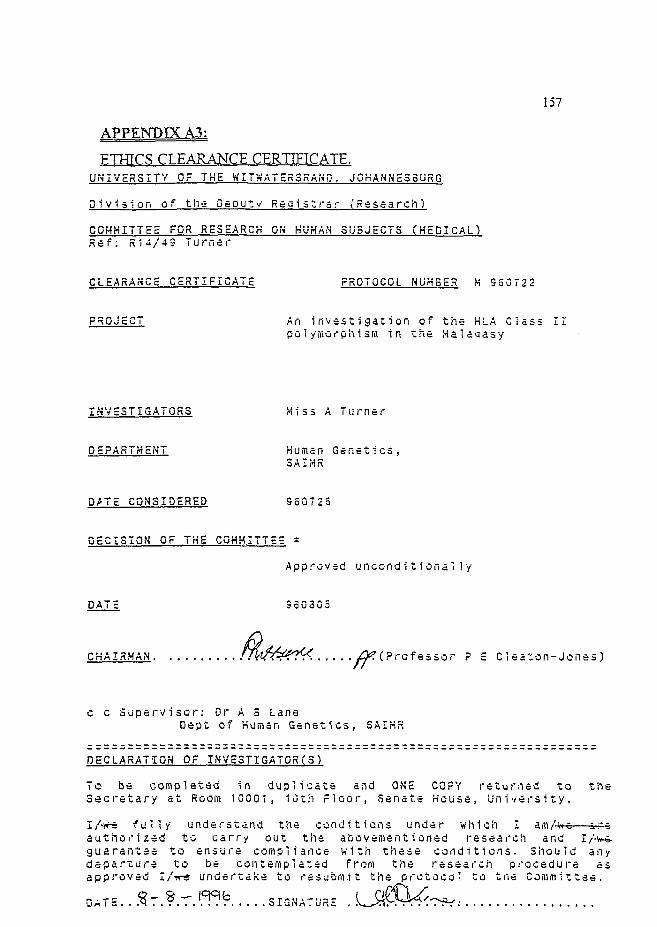
A3...........................................................................................157
Page 11
XI
LIST OF TABLES: PAGE
Table 2.1 Nucleotide sequences of probes used for the dot blot
method of DQA1 typing............................................................55
Table 3.1 DQA1 allele frequencies............................................................84
Tab.e 3.2 DPB1 allele frequencies.............................................................86
Table 3.3 Allele frequencies of the serogenetic markers used ........ 88
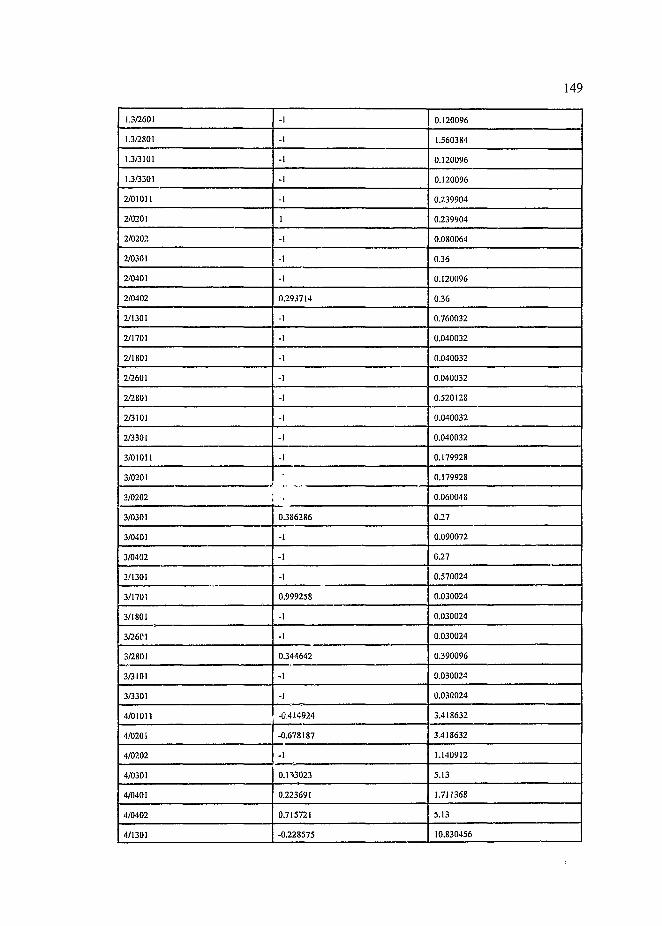
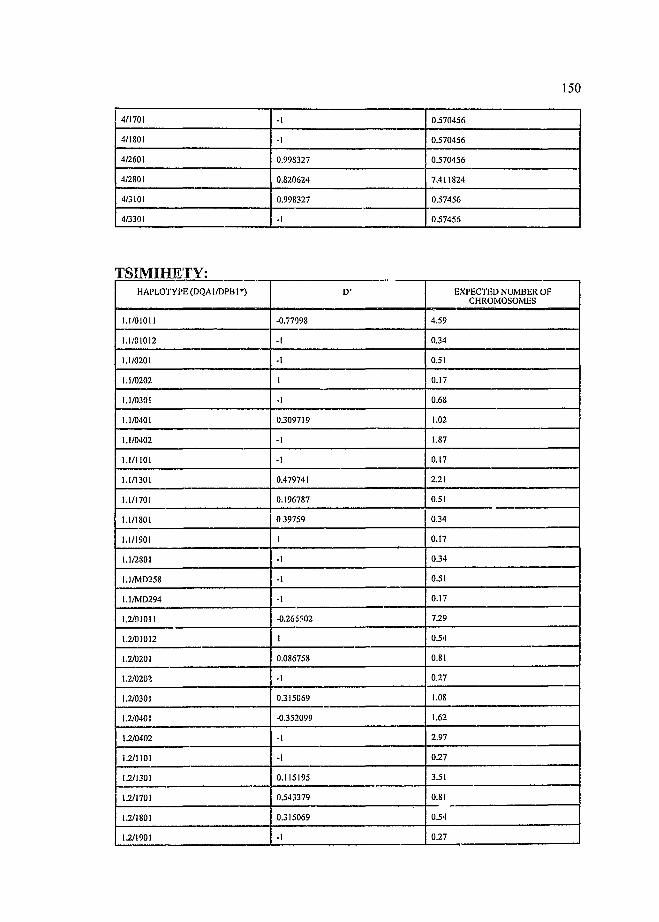
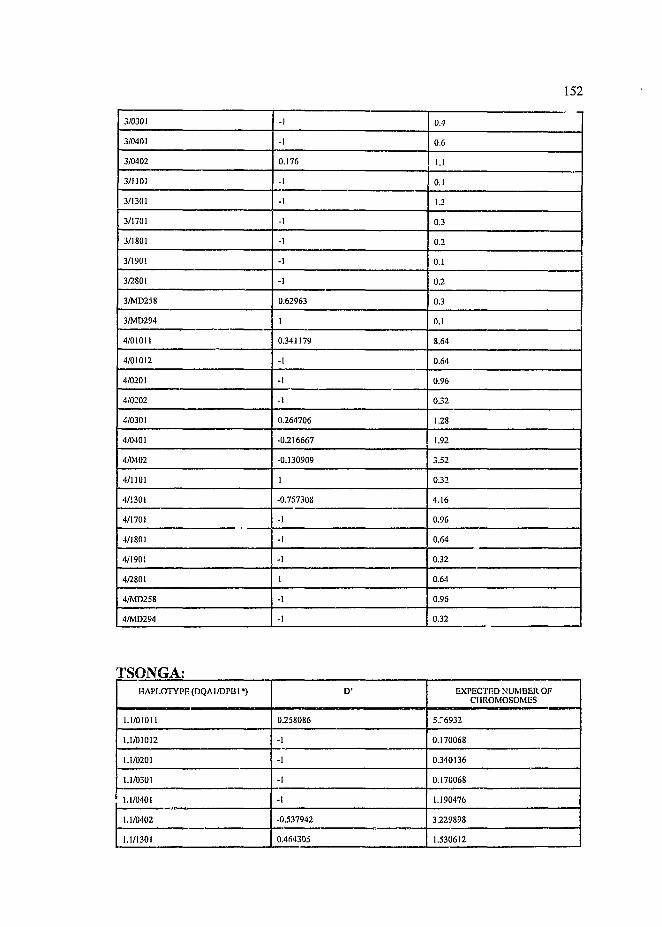
Table 3.4 Apparent DQA1-DPB1 haplotype frequencies.......................... 90
Table 3,5 A summary of the results obtained using the Arlequin
package.....................................................................................94
Table 3.6 Differentiation test results between all pairs of populations
using the DQA1 data........................... 100
Table 3.7 Differentiation test results between all pairs of populations
using the DPB 1 data................................................................101
Page 12
xii
LIST OF FIGURES: PAGE
Figure 1.1 A map showing Madagascar's proximity to Africa and
nearby islands as well as the approximate locations of
ethnic groups on the island.......................................................... 5
Figure 1.2 A simplified diagram of chromosome 6 highlighting the
MHC region............................................................................. 26
Figure 1.3 A more detailed diagram of the class II region............................27
Figure 1.4 A schematic representation of a class I molecule..................... ...28
Figure 1.5 A schematic representation of a class H molecule.......................29
Figure 2.1 Nucleotide sequences (exon2) of some DPB1 alleles................. 65
Figure 2.2 The amino acid sequences of all the alleles used for
comparison to the nucleotide sequences obtained from
the samples used in this study........................................ 67
Figure 2.3 Part of the sequence of the vector M13mpl9 showing the
cloning site................................................................................69
Figure 3.1 A dot blot probed with DQA1.1,1.2,1.3,1.4............................... 76
Figure 3.2 Reverse dot blot strips................................................................77
Page 13
xiii
Figure 3.3 The output obtained from the DNA sequencer depicting
three different sequence combinations.................... 79
Figure 3.4 Principal coordinate plot of the haplotypic HLA data................ 105
Figure 3.5 Principal coordinate plot of the non-HLA serogenetic data
with the DQA1 data................................................................ 106
Figure 3.6 Phylogenetic tree obtained from Ds distances calculated
from the haplotypic PILA data................................................. 109
Figure 3.7 Phylogenetic tree obtained from Ds distances calculated
from the non-HLA serogenetic and DQA1 data.......................110
Page 14
LIST OF ABBREVIATIONS:
ACD acid citrate dextrose
AGP acid phosphatase
AD Anno Domini
AIDS acquired immune deficiency syndrome
AM Antemoro
APS ammonium persulphate
BC before Christ
bp base pair
BSA bovine serum albumin
°C degrees Celsius
CaCl2 calcium chloride
GITA class H transactivator
cm centimetre
cM centimorgan
ddH20 autoclaved distilled water
ddNTP dideoxynucleotriphosphate
DNA deoxyribonucleic acid
dNTP deoxynucleotriphosphate
EX -05 X10"5
E-M expectation-maximization
EDTA ethylene-diamine-tetra acetic acid
ER endoplasmic reticulum
g gram
GVHD graft-versus-host disease
HOT high gelling temperature
HIV human immunodeficiency virus
Page 15
XV
HLA human leukocyte antigen
HWE Hardy-Weinberg equilibrium
IDDM insulin dependent diabetes mellitus
IFN interferon
IND Indonesians
kb kilobase
km kilometre
kV kilovolt
LMP low molecular weight protein
M molar
mA milliamp
mix mixture/solution
mg milligram
MgCl2 magnesium chloride
MHC major histocompatibility complex
gl microlitre
ml millilitre
mM millimolar
MR Merina
NaCl sodium chloride
NIDDM non insulin dependent diabetes mellitus
NK-cell natural killer cell
% percentage
P exact probability
PC principal coordinate
PCR polymerase chain reaction
PEG polyethylene glycol
PGM, phosphoglucomutase 1
Page 16
pmoles picamoles
Rh rhesus blood group
RSA recurrent spontaneous abortion
SAIMR South African Institute for Medical Research
SDS sodium dodecyl sulphate
SSC sodium chloride-sodium citrate
SIR short tandem repeat
SVD singular value decomposition
TAP transporters associated with antigen processing
TBE tris-boric acid EDTA
T20E5 tris(20mM) EDTA(5mM)
IE tris-EDTA
tris tris [hydroxymethyl] amino methane
tRNA transfer ribonucleic acid
TS Tsimihety
ISO Tsonga
U units
UIF unexplained infertility
US United States
u v ultraviolet
vs versus
Page 17
1
CHAPTER ONF,:
TNTROPTTCTTON
1.1 MADAGASCAR
Madagascar is an Indian Ocean island situated off the southeastern coast of
Africa (Cole, 1992; Verin e ta l, 1970). It was formed approximately 50-120
million years ago when it broke away from the African landmass (Cole, 1992;
Haggett, 1994). Today, approximately 400km of the Mozambique channel
separate the island from Mozambique (Cole, 1992). Madagascar is
approximately 1600km long, 500km wide (Mourant et a l, 1916) and includes
five offshore island dependencies which, together with the main island, make
it the fourth largest “island” in the world (Verin et ah, 1970; Haggett, 1994;
Uzoigwe, 1995).
Mountains stretch the length of the island and divide it into a narrow eastern
section and a large western section (Singer et ah, 1957). Features such as hills,
deep gorges and volcanic outcroppings characterize the temperate inland
plateau (Haggett, 1994; Uzoigwe, 1995). The coastal regions are hot and damp
(Dempsey, 1985) and the east coast is lined by coral beaches and lagoons
(Haggett, 1994). Much of the island is covered by dense tropical forest
(Dempsey, 1985), especially the northeast (Cole, 1992), but the central
highlands have been deforested and, as a result, have become eroded in places.
The southeastern end of the island is mainly desert (The World Book
Encyclopaedia, 1977) and is occasionally referred to as the “spiny desert”, due
to its odd-looking thorny vegetation (Cole, 1992). The eastern side of the
island, with its steeply plunging rivers, is the most densely populated part of
the island (Haggett, 1994; Uzoigwe, 1995). Rivers on the island are heavily
J
Page 18
silted with red soil and this has prompted some people to remark that the island
is “bleeding to death” (Cole, 1992). The sparsely populated, gently sloping
savannahs and plains of the west (Cole, 1992) have the fertile, intensively
cultivated valleys (Haggett, 1994; Uzoigwe, 1995).
Due to the island’s ancient separation from Africa, the plants and animals have
evolved in isolation and most species on the island are indigenous. For this
reason, Madagascar has been described as a laboratory of evolution (Cole,
1992). The island is one of the richest botanical areas in the world and is
famous for its lemur population (true lemurs are found nowhere else in the
world). Part of the reason for the richness of fauna and flora is that human
occupation of the island occurred relatively recently. Although this island was
the last large land mass to become colonized by man (Dewar and Wright,
1993), the negative effects of human activities are already appreciable. If the
human population continues to grow at the present rate of 2.8% per annum,
there could be approximately 16.6 million people living on the island by the
year 2000. This rapidly growing population is putting a lot of pressure on the
environment and already 50-80% of the forest has been destroyed. Projects
have, however, been established to try and prevent further deterioration and
perhaps improve the envfronment (Cole, 1992).
Until fairly recently, the political situation in Madagascar curtailed research
activities, but in 1980 the rules concerning entry into the country were relaxed
(Cole, 1992). To date most research has been on wildlife rather than on the
island’s people. A major aim of the Human Genetics Department at the
SAIMR is to use genetic information to cast light on the peopling of
Madagascar. The present study forms part of this endeavour.
Page 19
1.2 THE PEOPLE OF MADAGASCAR
3
The Malagasy were thought to be primarily Malayo-Polynesian, but it is
becoming increasingly obvious that Africans and Arabs have contributed genes
as well (Mack, 1986). Some of the suggested regions from whence the island’s
primary settlers came, include the coast of Mozambique, the Comoros Islands,
the “Swahili coast” of Tanzania and Kenya, the Persian Gulf, Great
Zimbabwe, the Rift Valley of East Africa, Southern India, Malaysia and, to a
lesser extent, Europe (reviewed by Hewitt et al., 1996). The racial mix of the
island is undoubtedly complex. In fact, one could describe the Malagasy as
progeny of the Indian Ocean since their ancestors seem to have come from all
of its shores, except Australia (Dewar and Wright, 1993).
There are 22 “official” Malagasy ethnic groups which are generally classified
according to whether they occupy the highlands or lowlands of the island. The
Highlanders include the Merina, Betsileo, Bezanozano and Vakinankaratra.
The latter group is considered to be admixed Merina and Betsileo. Lowlanders
are divided into eastern, southwestern, northern and western groups. Those
living along the east coast include the Betsimisaraka, Tanala, Antemoro,
Antesaka, Antefasy, Antambahoaka, Zafisoro and Antanosy. Southwestern
Malagasy groups include the Antandroy, Bara, Mahafaly, Vezo, Mikea and
Masikoro; northern Malagasy groups include the Antankarana, Tsimihety and
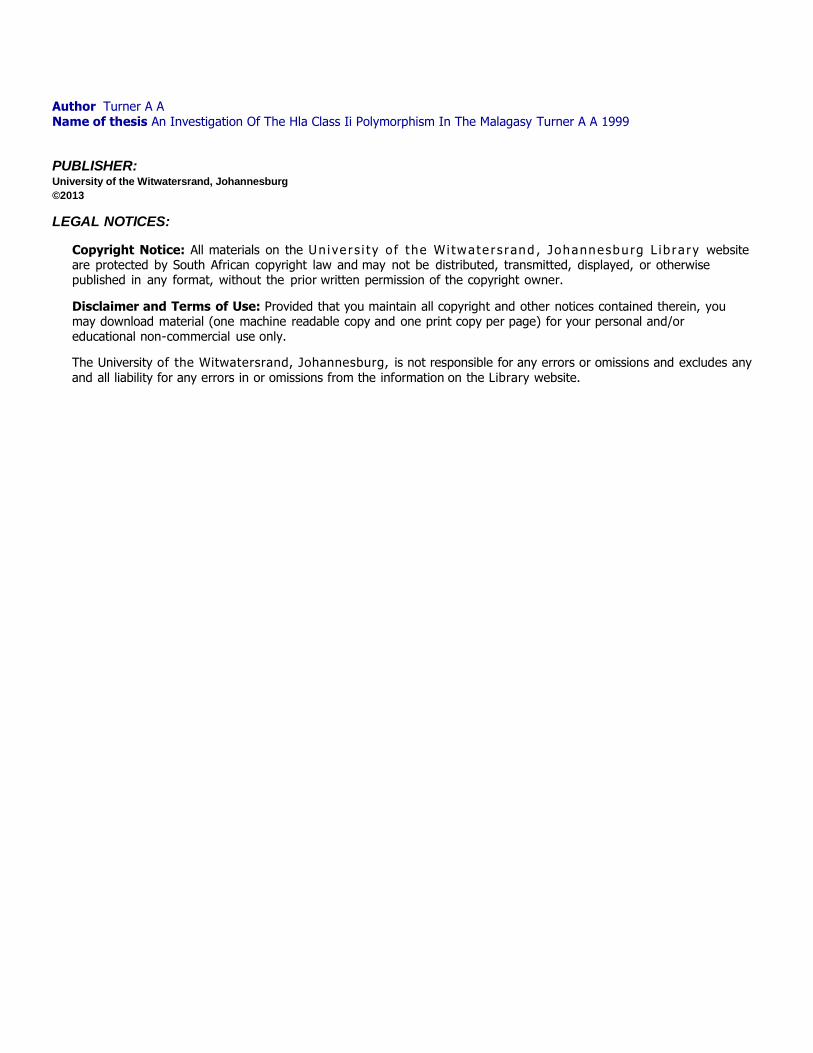
Sihanaka; while the Sakalava are found in western Madagascar. A map of the
approximate distribution of etlmic groups can be seen in Figure 1 (adapted
from Brown, 1978 and Campbell, 1988). An additional group, the Makoa, live
on the west coast of the island, but as a reasonably accurate location has yet
to be identified, they have not been placed on the map. It may be significant
that Makua is a Bantu language spoken in northern Mozambique and also by
Page 20
more recent immigrants to the island (Gueunier, 1992),
4
Malagasy groups differ with regard to the dialects they speak, their customs
and physical characteristics; all of which have been extensively studied in the
past (Mack, 1986). In view of the above, it would seem better, when trying to
gain insights to the peopling of the island, to concentrate on individual ethnic
groups rather than on the Malagasy as a whole (Brown, 1978).
1.2.1 Physical features
Although a fairly wide variety of physical features is evident in individuals
belonging to all the ethnic groups, general trends are apparent. The majority
of people living on the plateau have a more Asian appearance with lighter skin
and straight hair. People living in areas surrounding the plateau tend to have
more African characteristics, such as darker skin and frizzy hair (Mack, 1986).
Other features which appear in people all over the island include varying
degrees of fullness of lips and differently shaped foreheads, noses and eyes
(Singer eta l, 1957). According to Griffiths (1843); Abyssinian, Arabian and
Indian features are also present. Hildebrandt’s study on cranial measurements
indicate a strong African element, especially in coastal tribes (Dahle, 1883).
However, an individual’s appearance alone is not always indicative of the
ethnic group to which he or she belongs or their ancestry (Singer et al, 1957);
customs, language, historical data and molecular/ serological data should also
be considered.
Page 21
VrV
',vi
Equa to r
SEY CH ELLES
I N D I A N
» / Q PEMBA
U I (V ZANZIBAR
- / / ) M AFIAT A N Z A N I A
C O M O R O S
TSIM IHETY
SIH.VJAKA
fy?< y s j ANTXMBAHOAKA
ANTEMORO
SOROEFASYCL^/K J.
ANTESAKA
NTANOSY
600km
O C E A N
MAURITIUSo<V b REUNION
Tropic of Capricorn
M ADAGASCAR
Figure 1.1 A map showing Madagascar’s proximity to Africa and nearby
islands as well as the approximate locations of ethnic groups on
the island.
Page 22
6
1.2.2 Language
Malagasy is primarily a Malayo-Polynesian language which is similar to
Maanyan, a language spoken in the Barito Valley area of Borneo (Dahl, 1951).
There have, however, been contributions from other languages; for instance,
many of the astrological words in use are of Arabian origin and there are some
elements of Sanskrit as well (Singer et al, 1957). The Bantu language
contribution to Malagasy is small, but nonetheless has probably been present
from the start. Phonetic studies confirm an early Bantu influence and terms
associated with animal husbandry are clearly derived from Bantu words
(Mack, 1986). The scarcity of Bantu and Swahili words has been explained in
terms of slavery. Although there were probably many African slaves, they may
have, in general, been forced to adopt the language of their masters (Singer et
al, 1957).
It is believed that the population which gave rise to the different linguistically
identifiable communities on the island, was a single group which arrived some
time between 100 BC and AD 400 (Verin et al, 1970).
According to Deschamps (1965), the proto-Malagasy traded in the Indian
Ocean and possibly in the Pacific Ocean as well. The trade route linking
Indonesia with Madagascar was via Indian, Arabian and East African ports.
It is assumed that traders were predominantly male, thus many wives would
probably have been taken at East African ports. Their children would
subsequently have became traders and taken their Indonesian and African
genes to Madagascar. Settlement in different areas along the trade route or in,
Madagascar itself would have given rise to the divergence of the Malagasy
linguistic groups. Some Indonesian descendants from hypothesized East
Page 23
African stations may have migrated to Madagascar later when they were
displaced by Arab traders (Deschamps, 1965). It has also been shown by
Soodyall and colleagues (1995) that a significant number of Polynesian
women, or female descendants of an ancestral population, would have settled
on Madagascar at some point due to the significant presence of a Polynesian
motif of the mitochondrial DNA.
Theories concerning the language patterns on the island are quite confusing.
One holds that the island was first occupied in the north around the first
century AD and that these settlers split into three groups as they moved out
over the uninhabited island. In time, these groups acquired different dialects
and became the Antankarana, the Tsimihety and a group who spoke the
protodialect of today’s remaining groups. Around AD 600-700 individuals
speaking this protodialect split into two groups: those speaking the dialects in
the west and south, or ancestral Vezo-Mahafaly-Antandroy-Bara; and those
speaking the dialects in the east and centre, or ancestral Merina-Sihanaka-
Betsileo-Betsimisaraka-Antemoro-Antesaka-Zafisoro (Verin et a l ., 1970).
The dialects of the northern groups, the Tsimihety and Antankarana, are
distinguishable from all other dialects as well as from each other. There is a
mountain range which separates the Antankarana from the Tsimihety and the
remaining groups, and this has ensured the relatively isolated evolution of the
Antankarana dialect (Verin et a l ., 1970).
Alternative theories to Verin’s include those of Murdoch and Gueunier.
According to Murdoch, linguistic evidence suggests a single migration to the
island, with the possibility that the original inhabitants settled on the plateau.
The dominant group there, the Merina, drove its neighbours to the coastal
Page 24
8
remons where the likelihood of admixture with Africans would have been
greater (Murdoch, 1959). However, Malagasy traditions clearly refer to the
Merina as having arrived after the other peoples of the island (Ellis, 1838a) and
archaeological evidence does not support a initial settlement on the plateau
with a subsequent migration to the coasts (MacPhee and Bumey, 1991).
Gueunier states that the island’s speech pattern reflects various dines,
indicating more neighbour and recent migrant interaction, and he believes that
Verin’s sample was poorly distributed geographically (Gueunier, 1988).
The study of languages has been complicated by culture. For instance, some
words which are associated with deceased leaders may become taboo and a
new word must be used instead (Verin et al, 1970).
1.2.3 Culture and customs
Some groups living on the plateau practice second burial and removal of bones
of deceased individuals from their tombs in order to rewrap them in silk
shrouds. This is not a common practice on the adjacent parts of the African
continent (Mack, 1986), but is on the Islands of the East. Items such as
utensils, clothing, musical instruments, totem poles and rectangular houses;
practices such as rice culture; as well as the beliefs and superstitions are of
Eastern, rather than African origin (Singer et al., 1957). Round African style
houses have, however, been found in a western Vazimba village (Campbell,
1996, personal communication).
With respect to rice agriculture, the central highland societies, namely the
Merina, Sihanaka and Betsileo, are distinguished from other Malagasy groups
by the presence of irrigation economy or wet-rice cultivation. These groups
Page 25
9
live in close proximity to each other and often claim a single origin. The
remaining rice growing groups nly on rainfall to water their crops (Verin et al, 1970).
There is evidence of a pre-Islamic Arab presence on the island: traditions
involving astrology, divination, soothsaying, magic, calendar computation and
teaching of the Devil appear to be of Arab origin (Campbell, 1995a, personal
communication). Observances strongly resembling some of the rites of
Mohammedanism are of comparatively recent occurrence (Ellis, 1838b).
The ma-". economic activity of the people of the western and southern plains,
namely the Sakalava, Bara, Mahafaly and Antandroy, is cattle raising; and the
zebu cattle they herd are of African origin (Campbell, 1995b, personal
communication). The extensiveness of the cattle industry suggests a much
greater contact with Africa than linguistic and cultural traits would suggest
(Mack, 1986).
The livelihood of most people living on Madagascar depends on farming. Rice,
coffee, tobacco and bananas are among the chief crops produced and common
activities include fishing; cattle, sheep and goat herding; as well as the making
of palm products, such as mats and baskets (Dempsey, 1985; Dewar, 1995).
Taking physical features, language and cultural habits into account, the
following broad observations have been made: The Betsileo and Merina appear
to be more Indonesian, the Tsimihety and Tanala appear to have roughly equal
proportions of African and Indonesian “blood” and the Mahafaly, Antandroy,
Sakalava and Bara appear to be more African. Those groups which deviate
from this African-Indonesian spectrum are the Antemoro, Antanosy and
Page 26
10
Antambahdaka who show a substantial Arab/Islamic influence (Brown, 1978).
1.2.4 Malagasy groups studied
Three Malagasy groups, namely the Merina, Tsimihety and Antemoro, were
investigated in the present study. The names of the groups reveal something
about them. “Merina” means “people of the highland”; “Tsimihety” means
“those who do not use the scissors” and “Antemoro” means “those on the
coast” (Singer et a l, 1957).
The Merina occupy the central highlands around the capital city, Antananarivo
and make up the best educated section of the population (Singer et al., 1957).
They are believed to be more exclusive with respect to mating than coastal
tribes and those living on the slopes of the high plateau (Buettner-Janusch and
Buettner-Janusch, 1964). There are three Merina classes: the Andriana or
nobles, the Hova or commoners/ “free men” and the Andevo/Mainti/
Mpanompo or slaves. Marriages between individuals belonging to different
Merina classes are discouraged (Singer et al., 1957). Merina individuals used
in this study were a random sampling from all classes.
According to some traditions (reviewed by Singer et a l, 1957), the Merina are
descended from three groups: the Vazimba (the so-called “original” inhabitants
of the island), the Javanese and Malays. Another belief is that the Merina are
derived from the Vazimba alone, but this is unlikely because the Vazimba
seem to have a lot of African “blood”, as indicated by the African style
housing mentioned earlier. Physical features of the Merina are very varied and
a study done in 1957 showed that approximately half the individuals had light
brown skin, 22% were very dark skinned and the remainder fell somewhere in
Page 27
11
between. Hair ranged from crinkly to straight, approximately 70% of
individuals studied had thin lips, over half had the almond shaped eyes which
are characteristic of Malays and Indonesians, and most tended to have rather
high, rounded foreheads (Singer et a l, 1957).
The Tsimihety occupy the arid northwest region of the island. It is thought that
they are descendants of immigrants who came from the Betsimisaraka and
Tanala areas, and possibly slaves from the high plateau (Singer et al., 1957).
These individuals are considered to be a fiercely independent group and are
one of the few groups on the island who were never completely subjected to
the political control of any of the Malagasy kingdoms, except for their loose
inclusion in the Sakalava empire in the eighteenth and nineteenth centuries
(Verm of., 1970).
The Antemoro are situated on the southeast coast. This group appears to have
some Arab ancestry because the Malagasy alphabet is written in Arabian
letters by them (Singer et ah, 1957). One tradition refers to the Antemoro as
being descended from 30 men who sailed directly to Madagascar from Mecca
during the seventh century (Campbell, 1995a, personal communication). In
general, the Antemoro tend to have long faces, straight foreheads, pointed
chins and scant body and facial hair (Singer et ah, 1957).
1.3 SETTLEMENT HISTORY
The first inhabitation of the island was almost certainly post Stone Age
because no Stone Age archaeological sites have been discovered; the oldest
archaeological sites have yielded only iron tools. Evidence of human impact
on the island’s vegetation does not go back for more than 1900 years either.
Page 28
12
The earliest evidence of human impact on the island’s vegetation is from the
fourteenth century (Bumey, 1987, 1994).
The oldest evidence of human activity on the island dates back to between the
first and fourth centuries AD and consists of radiocarbon dated remains of the
now extinct African pygmy hippopotamus, which showed clear markings of
butchery with metal tools. Such remains were found at two locations along the
southwest coast. The next oldest evidence, found in a rock shelter in the
extreme north, dates back to between the fourth and eighth centuries. From the
eighth century onwards, continuous occupation of Madagascar and the
Comoros Islands is evident (Wright, 1992) and the oldest human remains date
back to the ninth century (Verin, 1986). All early occupations appear to have
been along the coast, with the earliest known occupation of the interior being
in the fourteen century (Rakotovololona, 1993).
Who the first settlers were, has been the topic of great debate. Some
researchers suggest that the first settlers could have been Southeast Asian
mariners carried by prevailing winds 6400km across the Indian Ocean from
Indonesia. However, in order to significantly occupy the island, such
accidental crossings of the Indian Ocean would have had to have been
successfully repeated; and since Reunion and Mauritius, two intervening
islands, were found unoccupied before Europeans arrived on Madagascar, this
theory is unlikely (Mack, 1986).
A more favoured hypothesis is that settlement took place via the East African
coastline. According to this hypothesis, a wave of migrants spread round the
northern fringes of the Indian Ocean, via Southern India, Sri Lanka and the
Maldives; and then on to the East African coast. If this were so, then it is likely
Page 29
13
that there was a period of settlement on the African mainland before
Madagascar was settled. It is believed that the Comoros Islands were probably
an important stepping stone between Africa and Madagascar during the
peopling of the latter (Mack, 1986).
Dahle argued in favour of an initial African migration on the grounds that
Madagascar is very close to Africa. Indeed, the Vazimba, who are thought to
have been among the first inhabitants of the island, are considered to be of
African origin (Dahle, 1883). However, the proximity of Madagascar to Africa
as a reason for initial African settlement contradicts Shaw’s argument, which
dismissed an African origin due to, amongst other reasons, the Mozambique
Channel possessing treacherously strong currents and variable winds. The
prevailing winds are from the southeast and northeast, and only during the
latter part of the cold season is there a westerly wind for a day or two. The
current also flows strongly in a westerly direction. Thus, a sea voyage from
Indonesia would seem to be more feasible, particularly as Indonesians are
traditionally a maritime and colonizing people (Shaw, 1885). In addition, the
Maldives which lie roughly three-fifths of the way from Indonesia to
Madagascar and are often mentioned by early navigators (from the fifteenth to
the eighteenth centuries). Thus, Southeast Asian mariners must have mastered
the required navigational techniques to keep sailing west to Madagascar,
possibly via the Seychelles, which would have been aided by the east to west
direction of the wind. Return to Southeast Asia would most likely have been
along northern routes via the East African coastline. However, there is no hard
evidence for all of this; it is mere speculation (Manguin, 1993).
Immigration by Jews, Persians, Indians and Chinese during medieval times has
been suggested through studying isolated cu! 'ure and vocabulary links among
Page 30
14
the people of modem Madagascar. However, possible contact with these
groups did not have an appreciable impact on the racial composition or
customs of the Malagasy. Those who did were the Arabs, or more specifically,
individuals or subsequent generations of individuals who set out from Arabia
and traded down the east coast of Africa. By the time they reached
Madagascar, however, their Arab blood and religious beliefs are likely to have
been considerably diluted (Brown, 1978). The Arab individuals who reached
Madagascar via the Comoros Islands are likely to have been partly African in
genetic make up and their language was probably a cross between Arabic and
Bantu, i.e., similar to modem Swahili. They became known as the Antalaotra,
and represented a mixture of Arabs, Africans and possibly proto-Malagasy
from the Comoros Islands. These individuals retained Arab clothing and
customs, but only a few were likely to have been pure Arabs. Between the
tenth and fifteenth centuries the Antalaotra thrived on the trade in Malagasy
products and slaves (Brown, 1978) and their civilization peaked on
Madagascar between the fourteenth and seventeenth centuries. Following this,
an expansion of a Malagasy group, the Sakalava, and the incursion of
Europeans resulted in the number of Antalaotra settlements diminishing, until
only three remained. Those in the northeast and southeast coasts adopted
Malagasy culture, while those in the northwest retained the Arab culture and
maintained strong links with the Arab-Swahili community elsewhere in the
western Indian Ocean (Campbell, 1995a, personal communication).
As mentioned earlier, initial Indonesian/proto-Malagasy settlements in
Madagascar were probably outposts of larger trading settlements in East
Africa. It has been suggested that from about the middle of the first
millennium, more and more individuals from the mainland trading posts may
have moved to Madagascar as a result of the “Bantu expansion”, which was
Page 31
taking place at the time (Brown, 1978).
15
According to Brown (1978) by the end of the first millennium, a remarkably
homogeneous group of people were settled along the coasts and some inland
areas of Madagascar. They were a racial mix of Indonesians and Africans, and
spoke an essentially Indonesian language with occasional African terminology.
With respect to the first European contact, the fleet of a Portuguese mission to
India which sailed in 1499, was scattered by a tremendous storm and four of
the ships sank. A fifth ship, commanded by Diogo Dias, was driven round the
Cape of Good Hope and then far to the east. After travelling north, Diogo
made landfall on 10 August 1500 on what he assumed to be Mozambique, but
later discovered to be a large island. He named it Sao Lourengo, but the people
back in Portugal assumed it to be the island mentioned by Pedro da Covilha
and in the writings of Marco Polo, and placed it on the Portuguese map in early
1502 as Madagascar (Brown, 1978).
The Portuguese and other Europeans were responsible for ruining Arab trade
in the Indian Ocean in the sixteenth century. The only remaining evidence of
Arab settlements on Madagascar are a few Arab-style houses, tombs and
mosques (Brown, 1978).
Following the European arrival at the turn of the sixteenth century, various
unsuccessful attempts at establishing Portuguese settlements on the island were
made in order to use it as a foothold for the spice trade with the East Indies.
During the seventeenth and eighteenth centuries the island became a pirate
stronghold, with the eastern side being a major haven from which to attack
shipping in the Indian Ocean and the Arabian Sea (Mack, 1986).
Page 32
16
Many changes occurred on the island after the arrival of Europeans. One such
change was the importation of guns and gunpowder, which lead to increased
levels of military conflict, population relocations and reorganizations of
political power (Dewar, 1995).
Hie Merina state was formed in the eighteenth century due to a swift increase
in population density and increases in political complexity in the central
highlands (Dewar, 1995). By the nineteenth century, the Merina had conquered
and were ruling most of the island (Brown, 1978). English and French traders
and missionaries were welcomed by King Radama I in 1810 and slave trading
was stopped. In the 1840's, the Europeans were expelled by Queen
Ranavalona I and they did not return again until the 1860's following her death
(The World Book Encyclopaedia, 1977). According to Alfred Grandidier; in
1869, two-thirds of the population of Antananarivo were slaves and slaves
formed approximately one-third of the population living outside of this capital
(Grandidier, 1916). In 1896, 43.6% of the previously liberated slaves lived in
Imerina and constituted 20-26% of the population. This one-time slave
community experienced low birth/! \th mortality rates as a result of diseases,
such as smallpox. There were also rigid rules prohibiting sexual relations
between slaves and the ‘free’ population. For these reasons, the influx of
African slaves did not necessarily have a large effect on the rate of natural
population increase within the Merina empire (reviewed by Campbell, 1991)
and may be the reason why the Merina population group is not more African
in nature. During the 1880's and 1890's, wars fought between the French and
the Malagasy (The World Book Encyclopaedia, 1977) resulted in the French
taking the island and establishing colonial rule in 1895 (Mack, 1986). French
domination continued until 1960 when Madagascar regained its independence
(Cole, 1992).
Page 33
17
1.4 PREVIOUS STUDIES CONCERNING THE ORIGINS OF THE
MALAGASY.
In 1940, Ratsimamanga concluded from serological data that there were four
anthropological types on the island: African “Negroid”, “Europoid”,
“Mongoloid’VIndonesian-Mongoloid and “Negro-Oceanic”. The African
“Negroid” type constituted 2% of the population and consisted chiefly of the
Sakalava and Makoa. The “mixed” descendants of Arab migrants who belong
mainly to the Antandroy, Antefasy and Tanala, constituted the “Europoid”
contribution and made up approximately 9% of the population.
“Mongoloid”/Indonesian-Mongoloid individuals constituted 37% of the
islanders and were represented by the Merina, Masikoro, and Antemoro
groups. The remaining 52% were the “Negro-Oceanic” group who were
supposed to have originated in Melanesia and were found among the Sihanaka
and Tsimihety (Campbell, 1995b, personal communication). More recent
anthropometric and haematological research, however, indicates that the main
contributors of the Island’s population were from Indonesia and East Africa,
and not from Melanesia (Dewar, 1995).
The A and B alleles of the ABO blood system have very similar frequencies
to each other throughout the island, but the B allele generally has a higher
frequency than A and this is a Southeast Asian characteristic. Studies on the
Rh system show that the frequency of the cDe haplotype is relatively high and
this is consistent with an African origin. Populations in neighbouring parts of
Africa have a cDe frequency of about 60% whereas Malayan and Indonesian
populations have very low frequencies of this haplotype (Mourant et al.,
1976). The cDe frequency in the Malagasy suggests that they (in general)
could be about two-thirds Bantu and one-third Indonesian (Singer et ah, 1957).
Page 34
18
With respect to other serological markers, haptoglobin and transferrin allele
distributions also indicate a substantial African contribution (Mourant et al,
1976).
A 9bp deletion in the intergenic region between the cytochrome oxidase II and
lysine tRNA genes in mitochondrial genomes, has been found in numerous
Asian and African populations. It seems likely that the African and Asian
deletions arose independently because they are found in the mitochondrial
genomes with substantially different base sequences. The mitochondrial DNA
containing the 9bp deletion of individuals from coastal New Guinea and the
Pacific islands have a particular sequence of bases in the control region which
has been referred to as the “Polynesian motif’ (reviewed by Soodyall et al,
1995).
Almost 26.8% of the Malagasy tested were found to have the 9bp deletion, of
which, 70.7% were of the Asian type and 29.3% of the African type. The
Polynesian motif was found at a frequency of 18.2% in the Malagasy, i.e.,
more than 96% of mitochondrial genomes containing the 9bp deletion were of
the Polynesian type. These findings suggest that Polynesians could also have
been among the founding populations of the Malagasy (Soodyall et al., 1995).
A study of the stable Alu (+/-) polymorphism and short tandem repeat (STR)
polymorphisms within the CD4 locus also strongly supports a significant
African contribution to the Malagasy (Morar et al, 1996). In the Malagasy, the
Alu (-) allele occurs in combination with many CD4 STR alleles, a
characteristic exclusive to sub-Saharan African populations. The relatively high
frequency of an Alu (+) allele in the Malagasy is also indicative of an Afr ican
influence. Phylogenetic analysis of CD4 ^/z/-STR haplotypes indicate that
Page 35
19
Malagasy lowlanders cluster more closely with African (Zambian) and US
Negroid populations than they do with the highlanders who appear closer to
the Asian and two Indonesian populations studied (Morar et al., 1996).
The sickle cell (13s) allele frequency among die Malagasy highlanders has been
found to be relatively low (Hewitt et a l, 1996), which compares to Southeast
Asian individuals in whom the J3S mutation has not been found (reviewed by
Nagel and Fleming, 1992). Higher Bs frequencies were found among lowland
populations, particularly in the traditionally cattle raising groups (Tsimihety,
Sakalava and Bara), the majority of whom also have Negroid physical features
(Singer et al, 1957). The fis frequencies in the lowlanders compare to highest
found in African populations and their African American descendants (Hewitt
et al, 1996). However, being a gene which is under selection in areas where
malaria occurs, the results obtained in Hewitt’s study are not entirely
conclusive because malaria is hyperendemic in the coastal regions, especially
in the southeast (Hewitt et a l, 1996; Mourant et a l, 1976).
Haplotype studies of the J3 globin gene region offer more information than that
obtained from 13s alone. Almost all of the Malagasy 13s haplotypes were found
to be of the typical Bantu type and a large Arab-Indian contribution is unlikely
because no Arab-Indian J3S haplotypes were detected, although Asian / Oceanic
and some Caucasoid influence is evident from [3A haplotype data (Hewitt et al.,
1996).
A comparison of haplotypes obtained in the G6PD gene region of individuals
from Madagascar and possible parental populations, suggested that larger
amounts of Indonesian admixture were present in highland populations
(approximately 50%) compared to lowland population groups (approximately
Page 36
2 0
15%). However, two of the lowland groups studied, namely the Vezo and
Mahafaly, showed an even greater affinity to Indonesian or Indonesian-like
individuals than the highland groups did (Dangerfield, 1998).
The findings of all these studies reveal definite Asian and African contributions
to the Malagasy, with the general trend that coastal / lowland individuals are
genetically more similar to Africans; while highlanders are more similar to
Southeast Asians. However, exceptions to the trend are present, as mentioned
above.
1.5 THE CONCEPT OF ADMIXTURE AND ITS EFFECT ON LINKAGE
DISEQUILIBRIUM.
Under natural conditions, the diversification of populations belonging to a
species stems from an initial physical separation, attended by founder effect,
and subsequent genetic drift and natural selection. In the case of modem
humans, a distance of as little as 100km between subgroups is thought to be
a sufficient impediment to gene flow which would prevent differentiation
(Cavalli-Sforza et nl, 1994).
Since there are no apparent isolating mechanisms preventing human interracial
crosses, the various major isolated groups were probably never totally isolated
for long periods (Sutton, 1988). The words “long periods” are vague, but a
recent study of a base sequence in the pyruvate dehydrogenase El a subunit
gene on the X chromosome, suggests that non-Africans separated from
Africans about 200 thousand years ago (Harris and Hey, 1999).
The exchange of genes between populations reduces the genetic differences
Page 37
2 1
between them and as a result there are no absolute clear cut differences
between, rac 3. It is thought that previously there existed pure races, but these
have since become more or less admixed to produce present-day populations
which exhibit clinal variations of gene frequencies. Nonetheless, considerable
physical, morphological and genetic differences exist between populations
which are culturally, politically and geographically distinct, but which are
exchanging genes (reviewed by Chakraborty, 1986).
Admixture can be defined as the proportionate contribution of one or more
ancestral populations to the genetic constitution of a hybrid population (Adams
and Ward, 1973). It has mainly been associated with military invasions, slave
trading and selective expatriation by specific groups (Chakraborty, 1986) but
often occurs by a continuous slow infusion of individuals from one group into
another neighbouring group (Cavalli-Sforza, 1994).
The estimation of admixture involves determining the fractions of genes within
a hybrid population which have been contributed by its parental populations.
Information gleaned from such studies can be used to clarify historical
affinities between populations as well as the time of origin of hybrid groups
(Chakraborty, 1986).
Admixture analyses are also useful for understanding the relationship between
diseases and particular gene pools. For example, non insulin dependent
diabetes mellitus (NIDDM) has a relatively high prevalence in Amerindian
populations. Populations with a substantial component of Amerindian ancestry
also show an increased incidence of NIDDM. It has now been shown that
there is a direct association between increasing Caucasian admixture and a
decreasing prevalence of NIDDM among the Pima Indians of Arizona
Page 38
2 2
(reviewed by Long et al, 1991). However, it must be noted that an
environmental factor (dietary) would also influence the apparent prevalence.
Two main problems are associated with admixture studies. The first is the
difficulty of correctly identifying the parental populations and the second is the
assumption that gene frequencies in parental and hybrid populations have
remained the same since the time of mixing (Adams and Ward, 1973; Cavalli-
Sforza, 1994).
A notable effect of genetic admixture is that it often leads to an increase in
linkage disequilibrium. Linkage disequilibrium refers to the non-random
association of alleles at different loci, which are syntenic and less than 50cM
apart. Admixture can also result in associations between alleles at loci
separated by more than 50cM or on different chromosomes. This is referred
to as gametic or population association (reviewed by Ewans and Spielman,
1995). In the case of gametic association, one would observe disequilibrium
between specific alleles at pairs of loci in recently admixed, genetically
divergent populations, with the difference between allele frequencies in the
parental populations determining the amount of disequilibrium present. In this
instance, the disequilibrium would decay rapidly (over a relatively small
number of generations), while one would observe a much slower decay of
disequilibrium with truly linked genes (Stephens et al, 1994). There will be
evidence of distorted haplotypic frequencies for many generations with tightly
linked polymorphic loci and the rate of decay will be a function c the
recombination frequency between those loci (Thomson and Klitz, 1987). In
theory, linkage disequilibrium present in a hybrid population can provide
information about the “parental” populations, provided that the degree of
linkage disequilibrium in the parental populations is known (Weir, 1996).
Page 39
1.6 THE MAJOR HISTOCOMPATIBILITY COMPLEX
23
George Snell introduced the expressions histocc patibility gene and
histocompatibility antigens in 1948 (Coleman et al, 1992), following Peter
Gorer’s discover)' that each individual possessed molecular markers on the
surface of most of its cells, which differentiated it from other members of the
same species. These molecular markers determined tissue compatibility and
were specified by a long array of genetic loci occupying a single region of
chromosome 6 (in man), termed the major histocompatibility complex (MHC)
(Klein et al, 1993). With the discovery of human leukocyte-associated
antigens, the human major histocompatibility complex became known as the
HLA system (Coleman et al, 1992) and codes for cell surface glycoproteins
involved in antigen presentation during development and also during an
immune response (Begovich and Erlich, 1995).
1.6.1 Gene location and layout
The MHC region is located at chromosome 6p21.3 in a dense cluster of genes
spanning about 4Mb of DNA and is present in a Giemsa light band which
indicates the presence of an abundance of transcribed genes (Rasko and
Downes, 1995).
There are three major subdivisions within the MHC cluster (see figure 1.2 for
a simplified schematic diagram of the MHC region). These subdivisions are the
class I, II and III genes. Class I genes span approximately 1.8Mb at the
telomeric end of the region (Rasko and Downes, 1995). Classical class I genes
include HLA -A, -B and -C, while HLA -E, -F and -G are known as
nonclassical class I genes. Two pseudogenes, HLA -H and -J, are also present
Page 40
24
(Tomlinson and Bodmer, 1995). The HLA -A locus lies about 1.3Mb from
HLA -B and -C which are 85kb apart. Class I gene encoded antigens consist
of an a chain which associates with the non-MHC encoded polypeptide, p2-
microglobulin, whose gene is situated on chromosome 15 (Rasko and Downes,
1995). The a chains are highly polymorphic, while (32-microglobulin is
monomorphic (Begovich and Erlich, 1995). A more detailed description of the
structure of class I antigens is given in section 1.6.2.
Class II genes are found at the centromeric end of the cluster and span
approximately 750kb (see figure 1.3 for a more detailed diagram of the class
II region). Unlike class I antigens, class II antigens (also discussed in more
detail in section 1.6.2) consist of an a and |3 chain, both of which are encoded
by genes situated in the MHC (Rasko and Downes, 1995). The a chains are
encoded by DPA1, DQA1 and DRA, while the P chains are encoded by DPB1,
DQB1 and various DRB loci. Pseudogenes within the class II region include
DPA2, DPB2, DQA2, DQB2 and DQB3 (Tomlinson and Bodmer, 1995).
Additional nonclassical genes in the class H region are DMA, DMB, DNA and
DOB (Klein et al., 1993). Situated between DP and DQ are the non-HLA TAP
and LMP genes. TAP genes encode transporters associated with antigen
processing and LMP (low molecular mass polypeptide) genes (Monaco and
McDevitt, 1984) encode products related to subunits of a large cytoplasmic
complex, the proteasome, thought to be involved in the degradation of proteins
in the cytoplasm (Monaco, 1992).
The DP locus differs from the other class II loci because both pairs of DP
genes (DPA1 and DPB1, as well as DPA2 and DPB2) are tail-to-tail in
orientation (as shown in figure 1,3). As of 1997, there were nine known DPA1
and 67 DPB1 alleles, but the identification of new alleles is an ongoing
Page 41
25
process. Most of the variation is contained within six variable regions within
exon2 (Meyer et al., 1997). Exon2 seems to be the region where virtually all
polymorphism is localized in the other functional class II molecules as well
(Begovich and Erlich, 1995).
Lying between class I and II loci is a heterogeneous collection of non-MHC
related class III genes which span 1.1Mb. Genes contained within this region
include the complement genes C2, C4 and factor B; the heat shock protein
gene HSP70; and the lymphocyte-secreted tumour necrosis factor genes TNF-
A and TNF-B (Rasko and Downes, 1995).
1.6.2 Structure of human leucocyte antigens
Class I antigens (shown in figure 1.4) consist of a single a chain of 40-45kD
which has a carbohydrate side chain of approximately 3kD. This glycosylated
chain is noncovalently associated with a nonglycosylated 12kD peptide chain
known as P2-microglobulin (Coleman et al., 1992).
There are three portions to the class I molecule: an intracellular, an
intramembrane and an extracellular portion. The extracellular portion can be
further subdivided into three domains: a l (residues 1-90), a2 (residues 91-
180) and cc3 (residues 181-272). P2-microglobulin binds to the a3 domain. The
class I epitopes (or antigenic sites) occur on the a l and a2 domains (Coleman
et ah, 1992).
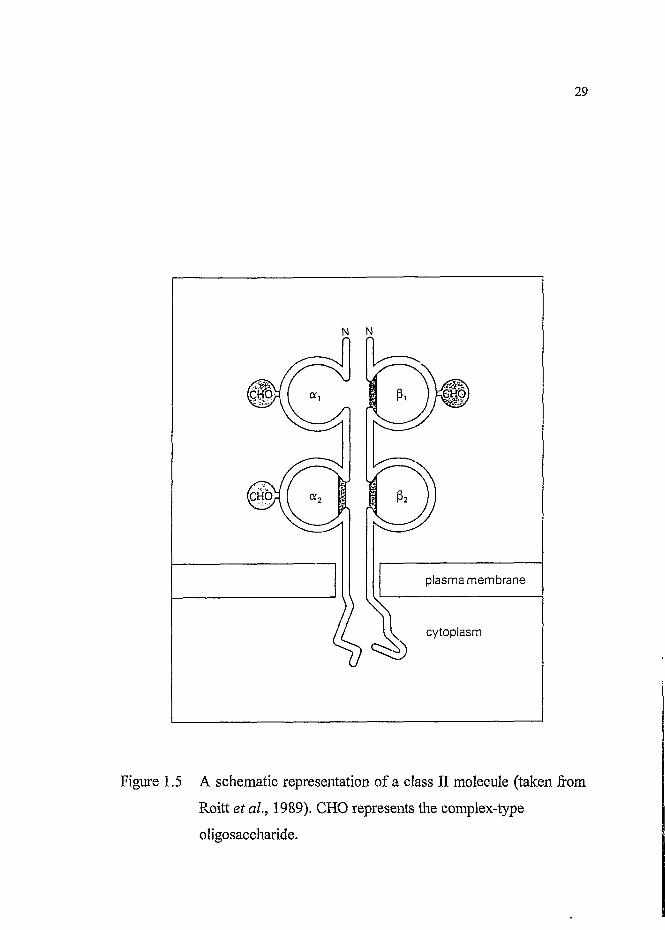
Class II antigens (shown in figure 1.5) consist of two transmembrane
polypeptide chains, joined by noncovalent forces. The a chain, consisting of
anal and «2 domain, has a mass of 34kD; and the P chain, consisting of a pi
Page 42
2 6
2 -1.2 23 •
12.2
11.2
22.3
22.32 [22.33 I
22.222.121.33
mgsg afca i
21.31
21.2
21.1
12.3
24.325.125.2 9 m25.3
26
27
1Mb
F
G
H
A
2Mb - HLA class I
1 Mb
TNFBTNFA
C2Bf
C4AC4B
CYP21
DRADRB9
DRB3DRB2DRB1
DQA1DQB1
D0B3DOA2DQB2
DPA1DPB1DPA2DPB2
}Tum our n eu o s is factor
Com plem entcom ponents
y 2 1 a hydroxylase
> HLA class II
Figure 1.2 A simplified diagram of chromosome 6 highlighting the MHC
region (taken from Tomlinson and Bodmer, 1995).
Page 43
27
•CLASS II REGION-
RINGZH IN G l\
KE3 \ l
KE4COUIA2 DPB1 DMA
KE5? D PA 2D PA 1 R |N g ^ A I / DPB21 I / DNA \ \
DMB D,QB2TAPI ITAP2 / d q A2 DC|B1 DRB1 DHS9
I T ' \ TIII! I D ! HI Ml II
0 100 KILOBASES
i200 300
I400
I500
I600
I700
—T-800
------- r -
300
II
1,0001— I
1,100
Figure 1.3 A more detailed diagram of the class II region. Black blocks
indicate HLA loci, while white blocks indicate non MHC loci
within the class II region (taken from Klein et al, 1993).
Page 44
2 8
alloantigenicsites
plasma membrane
-SH
HO1 cytoplasmHSi
COOH,OH
Figure 1.4 A schematic representation of a class I molecule (taken from Roitt
et al, 1989). CHO represents the carbohydrate side chain and (32
represents p2~microglobulin.
Page 45
29
CHO,
plasma membrane
cytoplasm
Figure 1.5 A schematic representation of a class II molecule (taken from
Roitt et a l, 1989). CHO represents the complex-type
oligosaccharide.
Page 46
30
and P2 domain, has a mass of 28kD. Each chain carries at least one complex-
type oligosaccharide. The slightly shorter P chain is the more variable of the
two and contains the alloantigenic sites (Coleman et al., 1992).
The polymorphic antigen binding site of class I and II molecules consists of P-
pleated sheets flanked by two a helixes. A single antigenic peptide ligand fits
into the groove of this binding site (Singh et al., 1997).
1.6.3 Assembly and intracellular transport of class II molecules
Assembly of class II molecules takes place in the endoplasmic reticulum (ER)
(Owen et al., 1981) and only properly assembled class II «P heterodimers
leave the ER (Sant et al, 1991). A third chain, the invariant or y chain,
associates transiently with the aP dimer during the biosynthesis of the class II
molecule. This third chain is not absolutely required for assembly and surface
expression of the ccP dimer, but increases the efficiency of the process
(Claesson-Welsh and Peterson, 1985). The y chain, which is a type II
transmembrane protein, is responsible for targeting the «P dimers to the
endocytic pathway and for preventing the binding of peptides to the dimers
while these are in the ER (Bakke and Dobberstein, 1990; Lotteau et a l, 1990).
In the ER, the y chain forms a homotrimer (Marks et al, 1990) and three class
II aP dimers attach to this and are transported from the ER (Roche et al,
1991) through the Golgi to the trans-Golgi reticulum. Here the class II
molecules are routed to the endocytic pathway (Neefjes et a l, 1990) where
they are directed to the endosomes by the targeting signal in the tail of the y
chain (Bakke and Dobberstein, 1990). This y chain is then degraded by
endosomal proteases (Blum and Cresswell, 1988). The degradation of the y
Page 47
31
chain is essential for the binding of internalized antigen (Roche and Cresswell,
1990; Teyton et ah, 1990) which arrives through a series of steps, firstly in a
coated pit, followed by early and late endosomes, and then the MIIC, a
compartment identified in B cells. Finally it moves on to the lysosome
(reviewed by Neefjes and Ploegh, 1992). During these steps in the endocytic
pathway, the antigen is broken down into peptides, some of which associate
with the class II molecules following degradation of the y chain. The efficiency
of peptide binding by class II molecules is aided by the low pH of the
endosome (Jensen, 1990). Exactly where on this endocytic route the class II
molecules bind peptides, and how the peptide-class II «P complex is
transported to the cell surface is not clear (reviewed by Neefjes and Ploegh,
1992). What is known for human B-lymphoblastoid cells, is that the class II
molecules take 1-3 hours to traverse the endocytic route and appear at the cell
surface (Neefjes et ah, 1990).
1.6.4 Antigen presentation
Antigens of intracellular and extracellular origin induce differing recognitions
and responses from the immune system. Intracellularly derived peptides from
antigens, such as proteins from viruses;, are presented to CD8+T cells by MHC
class I molecules which are expressed on virtually all cells. Binding of CD8+
T cells result in the death of the presenting cell. Extracellularly derived
antigens, for example, proteins in endosome related vesicles, are presented to
CD4+ T cells by the MHC class II molecules. These class II molecules are
found on specialized antigen presenting cells (Singh et ah, 1997) such as B
cells, macrophages and dendritic cells (Battegay et ah, 1996); although in
many other class II" cell types, IFNy can induce expression of class II
molecules (Steimle et ah, 1994). The CD4+T cells help B cells to produce
Page 48
appropriate immunoglobulins (Singh et a l, 1997).
32
It is believed that class II molecules can also present endogenous antigens
because antigens modified so that they are retained in the cytosol or ER can
still be presented by class II molecules (Weiss and Bogen, 1991).
For class I molecules, exons 2 and 3 encode the amino-terminal extracellu1 /
domains that function as the peptide-binding site and are the most variable
regions. The polymorphic residues line the peptide-binding cleft and interact
directly with the peptide and/or T cell receptor (Begovich and Erlich, 1995).
It is proposed that the peptide-binding portion of class II molecules is similar
to that of class I molecules (Bjorkman et ah, 1987). Crystal structures of class
II molecules reveal peptides lying in an extended conformation in a peptide-
binding groove on the surface of the MHC molecule (Stem et al., 1994). Some
peptide residues point down into the peptide-binding gn <sm.. i nteracting with
the MHC molecule; while others project up from the groove and are thus
accessible for recognition by T cell receptors (Bjorkman et al., 1987). Some
of the amino acid residues of a peptide are crucial for efficient binding to MHC
molecules and are called ‘anchor’ residues (Falk et ah, 1991). These make
bonds with the peptide-binding ‘pockets’ of the MHC molecule (Bjorkman et
ah, 1987) and define allele-specific peptide motifs (Singh et al., 1997).
Class I molecules bind peptides which are approximately nine amino acids
long (Hunt et al., 1992) whereas class II molecules bind peptides which are
13-17 amino acids long (Rudensky et al., 1991).
Class II-like genes encode a novel heterodimer, formed from the products of
Page 49
33
the DMA and DMB genes, that appears to facilitate antigen presentation by
MHC class II molecules (Morris et al., 1994; Fling et ah, 1994). This
heterodimer is not expressed on the cell surface, but co-localizes with class II
molecules in the endosomal compartments (Denzin et ah, 1994). It is believed
that this class II-like heterodimer functions either to: 1) bring processed
peptides into the specialized endosomal compartment (MIIC) for binding to
class II molecules, or 2) to act as a sink for class II associated invariant chain
peptide, or 3) to act as a molecular chaperone for class II molecules (Beckman
and Brenner, 1995).
The peptide transporter associated with antigen processing (TAP), was
formerly referred to as the peptide supply factor (PSF) (Colonna et ah, 1992;
Spies et ah, 1990) and is a member of the ATP binding cassette (ABC)
superfamily of transporters. This TAP is a heterodimer encoded by TAPI and
2 (Powis et ah, 1993) and serves to transport antigenic peptides, generated in
the cytosol, across the ER. where they are assembled with class I molecules
(Kelly et ah, 1992; Spies et a l, 1992), thus playing a role in maintaining
adequate levels of peptide f. -r binding to the class I molecules (Spies et ah,
1992).
Two other proteins, LMP2 and 7 are proposed to form part of the machinery
that produces peptides for transport by the TAP complex (reviewed by
Trowsdale, 1993).
1.6.5 Malfunctioning of class II expression
Absence of class H expression in all cell types is rare and is one feature of the
bare lymphocyte syndrome. It results in severe immunodeficiency, multiple
Page 50
34
infections, failure to thrive and often death (Griscelli et a l, 1989). Bare
lymphocyte syndrome results from a failure of class H gene transcriptio veith
et al., 1988). It is believed that transacting regulatory factors are responsible
for this because there is no co-segregation of the genetic lesions causing bare
lymphocyte syndrome with the MHC (de Preval et al., 1985).
The class II transactivator (CI1TA) is a. 1130 amino acid protein necessary for
constitutive expression of the class II genes on B cells and also plays a crucial
role in the overall modulation of class II expression on other cell types. In an
experiment to prove its regulatory function, it was shown that in class IT cells
there is no OITA expression, but after IFNy treatment CUTA is expressed and
the class II gene transcription follows (Reith et al., 1995). GITA is also
involved in the expression of HLA-DM and the invariant chain genes (Chang
and Flavell, 1995). A second regulatory factor for class II gene expression
exists; it is called RFX5 and, not surprisingly, has a DNA binding domain
(Reith et al., 1988).
1.7 F,VOLUTION OF THE MHC
Genes of the HLA region have been evolving for millions of years and much
of the current polymorphism predates the separation of humans and
chimpanzees approximately seven million years ago (Lawlor et al., 1988), and
even more significantly, the separation of mice and rats some ten million years
ago (Figueroa et al, 1988), Balancing selection appears to be in operation at
this cluster because the extent of allele loss due to genetic drift, for the time
that this region has been evolving, is less than expected (Takahata and Nei et
al., 1990). Another indication of the operation of balancing selection, is the
unusually even distributions of HLA allele frequencies within human
Page 51
35
populations without the predominance of any single allele (Hedrick and
Thompson, 1983).
The class II genes, in particular, appear quite well conserved between humpns
and a number of other species. Mouse and human class II genes appear
orthologous, i.e., it is relatively easy to trace the mouse and human class II
genes back to a common ancestor. For class I genes, this has been a difficult
and unsuccessful task (Boyson et ah, 1996). A large proportion of DRB1
polymorphism predates the separation of the lineages leading to humans and
chimpanzees (Klein et a l, 1990). The DQA1 1.2 allele was found to be
identical in sequence to the DQA1 1.2 equivalent in gorillas, indicating that
this allele is more closely related to its gorilla counterpart than to other human
DQA1 alleles (Gyllensten and Erlich, 1989).
With respect to the evolutionary relationship of class I loci between humans
and other species, there has been little conservation of exon2 at the A or B loci
during the 35 million years since rhesus monkeys and humans were thought to
have last had a common ancestor. Also, as mentioned previously, a common
ancestor for human and mouse class I genes has yet to be found (Boyson et al,
1996). Homologues of HLA -A, -B and -C, however, are present in great apes
(Lawlor et al, 1988; 1991); while a homologue of the HLA -C region has yet
to be found in the Old World primates. This suggests that the C locus is a
recent occurrence in great apes and humans (Boyson et al., 1996).
It is thought that class I and II genes arose by gene duplication and have
remained closely linked throughout evolution (Powis and Geraghty, 1995). The
advantage of gene duplication is that one copy can continue to perform its
normal function, while the other is free to assume a new or altered function
Page 52
36
(reviewed by Trowsdale, 1993). It is believed that the C locus is a duplication
of the B locus (Boyson et al, 1996).
A possible reason for keeping the MHC loci together in a cluster, is to aid in
the exchange of genetic information by recombination or gene conversion
(which has been shown to occur in mice) (Kuhner et a l, 1990). The DKB loci
appear to have been generated by recombination in primates (Renter et al.,
1992; Gyllensten et al., 1991) and gene conversion is suggested to occur in
exon2 ofDRBl genes in humans (Bergstrom et ah, 1998). Another possible
reason for a close clustering of HLA genes is that advantageous combinations
of alleles at different loci can be maintained. This is referred to as coevolution
of function (Trowsdale, 1993). The TAP and LMP genes, too have remained
closely linked to class I and II genes despite being totally unrelated to each
other and class I and II genes (Powis and Geraghty, 1995). However, as
described earlier, TAP and LMP gene products are involved with class I and
II molecules in the antigen presentation process.
The DRB1, DQA1 and DQB1 loci behave as a single evolutionary unit within
which extremely high linkage disequilibrium exists. Lower, yet significant
levels of linkage disequilibrium also exist between these loci and DPB1, which
is separated by approximately 500kb from the others (Klitz et al, 1995). The
recombination rate between DQB1 and DPB1 is approximately 0.8%
(Begovich et al, 1992) and yet alleles at the two peptide-transporter loci,
TAPI and 2, which are separated by only 15kb, appear to be in linkage
equilibrium. It is proposed that two processes are in operation here: a hot spot
for recombination between TAP 1 and 2; and strong selection on certain allele
combinations across the DR-DP region (Klitz et a l, 1995). This selection
probably aids in the fight against pathogens while avoiding harmful
Page 53
auto immunity (Kronenberg et al, 1994).
37
The DPB1 locus appears to be one of recent origin which has undergone rapid
evolution. It seems that diversifying selection on the DPB1 locus has
intensified in the lineage leading to humans (Gyllensten et a l, 1996). Indeed,
it has been found that inter-allelic gene conversion events between two DPB1
alleles during human spermatogenesis occurs at a high frequency (4.7 x 10"3)
(reviewed by Kronenberg et al, 1994).
In view of the similarity of DQA1 locus alleles in humans, chimpanzees and
gorillas, it has been suggested that point mutations, rather than interallelic
recombination events, are responsible for the diversity seen at this locus. Point
mutations do not erode allele similarity to the same extent as interallelic
recombination events would. It is generally assumed that the similarity
between the genes of these species is due to common ancestry, rather than
convergent evolution (Gyllensten and Erlich, 1989). However, convergent
evolution at the DRB1 locus has been proposed by Titus-Trachtenberg and
colleagues. In their study, an amino acid substitution present in the Cayapa
Indians of Ecuador, a population with reduced HLA class II allele variation
due to a bottleneck during colonization of the Americas, arose via a different
mechanism to the same amino acid change at the same position seen in Africa
(Titus-Trachtenberg et a l, 1994).
The amount of polymorphism in the HLA -DR to -DQ region has been shown
to be twice as extensive in West Africans than it is in North European
Caucasians (Olerup et a l, 1991). A possible explanation for the loss of more
than 50% of class II haplotypes in these Caucasian populations could be a
founder /bottleneck effect, as assumed for the Cayapa Indians, with the
Page 54
38
founding Caucasian population being too small to retain the complete range of
haplotypes (Olerup et al., 1991). This is, however, only valid if the ‘out of
Africa’ theory of human origins is correct.
1.8 HLA INVOT. VEMENT IN MATE SELECTION
In 1974 Lewis Thomas first suggested a relationship between human
reproductive biology, pheromones, individual odour and MHC types (Thomas,
1974). Mouse studies have shown that there is a link between body odour and
MHC gene variants (reviewed by Boyse et a/., 1991). One study showed that
mice tended to choose a mate which was different from themselves at MHC
loci i.e. negative assortative mating, presumably due to the MHC involvement
in body odour (Yamazaki et al., 1976). This negative assortative mating could
account for the observed excess level of heterozygosity at MHC loci and/or
assist in the avoidance of inbreeding (Beauchamp et ah, 1985). However, not
all strains studied followed this negative assortative mating; in one strain the
males preferred MHC-identical females (Yamazaki et ah, 1976).
Results obtained from human studies have also been conflicting. A study on
the South Amerindians found HLA -A and -B sharing proportions between
couples to be very close to those expected from random mating (Hedrick: nd
Black, 1997); whereas a study on Hutterites, a North American reproductive
isolate of European ancestry, revealed fewer matches of HLA haplotypes
(HLA -A, -B, -C, -DR, and -DQ) than expected, suggesting negative
assortative mating (Ober et ah, 1997),
Hedrick and Black pointed out that the genes or gene clusters within the MHC
which mediate mating preferences, if they exist, are not known. In their study.
Page 55
39
HLA -A and -B genotypes were analysed separately, whereas in the Ober
study an extended HLA haplotype was analysed. Thus, the haplotype study is
probably more indicative of HLA involvement in mate choice. Also, olfactory
receptor-like genes have been found in the MHC region, bringing up the
possibility of the MHC making use of the olfactory system as a supplementary
means of maintaining heterozygosity (Powis and Geraghty, 1995).
1.9 HLA AND AUTOIMMUNITY
Autoimmune diseases are a result of the immune system causing destruction
or disruption of the body’s own tissues and involve complex interactions
between genetic and environmental factors (Vyse and Todd, 1996).
All individuals should be bom free of autoimmune disease because clones
which are reactive with host antigens are destroyed when they are encountered
during foetal life (Adams, 1996). This changes, however, as one grows older
because although somatic mutations can result in the production of beneficial
clones of lymphocytes (to help us fight pathogens), clones of lymphocytes that
react with self antigens also arise (reviewed by Adams, 1996).
The clones that react with “self’ are called forbidden clones and can give rise
to a number of different types of autoimmune disease. The effects produced by
changes resulting from the presence of forbidden clones, fall into six groups:
1) the stimulation of a cell receptor, as occurs in Graves’ disease
2) the blocking of u cell receptor, as is seen in myasthenia gravis
3) the destruction of specific cells, as occurs in type 1 insulin dependent
diabetes meliitus (IDDM) and multiple sclerosis
4) complement-mediated cytolysis, as occurs in systemic lupus erythematosis
Page 56
40
5) perversion of a functional molecule, as occurs in C3 nephritic syndrome,
and
6) autoimmune disease caused by unknown means (Adams, 1996).
Establishing which alleles confer susceptibility to particular autoimmune
diseases has proved to be very difficult. Haplotypes associated with
susceptibility to IDDM, for instance, include DRB 1*0301 /DQA1*0501
/DQB 1*0201 and DRB 1*0401-5-7-8 /DQA1*0301 /DQB1*0302 (Valdes et
al, 1997). However, discrepancies between different population groups have
been observed, with different alleles conferring susceptibility in different
populations. Also, some alleles confer susceptibility in some populations and
protection in others (reviewed by She, 1996).
With respect to rheumatoid arthritis, two susceptibility alleles associated with
this autoimmune disease are DQB 1*0301 and *0302 (Zanelli et al, 1995).
Particular amino acid motifs at position 70-74 ofDRBl alleles also confer a
risk for developing this disease (Auger et a l, 1996). As mentioned for IDDM,
susceptibility allele discrepancies between different populations are apparent
here as well (Sattar et a l, 1990; Massardo et a l, 1990). Protection is offered
by some DRB alleles and this protection is dominant over susceptibility,
meaning that susceptibility genes can be seen in resistant individuals (Zanelli
et al, 1995). It has also been found that heterozygosity between protective and
nonprotective DRB1 alleles can result in less severe rheumatoid arthritis
(Deighton et a l, 1993).
In the case of coeliac disease, the presence of the haplotype DR3/DQA1*0501
/DQB1*0201 is a predisposing factor involved in susceptibility to the disease.
There is also evidence to suggest that the sex of the parent and the sex of the
Page 57
41
affected child greatly influences the risk conferred by this haplotype. In the
Petronzelli study, it was found that paternal transmission of the haplotype
occurred significantly more than expected to daughters with coeliac disease,
but not to sons with the disease (Petronzelli et a/., 1997).
Other alleles conferring susceptibility to autoimmune diseases include
DRB1*1501, in the case of multiple sclerosis, (Steinman et al., 1995) and
alleles DQB 1*0301 -0302 -0303 and -06, which have been implicated in the
incidence of Bullous pemphigoid, a subepidermal blistering disease (Delgado
et al, 1996). TAP2 alleles have also been associated with a predisposition to
autoimmune diseases, such as IDDM, but a direct cause and effect is hard to
establish in the light of the linkage disequilibrium between alleles at the TAP2
and HLA class II loci (Caillat-Zucman et al, 1995).
1.10 HLA AND TRANSPLANTATION
The outcome of a cell, tissue or organ transplant depends on the degree of
“matching” of the relevant transplantation antigens of the donor and recipient;
and the success of therapeutic immunosuppressive measures to prevent
rejection (Chapel and Haeney, 1993)
HLA loci are prominently involved in transplantation phenomena and play a
major regulatory role in cell-to-cell interaction and immune responses
involving obligatory self-recognition (Coleman et al., 1992).
Not all transplants require HLA matching. In liver or heart transplants and in
skin or corneal grafts, HLA matching is not essential for graft survival.
However, in renal and bone marrow transplants, HLA matching becomes
Page 58
essential (Chapel and Haeney, 1993).
42
HLA Class II matching, especially of DR, appears more important than class
I matching in renal transplantation; whereas a complete match of the MHC,
from an identical twin or HLA-identical sibling, is most ideal for survival of a
bone marrow transplant (Chapel and Haeney, 1993; Begovich and Erlich,
1995).
An immune complication of bone marrow transplantation is graft-versus-host
disease (GVHD), a pathologic process wherein the T lymphocytes in the
transfused donor marrow recognize the immunocompromised patient’s cells
as “foreign” and mount an immune response against them. This can lead to the
death of the recipient (Begovich and Erlich, 1995).
HLA matched sibs have HLA alleles which are generally identical by descent;
whereas HLA matched unrelated individuals have phenotypically matched
alleles which are indistinguishable by the methods used for HLA typing. It is
thought that the increased incidence of GVHD in marrow transplants between
HLA matched unrelated individuals could be due to the use of HLA typing
methods which failed to identify immunologically important genetic differences
at the HLA loci. Another possible explanation for GVHD in cases where the
HLA alleles are apparently matched, is the influence of non-MHC genes
(Begovich and Erlich, 1995).
HLA allele frequencies differ significantly between different racial and ethnic
groups, as do patterns of linkage disequilibrium. This information is important
when considering tissue donors (Begovich and Erlich, 1995). It has even been
suggested that surnames be used to create a database of potential
Page 59
43
transplantation donors because there is some coincidence between HLA
genetic structure and the surname pattern (Guglielmino et al, 1996).
Immune-privileged sites of the body include the testes, the anterior chambers
of the eyes and the brain. In these regions allogeneic or xenogeneic tissue
grafts are not rejected. In the brain and eye this is thought to be due to the lack
of lymphocyte surveillance (Barker and Biliingham, 1977). However, testes
have excellent lymphatic drainage (Head et a l, 1983) which makes testicular
tissue survival unique (Selawry and Cameron, 1993). When T cells become
activated, they express the cell surface molecule CB95 (also called Apo-1 or
Fas) (Trauth et al., 1989). This molecule is thought to deliver an apoptotic
signal to the T cell when it is bound by the CD95 ligand, thus allowing for the
disposal of lymphocytes after an immune response (Alderson et al, 1995).
CD95 ligand is highly expressed on the surface of testicular cells (Takahashi
et a l, 1994). When T cells recognise a mismatch on a grafted testis cell and
express CD95, they are promptly killed due to the ligand on the testis cell
(Bellgrau et al., 1995).
1.11 HLA AND ITS ROLE TN FOETAL TOLERANCE AND
INTOLERANCE
In 1953, Medawar, who was aware of the effects of maternal-foetal Rh
incompatibility, asked how it is possible that a pregnant mother can carry an
antigenically foreign foetus. It has since been established that there exists a
state of mutual tolerance between mother and foetus during normal gestation;
immune responses against foetal cells in the mother, and against maternal cells
in the foetus, are not elicited. It has also been established that classical HLA
antigens, responsible for rapid rejection of allografts in humans are not present
Page 60
44
on placental cells at the maternal-foetal interface. Maternal-foetal HLA
incompatibility is actually thought to be beneficial during pregnancy (Ober,
1998).
The foetal extravillous cytotrophoblasts that come into direct contact with
maternal uterine tissues during pregnancy, do not express any HLA class II
genes, which are strongly immunogenic. In addition, class I HLA -A and -B
loci are not expressed in trophoblast-cell populations. Therefore, expression
of the most polymorphic and antigenic HLA genes is suppressed in cells in
direct contact with the maternal immune system (Ober, 1998). What is
expressed at the maternal-foetal interface, is the nonclassical class I gene HLA
-G which is not very polymorphic. This relative lack of polymorphism, is
thought to be a possible reason for foetal allograft tolerance (Beckman and
Brenner, 1995; reviewed by Ober and Aldrich, 1997).
Postal class II antigens must be recognized by the maternal immune system
because maternal HLA antibodies are produced against paternally derived
class II molecules (Ober, 1998). A study by Nelson and colleagues also
suggests that there is maternal recognition of foetal class II molecules. The
Nelson study also found that there were differing maternal immune responses
to these antigens depending on whether there was compatibility or
incompatibility with the foetus (Nelson et ah, 1993).
The mammalian maternal immune system has been presented with unique
challenges during the evolution of the mammalian reproductive mode. For
continued survival of the species, there had to be immunological tolerance of
an allogeneic foetus, while maintaining antigenic diversity to fight pathogens.
There is a possibility that the expression of the minimally polymorphic HLA
Page 61
45
-G molecule at the maternal-foetal interface may facilitate the induction of
local tolerance, inhibit NK-celi activity, perform antigen presentation and
possibly immunomodulate the maternal T ceil populations in the uterus (Ober,
1998).
In the ease of recurrent spontaneous abortion (RSA) (reviewed by Gill, 1983)
and unexplained infertility (UIF) (Ho et al., 1994), it has been observed that
couples are more likely to share HLA antigens. Genetic defects in the case ol
RSA appear to localize to the HLA -B /HLA -DR /HLA -DQ region (Ho et a l,
1994). Rat experiments have identified an MHC-linked region that has
recessive genes influencing fertility, growth and resistance to chemical
carcinogens (Gill and K ^ 1979; Melhem et a l, 1993). Abnormal
phenotypes, such as partial ov complete sterility, retarded growth and enhanced
susceptibility to several chemical carcinogens, may result from deletions of the
MHC-linked genes (Lu et al, 1993; Gill and Kunz, 1979). This region in rats
corresponds to the B-DQ region in humans, suggesting that it may be involved
with normal growth control in humans as well (Jin et al, 1995).
Although DR alleles seem to be associated with RSA, and DQ alleles with
UIF, there is evidence that HLA antigens themselves are not the etiological
agents but rather are in linkage disequilibrium with a genetic defect responsible
for embryonic loss (Jin et a l, 1995).
L1?. HI,A AND INFECTIOUS DISEASES
In the early 1970's, clinical studies revealed a statistical correlation between
HLA antigens and certain for.ns of disease. This raised the possibility that
susceptibility to a number of different diseases may be markedly influenced by
Page 62
46
host genetic factors. These genetic factors affected the host’s immune response
to specific antigenic challenge and were found to be closely associated with
genes involved with HLA expression (M°Devitt and Bodmer, 1972).
A large number of human diseases, immunological and nonimmunological,
have been found to have a strong relationship with class II genes (Stastny et
ah, 1983). Heterozygotes at the MHC loci would have an increased capacity
to present a range of antigens from a range of pathogens compared to
homozygotes; and extensive polymorphism at the MHC region is thought to
make a population better able to cope with a large array of infectious
pathogens (Hill et al., 1991). Point mutations in the part of the gene encoding
the HLA antigen’s peptide binding groove, unlike for non-groove regions, give
rise to amino acid changes more frequently than they do to an unaltered
peptide sequence. This indicates that selection has been acting on the part of
the gene encoding this groove at some stage during evolutionary history
(Hughes and Nei, 1988; 1989).
The most frequent DPB1 allele in Africans is DPB1*01011. This allele, along
with some others, is thought to offer protection against malaria. It is
conceivable that there may be a specialized pathogen-driven selection and
tendency towards “homozygote advantage” in operation at this locus (Meyer
etal, 1997). Conversely, evidence for “heterozygote advantage” also exists.
In the Cti„e of a hepatitis B virus infection, individuals who are heterozygous
for HLA class II region genes, HLA-DR and HLA-DQ, are more likely to be
protected against a persistent hepatitis B virus infection (Thursz et til, 1997).
Class II genes have also been shown to be associated with other infectious
microorganisms. These include HLA -DQ and -DP alleles, implicated in
Page 63
47
susceptibility to onchocerciasis (river blindness) caused by a helminth (Meyer
et ah, 1994); and DQA1*0103 which has been found to be more frequent in
multibacillary lepromatous leprosy (LL) patients than in paucibacillary
tuberculoid leprosy (TT) patients. The frequency of DQA1*0102 is increased
in patients with borderline LL, while DQA1*0201 is decreased in LL patients,
compared to TT patients and controls (Rani et ah, 1993).
Why is HIV such a problem for the immune system? Two hypotheses have
been put forward. One is that HTV is a “new” pathogen, with the result that the
process of selection for genetic resistance to it has just begun (Kaslow et ah,
1996). The second is that HTV causes an autoimmune-like disease. It has been
hypothesized that HIV antigens mimic alloantigens and induce chronic
autoreactivity similar to GVHD (Habeshaw et ah, 1992). The reason for this
suggestion is that there are similarities between HIV-1 and MHC class II
molecules, and also that the binding site for HTV gpl20 envelope protein on
the CD4 molecule overlaps with the MHC class II binding site (Moebius et ah,
1992).
Similarly aged adults show highly variable rates of progression and
development of AIDS (Centres for disease control, 1987). A mechanism
which has been proposed for HIV-exposed but unaffected Gambian women is
that “protective” HLA alleles present immunodominant viral peptides that
generate a strong cytotoxic T cell response capable of neutralizing virus at the
time of exposure, thus preventing established infection and seroconversion
(Rowland-Jones et ah, 1995).
Numerous HLA class I alleles alone, a few class II alleles and a few HLA -A
alleles in conjunction with TAP alleles seem to show some M’l'u-nce of HTV
Page 64
48
sponsored disease progression. Some are associated with fast progression,
others with slow progression or long term non progression; some are
associated with frequently exposed HIV-seronegative individuals (Westhy et
ah, 1996).
1.13 USES FOR HLA TYPING
Apart from the need to type human leukocyte antigens before undertaking
transplantation, or when trying to determine susceptibility to specific
autoimmune diseases (Erlich and Bugawan, 1992), HLA molecules,
particularly DQA1, can be of use in the forensic sphere. HLA DQA1 has been
used frequently in forensic serology, stain investigations and for resolving
paternity disputes (Ambach et ah, 1996).
To be of meaningful use in the forensic sphere, a population distribution of
HLA alleles needs to be determined (Ambach et ah, 1996). Also, class I and
II polymorphisms are useful in unravelling the historic relationships between
ethnically distinct population groups and tend to confirm the results obtained
from linguistic studies (reviewed by Riley and Olerup, 1992).
1.14 ATMS OF THE PRESENT STUDY
1) To estimate HLA class II ailele and haplotype frequencies in major
Malagasy ethnic groups.
2) To use these data to investigate the genetic interrelationships of some of
Madagascar’s ethnic groups and their possible progenitors.
Page 65
CHAPTER TWO:
SUBJECTS AND METHODS
49
2.1 SUBJECTS
2.1.1 Malagasy individuals
Blood samples from unrelated Malagasy individuals were collected during the
course of six field-trips conducted by members of the Department of Human
Genetics, SAIMR, between 1992 and 1996. Each sample was associated with
the ethnic group to which the individual, from which it was obtained, belonged.
The first part of the project involved DQA1 typing (discussed in section 2.2.2).
Two different techniques were used here and different sets of ethnic groups
were analysed with each.
The following Malagasy ethnic groups were studied using the dot blot
procedure (section 2.2.2.1); sample sizes are given in brackets:
Antemoro (51) Antesaka (51) Merina (52)
Tsimihety (50) Betsileo (52) Sakalava (51)
Mahafaly (41) Antandroy (44) Antankarana (19)
Ethnic groups studied using the reverse dot blot procedure (section 2.2.2.2)
were:
Antemoro (50) Merina (50) Tsimihety (50)
The same individuals used in the reverse dot blot procedure, were used in the
second part of the project, which was the DPB1 typing (discussed in 2.2.3).
Page 66
50
2.1.2 African individuals
Two African groups, namely Zambians and the Tsonga. were included in the
study.
Zambian samples were collected by Professor A Flemming in 1996. In total,
50 unrelated Zambians were typed for DQA1 using the reverse dot blot
procedure. Although the Zambian sample was made up of individuals from
different ethnic groups, namely, Lozi (15), Nyanja (10), Bemba (15) and
Tonga (10), all were regarded as a single group for the purposes of analysis.
This was done because of the small number of individuals in each group.
The Tsonga occupy a region which stretches along the escarpment of the
northern Drakensburg into southern Mozambique (Nurse et al., 1985). During
this study, 50 samples from unrelated Tsonga individuals (some from paternity
testing) were used. All individuals were typed for DQA1 (reverse dot blot) and
DPB1.
2.1.3 Indonesian individuals
The Indonesian samples used during this study were provided by JB Clegg, of
the MRC Molecular Haematology unit of John Radcliff Hospital in Oxford.
The individuals from whom the samples were obtained came from two regions:
Ujung Pandang, in South Sulawesi, and Banjarmasin, in South Kalimantan
(Borneo).
Page 67
51
For DQA1 (reverse dot blot) typing, 28 individuals from South Sulawesi and
23 individuals from Borneo were used. For DPB1 typing, 39 individuals from
South Sulawesi and 26 from Borneo were used. Because of the relatively small
numbers, all individuals were regarded as belonging to a single group during
analysis.
2.2 METHODS
Details of solutions mentioned in this section are given in Appendix Al.
2.2.1 Processing of blood
In this investigation, white blood cells were used as a source ofDNA and this
was extracted by the salting-out procedure devised by Miller and colleagues
in 1988 (Miller et ah, 1988).
Blood was collected in tubes containing an anti-coagulant such as ACD or
EDTA and then centrifuged to separate the red blood cells, white blood cells
(buffy layer) and plasma. The red blood cells and plasma were stored
appropriately for use elsewhere and the white blood cell rich buffy layers were
stored at -20°C until required for DNA extraction.
The extraction method involved lysing the cells with a chilled solution of
sucrose and the detergent Triton X-100. The mixture was then centrifuged to
remove the unwanted lysed components which remained in the supernatant.
The cellular proteins present in the precipitate were then digested by
Proteinase K during an overnight incubation at 40°C. The incubation solution
contained T20E5 (a solution of the buffering substance tris[hydroxymethyl]
Page 68
51
For DQA1 (reverse dot blot) typing, 28 individuals from South Sulawesi and
23 individuals from Borneo were used. For DPB1 typing, 39 individuals from
South Sulawesi and 26 from Borneo were used. Because of the relatively small
numbers, all individuals were regarded as belonging to a single group during
analysis.
2.2 METHODS
Details of solutions mentioned in this section are given in Appendix Al.
2.2.1 Processing of blood
In this investigation, white blood cells were used as a source ofDNA and this
was extracted by the salting-out procedure devised by Miller and colleagues
in 1988 (Miller ef af., 1988).
Blood was collected in tubes containing an anti-coagulant such as ACD or
EDTA and then centrifuged to separate the red blood cells, white blood cells
(buffy layer) and plasma. The red blood cells and plasma were stored
appropriately for use elsewhere and the white blood cell rich buffy layers were
stored at -20°C until required for DNA extraction.
The extraction method involved lysing the cells with a chilled solution of
sucrose and the detergent Triton X-100. The mixture was then centrifuged to
remove the unwanted lysed components which remained in the supernatant.
The cellular proteins present in the precipitate were then digested by
Proteinase K during an overnight incubation at 40°C. The incubation solution
contained T20E5 (a solution of the buffering substance tris [hydroxymethyl]
Page 69
52
aminomethane and the chelating agent EDTA), SDS (a detergent) and
proteinase K, all of which were added in the order stated here. Following
incubation, the degraded proteins were “salted out” as a result of the addition
of a volume of saturated NaCl. The salted out proteins were removed by
centrifugation and the DNA was then precipitated by the addition of two
volumes of absolute ethanol. The precipitated DNA was “fished out” on the
disposable tip of an automatic pipette, washed once with ice cold 70% ethanol,
ah' dried and finally resuspended in TE buffer. From here, the DNA was stored
either at 4°C or -70°C.
2.2.2 DOA1 Typing
Two methods for DQA1 typing were tried. A dot blot procedure (discussed in
2.2.2.1) and a reverse dot blot procedure (discussed in 2.2.2.2).
2.2.2.1) DOA1 typing using a chemiluminescence dot blot procedure
2.2.2.1.1 PCR amplification:
Primer sequences:
5'- GOT GTA AAC TTG TAG CAG T -3' forward primer
5'- TTG GTA GCA GCG GTA GAG TTG -3’ reverse primer
(taken from the 12lh HLA workshop. Cape Town, South Africa).
The PCR reaction solution had a total volume of 25jli1 and contained the
following:
0.5jj.1 of the solution containing the DNA to be amplified
2.5jil of the buffer supplied with the Tag polymerase enzyme
Page 70
53
2.5 |il of a dNTP stock solution (each dNTP at a concentration of
1.25rnM in this stock)
I jj.1 of each primer (=25 pmoles)
1.5(j.l of 25mM MgCl2
ijil of SuperTherm Taq polymerase (s0.5 units) (Advanced Biotech)
15pl H20 (distilled and autoclaved)
1 drop mineral oil overlay
The amplification process was performed on a Hybaid thermocycler and the
cycling conditions were:
1 cycle 94°C for 1 min
55°C for 1 min
72°C for 30 sec
29 cycles 94°C for 30 sec
55°C for 1 min
72°C for 30 sec
1 cycle 72 °C for 5 min
Holding temperature of 25°C
The outcome of the PCR amplification process was determined by
electrophoresing 5(il of PCR product in a 2% Agarose gel (HOT Agarose,
supplied by FMC Bioproducts, made in 1XTBE and containing 0.3jig/ml
ethidium bromide). Amplicons were electrophoresed at approximately 4
volts/cm for half an hour and then viewed on a UV transilluminator. A
molecular weight marker, the Gibco ikb X ladder, was loaded on each gel, as
well as a negative control to check for the absence of spurious DNA
amplification.
Page 71
53
2.5gl of a dNTP stock solution (each dNTP at a concentration of
1.25mM in this stock)
lfa.1 of each primer (=25 pmoles)
1.5|al of 25mM MgCl2
l[il of SuperTherm Taq polymerase (=0.5 units) (Advanced Biotech)
15|il H20 (distilled and autoclaved)
1 drop mineral oil overlay
The amplification process was performed on a Hybaid thermocycler and the
cycling conditions were:
1 cycle 94°C for 1 min
55°C for 1 min
72"C for 30 sec
29 cycles 94°C for 30 sec
55°C for 1 min
72°C for 30 sec
1 cycle 72°C for 5 min
Holding temperature of 25°C
The outcome of the PCR amplification process was determined by
electrophoresing 5|il of PCR product in a 2% Agarose gel (HOT Agarose,
supplied by FMC Bioproducts, made in 1XTBE and containing O.Bjug/ml
ethidium bromide). Amplicons were electrophoresed at approximately 4
volts/cm for half an hour and then viewed on a UV transilluminator. A
molecular weight marker, the Gibco Ikb X ladder, was loaded on each gel, as
well as a negative control to check for the absence of spurious DNA
amplification.
Page 72
2.2.2.1.2 Dot blot procedure:
54
The remaining 20|il o f . ' ' '■ oduct was prepared for blotting onto a nylon
membrane by mixing it with approximately 220pi of denaturing solution (called
the PCR denaturing solution) and heating it at 65°C for 30 minutes. Following
this, an appropriate volume of PCR neutralizing solution was added. This
volume was determined beforehand by establishing the proportions of the
denaturing and neutralizing solutions, which when mixed together produced a
solution with a pH of 7.0 (Theophilus et ah, 1989). >
The single stranded PCR product was then transferred with the aid of a
vacuum onto a nylon membrane which had previously been soaked in 2xSSC
and assembled in the HYBRI • DOT ™ Manifold dot blot apparatus (supplied
by BRL, Life Technologies, Inc.).
Following the transfer of PCR product to the nylon membrane, the samples
were immobilized on the membrane by baking at 80°C for two hours.
2.2.2.1.3 Hybridization to biotinylated probes and chemiluminescent
detection of bound probe:
Eight probes were used to determine DQA1 types. The first seven were taken
from Helmuth et al, 1990 and the last one, from the 12th HLA workshop. Cape
Town (see table 2.1 for probe sequences).
Page 73
55
PROBE NAME PROBE SEQUENCE (5'-3')
DQA2 TTC CAC AGA CTT AGA TTT G
DO A3 TTC CGC AGA TTT AGA AGA T
DQA4 TGT TTG CCT GTT CTC AGA C
DQA1.1 CGT AGA ACT CCT CAT CTC C
NONDQA1.3 GTC TCC TTC CTC TCC AG
DQA1.2, 1.3,4 GAT GAG CAG TTC TAC GTG G
DQA1.3 CTG GAG AAG AAG GAG AC
DQA1.1, 1.2, 1.3, 1.4 ATG GCT GTG GCA AAA CAC
Table 2.1 Nucleotide sequences of probes used for the dot blot method of
DQA1 typing. All probes were 5’ biotinylated.
Page 74
55
PROBE NAME PROBE SEQUENCE (5'-3')
DQA2 TTC CAC AGA CTT AGA TTT G
DQA3 TTC CGC AGA TTT AGA AGA T
DQA4 TGT TTG CCT GTT CTC AGA C
DQA1.1 CGT AGA ACT CCT CAT CTC C
NONDQA1.3 GTC TCC TTC CTC TCC AG
DQA1.2, 1.3,4 GAT GAG CAG TTC TAC GTG G
DQA1.3 CTG GAG AAG AAG GAG AC
DQA1.1, 1.2, 1.3, 1.4 ATG GCT GTG GCA AAA CAC
Table 2.1 Nucleotide sequences of probes used for the dot blot method of
DQA1 typing. All probes were 5' biotinylated.
Page 75
56
Prior to probe hybridization, the nylon membrane was exposed to a
prehybridization solution which contained liquid block (Fluoresceine Gene
Images kit, Amersham) to bind to all available sites on the membrane. This
step took place in a 42°C waterbath for one hour. Following this, the
prehybridization solution was replaced with approximately 2.5ml of the
hybridization solution which consisted of liquid block, 20xSSC, 10% SDS,
hybridization component (Fluoresceine Gene Images kit) and 10 pmoles of one
of the eight labelled probes (sufficient for a blot size of 11cm by 8cm).
Hybridization was allowed to proceed in a 42°C waterbath for two hours.
Following hybridization, the membrane was put through four stringency
washes to remove non-specifically bound probe. These washes included two
5xSSC washes, each for five minutes at room temperature; a 2xSSC/0.1%SDS
wash, for 15 minutes at 58°C and a lxSSC/0.1%SDS wash, for 15 minutes at
58°C.
Prior to antibody binding, a blocking step was again carried out in order to
prevent non-specific binding of the antibody. This involved rinsing the
membrane for one minute in Buffer 1 and then standing it in pre-antibody
blocking solution for one hour at room temperature. Following this, the
membrane was rinsed for one minute in Buffer 1 and then for one minute in
Dilution Buffer (for equilibration purposes). The dot blot was then allowed to
stand for one hour at room temperature in the antibody solution which
contained 2.72E-03 U streptavidin-alkaline phosphatase conjugate (supplied
by Boehringer Mannheim) and 25mg Bovine Serum Albumen (Sigma fraction
V) in 5ml of Dilution Buffer.
Unbound conjugate was removed by washing the membrane for one minute in
Page 76
57
Dilution Buffer, then for half a hour in Tween 20 solution (three ten minute
washes), and finally for five minutes in Dilution Buffer. The membrane was
then stained with CDP-STAR™ (Fluoresceine Gene Images kit) by pipetting
400|il of a 1:1 dilution of this stain in Dilution Buffer, onto a glass plate and
placing the membrane on this (2 14 minutes each side to allow for even
staining). CDP-STAR™ is a chemiluminescent substrate for alkaline
phosphatase whose action converts the substrate to an unstable molecule which
produces light as it decays. The location of the bound alkaline phosphatase
conjugated probe can then be detected by placing an unexposed sheet of X-
ray film over the blot.
After the substrate had been applied, the membrane was incubated at 37°C for
15 minutes, to start the chemical reaction, and then the blot was exposed to
Cronex 4 X-ray film overnight, or longer if necessary.
2.2.2.1.4 Reprobing of the membrane:
The dot blots were used several times over by reprobing with different probes.
The previously used probe was first removed by soaking the blot in denaturing
solution for ten minutes, rinsing twice with distilled water, neutralizing for ten
minutes, rinsing twice again with distilled water and repeating the neutralizing
step. The membrane was then soaked in 2xSSC for five minutes, after which
it was ready for the prehybridization step.
2.22.2 DOA1 typing using a colorimetric reverse dot blot procedure
For this procedure, the Ampli TypeR HLA DQa PCR Amplification and
Typing kit, from Perkin Elmer, was used. The protocol followed, was that
Page 77
58
supplied with the kit with the exception that all the recommended solution
volumes were halved and the supplied strips were cut down the centre in order
to get 100 reactions out of a 50 reaction kit.
In brief, the procedure performed was a reverse dot blot method, where
labelled PCR product was allowed to hybridize to strips containing various
probes. Detection of PCR product bound to specific probes was by a
colorimetric reaction catalyzed by horseradish peroxidase-streptavidin
conjugate. The eight probes necessary for the identification of six common
DQA1 alleles, DQA1 1.1, 1.2, 1.3, 2, 3 and 4, as well as one control probe,
were present on the strips.
The PCR reaction solution had a total volume of 51 pi, the contents of which
(excluding the target DNA) were supplied in the kit. These included: i) a PCR
reaction mix containing biotinylated primers, dNTP’s and DNA polymerase in
buffer; and ii) 8mM MgCl2 stock. To 25).Vi ui each of these, Ipl of DNA was
added.
The amplification process was performed on a Hybaid thermocycler using the
following cycling conditions:
34 cycles 94°C for 1 min
60°C for 30 sec
72°C for 30 sec
1 cycle 72°C for 7 min
2.2.3 DPB1 Typing
The typing of DPB1 alleles was done by sequencing a PCR amplified section
Page 78
59
(exon2) of the gene. The procedure can be divided into four main parts: sample
preparation; gel preparation and electrophoresis; analysis using the sequence
analysis software; and identification of the alleles by comparing the sequences
obtained to the known allele sequences.
2.2.3.1.1 Sample preparation:
Sample preparation involved a two-step PCR process (initial and secondary)
with specific cleaning processes after each PCR reaction.
Primary and secondary PCR reactions made use of the same primer set:
5'- GCT GCA GGA GAG TGG CGC CTC CGC TCA T -3' forward primer
5'- CGG ATC CGG CCC AAA GCC CTC ACT A -3' reverse primer
The primary PCR reaction solution used for DPB1 typing contained the same
concentrations of constituents as described for the DQA1 (dot blot) PCR
reaction (section 2.2.2.1.1). The only modifications were that the total volume
for the DPB1 reaction was 51 pi instead of 25 pi and lOpmoles of the DPB1
specific primers were substituted. In some cases 0.6pl of 2.5mM spermidine
was added to PCR mixtures containing DNA which did not amplify readily.
The conditions of the primary PCR reaction were taken from Bugawan et al.
(1990) and were as follows:
30 cycles 95°C for 30 sec
65°C for 30 sec
Holding temperature of25°C.
As was the case for the DQA1 PCR reaction, PCR product was checked by
Page 79
electrophoresing it in a 2% Agarose gel.
60
Prior to the secondary PCR reaction, the PCR product was cleared of excess
dNTP’s and other substances which could interfere with the secondary PCR
reaction. This cleaning process involved adding 1 pi of a mixture of E. Coli
exonuclease I (=5 units) and shrimp alkaline phosphatase (= 1 unit), to 5pl of
PCR product and then incubating this for 15 minutes at 3 7°C, followed by a 15
minute incubation step at 80°C. The exonuclease I “removes” ssDNA such as
primers and the shrimp alkaline phosphatase “removes” excess dNTP’s.
The secondary PCR reaction was the so-called cycle sequencing reaction,
during which dye chain terminators were incorporated into growing strands of
DNA. The reaction solution contained: four different dichlororhodamine
tagged ddNTP’s (dRUO, dTAMRA, dROX and dR6G), as well as non
labelled dNTP’s (dITP, dATP, dCTP, dTTP), Ampli Taq DNA polymerase FS,
MgCl2, and buffer, all of which were in a solution supplied by Perkin Elmer
Applied Biosystems in the ABI Prism dRhodamine terminator cycle
sequencing ready reaction kit.
To the 6pl of cleaned DNA solution, 4pl of the kit “mix” (for sequence length
of about 300 bases) was added, as well as two thirds of the amount of primer
used in the primary PCR reaction. No oil overlay was needed because a
Hybaid touchdown thermocycler fitted with a heated lid, was used.
The amplification program was as follows:
25 cycles 96°C for 30 sec
50°C for 15 sec
60°C for 4 min
Page 80
Holding temperature of 10°C
61
The PCR products were stored in the dark because the fluorescent molecules
which had been incorporated into the amplified DNA are light sensitive.
Following the secondary PCR, the products were once again cleaned to
remove excess unincorporated labelled ddNTP’s which would interfere with
the reading of the fluorescent signals. Various cleaning protocols given in the
ABI Prism dRhodamine terminator cycle sequencing ready reaction kit manual
were tried. These included: ethanol / sodium acetate precipitation, ethanol /
MgCl2 precipitation and Centri-Sep spin columns (from Princeton Separations).
All the methods were performed as directed in the manual and are not
described here. The cleaning method ultimately used employed Sephadex spin
columns and was performed as follows: a slurry of Sephadex G50 was
prepared by mixing Sephadex and water in a ratio of Ig Sephadex to 16ml
ddH20. The sluny was allowed tu equilibrate overnight at 4°C and then
columns were prepared by pipetting 0.9ml Sephadex slurry into old Centri-Sep
column containers which had been well cleaned with ddH20. Before loading
the samples, excess water in the columns was allowed to drain away for fifteen
minutes and then each column was centrifuged for two minutes at 3000g to
remove the remaining excess water. The samples were then cleaned as per the
Centri-Sep cleaning protocol, which involved loading 20pi of the cycle
sequencing PCR product onto the top of the Sephadex column matrix and then
centrifuging for two minutes at 3000g to obtain the purified DNA in an
Eppendorftube positioned below the column. Samples collected from columns
were vacuum dried for approximately one hour and then stored at -20°C
in the dark until required.
Page 81
2.2.3.1.2 Single stranded cloning of PCR product:
62
For a few selected samples, with unclassifiable results, single stranded cloning
was attempted.
The samples to be cloned were amplified as per the primary DPB1 PCR
reaction and then blunt ended with Klenow enzyme (2U/pl) for 40 minutes.
The PCR product was then centrifuged through a Sephadex column (as
discussed in 2.2.3.1.1) and ligated to Sma I digested M13mpl9, with ligase,
for two hours at room temperature. This was followed by heat inactivation of
the enzyme at 70°C for five minutes.
Transformation of JM101 {E coli) competent cells with DNA in a ligation mix
followed, by placing the competent cells, in the presence of CaCl2, and ligation
mix on ice for 40 minutes, heat shocking at 42°C for 90 seconds and then
replacing on ice. The cells were then mixed with a solution of molten salt agar
(60°C) containing IPTG, X-Gal and additional JM101 cells from an overnight
culture (lawn culture), and poured onto Luria Agar plates. Once this top agar
had set, the plates were incubated at 37°C overnight. A control plate was also
prepared with non-transfonned competent cells.
The overnight JM101 culture produced a lawn of bacteria across the entire
plate. Transformed cells containing vector were present in the form of plaques
on the lawn bacteria. Blue plaques indicated vector with no insert of target
DNA and white plaques indicated vector containing an insert, or as was found
to be the case in this study, a one base deletion in the vector’s Lac Z gene at
the cloning site.
Page 82
63
Plaques were harvested by placing the plug of agar on which they were
situated in a tube containing 2TY solution and untransformed JM101 cells; the
resulting culture was then incubated at 37°C with vigorous shaking for five
hours. Following this, the tube was centrifuged at 13000g to remove unwanted
components into the pellet and PEG added to the supernatant in order to
precipitate the phage containing the DNA to be extracted. Again the tube was
centrifuged and then stored at -20°C until required for the isolation of the single
stranded DNA.
Single stranded DNA was extracted fiom blue and white plaques using a
sodium acetate and phenol / chloroform method and then electrophoresed on
a 1% agarose gel to look for a band shift which would indicate the presence
of a DNA insert.
The single stranded DNA extracted fiom white plaques was used directly in
the cycle sequencing PCR reaction, using the M l3 -40 primer, and the
products then prepared for loading on the sequencing gel in the same manner
as the non-cloned samples (described in 2.2.3.1.1).
2.2.3.2 Automated DNA sequencing:
A 4.3% acrylamide gel was used for electrophoresis of the samples. The gel
“mix” contained urea, TBE, acrylamide-bisacrylamide and ddH20. This was
filtered and then stored at 4°C in the dark. Just prior to pouring the acrylamide
gel, APS (which initiates the crosslinking reaction carried out by the bis-
acrylamide) and TEMED (a catalyst) were added. The gel was poured into a
gel mould (held in a gel pouring apparatus supplied by Perkin Elmer) which
consisted of two 36cm long glass plates held 0.2mm apart by spacers. The gel
Page 83
was allowed to set for at least one hour before use.
64
The dried DNA samples from the cycle sequencing reaction were rehydrated
in 3jli1 of a fonnamide dye, denatured at 94°C for at least two minutes and
loaded directly onto the vertical gel assembled in the ABI Prism 377 DNA
Sequencer. The ABI Prism 377 DNA sequencer was the apparatus used for
electrophoresis and data collection. Conditions of electrophoresis as specified
by the data collection software (ver 2.1) were as follows: voltage, 1.68kV;
current, 18.4mA; and gel temperature, 51°C. The electrophoretic run was
seven hours long.
Four fluorescent dyes, namely, dRUO, dR6G, dTAMRA and dROX, were
present in the cycle sequencing PCR reaction, each one attached to a different
ddNTP. Each dye emits a different spectrum of wavelengths when excited by
the instrument’s laser light. As each fluorescently labelled band reaches the
end of the gel, it is exposed to light from the laser and as a result, emits light
of a wavelength which is characteristic of the dye at its 3' end. The light signal
is converted to an electrical signal and recorded by the ABI Prism Collection
software.
Following electrophoresis, the gel was analysed with the sequencing analysis
software (ver 2.1.2) (ABI) and sequences printed out for comparison to known
sequences.
See figure 2.1 for the nucleotide sequences of some of the DPB1 alleles
studied. Regions A to F are the six polymorphic regions which characterize the
alleles. Dashes indicate consensus with the sequence of the DPB1*0401 allele
(taken from Bugawan et al, 1990).
Page 84
DPB1*04Q10PB1*0402DPB1*0201DPBI’0202DPBV1901DPB1*O0O1DPB1*1601DPB1*0501DPB1*0301DPBI‘0601DPBI‘1101DPBI'1301DPt)1*0101DPDI’1501DPBV1B01DPB1-0901DPBVIOOIDPBV1401DPB1*1701
1 0 1 5 2 0 2 5 3 0A s n T y r L e u P h e G I n G 1 y A r g G i n G I n C y s T y r A I a P h e A s n G I y T h r G I n A r g P h e L e u G I u A r g T y r l I e T y r A s n A r g G I u G I u
A G A A T T A C C T T T T C C A G G G A C G G C A G G A A T G C T A C G C G T T T A A T G G G A C A C A G C G C T T C C T G G A G A G A T A C A T C T A C A A C C G G G A G G A G
T T T T T T T T
G _ G _ A _G _ G _ A _G _ G _ A _G G _ A _G _ G _ A ______________G _ G _ A ______________G G _ A ____G _ G C A T TG _ G C A T TG _ G C A ___________T TG . G C A T T
DPE1*0401DPB1*04Q2DPB1*0201DPB1*0202DPB1*1901DPB1*06010PB1"1601DPB1-0501DPB1*0301DPB1*0601DPBI‘1101DPB1*1301DPB1*0101DPBI‘1501DPBI‘ 1801DPB1*0901DPBI‘ 1001DPBI‘1401DPBI‘ 1701
3 5P h e A I a A r T T C G C G C G
_ T ______T ____
C T _T
_ T _T
C T _T ____
_ T_ A _______________ A _______________ A _______________ A ______________
T __ T
T _T _T _
4 0 4 5 5 0 5 5 6 0g P h e A s p S e r A s p V a l G l y G l u P h e A r g A l a V a t T h r G l u L e u G l y A r g P r o A l a A l a G l u T y r T r p A s n S e r G l n L y s A s p C T T C G A C A G C G A C G T G G G G G A G T T C C G G G C G G T G A C G G A G C T G G G G C G G C C T G C T G C G G A G T A C T G G A A C A G C C A G A A G G A C
_ A A _ ___ __________ ____ ______________________________A A .A G _____A G __A A .A _ _ A A G _ _A A .
. A A .
DPB1*0401DPB1*0402DP31-0201DPB1-0202DPB1‘ 1901D P B ItdO lDPBI‘1601DPB1*0501DPB1*0301DPBI‘0601DPBI‘1101DPB1‘ 1301DPBI‘0101DPBI‘1501DPBI‘ 1801DPBI‘0901DPBVIOOIDPBV1401DPBI‘ 1701
6 5 7 0 7 5 8 0 8 5 9 0I l e L e u G l u G l u L y s A r g A l a V a ' , P r o A s p A r g M e t C y s A r g H i s A s n T y r G ' u L e u G l y G l y P r o M e t T h r L e u G l n A r g A r g A T C C T G G A G G A G A A G C G G G C A G T G C C G G A C A G G A T G T G C A G A C A C A A C T A C G A G C T G G G C G G G C C C A T G A C C C T G C A G C G C C G A G
A. G _ A .
. _ A. G _ A .
. G _ A .
. G _ A .
. G _ A
A _ „ A _ G _ _ G .A A _ G G .
. A _ A _ G _ _ G . A _ _ A _ G _ _ G . A _ A G GA A _ G _ _ G .
. A _ _ A _ G _ _ G .
. A . _ G _ _ G .
. A A _ G G .T _________T _____________ .
. A _ _ A _ G _ _ G .
. a „ _ a _ g _ _ g .
. A _ _ A _ G _ _ G . A _ A _ G _ _ G . 85
Figure 2.1 Nucleotide sequences (exon2) of som e DPB1 alleles. Dashes indicate consensus with the DPB1*0401 allele. Polymorphic regions are indicated in red.
Page 85
66
Figure 2.2 shows the expected (single letter code) amino acid sequences
corresponding to the nucleotide sequences of the alleles identified for
comparison. Allele sequences 1-56 (numbering on right hand side of figure 2.2)
were taken from Zangenberg et al, 1995 and the alleles corresponding to
numbers 54-56 were newly described and thus termed new 1-3. Allele
sequences 57 and 58 were taken from Versluis et al, 1995. Sequences 59-61
appear to be hitherto undescribed alleles which were characterized during the
present study. Sequences 62-71 were found during a BLAST search of
Genbank, and were named BLAST 1-10. Sequences 72-82 were found during
an ENTREZ search of Genbank. Some had allele names and the rest were
called ENTREZ 1-7. The Internet searches were performed in October 1998.
Question marks indicate incomplete sequence.
Figure 2.3 shows the cloning site and surrounding sequence of the cloning
vector, M13mpl9 (Norrander et a l, 1983).
2.2.4 Statistical analyses
2.2.4.1 Frequency distributions;
Two types of frequency distribution were calculated from the observed HLA
results: allele frequencies for the two HLA loci, DQA1 and DPB1; and
estimated DQA1-DPB1 haplotype frequencies. The latter were estimated with
the software package Arlequin ver 1.1 (Schneider et a l, 1997). The gametic
phase of the genotypic data is unknown, therefore, haplotype frequencies were
estimated using a maximum likelihood method which employed an
Expectation-Maximization (E-M) algorithm. Frequencies were calculated for
each of the population groups.
Page 86
DPBT0401 N Y L F Q G R Q E C Y A F N G T Q R F L E R Y I Y N RE E F ARF DS DVGE F RA VT E L GRP AAE Y W NSQKDI L E E KRAVP DRM CRHN Y E L GGP MI L QRR 1DPB1‘0402 V DE 2DPB1*0201 V DE E 3DPB1*0202 LV E E 4DPB1*0801 V DE „ E V DEAV 5DPB1*1601 V D E „ E DEAV 6DPB1*0501 LV E DEAV 7DPB1*1901 V E E 1 DEAV 8DPB1*0701 V DEAV 9DPB1*0301 VY L V DED L V DEAV 10DPB1*0601 VY L V DED L E DEAV 11DPB1*1101 VY L Q Y L R DEAV 12DPB1*1301 VY L Y E 1 DEAV 13DPB1*0101 VY Y V DEAV 14DPB1*1801 VY V DE V 15DPB1*1501 VY Q Y L R V 16DPB1‘1401 VH L V DED L V DEAV 17DPBI‘1001 VH L V DE E V DEAV 18DPBI‘0901 VH L V DED E V DEAV 19DPB1*1201 VH L G S V DED E V DEAV 20DPB1*1701 VH L V DED E DEAV 21DPB1*2201 LV E E DEAV 22DPB1*2301 V 23DPB1‘2401 E 24DPB1*2801 DE L V 25DPB1*3101 L 1 DEAV 26DPB1‘3201 V DEV E 27DPB1‘3301 E 28DPB1‘3401 LV L 1 V 29DPB1*3801 P LV E DEAV 30DPB1‘3901 Y 31DPB1*4001 Y V 32DPB1*4101 DE F E 33DPB1‘4601 V DED E 34DPBI‘4701 V E E 35DPB1‘4801 LV DE E 36DPB1*4901 Y DE 37DPB1‘5101 DE 38DPB1*5301 Y DE V 39DPB1‘5001 VY V DED L V DEAV 40DPBT'2001 VY L V DED L DEAV 41DPBI‘2101 VY L LV E E DEAV 42DPB1*2501 VY L V DE L V DEAV 43
Figure 2.2 The amino acid sequences of all the alleles identified for comparison to nucleotide sequences obtained from the sam ples used in this study. Dashes indicate consensus with the DPB1*0401 allele.
Page 87
A B C D E F
DPB1*0401 N Y L F Q G R Q E C Y A F N G T Q R F L E R Y I Y N R E E F A R F D S D V G E F RAVT E L G R P A A E Y W N S QK D I L E E K R A V P D R M C R H N Y E L G G P M T L Q R RDPB1*2601 VY L Y V DEAVDPB1*2701 VY L Y DEAVDPB1*2901 VY L V DED L E V DEAVDPB1*3S01 VY L LV E DEAVDPBV3701 VY L V DE E V DEAVDPB1*4401 VY L LV DED L E V DEAVDPB1*5201 VY L V L V DEAVDPB1*3001 VH L V E E DEAVDPB1*3501 VH L V DED V DEAVDPB1*4501 VH L V DE L V DEAVNEW 1 VY Y E V DEAVNEW 2 VY L DED L V DEAVNEWS VY LDPB1*5501 VH L V E DEAVDPB1*5401 VH L V E E V DEAVTS013 V DE IMD 294 V DED IMD 258 V DEDBLAST 1 V DE NBLAST 2 V DE F EBLASTS H L V DEBLAST 4 V DE LBLASTS LV E E A EBLASTS VH LBLAST 7 L V VBLASTS V DE VBLAST 9 L V DEAVBLAST 10 VH L V DE E V DEAENTREZ 1 VH L V DED E DERVENTREZ2 VH L V DED E R S DEAVENTREZ3 AY V DE VDPB1*6301 LV DEAVDPB1*5801 VH L LV E DEAVENTREZ4 VH L Y DED E V DEAVENTREZ5 V DED L V D E A?DPB1‘7401 VY L Q Y L R VENTREZ6 ? ? V EE V DEAVWA2 VY L Y S V DEAVENTREZ7 - VH L ________ DED L V DEAV
1444546474849505152535455565758596061626364656667686970717273747576777879808182
Figure 2.2 (continued) Question marks indicate incomplete sequences and dashes indicate consensus with the DPB1*0401 allele.
Page 88
S ' - T C G T A T G T T G T G T G G A A T T G T G A G C G G A T A A C A A T T T C A C A C A G G A A A C A G C
T A T G A C C A T G A T T A C G C C A A G C T T G C A T G C C T G C A G G T C G A C T C T A G A G G A T
c c c c I g g g t a c c g a g c t c g a a t t c a c t g g c c g t c g t t t t a c a a c g t c g t g a c
T G G G A A A A C C C T G G C G - 3 '
Figure 2.3 Part of the sequence of the vector M13mpl9 showing the cloning site (indicated by an arrow).
Page 89
70
Allele frequencies were also calculated from phenotypic data (collected in the
laboratory by others) on various “serogenetic” gene markers in the Merina,
Antemoro, Tsimihety and Tsonga. These markers were PGM,, ABO, Rh, MN
and AGP. Corresponding allele frequencies for Indonesians and Arabs were
obtained from the literature (Cavalli-Sforza et a l, 1994). DQA1 allele
frequencies for Arabs were also obtained from the literature (Helmuth et al,
1990).
2.2,4.2 Hardy-Weinberg equilibrium:
Checks for departure from Hardy-Weinberg expectation were done separately
on data collected on each of the two HLA loci. Again, the Arlequin software
package (Schneider et al, 1997), which uses a form of Fisher’s exact method,
was employed to do this. The significance of deviations from expected
heterozygosity was also tested for each of the loci, using a permutation based
program supplied by A.B. Lane, in order to determine whether the
heterozygosity levels were influencing the Hardy-Weinberg equilibrium results.
2.2.4.S Gene diversity:
This was calculated using the Arlequin software package and is equivalent to
the expected heterozygosity. The value given is also the probability that two
randomly chosen alleles or haplotypes, from a sample, are different (Schneider
et a l, 1997).
2.2.4.4 Pairwise linkage disequilibrium:
Evidence of global linkage disequilibrium between all possible pairs of alleles
Page 90
71
at the two HLA loci was assessed by the likelihood ratio procedure developed
by Slatkin and Excoffier (1996).
In addition, D’ values (Lewontin, 1964) were calculated for all possible
haplotypes per population group (based on the alleles present in each group);
as well as the expected number of chromosomes for each of those haplotypes
per group (results given in Appendix A2). D’ is an allele frequency
independent measure of linkage disequilibrium and can take values o f+1 to -1.
The haplotypes with an expected number greater than three were checked to
establish whether they were associated with a D’ value close to +1 or - 1,
which would indicate strong linkage disequilibrium.
2.2.4.5 Exact tests of population differentiation:
This was assessed by the Arlequin package which uses a modification of
Fisher’s exact test (Schneider et ah, 1997).
2.2.4.6 Population admixture estimations:
Admixture estimates are based on the principle that if an allele’s frequency in
different contributing populations is p,, p 2, ... p, and the relative fractions
contributed to the hybrid population by each are m,, m2, ... m, , then the
frequency of the allele in the hybrid population is expected to be m,p, + m2p2
+... + niiPi (Bernstein, 1931).
A way of lessening the effects of sampling error is to extend the analysis to
more than one allele at more than one locus (Elston, 1971). Elston’s (least
squares) method was used in the present study to estimate the possible
Page 91
72
contribution of an African, Indonesian and Arabian group to the genetic
constitution of a weighted average of three Malagasy groups.
2.2.4.7 Principal coordinate analysis:
The computer program Antana ver 1.5 (Harpending and Rogers, 1984/5), was
used to calculate the principal coordinates for a two dimensional scatterplot of
the HLA data and the non-HLA serogenetic data in various combinations.
Principal coordinate analysis is related to principal component analysis and can
also be referred to as PC analysis. It is a technique for simplifying multivariate
data with the minimum loss of information (Cavalli-Sforza et a l, 1994).
A matrix of allele/haplotype frequencies (rows) and population groups
(columns) was simplified using the singular value decomposition (SVD)
program in Antana, into five eigenvalues. Eigenvalues represent the proportion
of information contained within the principal coordmates. The two highest
eigenvalues are selected to produce two scaled vectors which are used to
create a two-dimensional scatterplot containing the most information from the
data.
Principal coordinates are calculated by plotting all of the allele/haplotype
frequencies, each one on a different axis (i.e., a multidimensional plot), for all
the population groups studied and then drawing a regression-type line, such
that the sum of the perpendicular distances o ' the points from the line are at a
minimum. New positions are allocated to the population groups along the
regression line, where they would lie if a perpendicular line was drawn from
their original position to the regression line. This new positioning is referred
to as the first principal coordinate. Similarly, a second principal coordinate,
Page 92
73
orthogonal to the first, is produced and so forth (Cavalli-Sforza et a l, 1994).
The first two principal coordinates were used to create the scatterplots seen in
chapter three (figures 3.4 and 3.5).
2.2.4.8 Genetic distance and phylogenetic tree construction:
The genetic distance between two populations is a single number which
represents the differences in allele frequencies, at one or several loci, between
them.
The package DSW (Ota, 1995) was used to calculate the genetic distances
between the ethnic groups studied and draw phylogenetic trees based on these
distances. Two types of genetic distances were calculated: Ds (Nei’s standard
distance which is calculated from the genetic identities of pairs of groups) and
Da (which has values which are similar to FST values and reflects differences
which have mainly arisen as a result of genetic drift). The neighbour joining
method of Saitou andNei (1987) was used for drawing the phylogenetic trees
from matrices of pairwise genetic distances.
Ds or Da genetic distances matrices generated from the DQA1 and DPB1 data,
as well as those generated from the non-HLA serogenetic data, were
correlated. A correlation coefficient between various pairs of matrices was
calculated in the way described by Mantel (1967).
Page 93
CHAPTER TRREF:
RESULTS AND DISCUSSION
74
3.1 D0A1 TYPING PROCEDTIR HS
The dot blot method of DQA1 typing proved to be unsatisfactory. Not all
signals on the blot were of equal intensity, which made interpretation of results
very difficult. Some samples produced strongly positive signals where there
should have been negative results, that is, some individuals appeared to have
three alleles. A more stringent final wash (with 0.75XSSC) was tried for
probes which had a GC content of more than 49%, but this did not make the
results more clear cut. In cases where results were weak, a doubled
concentration of probe was tried, but this did not improve the clarity of the
results because specificity was compromised. Thus it became clear that results
obtained by this method could not be trusted. Other possible explanations for
the failure of the technique to work effectively include: the use of fluorescent
labelling which is generally not as efficient as radioactive labelling; the use of
unquantified DNA; and the reuse of blots in order to reduce the amount of
reagents and DNA used (reuse of blots results in a decrease in the quality with
each subsequent use, thus separate blots for each probe would have been more
ideal).
At this point, the AmpliTypeR HLA DQa PCR amplification and typing kit
(Perkin Elmer) was used. The results obtained with this kit were taken to be
correct, because the control DNA, supplied with the kit, typed correctly and
the kit had undergone rigorous testing by the manufacturers. It was found that
only approximately 30% of samples which had been typed by the dot blot
method, had the same apparent genotype when typed with the Perkin Elmer
Page 94
75
reverse dot blot kit.
It was then decided to abandon the dot blot typing technique and type all
individuals with the reverse dot blot kit. Due to the expense of the kit however,
the number of Malagasy ethnic groups studied had to be decreased from nine
to three.
A further advantage of the reverse dot blot k'_ method, was that results were
obtained in a much shorter time than with the dot blot method. Following the
PCR reaction, each individual could be completely typed in the space of two
hours. With the dot blot method, the membrane took a minimum of three hours
to prepare and after that another one and a half days at least were required to
obtain a result.
Figures 3.1 and 3.2 depict a dot blot and several reverse dot blot strips,
respectively. The dot blot in figure 3.1 was probed with DQA 1.1,1.2,1.3,1.4
and, it just so happens, that all sample results for this probe, which were
subsequently typed with the kit, were correct. However, results obtained with
other probes were not always correct. In the case of the reverse dot blot strips
in figure 3.2, all dots darker than the control (C) were taken as positive.
Initially these strips were not cut down the centre as mentioned earlier; this
was only done later when it was established that the same results were
obtainable using half quantities of reagents and half of the strips.
3.2 DPB1 TYPING PROCEDURE
Three different cycle sequencing kits from Perkin Elmer were tried, namely the
ABI Prism ™ dye terminator cycle sequencing ready reaction kit (referred to
Page 95
76
Figure 3.1 A dot blot probed witii DQA1.1,1.2,1.3,1.4 using a doubled probe
concentration (20 pmoles). Exposure time was 2 % days.
Page 96
77
® 1 4 c , l £ t r a UIPUTYPEj> 1« 1 J W DO-Alph* t
® * C " ® , J ® ' J A AWPUTYPlM 24 V OO-Alpfe fe - , ^
1 • 1 S = 4 c ,., Q\j
i.i u £ u • s u n * ’# . -' * ’ ©
4 • c ?®'j fi © 6
»««** AUPLITVPeT
Figure 3.2 Reverse dot blot strips obtained using the AmpliTypeR DQa PCR
amplification and typing kit (Perkin Elmer). By way of example,
individual 5 is typed as DQA1 1.2 / DQA1 3; while individual
2 types to DQA1 1.1 /DQA1 1.3.
Page 97
78
as the original kit), the ABI Prism ™ dRhodamine terminator cycle sequencing
ready reaction kit and the ABI Prism ™ BigDye terminator cycle sequencing
ready reaction kit. The original kit rarely produced clearly readable results and
often produced ambiguous results at crucial parts of the sequence. The BigDye
kit was unpredictable; it sometimes gave excellent results but at other times
gave signals which were too intense to read. This kit seemed more dependant
on the template DNA concentration than the other two kits. The dRhodamine
kit was found to be more consistent at giving good results and was the kit of
choice.
Of the various cleaning methods tried, Centri-Sep spin columns were by far the
best, however, Sephadex spin columns were sufficiently good for obtaining
readable results and often gave results which were as good as those obtained
after Centri-Sep cleaning.
Figure 3.3 shows sequences obtained using the dRhodamine cycle sequencing
kit after Sephadex column cleaning. The sequences are from one of the six
polymorphic regions, namely, region A of the DPB1 gene. There are six
published variant sequences in this region which, in homozygous and
heterozygous states, give rise to 21 possible combinations. The sequences from
region A of three individuals are represented in the figure. Theoretically, peaks
obtained from an individual who is heterozygous at some point, should be
equal to each other and smaller than “homozygous peaks” (see the middle
panel). However, this is not always the case. In some instances, “heterozygous
peaks” were uneven, with one being half, or less than half, the height of the
other. In such situations, the sequence obtained from the opposite strand was
essential for correctly determining the base sequence on each chromosome.
Page 98
79
O T C C C T O O A C A G G T A A
BG T C N C T Q Q N A N A N
C T C r . C T O O A A A A G G T A A
!i i1 ISS'(if,
tl I
i V-
Figure 3.3 The output obtained from the ABI 377 automated DNA sequencer depicting three different sequence combinations (A-C) from region A of the DPB1 locus, from three different individuals. “N" indicates two even peaks at the same point i.e., heterozygosity (as seen in B). The third base here should theoretically also be an “N” because a “C” and “A” both occur at this point, however, the “C” signal was stronger, resulting in the computer allocating a “C" at this point.
Page 99
80
Due to the large number of combinations which are possible when the six
polymorphic regions are considered together, it is sometimes difficult to
deduce which haplotypes are present in an individual, bearing in mind that
sequences from two chromosomes are present. In some cases two or more
combinations of alleles would give rise to the same heterozygous sequence. By
way of an example, a particular heterozygous sequence could represent the
following possible combinations of alleles: DPB1*0201/*Q301 or DPB 1*0402/
*2901 or DPB1*2501/*4601 or DPB 1*0601/BLASTS.
Because of such phase uncertainties, between nine and eighteen samples had
to be removed from each group prior to statistical analyses, which to some
extent, may have biased the results. If there was a certain amount of population
substructure which resulted in the association of particular alleles at the same
locus in individuals, then discarding individuals who have one of these alleles
could result in some degree of error. After discarding ambiguous genotypes,
the number of usable samples remaining was as follows: 41 (out of 50)
Antemoro individuals, 41 (out of 50) Tsonga individuals, 40 (out of 50)
Tsimihety individuals, 36 (out of 50) Merina individuals and 47 (out of 65)
Indonesians.
In order *o avoid “loosing" samples because of uncertainties regarding phase,
cloning of PCR product, into a modified M13 phage, was attempted without
success. Unfortunately, limited time and resources prevented further work on
this technique. It is thought that the cloning attempts may have failed due to
biotin labels on the primers (the DPB1 locus was initaliy going to be used in
a reverse dot blot technique).
Page 100
81
3.3 STATISTICAL ANALYSES
3.3.1 Frequency distributions
3.3.1.1 Allele frequencies:
All six of the DQA1 alleles which can be detected with the AmpliTypeR HLA
DQa PCR amplification and typing kit (Perkin Elmer), were found to be
present in all of the populations studied. Additional subtypes of some of these
alleles are known (Migot et ah, 1995; Gyllensten and Erlich, 1988; Ambach
et al, 5 996 and Cullen et al, 1997) but the kit does not discriminate between
them.
Allele frequencies for the six DQA1 alleles typed during this study were
compared to frequencies reported for Indonesians (Helmuth et a l, 1990) and
the Merina (Migot et a l, 1995) in the literature. A significant difference
between the results reported in the Helmuth study and those obtained in this
study, was found. The significance of this difference was determined using an
exact method (Weir, 1996) which yielded a P value of less than 0.001. The
estimated frequencies of two alleles, namely, 1.2 and 4, seem to account for
a large part of the discrepancy. The Helmuth study found frequencies of 0.469
and 0.198, for the two alleles respectively; while frequencies obtained in the
present study were 0.235 and 0.461, respectively. No significant difference
was found between the allele frequencies reported by Migot et a l (1995) for
the Merina and those estimated in the present study; the exact P value was
0.599.
Of the 82 DPB1 allele sequences listed in figure 2.2, only 26 were apparent
Page 101
8 2
among the groups studied. Three of these do not seem to have been described
previously, i.e., they were not found among the 79 alleles described in the
literature or during BLAST and ENTREZ searches of the Genbank database.
For the purpose of this study, the apparent new alleles were named MD258,
MD294 and TSOI3, after the code designated to the individual in which they
were first seen. The MD258 variant was found in two Antemoro individuals
and three Tsimihety individuals. The MD294 variant was found in one
Tsimihety individual and the TSOI3 variant was found in two Tsonga
individuals. In total, eleven different D.PB1 alleles were found in the
Antemoro, thirteen in the Merina, fifteen in the Tsimihety, twelve in the
Tsonga and thirteen in Indonesians.
As was the case for the DQA1 locus, frequencies of some of the DPB1 alleles
found in this study were compared to those reported in the literature.
Moonsamy and colleagues (1992) reported the frequencies of three of the
DPB1 alleles they detected in their Indonesian sample, namely, DPB 1*2801,
*2901 and *3101. By comparing these allele frequencies with those generated
in the present study (treating all remaining alleles as a single allele), an exact
P value of less than 0.001 was obtained, which indicates a significant
difference between the two sets of data. Migot and colleagues (1995)
presented data on eleven alleles in the Merina. The comparison in this case
yielded a P value of 0.038, which is also significant.
The comparison of DQA1 and DPB1 allele frequencies found in this study,
with those reported in the literature, revealed that Indonesian frequency results
differed significantly for both loci; while the Merina frequencies differed for
the DPB1 locus but not the DQA1 locus. A possible explanation for the
significant differences seen for the Indonesians could be that the samples used
Page 102
83
in the present study were from different parts of this vast archipelago than
those used by Helmuth et al. (1990) and by Moonsamy et al. (1992); the
origins of the Indonesian samples in the literature are not mentioned. Sample
sizes were also quite different, however sample size is taken into account with
the exact method used. The Merina samples used by Migot et al. (1995) were
from a rural community living in Manarintsoa (on the highlands); whereas the
Merina individuals used in the present study came mainly from the capital city
Antananarivo. This may have contributed to the significant difference seen at
the more polymorphic DPB1 locus. Also, Migot et al. used an RFLP based
method to type the DPB1 alleles, a technique which could only detect 29 out
of the 59 DPB1 alleles known at that time. Thus, mistyping of alleles may have
been a possibility and a reason for the significant difference seen.
Table 3.1 lists the frequencies of alleles at the DQA1 locus as determined in
the present study and gives the Arab DQA1 results reported by Helmuth et al.,
1990. Table 3.2 gives the frequencies of the DPB1 locus alleles as determined
in the present study.
Looking at the DQA1 allele frequencies listed in table 3.1, the most note
worthy frequencies are those of the Tsonga and Tsimihety. The frequencies in
these two groups are extremely close, thus indicating a possible large Tsonga
contribution to the Tsimihety. The frequencies obtained for some of the alleles
in the Zambians, especially allele 1.2, differ quite considerably from those
obtained for the Tsonga and Tsimihety, indicating that the Zambians are not
a strong candidate “parental” group for the Tsimihety.
The alleles DPB1*01011 and DPB1*01012, listed in table 3.2, translate to the
Page 103
84
Allele AntemoroN=50
M erinaN=50
TsimihetyN =50
TsongaN=50
IndonesiansN=51
ArabsN=66
ZambiansN=50
DQA1 1.1 0.1500 0.1000 0.1700 0.1700 0.1961 0.0758 0.1300
DQA1 1.2 0.2300 0.1400 0.2700 0.2500 0.2353 0.2424 0.4200
DQA1 1.3 0.0900 0.1200 0.0700 0.0800 0.0294 0.1212 0.0800
D Q A 12 0.1100 0.0400 0.0700 0.0600 0.0392 0.1970 0.0300
D Q A 13 0.1100 0.0300 0.1000 0.1000 0.0392 0.1364 0.0400
D Q A 14 0.3100 0.5700 0.3200 0.3400 0.4608 0.2273 0.3000
Table 3.1 DQA1 allele frequencies from the present study together with
published data (Helmuth et al, 1990) on an Arabian population.
Page 104
85
same predicted amino acid sequence, but at the nucleotide level, there is a
silent G to A transition at position +43 (position shown in figure 2.1). Although,
the *01011 allele was found in all the population samples studied, the *01012
allele was only detected in Tsimihety and Tsonga individuals. It should be bom
in mind, however, that the actual numbers of allele *01012 observed in the
Tsimihety and Tsonga groups was small, two and one respectively. If larger
samples were obtained, the picture may not remain as clear. With respect to
other DPB1 alleles, it can be seen from table 3.2 that allele *1901 was also
only found to be present in Tsimihety and Tsonga individuals. Allele *2601
was shared by Merina and Indonesian individuals, while a number of alleles
were exclusive to particular groups. For instance, alleles *0501, *0901, *1401
and NEW2, were exclusive to Indonesians; allele *110! was exclusive to the
Tsimihety; alleles *3101 and *3301 were found exclusively in the Merina;
allele *3401 was exclusive to the Tsonga; and alleles *3901 and *4001 were
exclusive to the Antemoro. Apart from the alleles which appear to be newly
described in this study, namely, MD258, MD294 and TSOI3, all other DPB1
alleles were found in three or more of the five groups. Alleles *01011, *0201,
*0301, *0401, *0402 and *1301 were present in all five groups.
All of the *1301 alleles encountered in this study had a silent G to A transition
at position +43, as was the case for the *01012 allele, i.e., the reference
sequence for allele *1301 which is given in figure 2.1 was never seen. For the
purpose of this study, the allele was referred to as *1301 because it was the
only version of the allele seen.
A particularly interesting finding was that the DPB1 allele *0501 has a
frequency of0.1809 in the Indonesians, but was not found to be present in any
of the other groups studied, including the Merina. This is surprising because
Page 105
86
Allele AntemoroN=41
MerinaN=36
TsimihetyN=40
TsongaN=41
IndonesiansN =47
D P B I*0101I 0.3780 0.0833 0.3375 0.3780 0.0213
D PB1*01012 0.0000 0.0000 0.0250 0.0122 0.0000
D PBI*0201 0.0366 0.0833 0.0375 0.0244 0.0106
DPB 1*0202 0.0000 0.0278 0.0125 0.0000 0.0213
DPB 1*03 01 0.0366 0.1250 0.0500 0.0122 0.0426
DPB1*0401 0.0732 0.0417 0.0750 0.0854 0.1170
DPB 1*0402 0.1341 0.1250 0.1375 0.2317 0.0638
DPB1*0501 0.0000 0.0000 0.0000 0.0000 0.1809
DPB 1*0901 0.0000 0.0000 0.0000 0.0000 0.0213
D PB 1*1101 0.0000 0.0000 0.0125 0.0000 0.0000
DPB1*1301 0.2561 0.2639 0.1625 0.1098 0.3298
DPB 1*1401 0.0000 0.0000 0.0000 0.0000 0.0106
DPB1*1701 0.0122 0.0139 0.0375 0.0244 0.0000
DPB1*1801 0.0244 0.0139 0.0250 0.0732 0.0000
DPB1*1901 0.0000 0.0000 0.0125 0.0122 0.0000
D PB 1*2601 0.0000 0.0139 0.0000 0.0000 0.0106
DPB 1*2801 0.0000 0.1806 0.0250 0.0000 0.1596
DPB1*3101 0.0000 0.0139 0.0000 0.0000 0.0000
DPB1*3301 0.0000 0.0139 0.0000 0.0000 0.0000
DPB1*3401 0.0000 0.0000 0.0000 0.0122 0.0000
DPB 1*3901 0.0122 0.0000 0.0000 0.0000 0.0000
DPB 1*4001 0.0122 0.0000 0.0000 0.0000 0.0000
NEW 2 0.0000 0.0000 0.0000 0.0000 0.0106
MD258 0.0244 0.0000 0.0375 0.0000 0.0000
M D294 0.0000 0.0000 0.0125 0.0000 0.0000
TS013 0.0000 0.0000 0.0000 0.0244 0.0000
Table 3.2 DPB1 allele frequencies from the present study.
Page 106
87
the popular belief is that the Indonesians were a major contributor to the
Merina. It may indicate that the Indonesians, as represented here, contributed
to a lesser degree than was previously thought.
Table 3.3 gives the frequencies of the serogenetic markers which were
previously typed by others working in the same laboratory and which were
analysed by the author. (ABO, MN and Rh typed by Mrs C. Freeman; and
PGM and ACP typed by Mrs E. Ratshikhopa and Ms V. Ohlmeyer). The
corresponding frequencies in Indonesians and Arabs were taken from Cavalli-
Sforza et al., 1994.
Frequencies of note in this table include those of the PGM, locus. There is a
very close similarity between the frequencies of alleles at this locus in the
Antemoro and the Tsonga; as well as the frequencies in the Tsimihety and
Arabs. Apart from the PGM, and MN loci, the Arabs do noi. appear to have
influenced the allele frequencies in the three Malagasy groups, suggesting that
if they did contribute to the “genetic make-up” of the Malagasy, their input is
likely to have been relatively small. At the MN locus, the Tsimihety and
Indonesians were most similar. The cDe and CDe alleles of the Rh locus show
frequencies close to opposite extremities for the Indonesians and Tsonga, with
the Malagasy groups having intermediate frequencies. These two Rh
frequencies and to a lesser extent, the cde frequency, favour a greater
Indonesian input in the Merina; while the frequencies in the Antemoro and
Tsimihety favour a greater Tsonga input. For the AGP locus, the A and B
alleles in the Tsonga appear to have quite different frequencies from the
frequencies seen in the three Malagasy groups.
Page 107
Locus Antemoro Merina Tsimihety Tsonga Indonesians * Arabs*
PGM , 1 0.8133 0.6667 0.7222 0.8189 0.7440 0.7190
2 0.1867 0.3333 0.2778 0.1811 0.2560 0.2810
N 83 93 36 127 100 100
ABO A 0.1751 0.1489 0.1800 0.1671 0.1660 0.1510
B 0.1675 0.1593 0.1673 0.1168 0.1800 0.1130
0 0.6574 0.6918 0.6527 0.7161 0.6540 0.7360
N 91 158 150 127 100 100
M N M 0.6053 0.6227 0.5461 0.5669 0.5320 0.6600
N 0.3947 0.3773 0.4539 0.4331 0.4680 0.3400
N 95 163 141 127 100 100
RH cDe 0.4954 0.2729 0.4524 0.7227 0.0370 0.1650
CDe 0.2717 0.5934 0.3339 0.0697 0.8890 0.4230
CDE 0.0000 0.0000 0.0047 0.0017 0.0110 0.0050
Cde 0.0000 0.0017 0.0231 0.0000 0.0000 0.0090
cDE 0.0924 0.0337 0.0626 0.0815 0.0630 0.1500
cde 0.1404 0.0983 0.1232 0.1250 0.0000 0.2450
cdE 0.0000 0.0000 0.0000 0.0000 0.0000 0.0040
N 92 163 141 127 100 100
AGP A 0.3023 0.2570 0.2917 0.1181 0.3690 0.1650
B 0.6861 0.7009 0.6806 0.8386 0.6310 0.8150
C 0.0000 0.0280 0.0000 0.0000 0.0000 0.0200
R 0.01 Iti 0.0140 0.0278 0.0433 0.0000 0.0000
N 86 107 36 127 100 100
Table 3.3 Allele frequencies of the serogenetic markers used.
N equals the number of individuals typed.
* Because the exact sizes of Indonesian and Arab samples are
unknown, N=100 was used for the purpose of estimation.
Page 108
3.3.1.2 Haplotype frequencies:
89
The DQA1-DPB1 haplotype frequencies were estimated by the E-M method
which forms part of the Arlequin package. This program indicated that there
were 72 haplotypes with appreciable frequencies. The criterion used to classify
haplotypes as appreciable or trivial was that a haplotype had to have an
estimated frequency of greater than 1.000E-05 in order to be considered to be
appreciable.
Looking at each group individually, a total of 42 possible haplotypes were
estimated for the Merina, of which 26 were considered appreciable. Similarly,
26 out of 39 haplotypes for the Antemoro, 33 out of 49 haplotypes for the
Tsimihety, 28 out of 42 haplotypes for the Tsonga and 23 out of 43 haplotypes
for Indonesians, had frequencies in ", e. tegory.
From table 3.4, which lists the haplotypes which occurred in at least one group
at an appreciable fr equency, it can be seen that each group contains a number
of haplotypes which did not occur in any of the others. These will be referred
to as exclusive haplotypes even though many, or all, of them would lose this
status if larger samples were obtained. The Antemoro have six exclusive
haplotypes, the Merina have seven, the Isimihety have eight and the Tsonga
and Indonesians each have ten. Five haplotypes were found in all groups. The
haplotype frequencies were used for further statistical analyses.
As was the case for the (single locus) allele frequencies, some of the apparent
haplotype frequencies also suggest a lesser than expected contribution of the
Indonesians to the Merina. For example, the haplotype 1.2/1301 was found to
be at a frequency of0.13289 in the Indonesians and 0.05754 in the Tsimihety,
Page 109
90
A pparent haplotypes D Q A 1 /D P B 1 *
AntemoroN=41
MerinaN =36
TsimihetyN =40
TsongaN=41
IndonesiansN=38
1 .1 /01011 0.04076 0.00000 0.01314 0.09155 0.01316
1 .1 /0 2 0 2 0.00000 0.00000 0.01250 0.00000 0.00000
1.1 / 0301 0.00000 0.00000 0.00000 0.00000 0.02632
1.1 /0401 0.02439 0.00000 0.03203 0.00000 0.00000
1.1 /0 4 0 2 0.00000 0.00000 0.00000 0.01820 0.00000
1.1 /0501 0.00000 0.00000 0.00000 0.00000 0.02904
1 .1 /1 3 0 1 0.04461 0.09722 0.09233 0.06098 0.10254
1.1 /1 7 0 1 0.00000 0.00000 0.01250 0.00000 O.OOOUO
1.1 /1801 0.00000 0.01389 0.01250 0.00000 0.00000
1.1 '1901 0.00000 0.00000 0.01250 0.00000 0.00000
1 .1 /3 3 0 1 0.00000 0.01389 0.00000 0.00000 0.00000
1.1 /3901 0.01220 0.00000 0.00000 0.00000 0.00000
1.1 / 4001 0.01220 0.00000 0.00000 0.00000 0.00000
1.1 /M D 2 5 8 0.01220 0.00000 0.00000 0.00000 0.00000
1 .2 /0 1 0 1 1 0.06577 0.013 - 0.06684 0.05069 0.00000
1 .2 /0 1 0 1 2 0.00000 0.00000 0.02500 0.00000 0.00000
1 .2 /0201 0.03659 0.01389 0.01250 0.00000 0.00000
1 .2 /0 2 0 2 0.00000 0.02778 0.00000 0.00000 0.00000
1 .2 /0301 0.01220 ii .: i3 8 9 0.02500 0.00000 0.00000
1 .2 /0 4 0 1 0.01960 0.01389 00 1 3 1 2 0.05815 0.07587
1 .2 /0 4 0 2 0.06098 0.00000 0.00000 0.05438 0.00000
1.2 /0901 0.00000 0.00000 0.00000 0.00000 0.02632
1 .2 /1301 0.00000 0.00000 0.05754 0.00000 0.13289
1 .2 /1701 0.00000 0.00000 0.02500 0.00000 0.00000
1 .2 /1801 0.00000 0.00000 0.01250 0.01971 0.00000
1 .2 /2*01 0.00000 0.00000 0.00000 0.00000 0.01493
1 .2 /M D 258 0.00000 0.00000 0.01250 0.00000 0.00000
1 .2 /T S 0 1 3 0.00000 0.00000 0.00000 0.01220 0.00000
Table 3.4 Apparent DQ VI-DPB 1 haplotype frequencies :n the groups
studied.
Page 110
91
Apparent haplotypes DQA1 /D P B 1*
Antemoro Merina Tsimihety Tsonga Indonesians
1 .3 /01011 0.08537 0.04167 0.01396 0.00000 0.00000
1 .3 /0 1 0 1 2 0.00000 0.00000 0.00000 0.01220 0.00000
1 .3 /0201 0.00000 0.01389 0.02500 0.00000 0.00000
1 .3 /0 2 0 2 0.00000 0.00000 0.00000 0.00000 0.01316
1 .3 /0 3 0 1 0.00000 0.01882 0.00000 0.01220 0.00000
1 .3 /0401 0.01220 0.00000 0.01104 0.01502 0.00000
1 .3 /0 4 0 2 0.00000 0.00000 0.01250 0.02908 0.00000
1 .3 /0 5 0 1 0.00000 0.00000 0.00000 0.00000 0.01316
1.3 /13 0 1 0.00000 0.05063 0.00000 0.00000 0.00000
1 .3 /1 8 0 1 0.00000 0.00000 0.00000 0.01687 0.00000
1 .3 /1901 0.00000 0.00000 0.00000 0.01220 0.00000
1 .3 /N E W 2 0.00000 0.00000 0.00000 0.00000 0.01316
2 /0 1 0 1 1 0.07317 0.00000 0.01717 0.01220 0.00000
2 /0 2 0 1 0.00000 0.04027 0.00000 0.00000 0.00000
2 /0 3 0 1 0.01220 0.00000 0.00000 0.00000 0.00000
2 /0 4 0 1 0.00000 0.00000 0.00000 0.01220 0.00000
2 /0 4 0 2 0.00000 0.01528 0.05783 0.01220 0.01316
2 /0 5 0 1 0.00000 0.00000 0.00000 0.00000 0.02632
2 /1 7 0 1 0.00000 0.00000 0.00000 0.01220 0.00000
2 /T S Q 1 3 0.00000 0.00000 0.00000 0.01220 0.00000
3 / 0 ! O il 0.02488 0.00000 0.04607 0.03969 0.00000
3 /0 3 0 1 0.00000 0.013S9 0.00000 0.00000 0.00000
3 /0 4 0 2 0.03353 0.00000 0.02893 0.04568 0.00000
3 /1 3 0 1 0.01475 0.00000 0.00000 0.00000 0.00000
3 /1 7 0 1 0.00000 0.01389 0.00000 0.00000 0.00000
3 /1 8 0 1 0.02439 0.00000 0.00000 0.00000 0.00000
3 /2 8 0 1 0.00000 0.01389 0.00000 0.00000 0.05263
3 /M D 2 5 8 0.01220 0.00000 0.02500 0.00000 0.00000
3 /M D 2 9 4 0.00000 0.00000 0.01250 0.00000 0.00000
Table 3.4 (cont.) Apparent DQA1-DPB1 haplotype frequencies.
Page 111
92
Apparent haplotypes D Q A 1/D P B 1*
Antemoro M erina Tsimihety Tsonga Indonesians
4 /0 1 0 1 1 0.08810 0.02778 0.18033 0.18393 0.01316
4 /0 2 0 1 0.00000 0.01528 0.00000 0.02439 0.01316
4 /0 3 0 1 0.01220 0.07840 0.02500 0.00000 0.00000
4 /0 4 0 1 0.01699 0.02778 0.01880 0.00000 0.04255
4 /0 4 0 2 0.03964 0.10972 0.03824 0.07217 0.05263
4 /0 5 0 1 0.00000 0.00000 0.00000 0.00000 0.11570
4 /1 1 0 1 0.00000 0.00000 0.01250 0.00000 0.00000
4 /1 3 0 1 0.19674 0.11604 0.01262 0.04878 0.10668
4 /1 4 0 1 0.00000 0.00000 0.00000 0.00000 0.01316
4 /1 7 0 1 0.01220 0.00000 0.00000 0.01220 0.00000
4 /1 8 0 1 0.00000 0.00000 0.00000 0.03659 0.00000
4 /2 6 0 1 0.00000 0.01389 0.00000 0.00000 0.01316
4 /2 8 0 1 0.00000 0.16667 0.02500 0.00000 0.07718
4 /3 1 0 1 0.00000 0.01389 0.00000 0.00000 0.00000
4 /3 4 0 1 0.00000 0.00000 0.00000 0.01220 0.00000
Table 3.4 (cont.) Apparent DQA1-DPB1 haplotype frequencies.
Page 112
r93
but appears to be absent f;'om the Merina, Antemoro and Tsonga. A second
haplotype is that of4/0501 which was found to be at a frequency of 0.1157 in
the Indonesians, but was absent from all the other groups studied. This latter
finding, however, is another manifestation of the high *0501 allele frequency
in the Indonesians, mentioned above, and so is not additional proof for
questioning the degree of Indonesian contribution to the Merina.
Two haplotypes, 4/0402 and 4/2801, occur at a greater frequency in the
Merina than in the other groups and suggest the existence of an additional
“parental” group which was not studied. It is, however, possible that drift and
natural selection may have taken place on the island; factors which are not
taken into account. Other haplotypes suggesting the existence of additional
“parental” groups are 1.3/01011, 2/01011 and 4/1301 for the Antemoro and
2/0402 for the Tsimihety.
A haplotype which argues in favour of a large African, Tsonga-like,
contribution to the Tsimihety is 4/01011. This is also supported by the fact that
D’ for this combination is slightly higher in the Tsimihety than it is in the
Tsonga (0.341 vs 0.262) as would be expected.
3.3.2 Hardy-Weinberg equilibrium, gene diversity and linkage disequilibrium
All of these were assessed by using the Arlequin package and the results are
summarized in table 3.5. For the Merina, Antemoro, Tsimihety, Tsonga and
Indonesians, only samples from individuals with results for both DQA1 and
DPB1 were used during these analyses.
Page 113
94
Group and
size (num ber
o f
chromosomes)
Total number
o f apparent
haplotypes
with significant
frequencies
HW E: Exact
P
D Q A I locus
HW E: Exact
P
DPB I locus
Gene Diversity
(based on the
estimated
haplotypic data)
Probability that
global linkage
equilibrium
exists
Merina
72
26 0.32328
+/- 0.00095
0.01440
+/- 0.00030
0.9343
+ /-0 .0147
0.000229605
+/- 4.61739e-05
Antemoro
82
26 0.97776
+/- 0.00039
0.05357
+/- 0,00051
0.9377
+/- 0.0148
0.023060300
+/- 0.00050228o
Tsimihety
80
33 0.03166
+/- 0.00055
0.52422
+/- 0.00076
0.9712
+/- 0.0062
0.036676900
+/- 0.000597243
Tsonga
82
28 0.36202
+ /-0 .00118
0.12683
+/- 0.00049
0.9548
+/- 0.0087
0.182117000
+ /-0 .001225080
Indonesians
76
23 0.76148
+ /-0 .00115
0.85337
+ /-0 .00051
0.9330
+/- C.0149
0.159655000
+ /-0 .001153150
Zambians
100
0.93236
+/- 0.00084
* 0.7149
+/- 0.0278
Table 3.5 A summary of the results obtained using the Arlequin package.
* DQA1 locus only.
+/- figures indicate standard deviation.
Page 114
95
Both DQAI and DPB1 loci for the Tsonga and Indonesians, as well as the
DQAI locus for Zambians conformed to Hardy-Weinberg expectation. This
suggests that these are randomly mating populations and that factors such as
migration, mutation and selection are relatively unimportant. An exact P value
of more than 0.05 was considered to be indicative of Hardy-Weinberg
equilibrium, while a value of less than 0.05 was considered to be possible
evidence of disequilibrium. This means that one in twenty samplings are
expected to appeal- to not be in Hardy-Weinberg equilibrium even though the
population actually is. The Malagasy groups did not always conform tv.
Hardy-Weinberg expectation; the DQAI locus did in the Merina and
Antemoro, but not in the Tsimihety. The DPB1 locus conformed to Hardy-
Weinberg expectation in the Tsimihety, but not the Merina and although it did
in the Antemoro, the P value was close to 0.05. It seems that there are more
discrepancies than might be expected from sampling error and other factors
may be influencing results here. One such factor could be the possible
mistyping of alleles, which may occur if there are novel alleles existing in
particular population groups not being detected due to the phase of sequences
not being known. Another cause could be that the DQAI typing kit may be
“blind” to certain alleles in these populations (during development, the kit was
tested on U.S. Caucasoids, U.S. Hispanics, African-Americans and Japanese
individuals). A third factor could be population substructuring, which is
known to exist in the Merina. Negative assortative mating could also result
in a del ;table deviation from Hardy-Weinberg equilibrium as has been
shown to >ccur in Hutterites, a North American reproductive isolate of
European ancestry (Ober et al, 1997). Another possible cause for deviation
from equilibrium is natural selection, including overdominance.
Page 115
96
Overdominant selection or heterozygote advantage has been proposed to be
operational in the HLA region (Hughes and Nei, 1989). However, the
proportion of heterozygotes occurring at each locus, for each of the groups
studied, does not coincide with the discrepancies seen for Hardy-Weinberg
equilibrium, i.e., the level of heterozygosity does not appear to be influencing
the Hardy-Weinberg equilibrium (HWE) results. For example, the P value
obtained for the HWE assessment for the Tsimihety (DQAI locus) was
0.03166, indicating significant evidence of disequilibrium; while the
corresponding heterozygosity level had a P value (assessed by permutation;
program supplied by A. B. Lane) of 0.959, indicating that the heterozygosity
level was very close to what was expected. Similarly, when a P value of
0.85337 was obtained for the EWE assessment of the DPB1 locus of
Indonesians, indicating equilibrium, a significant excess of heterozygotes was
found (P=0.045). In the case of the DQAI locus of the Antemoro, high P
values were obtained for both the deviation from expected heterozygosity and
Hardy-Weinberg equilibrium; while low P values were obtained for both
assessments in the case of the DPB1 locus of the Merina.
Deviations from Hardy-Weinberg expectation can be caused by deficiencies
and excesses of particular genotypes without there being any overall excess of
deficiency of heterozygotes and this may be the case for some of the
population-system combinations referred to above.
During the gene diversity calculation, each haplotype was regarded to be a
single locus. High diversity values normally predict high observed
heterozygosity rates and all groups showed very high gene diversity. The
lowest diversity, 71.49%, was seen in the Zambian group, but this was based
on the less polymorphic DQAI locus alone. Despite this, the value obtained
Page 116
97
was still very high. The diversities of the remaining groups ranged from 93.3%
to 97.12% but it should be bom in mind that these values were based on the
estimated haplotype frequencies. Haplotype frequencies are more powerful
than the allele frequencies alone, for investigating relationships between groups
because there are many more potential haplotypes than single locus alleles.
For the detection of global linkage disequilibrium between DQAI and DPB1
alleles, a P value of less than 0.05 was considered to be indicative of
significant linkage disequilibrium. Alleles at the DQAI and DPB1 loci of the
Tsonga and Indonesians appeared to be in global linkage equilibrium, i.e.,
there appears to be a random association of alleles. However, the P values
obtained are not very high which suggests that a degree of linkage
disequilibrium may become more apparent if a larger sample was obtained.
There appears to be significant linkage disequilibrium between alleles at the
two loci in the three Malagasy groups studied. The most likely reason for this
is that these groups are derived from two or more parental populations who
had different haplotype frequencies and there has been insufficient time for
linkage equilibrium to be established.
In addition to checking for the existence of global linkage disequilibrium using
the Arlequin package, D’ values (Lewontin, 1964) were calculated for all
possible haplotypes in each of the groups (data tabulated in Appendix A2). A
D’ value o f +1 or - 1 would indicate that maximum linkage disequilibrium
exists, whereas a value of 0 would indicate that complete linkage equilibrium
exists. Although many of the haplotypes in each population sample exhibited
D’ values which were different to 0, only those haplotypes with high
indications of linkage disequilibrium and which had expected chromosome
numbers of greater than three were looked at.
Page 117
98
No haplotype among the Tsonga showed great evidence of linkage
disequilibrium. This is consistent with the global result obtained using the
Arlequin package. The two haplotypes showing the most evidence of
significant linkage disequilibrium were 1.1 / 3402 ( D’ = -0.537942 ) and
1.2/01011 (D’= -0.463598).
Among the Indonesians, one haplotype, 1.2/0501, showed complete linkage
disequilibrium, with a D’ value of -1, indicating that despite being expected,
it was not observed. This haplotype was not expected to be present in any of
the other groups due to the apparent absence of the *0501 allele from these
groups. No other haplotype showed much evidence of linkage disequilibrium,
the rest having D’ values less than those mentioned for the Tsonga.
A different picture was seen among the Malagasy groups where more
haplotypes showed evidence of linkage disequilibrium. The three haplotypes
among the Antemoro which showed the most evidence of disequilibrium were
1.2/1301 (D’= -1), 4/1301 (D’= 0.664081) and 2/01011 (D’= 0.461707).
Among the Merina, four haplotypes with substantial evidence of linkage
disequilibrium were 4/2801 (D’= 0.820624), 4/0402 (D’= 0.715721), 4/0201
(D’= -0.678187) and 4/01011 (D'"- -• 4 J 4924). The only two haplotypes
showing substantial evidence of disequilibrium among the Tsimihety were
i .1/01011 (D’= -0.77098) and 4/1301 (D’ = -0.757308). Again the picture
seen here is consistent with the probabilities given in the last column of table
3.5, where significant linkage disequilibrium between alleles at the two loci
was found among the Malagasy groups and not the two “parental” groups.
Page 118
99
3.3.3 Population differentiation
The results of the test done to detect significantly different allele frequency
distributions between pairs of groups, are shown in tables 3.6 and 3.7. Table
3.6 shows results from DQAI allele frequency data and includes Zambian
data. Table 3.7 shows results from DPB1 allele frequency data. These
population comparisons were calculated by Arlequin and results are given in
the form of exact probabilities, with a P value of less than 0.05 indicating a
possible significant difference.
When assessing the DQAI data, the Merina were found to be significantly
different from all other groups, which, as mentioned previously, suggests that
the Indonesians may not have contributed as much to the Merina as is believed.
No significant difference was found between Indonesians and African groups,
which was surprising.
When populations were compared by using the DPB I data, more significant
differences were apparent. Indonesians were found to be highly significantly
different from all other groups; the group to which they were least different,
was the Merina. The Merina were also highly significantly different from the
Antemoro and Tsonga. Being very different from both “parental” groups
studied, strongly suggests the existence of a additional “parental” group(s).
The DPB1 data also revealed a relatively high similarity between the Tsimihety
and Tsonga.
Being a more polymorphic locus, the DPB1 results are probably more
informative and indicative of the actual population relationships than the
DQAI results are.
Page 119
100
Antemoro Indonesians Merina Tsimihety T songa
Indonesians 0.22765
+ /-0 .0133
Merina 0.03436
+/- 0.0099
0.04700
+/- 0.0096
Tsimihety 0.37017
+/- 0.0098
0.38625
+ /-0 .0140
0.00000
+/- 0.0000
Tsonga 0.58765
+/- 0.0254
0.07695
+ /-0 .0136
0.01540
+A 0.0093
0.11420
+/- 0 0147
Zambians 0.19755
+ /-0 .0164
0.23475
+/- 0.0264
0.00200
+ /-0 .0018
0.12587
+/- 0.0099
0.25215
+/- 0.0395
Table 3.6 Differentiation test results between all pairs of populations
using the DQAI data. The values shown are probabilities of
obtaining equal or greater differences by resampling from a group
formed by pooling data from the particular pair of groups.
Bold figures indicate significant differences (significance level =
<0.0500). +/- figures indicate standard deviations.
Page 120
101
Antemoro Indonesians Merina Tsimihety
Indonesians 0.00000
+/- 0.0000
Merina 0.00000
+/- 0.0000
0.00717
+/- 0.0068
Tsimihety 0.84980
+/- 0.0220
0.00000
+/- 0.0000
0.13095
+/- 0.0170
Tsonga 0.10010
+/- 0.0159
0.00000
+/- 0.0000
0.00000
+/- 0.0000
0.43280
+/- 0.0339
Table 3.7 Differentiation test results between all pairs of populations
(as described for table 3.6) using the DPB1 data.
Bold figures indicate significant differences (significance level =
<0.0500). +/- figures indicate standard deviations.
Page 121
102
No differentiation tests were done using the haplotypic data because this would
only have been possible if each occurrence of each haplotype was known
with certainty, i.e., with the observed numbers as integers. A %2 test on the
phenotypes could have been done but this would have entailed pooling many
haplotypes to avoid the bias caused by small numbers in each class and tMs
procedure was considered to be unsatisfactory.
3.3.4 Admixture calculations
The results from admixture calculations are only relevant if parental
populations have been correctly chosen. Also, genetic drift and natural
selection (particular!) ji the case of HLA genes) can interfere with the correct
interpretation of results.
Admixture was estimated using the data in different forms (allelic and/or
haplotypic frequencies) and combinations of populations (including or
excluding the Arabs). At all times, an African group represented by the Tsonga
appeared to have contributed the most to the general Malagasy group, whose
allele frequencies represented a weighted average of the allele frequencies of
the three Malagasy groups studied. There is no way of knowing whether the
Tsonga were direct contributors to the Malagasy gene pool. They were chosen
as being possibly representative of the African population/s who did contribute
because they occupy an area which is relatively close to Madagascar.
When the DQAI and DPB1 allele frequencies were used, an estimated
contribution of 64.45% from the Tsonga and 35.54% from Indonesians was
found. Using DQAI-DPB 1 haplotypic data, an estimated contribution of
59.71% from the Tsonga and 40.29% from Indonesians was found. When the
Page 122
103
allele frequencies of the other non-HLA systems were used in combination
with either the separate DQAI and DPB1 allele frequencies or the DQA1-
DPB1 haplotypic frequencies, very similar results were obtained for both
combinations: 56.81% from the Tsonga, 43.19% from Indonesians; and
55.39% from Tsonga, 44.61% from Indonesians, respectively. When the non-
HLA data of all the groups, including the Arab non-HLA data, was used, the
apparent Tsonga contribution was 48.99% and that of the Indonesians,
38.15%; the possible Arab contribution accounted for the remaining 12.86%.
Very similar results were obtained when DQAI data was added to the non-
HLA data: 48.78% from the Tsonga, 38.21% from Indonesians and 13.01%
from Arobs. Unfortunately, there does not appear to be any published DPB1
allele frequency data on Arabian populations.
From the admixture results, it would appear that the Malagasy as represented
by the averaged Tsimihety, Merina and Antemoro, had their greatest
contribution from an African source, followed by an Indonesian and then an
Arabian source. On the basis of non genetic information, the Antemoro are
thought to have a more substantial contribution from Arabs than the other
Malagasy groups studied. It would have been interesting to see what the
apparent Arab contribution would have been had more Malagasy groups been
studied. Also, having more Malagasy groups would have allowed analysis of
dafa on separate highland and lowland groups, to see if there was a difference
in parental contributions to these, as suggested by other molecular studies
(Morar et al, 1996; Dangerfield, 1998).
Page 123
3.3.5 Principal coordinate analysis
104
Principal coordinates were calculated for the HLA allele frequency data, the
HLA haplotypic frequency data, the non-HLA serogenetic data, the HLA allele
frequency data with non-HLA serogenetic data, and the HLA haplotypic
frequency data with the non-HLA serogenetic data. No clustering was
particularly evident from any of the principal coordinate plots. However, in all
cases, the Antemoro, Tsimihety and Tsonga samples fell within one half; and
the Merina and Indonesians fell within the other. When the Arabs were
included, “they” fell into the same quadrant as the Merina and Indonesians.
When the non-HLA serogenetic data were used with DQAI data, the Arabs
were located closest to the Antemoro. However, when the non-HLA
serogenetic data were used alone, Arabs were roughly equidistant from the
Antemoro, Merina and Indonesians. The Tsonga and Indonesians were always
at the extremities of the second principal coordinate (Y axis).
Figures 3.4 and 3.5 show principal coordinate plots of the data Figure 3.4
shows the plot obtained from the DQAI-DPB 1 haplotypic data. Figure 3.5
shows the plot obtained from the non-HLA serogenetic and DQAI data. Once
again, more Malagasy groups would have been useful in determining a
clustering pattern.
At first glance, the distance separating the Tsonga and Tsir-ntiety in figure 3.5
seems large (considering how similar their DQAI allele frequencies were), but
this is mainly due to the distance along the horizontal axis . This separation is
obviously due to the non-HLA serogenetic data, as can b„ seen by the relative
closeness of the two samples in figure 3.4 which contains the haplotypic HLA
Page 124
105
0.2
0.1
TSO
TS
AM
- 0.1
- 0.2-0.23 -0.22
MR
- 0.21
IND
-0.2 -0.19 -0.18
Figure 3.4 Principal coordinate plot of haplotypic HLA data (the scale is
arbitrary).
KEY: TSO = Tsonga
AM = Antemoro
TS = Tsimihety
MR = Merina
IND = Indonesians
(Percentage data contained v-. i;V<i horizonal coordinate =38.3%
Percentage datm contained waiun vertical coordinate =21.6%)
Page 125
106
0.6
0.4
0 TSO
0.2 - o AM
o TS0
° ARAB-0.2 o MR
-0.4
-0.6 o IND
-0.8 _l______________________ _______________ ___ ___j_____ ___ ____
-1.74 -1.72 -1.7 -1.68 -1.66 -1.64 -1.62
Figure 3.5 Principal coordinate plot of the non-HLA serogenetic data with
the DQAI data (the scale is arbitrary).
KEY: TSO = Tsonga
AM = Antemoro
TS - Tsimihety
ARAB = Arabs
MR : Merina
INI) = Indonesians
(Percentage data contained within the horizontal axis =69.6%
Percentage data contained within L ; vertical axis =14.8%)
Page 126
107
data. Also, the distance between the Merina and Indonesians in both figures
(3.4 and 3.5) again suggests a lesser contribution of Indonesians towards the
Merina than might have been expected.
3.3.6 Genetic distance and phylogenetic trees
Two different genetic distances: Nei’s standard genetic distance (Ds) and the
Da genetic distance, were calculated by Ota’s DSW program. The various
genetic distance matrices obtained were correlated with each other according
to the method developed by Mantel (1967) and phylogenetic trees were
constructed by the neighbour joining method (Saitou and Nei, 1987). Two
representative phylogenetic trees are shown in figures 3.6 and 3.7.
Estimations of the correlation coefficient p (“r”), between the various genetic
distance matrices varied from 0.721 to 0.996, indicating that all matrices
correlated well (1.0 being an exact match). The lowest “r” value, 0.721, was
obtained from a comparison of the Ds matrices of the non-HLA serogenetic
data and haplotypic HLA data which may possibly indicate the influence of
natural selection, although sampling error and genetic drift would seem to be
more likely reasons.
Excellent correlation was found between the Ds and DA genetic distance
matrices obtained from the same data sets, with “r” values ranging between
0.821 and 0.986. This suggests that both genetic distance measures are
appropriate for inferring phylogenetic relationships between the group of
populations studied.
In all phylogenetic trees, the Tsonga and Indonesians were separated by the
Page 127
108
greatest branch length, while Malagasy groups fell in between. This picture
would be expected if the Malagasy are an admixture of African and Indonesian
population groups. Another feature present in the phylogenetic trees, is that the
Antemoro and Tsimihety were placed on the same branch as the Tsonga, while
the Merina were placed on the same branch as the Indonesians. This division
of groups supports the hypothesis that Indonesians were a major contributing
population to central highland groups (represented by the Merina), while
Africans were a major contributing population to surrounding lowland groups
(represented by the Tsimihety and Antemoro).
Depending on the data set or genetic distance calculation used, the Tsimihety
and Antemoro would reverse their positions with respect to the Tsonga. For all
phylogenetic trees (DA and Ds) except the “Ds tree” for haplotypic HLA data,
the Antemoro appear to be closest to the Tsonga, whereas on the “Ds tree” for
haplotypic HLA data (figure 3.6), the Tsimihety appear to be closer to the
Tsonga.
When data sets included Arabian data, the Arabs were placed at the bottom
of the “African” branch. The expected “closeness” between the Antemoro and
Arabs was not evident. Arabs appeared to be closer to the Tsimihety and
Merina. Figure 3.7 shows the Arabian placement on the Ds tree from non-HLA
serogenetic and DQA1 data.
Page 128
Antemoro
-------------------Merina
Tsim ihety
Tsonga
Indonesians
Figure 3.6 Phylogenetic tree obtained from Ds distances calculated from the haplotypic HLA data.
(No Arab data were available)
109
Page 129
Antemoro
■Tsonga
Tsim ihety
• Arabs
Merina
■ Indonesians
Figure 3.7 Phylogenetic tree obtained from Ds distances calculated from the non-HLA serogenetic and DQA1 data.
110
Page 130
Il l
CONCLUSIONS:
The study ofDQAl and DPB1 allele and haplotype frequencies was used to
make inferences about the evolutionary history of the Malagasy. The two loci
were chosen because they are both highly polymorphic and are situated close
enough to each other to yield haplotypic information.
Linkage disequilibrium between loci, which together with other things, is
indicative of recent admixture, was apparent between these two loci in the
Malagasy but not in the two “parental” groups studied.
Two obstacles to the use of these loci in population studies were, however,
encountered during this study. The first was that allele identification is not a
trivial exercise; it was considered necessary in the case of the DPB1 locus to
sequence the polymorphic region and even then, uncertainties about phase
resulted in information loss. The second limitation was that the financial and
time constraints limited sample sizes and the number of ethnic groups which
could be studied. The results would have been more conclusive if more
Malagasy and potential “parental” groups could have been studied.
Despite these limitations, the results obtained are consistent with the trend
established by other genetic studies, i.e., that lowlanders appear to be more
African than highlanders and that highlanders appear to be more Indonesian.
However, an allele (DPB1*0501) which was found at a substantial frequency
in Indonesians, and which was absent from the highland population sample
(Merina), questions the magnitude of the Indonesian contribution to the genetic
makeup of this highland group. More evidence of one or more additional
“parental” groups, possibly of Southeast Asian extract was also found.
Page 131
112
This study succeeded in further emphasizing the existence of a substantial
African contribution to the Malagasy, especially to the Tsimihety; and
produced evidence which is consistent with a small contribution by Arabs.
Page 132
113
REFERENt:
Adams D. (1996) How the immune system works and why it causes
autoimmune diseases. Immunol. Today 17:300-302.
Adams J. and Ward R.H. (1973) Admixture studies and the detection of
selection. Science 180:1137-1143.
Alderson M.R., Tough T.W., Davis-Smith T., Braddy S., Falk B., Schooley
K.A., Goodwin R.G., Smith C.A., Ramsdell F. and Lynch D.H. (1995) Fas
ligand mediates activation-induced cell death in human T lymphocytes. J. Exp.
Med. 181:71-77.
AmbachE., Zehethofer K. and Scheithauer R. (1996) HLA-DQcc genotype and
allele frequencies in an Austrian population. Hum. Hered. 46:71-75.
Auger I., Escola J.M., Gorvel J.P. and Roudier J. (1996) HLA-DR4 and HLA-
DR10 motifs that carry susceptibihty to rheumatoid arthritis bind 70-kD heat
shock protein. Nat. Med. 2:306-310.
Bakke O. and Dobberstein B. (1990) MHC class II-associated invariant chain
contains a sorting signal for endosomal compartments. Cell 63:707-716.
Barker C.F. and Billingham R.E. (1977) Immunologically privileged sites.
Adv. Immun. 25:1-54.
Battegay M., BachmannM.F., Burhkart C., Vlville S., Benoist C., Mathis D.,
Hengartner H. and Zinkemagel R.M. (1996) Antiviral immune responses of
Page 133
114
mice lacking MHC class II or its associated invariant chain. Cellular
Immunol. 167:115-121.
Beauchamp O.K., Y amazaki K. and Boyse E.A. (1985) The chemosensory
recognition of genetic individuality. Sci. Am. 253(1): 66-72.
Beckman E.M. and Brenner M.B. (1995) MHC class I-like, class H-like and
CD1 molecules: distinct roles in immunity. Immunol. Today 16:349-352.
Begovich A.B. and Erlich H.A. (1995) HLA typing for bone marrow
transplantation. JAMA 273:586-591.
Begovich A.B., McClure G.R., Suraj V.C., Helmuth R.C., Fildes N., Bugawan
T.L., Erlich H.A. and Klitz W. (1992) Polymorphism, recombination and
linkage disequilibrium within the HLA class II region. J, Immunol. 148:249-
258.
Bellgrau D., Gold D., Selawry H., Moore J., Franzusoff A. and Duke R.C.
(1995) A role for CD95 ligand in preventing graft rejection. Nature 377:630-
632.
Bergstrom T.F., Josefsson A., Erlich H.A. and Gyllensten U.B. (1998) Recent
origin of HLA-DRB1 alleles and implications for human evolution. Nat.
Genet. 18:237-242.
Bernstein F. (1931) Die geographische verteilung der blutgruppen und ihre
anthropologische bedeutung. In: Comitato Italiano per lo studio dei problem!
della populazione. Roma: Institute Poligrafico della Stato, pp 227-243.
Page 134
115
Bjorkman P.J., Saper M.A., Samraoui B., Bennett W.S., Strominger J.L. and
Wiley D.C. (1987) The foreign antigen binding site and T cell recognition
regions of class I histocompatibility antigens. Nature 329:512-518.
Blum J.S. and Cresswell P. (1988) Role for intracellular proteases in the
processing and transport of class II HLA antigens. Proc. Natl. Acad. Sci.
U.S.A. 85:3975-3979.
Boyse E.A., Beauchamp G.K., Bard J. and Yamazaki K. (1991) Behaviour and
the major histocompatibility complex (MHC), H-2, of the mouse. In: Ader R.,
Felter D.L. and Cohen N. (eds.) PsychoneuroimmunoIogy-II. San Diego:
Academic Press, pp 831-846. As cited in Beauchamp G.K. and Yamazaki K.
(1997) HLA and mate selection in humans: commentary. Am. J. Hum. Genet.
61:494-496.
Boyson J.E., Shufflebotham C., Cadavid L.F., Knapp L.A., Hughes A.L. and
Watkins D.L (1996) The MHC class I genes of the Rhesus monkey: different
evolutionary histories of MHC class I and II genes in primates. J. Immunol.
156:4656-4665.
Brown M. (1978) Madagascar rediscovered. London: Damien Turmacliffe.
Buettner-Janusch J. and Buettner-Janusch V. (1964) Hemoglobins,
Haptoglobins and transferrins in the peoples of Madagascar. Am. J. Phys.
Anthrop. 22:163-170.
Bugawan T.L., Begovich A.B. and Erlich H.A. (1990) Rapid HLA-DPB typing
using enzymatically amplified DNA and nonradioactive sequence-specific
Page 135
oligonucleotide probes. Immunogenetics 32:231-241.
116
Burney D.A. (1987) Late Holocene vegetation change in central Madagascar.
Quarternary Research 28:130-143. As cited in: Dewar R.E. (1995) Of nets
and trees: untangling the reticulate and dendritic in Madagascar’s prehistory.
World Archaeology 26:301-318.
Burney D.A. (1994) Late Holocene environmental changes in arid
southwestern Madagascar. Quarternary Research 40:98-106. As cited in:
Dewar R.E. (1995) Of nets and trees: untangling the reticulate and dendritic
in Madagascar’s prehistory. World Archaeology 26:301-318.
Caillat-Zucman S., Daniels S., Djilali-Saiah I., Timsit}., Garchon H.J., Boitard
C. and Bach J.F. (1995) Family study of linkage disequilibrium between TAP2
transporter and HLA class II genes. Absence of TAP2 contribution to
association with insulin-dependent diabetes mellitus. Hum. Immunol. 44:80-
87.
Campbell G. (1988) Madagascar and Mozambique in the slave trade of the
western Indian Ocean 1800-1861. Slavery and abolition. A Journal of
comparative studies. 9(3):166.
Campbell G. (1991) The state and pre-colonial demographic history: the case
of nineteenth-century Madagascar. J. Afr. Hist. 32:415-445.
Campbell G. (1995a) Notes on the Fladhrami diaspora, Islam and Madagascar
c. 1750-1976. Personal communication.
Page 136
117
Campbell G. (1995b) Notes on the origins of the Malagasy. Personal
communication.
Campbell G. (1996) Notes on the origins of the Malagasy. Personal
communication.
Cavalli-Sforza L.L., Menozzi P. and Piazza A. (1994) The history and
geography of human genes. New Jersey: Princeton University Press.
Centers for disease control (1987) Revision of the CDC surveillance case
definition for acquired immunodeficiency syndrome. Morbid. Mortal.
Weekly Rep. 36:3S-15S. As cited in: Kaslow R.A., Carrington M., Apple R.,
Park L., Munoz A., Saah A.J., Goedert J.J., Winkler C., O’Brien S.J., Rinaldo
C., Detels R., Blattner W., Phair J., ErhchH. and Mann D.L. (1996) Influence
of combinations of human major histocompatibility complex genes on the
course of HIV-1 infection. Nature Med. 2:405-411.
Chakraborty R. (1986) Gene admixture in human populations: models and
predictions. Yearbook of Phys. Anthrop. 29:1-43.
Chang C.H. and Flavell R.A. (1995) Class II transactivator regulates
expression of multiple genes involved in antigen presentation. J. Exp. Med.
181:765-767.
Chapel H. and Haeney M. (eds) (1993) Essentials of clinical immunology (3rd
ed) Oxford: Blackwell Scientific Publications. Chapter 6.
Claesson-Welsh L. and Peterson P. A. (1985) Implications of the invariant y-
Page 137
118
chain of the intracellular transport of class II histocompatibilty antigens. J.
Immunol. 135:3551-3557.
Cole M. (1992) Return to Madagascar. New Scientist 133(1809):40-41.
Coleman R.M., Lombard M.F. and Sicard R.E. (eds) (1989) Fundamental
immunology (2nd ed) U.S.A.: Wm. C. Brown Publishers. Chapter 7.
Colonna M., Bresnahan M., Bahram S., Strominger J.L. and Spies T. (1992)
Allelic variants of the human putative peptide transporter involved in antigen
processing. Proc. Natl. Acad. Sci. U.S.A. 89:3932-3936.
CullenM., Noble J., ErhchH., Thorpe K., Beck S., Klitz W., Trowsdale J. and
Carrington M. (1997) Characterization of recombination in the HLA class II
region. Am. J. Hum. Geest. 60:3:--7-407.
Dahl O.C. (1951) Malgache et Maanjan, une etude linguistique. Oslo: Egede
Institutet. As cited in: Verin P., Kottak C.P. and Gorlin P. (1970) The
glottochronology of Malagasy speech communities. Oceanic Linguistics
VlII:26-83.
Dahle L. (1883) The Race elements of the Malagasy. Antananarivo Annual
Madagascar Magazine 7:16, 22. As cited in: Campbell G. (1995a) Theories
of the origins of the Malagasy: The nineteenth century British school. In:
Australes. Etudes historiques aixoises sur TAfrique australe et T ocean Indien
occidental. Tananarive: L’ Harmattan, ppl27-153.
Dangerfield B. (1998) Characterization of Glucose-6-Phosphate
Page 138
119
dehydrogenase (G6PD) variation in the Malagasy and its use in establishing
the origins and affinities of the Malagasy. M.Sc.(med) dissertation, Department
of Human Genetics, University of the Witwatersrand, Johannesburg.
Deighton C.M., Cavanagh G., Rigby A.S., Lloyd H.L. and Walker D J . (1993)
Both inherited HLA haplotypes are important in the predisposition to
rheumatoid arthritis. Br. J. Rheumatol. 32:893-898. As cited in: Zanelli E.,
Gonzalez-Gay M.A. and David C.S. (1995) Could HLA-DRB1 be the
protective locus in rheumatoid arthritis? Immunol. Today 16:274-278.
Delgado J.C., Turbay D., Yunis E.J., Yunis J.J., Morton E.D., Bhol K.,
Norman R., Alper C.A., Good R.A. and Ahmed R. (1996) A common major
histocompatibility complex class II allele HLA-DQB1*0301 is present in
clinical variants of pemphigoid. Proc. Natl. Acad. Sci. U.S.A. 93:8569-8571.
Dempsey M. (1985) Pocket Atlas and Gazetteer. London: Granada Publishing.
Denzin L.K., Robbins N.F., Carboy-Newcomb C. and Cresswell P. (1994)
Assembly and intracellular transport of HLA-DM and correction of the class
II antigen processing defect in T2 cells. Immunity 1:595-606. As cited in:
Beckman E.M. and Brenner B. (1995) MHC class I-like, class H-like and CD1
molecules: distinct roles in immunity. Immunol. Today 16:349-352.
de Preval C., Lisowska-Grospierre B., Loche M., Griscelli C. and Mach B.
(1985) A trans-acting class H regulatory gene unlinked to the MHC controls
expression of HLA class II genes. Nature 318:291-293.
Deschamps H. (1965) Histoire de Madagascar. Paris: Editions Berger-
Page 139
120
Levrault. As cited in: Verin P., Kottak C.P. and Gorlin P. (1970) The
glottochronology of Malagasy speech communities. Oceanic Linguistics VIII:
26-83.
I
Dewar R.E. (1995) Of nets and trees: untangling the reticulate and dendritic
in Madagascar’s prehistory. World Archaeology 26:301-318.
Dewar R.E. and Wright H.T. (1993) The culture history of Madagascar. J.
World Prehist. 7:417-466.
Ellis W. (1838a) History of Madagascar, vol I. London: Fisher, ppl33-134. As
cited in: Campbell G. (1995a) Theories of the origins of the Malagasy: The
nineteenth century British school. In: Australes. Etudes historiques aixoises sur
TAfrique australe et Tocean Indien occidental. Tananarive: L’ Harmattan,
ppl27-153.
Ellis W. (1838b) History of Madagascar, vol II. London: Fisher, p4. As cited
in: Campbell G. (1995a) Theories of the origins of the Malagasy: The
nineteenth century British school. In: Australes. Etudes historiques aixoises sur
TAfrique australe et Tocean Indien occidental. Tananarive: L’ Harmattan,
ppl27-153.
Elston R.C. (1971) The estimation of admixture in racial hybrids. Ann. Hum.
Genet. (Lond.) 35:9-17.
Erlich H.A. and Bugawan T.L. (1992) HLA class H gene polymorphism: DNA
typing, evolution and relationship to disease susceptibility. In: Erlich H.A. (ed)
PCR technology - Principles and applications for DNA amplification. New
Page 140
York: W.H. Freeman and Company.
121
Ewens WJ. and Spielman R.S. (1995) The transmission / disequilibrium test:
history, subdivision and admixture. Am. J. Hum. Genet. 57:455-464.
Falk K., Rotzschke O., Stevanovic S., Jung G. andRammensee E.G. (1991)
Allele-specific motifs revealed by sequencing of self-peptides eluted from
MHC molecules. Nature 351:290-296.
Figueroa F., Gunther E. and Klein J, (1988) MHC polymorphism pre-dating
speciation. Nature 335:265-267.
Fling S.P., Arp B. and Pious D. (1994) HLA-DMA and -DMB genes are both
required for MHC class 11/peptide complex formation in antigen-presenting
cells. Nature 368:554-558.
Gill T.J.(m) (1983) Immunogenetics of spontaneous abortions in humans.
Transplantation 35:1-6.
Gill TJ.(III) and Kunz H.W. (1979) Gene complex controlling growth and
fertility linked to the major histocompatibility complex in the rat. Am. J.
Pathol. 96:185-206.
Grandidier A. (1916) Souvenirs de voyages, 1865-1870. Documents anciens
sur Madagascar (Tananarive), p32. As cited in: Campbell G. (1991) The state
and pre-colonial demographic history: the case of nineteenth-century
Madagascar. J. Afr. Hist. 32:415-445.
Page 141
122
Griffiths D. (1843) Hanes Madagascar. Machynlleth: Richard Jones, plo. As
cited in: Campbell G. (1995a) Theories of the origins of the Malagasy: The
nineteenth century British school. In: Australes. Etudes historiques aixoises sur
TAfrique australe et Tocean Indien occidental. Tananarive: L’ Harmattan,
ppl27-153.
Griscelli C., Lisowska-Grospierre B. and Mach B. (1989) Combined
immunodeficiency with defective expression in MHC class II genes.
Immunodefic. Rev. 1:135-153. As cited in: Reith W., Steimle V. and Mach
B. (1995) Molecular defects in the bare lymphocyte syndrome and regulation
of MHC class II genes. Immunol. Today 16:539-546.
Gueunier N.J. (1988) Dialectologie et lexicostatistique: cas du dialecte
malgache de Mayotte (Comores). Etudes Ocean Indien 9:143-167. As cited
in: Dewar R.E. (1995) Of nets and trees: untangling the reticulate and dendritic
in Madagascar’s prehistory. World Archaeology 26:301-318.
Gueunier N.J. (1992) Contes de la Cote Quest de Madagascar. Antananarivo
and Paris: Editions Ambozontany-Karthala. As cited in: Dewar R.E. (1995) Of
nets and trees: untangling the reticulate and dendritic in Madagascar’s
prehistory. World Archaeology 26:301-318.
Guglielmino C.R., DeSilvestri A , Martinetti M., Daielli C., Salvaneschi L. and
Cuccia M. (1996) The genetic structure of a province as revealed by surnames
and HLA genes: potential utility in transplantation policy. Ann. Hum. Genet.
60:221-229.
Gyllensten U.S., Bergstrom T., Josefsson A., S und vail M. and Erlich H.A.
Page 142
123
(1996) Rapid allelic diversification and intensified selection at antigen
recognition sites of the MHC class IIDPB1 locus during hominoid evolution.
Tissue Antigens 47:212-221.
Gyllensten U.B. and Erlich H.A. (1988) Generation of single-stranded DNA
by the polymerase chain reaction and its application to direct sequencing of
the HLA-DQA locus. Proc. Natl. Acad. Sci. U.S.A. 85:7652-7656.
Gyllensten U.B. and Erlich H.A. (1989) Ancient roots for polymorphism at the
HLA-DQcc locus in primates. Proc. Natl. Acad. Sci. U.S.A. 86:9986-9990.
Gyllensten U.B., Sundvall M. and Erlich H.A. (1991) Allelic diversity is
generated by intraexon sequence exchange at the DRB1 locus of primates.
Proc. Natl. Acad. Sci. U.S.A. 88:3686-3690.
Habeshaw 1, Hounsell E. and Dalgleish A. (1992) Does the HTV envelope
induce a chronic graft-versus-host-like disease? Immunol. Today 13:207-210.
Haggett P. (Ed) (1994) Madagascar. Encyclopedia of World geography, vol
18. New York: Marshall Cavendish.
Harpending H. and Rogers A. (1984/5) Antana: A package ftv multivariate
data analysis, ver 1.5.
Head J.R., Neaves W.B. and Billingham R.E. (1983) Reconsideration of the
lymphatic drainage of the rat testis. Transplantation 35:91-95.
Hedrick P.W. and Black F.L. (1997) HLA and mate selection: no evidence in
Page 143
South Amerindians. Am, J. Hum. Genet. 61:505 -511.
124
Hedrick P.W. and Thompson G. (1983) Evidence for balancing selection at
HLA. Genetics 104:449-456.
Helmuth R., Fildes N., Blake E., Luce M.C., Chimera J., Made] R.,
Gorodezky C., Stoneking M., Schmill N., Klitz W., Higuchi R. and Erlich
H.A. (1990) HLA-DQcc allele and genotype frequencies in various human
populations, determined by using enzymatic amplification and oligonucleotide
probes. Am. J. Hum. Genet. 47:515-523.
Harris E.E. and Hey J. (1999) X chromosome evidence for ancient human
histories. Proc. Natl. Acad. Sci. U.S.A.
Hewitt R., Krause A., Goldman A., Campbell G. and Jenkins T. (1996) 13-
globin haplotype analysis suggests that a major source of Malagasy ancestry
is derived from Bantu-speaking Negroids. Am. J. Hum. Genet. 58:1303-1308.
Hill A.V.S., Allsopp C.E.M., Kwiatkowski D., Anstey N.M. Twumasi P.,
Rowe P.A., Bennett S., Brewster D., MGMichael A.J. and Greenwood B.M.
(1991) Common West African HLA antigens are associated with protection
from severe malaria. Nature 352:595-600.
Ho H.N., Yang Y.S., Hsieh R.P., Lin H.R., Chen S.U., Chen H.F., Huang
S.C., Lee T.Y. and Gill T.J.(III) (1994) Sharing of human leukocyte antigens
in couples with unexplained infertility affects the success of in vitro
fertilization and tubal embryo transfer. Am, J. Obstet. Gynecol. 170:63-71.
Page 144
125
Hughes A.L. and Nei M. (1988) Pattern of nucleotide substitution at major
histocompatibility complex class I loci reveals overdominant selection. Nature
335:167-170.
Hughes A.L. and Nei M. (1989) Nucleotide substitution at major
histocompatibility complex class II loci: evidence for overdominant selection.
Proc. Natl. Acad. Sci. U.S.A. 86:958-962.
Hunt D.F., HendersonKA, Shabanowitz J., Sakaguchi K., Michel FI.. Sevilir
N., Cox A.L., Appella E. and Engelhard V.H. (1992) Characterization of
peptides bound to class I MHC molecule HLA-A2.1 by mass spectrometry.
Science 255:1261-1263.
Jensen P.E. (1990) Regulation of antigen presentation by acidic pH. J. Exp.
Med. 171:1779-1784.
JinK., Ho H.N., Speed T.P. and Gill T.J. (1995) Reproductive failure and the
major histocompatibility complex. Am. J. Hum. Genet. 56:1456-1467.
Kaslow R.A., Carrington M., Apple R., Park L., Munoz A., Saah A.J.,
Goedert J.J., Winkler C., O’Brien S.J., Rinaldo C., Detels R„ Blattner W.,
Phair J., Erlich E. and Mann D.L. (1996) Influence of combinations of human
major histocompatibility complex genes on the course of HIV-1 infection. Nat.
Med. 2:405-411.
Kelly A., Powis S.H., Kerr L.A., Mockridge I., Elliott T., Bastin J., Uchanska-
Ziegler B., Ziegler A., Trowsdale J. and Townsend A. (1992) Assembly and
function of the two ABC transporter proteins encoded in the major
Page 145
1 2 6
histocompatibility complex. Nature 355:641-644.
Kenter M., Otting J., Anholts M., Jonker R., Schipper R. and Bontrop R.E.
(1992) MHC-DRB diversity of the chimpanzee (Pan troglodytes)
Immunogenetics 37:1-11. As cited in Boyson I.E., Schufflebotham C.,
Cadavid L.F., Urvater J.A., Knapp L.A., Hughes A.L. and Watkins D.L (1996)
The MHC class I genes of the Rhesus monkey. J. Immunol. 156:4656-4665.
Klein J., Gutknecht J. and Fischer N. (1990) The major histocompatibility
complex and human evolution. Trends Genet. 6:7-11.
Klein J., Takahata N. and Ayala FJ. (1993) MHC polymorphism and human
origins. Sci. Am. 269:78-83.
Klitz W., Stephens C., Grote M. and Carrington M. (1995) Discordant patterns
of linkage disequilibrium of the peptide-transporter loci within the HLA class
II region. Am. J. Hum. Genet. 57:1436-1444.
Kronenberg M., Brines R. and Kaufinan J. (1994) MHC evolution: a long term
investment in defence. Immunol. Today 15:4-6.
Kuhner M., Watts S., Klitz W., Thomson G. and Goodenow R.S. (1990) Gene
conversion in the evolution of both the H-2 and Qa class I genes of the murine
major histocompatibility complex. Genetics 126:1115-1126.
Lawlor D.A., Ward F.E., Ennis P.D., Jackson A.P. and Parham P. (1988)
HLA-A and -B polymorphisms predate the divergence of humans and
chimpanzees. Nature 335:268-271.
Page 146
127
Lawlor D.A., Warren E., Ward F.E. and Parham P. (1991) Gorilla class I
major histocompatibility alleles: comparison to human and chimpanzee class
I. J. Exp. Med. 174:1491-1509.
Lewontin R.C. (1964) The interaction of selection and linkage. I. General
considerations; heterotic models. Genetics 49:49-67.
Long J.C., Williams R.C., McAuley J.E., Medis R., Partel R., Tregellas W.M.,
South S.F., Rea A.E., McCormick S.B. and Iwaniec U. (1991) Genetic
variation in Arizona Mexican Americans: estimation and interpretation of
admixture proportions. Am. J. Phys. Anthrop. 84:141-157.
Lotteau V., Teyton L., Peleraux A., Nilsson T., Karlsson L., Schmid S.L.,
Quaranta V. and Peterson P. A. (1990) Intracellular transport of class II MHC
molecules directed by invariant chain. Nature 348:600-605.
Lu D., Kunz H.W., Melhem F. and Gill T.J.(HI) (1993) Cell lines from grc
congenic strains of rats having different susceptibilities to chemical
carcinogens. Cancer Res. 53:4089-4095.
Mack J. (1986) Madagascar, island of the ancestors. London: British museum
publications Ltd.
MacPhee R.D.E and Burney D.A. (1991) Dating of modified femora of extinct
dwarf Hippopotamus from southern Madagascar: implications for constraining
human colonization and vertebrate extinction events. J. Arch. Sci. 18:695-706.
As cited in: Dewar R.E. (1995) Of nets and trees: untangling the reticulate and
dendritic in Madagascar’s prehistory. World Archaeology 26:301-318.
Page 147
128
Manguin P.Y. (1993) Pre-modem Southeast Asian shipping in the Indian
Ocean: The Maldives connection. “New directions in Maritime History”
conference. Australia, Fremantle.
Mantel N. (1967) The detection of disease clustering and a generalized
regression approach. Cancer Res. 27:209-220.
Marks M.S., Blum J.S. and Cresswell P. (1990) Invariant chain trimers are
sequestered in the rough endoplasmic reticulum in the absence of association
with HLA class II antigens. J. Cell Biol. I l l :839-856.
Massardo L., Jacobelli S., Rodriguez L , Rivero S., Gonzalez A. and Marchetti
R. (1990) Weak association between HLA-DR4 and rheumatoid arthritis in
Chilean patients. Ann. Rheum. Dis. 49:290-292.
M'DevittH.O. and Bodmer W.F. (1972) Histocompatibility antigens, immune
resposiveness and susceptibility to disease. Am. J. Med. 52:1-8.
Melhem M.F., Kunz H.W. and Gill T.J.(IH) (1993) An MHC-linked locus in
the rat critically influences resistance to DEN carcinogenesis. Proc. Natl.
Acad. Sci. U.S.A. 90:1967-1971.
Meyer C.G., GallinM., Erttmann K.D., Brattig N., Schnittger L., Gelhaus A.,
TannichE., Begovich A.B., Erlich H.A. and Horstmann R.D. (1994) HLA-D
alleles associated with generalized disease, localized disease and putative
immunity in Onchocerca volvulus infection. Proc. Natl. Acad. Sci. U.S.A.
91:7515-7519.
Page 148
129
Meyer C.G., May J. and Schnittger L. (1997) HLA-DP: part of the concert.
Immunol. Today 18:58-61.
Migot F., Perichon B., Danze P.M., Raharimalala L., Lepers J.P., Deloron P.
and Krishnamoorthy R. (1995) HLA class II haplotype studies bring molecular
evidence for population affinity between Madagascans and Javanese. Tissue
Antigens 46:131-135.
Miller S.A., Drykes S.S. and Polesky H.F. (1988) A simple salting out
procedure for extracting DNA from uman nucleated cells. Nuci. Acids Res.
16:1215.
Moebius U., Clayton L.K., Abraham S., Diener A., Yunis J.L, Harrison S.C.
and Reinherz E.L. (1992) Human immunodeficiency virus gpl20 binding C’C”
ridge of CD4 domain 1 is also involved in interaction with class II major
histocompatibility complex molecules. Proc. Natl. Acad. Sci. U.S.A.
89:12008-12012.
Monaco JJ. (1992) A molecular model of MHC class I restricted antigen
processing. Immunol. Today 13:173-179.
Monaco JJ. and McDevitt H.O. (1984) H-2-linked low-molecular weight
polypeptide antigens assemble into an unusual macromolecular complex.
Nature 309:797-799.
Moonsamy P.V., Suraj V.C., Bugawan T.L.. Saiki R.K., Stoneking M.,
Roudier L, Magzoub M.M.A., HE A.V.S. and Begovich A.B. (1992) Genetic
diversity within the HLA class II region: ten new DPB1 alleles and their
Page 149
population distribution. Tissue Antigens 40:153-157.
130
Morar B., Lane A.B. and Jenkins T. (1996) Origins and Affinities of the
Malagasy. 9th International congress of Human Genetics. Brazilian J. Genet,
(suppl.) 19:180.
Morris P., Shaman J., Attaya M., Amaya M., Goodman S., Bergman C.,
Monaco JJ. and Mellins E. (1994) An essential role for HLA-DM in antigen
presentation by class II major histocompatibility molecules. Nature 368:551-
554.
Mourant A., Kopec A. and Demaniewska-Sobezak K. (1976) The distribution
of the human blood groups and other polymorphisms. London: Oxford
University Press, ppl 15-116.
Murdoch G.P. (1959) Africa, its people and their culture history. New York.
As cited in: Buettner-Janusch J. and Buettner-Janusch V. (1964) Hemoglobins,
Haptoglobins and transferrins in the peoples of Madagascar. Am. J. Phys.
Anthrop. 22:163-170.
Nagel R. and Fleming A. (1992) Genetic epidemiology of the Bs gene.
Bailieres Clin. Haematol. 5:331-365.
Neefjes JJ . and Ploegh H.L. (1992) Intracellular transport of MHC class II
molecules. Immunol. Today 13:179-184.
Neefjes J.J., Stollorz V., Peters P.J., Geuze H J. and Ploegh H.L. (1990) The
biosynthetic pathway of MHC class II but not class I molecules intersects the
Page 150
endocytic route. Cell 61:171-183.
131
Nelson J.L., Hughes K.A., Smith A.G., Nisperos B.B., Branchaud A.M. and
Hansen J.A. (1993) Matemal-foetal disparity in HLA class II alloantigens and
the pregnancy-induced amelioration of rheumatoid arthritis. N. Engl. J. Med.
329:466-471.
Norrander J., Kempe T. and Messing J. (1983) Construction of improved M13
vectors using oligodeoxynucleotide-directed mutagenesis. Gene 26:101-106.
Nurse G.T., Weiner J.S. and Jenkins T. (1985) The peoples of Southern A frica
and their affinities. Oxford: Clarendon Press pp78-101, 127-238, 198-347.
Ober C. (1998) HLA and pregnancy: the paradox of the fetal allograft. Am. J.
Hum. Genet. 62:1-5.
Ober C. and Aldrich A. (1997) HLA-G polymorphisms: neutral evolution or
novel function? J. Reprod. Immunol. 61:497-504.
Ober C., Weitkamp L.R., Cox N., DytchH., KostyuD. and Elias S. (1997)
HLA and mate choice in humans. Am. J. Hum. Genet. 61:497-504.
Olerup O., Troye-Blomberg M., Schreuder G.M.T. and Riley E.M. (1991)
HLA-DR and -DQ gene polymorphism in West Africans is twice as extensive
as in North European Caucasians: evolutionary implications. Proc. Natl.
Acad. Sci. U.S.A. 88:8480-8484.
Ota T. (1995) DSW software package, kindly made available by T. Ota
Page 151
132
(email: [email protected] ) and supplied by Mark Schriver (email:
[email protected] )
Owen M.J., Kissonerghis A.M., Lodish H.F. and Crumpton M.J. (1981)
Biosynthesis and maturation of HLA-DR antigens in vivo. J. Biol. Chem.
256:8987-8993.
Petronzelli F., Bonamico M., Ferrante P., Grillo R., Mora B., Mariani P.,
Apollonio I., Gemme G. and Mazzilli M.C. (1997) Genetic contribution of the
HLA region to the familial clustering of coeliac disease. Ann. Hum. Genet.
61:307-317.
Powis S.H. and Geraghty D.E. (1995) What is the MHC? Immunol. Today
16:466-468.
Powis S.H., Tonks S., Mockridge I., Kelly A.P., Bodmer J.G. and Trowsdale
J. (1993) Alleles and haplotypes of the MHC-encoded ABC transporters TAPI
and TAP2. Immunogenetics 37:266-273. As cited in: Singh N., Agrawal S.
and Rastogi A.K. (1997) Infectious diseases and immunity: special reference
to major histocompatibility complex. Emerging infectious diseases 3:41-49.
Rakotovololona S. (1993) Ankadivory et la periode Fiekena: debut
d’urbanisation sur les Hautes Terres centrales (Madagascar). In Donnees
archeologiques sur Porigine des villes a Madagascar - Mombassa, Janvier,
1993, Project Working Papers, Antananarivo: Musee d’Art et d’Archeologie,
pp45-94. As cited in: Dewar R.E. (1995) Of nets and trees: untangling the
reticulate and dendritic in Madagascar’s prehistory. World Archaeology
26:301-318.
Page 152
133
Rani R., Fernandez-Vina M.A., Zaheer S.A., Beena K.R. and Stastny P.
(1993) Study of HLA class II alleles by PCR oligotyping in leprosy patients
from North India. Tissue Antigens 42:133-137. As cited in: Singh N.,
Agrawal S. and Rastogi A.K. (1997) Infectious diseases and immunity: special
reference to major histocompatibility complex. Emerging infectious diseases
3:41-49.
Raskd I. and Downes C.S. (1995) Genes in medicine. London; Chapman and
Hall.
Reith W., Satola S., Herrero Sanchez C., Amaldi L, Lisowska-Grospierre B.,
Griscelli C., HadamM.R. and Mach B. (1988) Congenital immunodeficiency
with a regulatory defect in MHC class II gene expression lacks a specific
HLA-DR promoter binding protein, RF-X. Cell 53:897-906.
Reith W., Steimle V. and Mach B. (1995) Molecular defects in the bare
lymphocyte syndrome and regulation of MHC class II genes. Immunol. Today
16:539-546.
Riley E. and Olerup O. (1992) HLA polymorphisms and evolution. Immunol.
Today 13:333-335.
Roche P.A. and Cresswell P. (1990) Invariant chain association with HLA-DR
molecules inhibits immunogenic peptide binding. Nature 345:615-619.
Roche P.A., Marks M.S. and Cresswell P. (1991) Formation of a nine subunit
complex by HLA class 31 glycoproteins and the invariant chain. Nature
354:392-394.
Page 153
134
Roitt L, BrostofiFJ. and Male D. (eds) (1989) Immunology (2nd ed) London:
Gower medical publishing.
Rowland-Jones S., Sutton J., Ariyoshi K., Dong I., Gotch F., M°Adam S.,
Whitby D., Sabally S., Gallimore A., Corrah T., Takiguchi M., Schultz T.,
McMichael A. and Whittle H. (1995) HIV-specific cytotoxic T-cells in HIV-
exposed but unaffected Gambian women. Nat. Med. 1:59-64.
Rudensky A.Y., Preston-Hurlburt P., Hong S.C., Barlow A. and Janeway C.A.
Jr. (1991) Sequence analysis of peptides bound to MHC class II molecules.
Nature 353:622-627.
Saitou N. and Nei M. (1987) The neighbour-joining method. A new method
for reconstructing phylogenetic trees. Mol. Biol. Evol. 4:406-425.
Sant A.J., Hendrix L.R., Cohgan J.E., Maloy W.L. and Germain R.N. (1991)
Defective intracellular transport as a common mechanism limiting expression
of inappropriately paired class H major histocompatibility complex cc/p chains.
J. Exp. Med. 174:799-808.
Sattar M.A., Al-Saffar M., Guindi R.T., Sugathan T.N. and Behbehani K.
(1990) Association between HLA-DR antigens and rheumatoid arthritis in
Arabs. Ann. Rheum. Dis. 49:147-149.
Schneider S., Kueffer J.M., Roessli D. and Excoffier L. (1997) Arlequin vei
1.1: A software for population genetic data analysis. Genetics and Biometry
laboratory, University of Geneva, Switzerland.
Page 154
135
Selawry H.P. and Cameron D.F. (1993) Sertoli cell-enriched fractions in
successful islet cell transplantation. Cell Transplant. 2:123-129. As cited in:
VauxD.L. (1995) Ways around rejection. Nature 377:576-577.
Shaw G.A. (1885) Madagascar and France, pp 46-47. As cited in: Campbell
G. (1995a) Theories of the origins of the Malagasy: The nineteenth century
British school. In: Australes. Etudes historiques aixoises sur I’Afrique australe
etFoceanIndien occidental. Tananarive: L’ Harmattan, ppl27-153.
She J.X. (1996) Susceptibility to type 1 diabetes: HLA-DQ and DR revisited.
Immunol. Today 17:323-329.
Singer R.} Bubtz-Olsen O.E., Brain P. and Saugrain J. (1957) Physical
features, sickling and serology of the Malagasy of Madagascar. Am. J. Phys.
Anthrop. 15:91-124.
Singh N., Agrawal S. and Rastogi A.K. (1997) Infectious diseases and
immunity: special reference to major histocompatibility complex. Emerging
infectious diseases 3:41-49.
Slatkin M. and Excoffier L. (1996) Testing for linkage disequilibrium in
genotypic data using the EM algorithm. Heredity 76:377-383.
Soodyall H., Jenkins T. and Stoneking M. (1995) “Polynesian” mtDNA in the
Malagasy. Nat. Genet. 10:377-378.
Spies T., Cenmdolo V., Colonna M., Cresswell P., Townsend A. and DeMars
R. (1992) Presentation of viral antigens by MHC class I molecules is
Page 155
136
dependent on a putative peptide transporter heterodimer. Nature 355:644-646.
Stastny P., Ball E.J., Dry P.J. and Nunez G (1983) The human immune
response region (HLA D) and disease susceptibility. Immunol Rev 70:113-
153.
Steimle V., Siegrist C.A., Mottet A., Lisowska-Grospierre B. and Mach B.
(1994) Regulation of MHC class II expression by interferon-y mediated by the
transactivator gene CIITA. Science 265:106-109.
Steinman L., Waisman A. and Altmann D. (1995) Major T-cell responses in
Multiple sclerosis. Mol. Med. Today 1:79-83.
Stephens J.C., Briscoe D. and O’Brien SJ. (1994) Mapping by admixture
linkage disequilibrium in human populations: limits and guidelines. Am. J.
Hum. Genet. 55:809-824.
Stem L.J., Brown J.H., Jardetzky T.S., Gorga J.C., Urban R.G., Strominger
J.L. and Wiley D.C. (1994) Crystal structure of the human class II MHC
protein HLA-DR 1 complexed with an influenza virus peptide. Nature
368:215-221.
Sutton H.E. (ed) (1988) An introduction to human genetics (4th ed). U.S.A.:
Harcourt Brace Jovanovich publishers.
Takahashi T., Tanaka M., Inazawa J., Abe T., Suda T. and Nagata S. (1994)
Human Fas ligand: gene structure, chromosomal location and species
specificity. Int. Immun. 6:1567-1574. As cited in: Vaux D.L. (1995) Ways
Page 156
137
around rejection. Nature 377:576-577.
Takahata N. and Nei M. (1990) Allelic genealogy under overdominant and
frequency-dependent selection and polymorphism of major histocompatibility
complex loci. Genetics 124:967-978.
Teyton L., O’Sullivan D., Dickson P.W., Lotteau V., Sette A., Fink P. and
Peterson P. A. (1990) Invariant chain distinguishes between the exogenous and
endogenous antigen presentation pathways. Nature 348:39-44.
Theophilus B.. Latham T., Grabowski G.A. and Smith F.I. (1989) Gaucher
disease: molecular heterogeneity and phenotype-genotype correlations. Am.
J. Hum. Genet. 45:212-225.
The World Book Encyclopedia, vol 13. (1977) U.S.A.: Field Enterprises
Education Corporation.
Thomas L. (1974) A fear of pheromones. In: The lives of a cell. New York:
Viking ppl6-19. As cited in: Beauchamp G.K. and Yamazaki K. (1997) HLA
and mate selection in humans: commentary. Am. J. Hum. Genet. 61:494-496.
Thomson G. and Klitz W. (1987) Disequilibrium pattern analysis I: Theory.
Genetics 116:623-632.
Thursz M.R., Thomas H.C., Greenwood B.M. and Hill A.V.S. (1997)
Heterozygote advantage for HLA class II type in hepatitis B virus infection.
Nat. Genet. 17:11-12.
Page 157
138
Titus-Trachtenberg E.A., Rickards O., DeStefano G.F. and Erlich H.A. (1994)
Analysis of HLA class II haplotypes in the Cayapa Indians of Ecuador: a novel
DRB1 allele reveals evidence for convergent evolution and balancing selection
at position 86. Am. J. Hum. Genet. 55:160-167.
Tomlinson I.P.M. and Bodmer W.F. (1995) The HLA system and the analysis
of multifactorial genetic disease. Trends Genet, 11:493-498.
TrauthB.C., Klas C., Peters A.M.J., Matzku S., Moller P., Falk W., Debatin
K.M. and Krammer P.H. (1989) Monoclonal antibody-mediated tumour
regression by induction of apoptosis. Science 245:301-305.
Trowsdale J. (1993) Genomic structure and function in the MHC. Trends
Genet. 9:117-122.
Uzoigwe G.N. (1995) Madagascar. In: Grolier multimedia encyclopedia ver
7.0. Grolier Inc.
Valdes A.M., M°Weeney S. an/! Thomson G. (1997) HLA class IIDR-DQ
amino acids and insulin-dependent diabetes mellitus: application of the
haplotype method. Am. J. Hum. Genet. 60:717-728.
Verin P. (1986) The history of civilization in north Madagascar. Rotterdam:
Balkema.
Verin P.. Kottak C.P. and Gorlin P. (1970) The glottochronology of Malagasy
speech communities. Oceanic Linguistics VIII:26-83.
Page 158
139
Versluis L.F., Verduyn W., Abdulkadir J., Tilanus GJ. and Giphart M.J.
(1995) Novel HLA-DPB1 alleles detected in the Ethiopian population. Hum.
Immunol. 42:181-183.
Vyse T.J. and Todd J.A. (1996) Genetic analysis of autoimmune disease. Cell
85:311-318.
Weir B.S. (1996) Genetic Analysis H Sunderland, Massachusetts: Sinauer
Associates, Inc.
Weiss S. and Bogen B. (1991) MHC class U-restricted presentation of
intracellular antigen. Cell 64:767-776.
Westby M., Manca F. and Dalgleish A.G. (1996) The role of host immune
responses in determining the outcome of HIV infection. Immunol. Today
17:121-126.
Wright H.T. (1992) Early human impact on a forest in northeastern
Madagascar: note on an archaeological sounding on Nosy Mangabe. Ms. on
file, Museum of Anthropology, University of Michigan. As cited by: Dewar
R.E. (1995) Of nets and trees: untangling the reticulate and dendritic in
Madagascar's prehistory. World Archaeology 26:301-318.
Yamazaki K., Boyse E.A., Mike. V., Thaler H.T., Mathieson B.J., Abbott J.,
Boyse J., Zayas Z.A. and Thomas L. (1976) Control of mating preferences in
mice by genes in the major liistocompatibility complex. J. Exp. Med.
144:1324-1335.
Page 159
140
Zanelli R, Gonzalez-Gay M.A. and David C.S. (1995) Could HLA-DRB1 be
the protective locu i rheumatoid arthritis? Immunol. Today 16:274-278.
Zangenberg G., Huang M.M., AmheimN. and Erlich H.A. (1995) New HLA-
DPB1 alleles generated by interallelic gene conversion detected by analysis of
sperm. Nat. Genet. 10:407-141.
Page 160
141
APPENDIX Al:
SOLUTIONS.
4.3% Acrylamide gel preparation
36g Urea
lOmllOXTBE
10.6ml chilled 40% Acrylamide-bisacrylamide
make up to 100ml with autoclaved, filtered distilled water.
Degas and filter this acrylamide solution and store at 4°C in the dark.
Just prior to pouring the gel:
add 200pl 10% APS
24pl TEMED
to 40ml acrylamide solution.
2% Agarose gel
2g HOT agarose
100ml IX TBE
3 pi Ethidium bromide (0.3pg/ml stock)
(volumes adjust according to size of gel being poured).
Buffer 1
8.77gNaCl (0.15M)
12.1gTris (0.1M)
make up to volume (1 litre) with distilled water.
pH 8.0
Denaturation solution
Page 161
142
58.2gNaCl(lM)
20g NaOH (0.5M)
make up to volume (1 litre) with distilled water.
dNTP stock
125 pi dATP, dCTP, dGTP, dTTP (each a lOmM stock)
500pi autoclaved distilled water.
Dextran-formamide dye
20mg dextran
make up to 1ml in formamide.
Dilution Buffer
17.4gNaCl (0.3M)
12.1gTris (0.1M)
make up to volume (1 litre) with distilled water.
pH 8.0
Ficoll dye
50% sucrose
5QmM EDTA pH 7.0
0.1% Bromophenol blue
10% ficoll
Hybridization solution
(blot 11cm X 8cm)
625pl 20XSSC
5 pi 10% SDS
Page 162
143
125 pi liquid block (supplied in “gene images” kit - Amersham)
1.75ml distilled water
25mg hybridization component (supplied)
biotin labelled oligonucleotide (lOpmoles-single concentration; 20pmoles-
double concentration)
Ikb ladder
2.1ml IX TE
250pl Ikb ladder
125 pi ficoll dye
Neutralization solution
175.4gNaCl (3.0M)
60.6g Tris (0.5M)
make up to volume (1 litre) with distilled water.
pH 7.0
PCR denaturing solution
121.Img Tris-HCl (lOmM)
1.2gNaOH (0.3M)
make up to 100ml with distilled water.
PCR neutralizing solution
1.7ml Acetic acid (=0.3M)
make up to 100ml with distilled water.
Pre-Antibody blocking solution
1.5ml liquid block (supplied in “gene images” kit - Amersham)
Page 163
13.5ml Dilution buffer (above)
Pre-Hybridization blocking solution
750pl liquid block (supplied)
14.25ml Buffer 1 (above)
Proteinase K solution
1.4ml distilled water
0.4ml Proteinase K (lOmg/ml)
0.2ml 10% SDS
8pl 0.5M EDTA
(500pl sufficient for four extractions).
Saturated NaCl
40g NaCl (concentration not important)
100ml distilled water.
(Agitate before use and allow NaCl to precipitate out).
20XSSC
350.7gNaCl(3M)
176.5g Na citrate (3M)
make up to volume (2 litres) with distilled water.
Streptavidin-Alkaline Phosphatase (antibody) solution
(blot 11cm X 8cm)
50mg Bovine serum albumin
10ml Dilution buffer
40pi Streptavidin-AP (5000 X dilution)
Page 164
145
Sucrose-Triton X Lysing Buffer
7ml 1M Tris-HCl (autoclaved)
3.5ml 1M MgCl2
7ml Triton X-100
make up to 700ml then added 76.65g sucrose.
(Sufficient for ten extractions)
T20E5
0.6ml 1M Tris-HCl (20mM)
0.3ml 0.5M EDTA (5mM)
make up to 30ml with distilled water.
pH 8.0
10XTBE
109.02g Tris-base (0.9M)
55.64g Boric acid (0.9M)
7.44g EDTA (0.2M)
make up to volume (1 litre) with distilled water.
pH 8.0
1XTE
121.Img Tris-HCl (lOmM)
37.2mg EDTA (ImM)
make up to volume (100ml) with distilled water.
Tween 20 solution
2.25ml Tween 20
750ml Dilution Buffer.
Page 165
146
APPENDIX A2:
D’ VALUES AND EXPECTED NUMBER OF CHROMOSOMES FOR ALT,
POSSIBLE HAPLOTYPES PER POPULATION GROUP.
ANTEMORO:_____________________________ _________HAPLOTYPE (DQA1/DPB1 ♦) D’ EXPECTED NUMBER OF
CHROMOSOMES
1.1/0.011 -0.281129 4.6494
1.1/0201 -1 0.45018
1.1/0301 -1 0.45018
1.1/0401 0.215326 0.90036
1.1/0402 -1 1.64943
1.1/1301 0.055518 3.15003
1.1/1701 -1 0.15006
1.1/1 SOI -1 0.30012
1.1/3901 -1 0.15003
1.1/4001 1 0.15003
I.1/MD258 0.411765 0.30012
1.2/01011 -0.243501 7.12908
1.2/0201 0.999645 0.690276
1.2/0301 0.134199 0.690276
1.2/0401 0.049038 1.380552
1.2/0402 0.291864 2.529126
1.2/1301 -1 4.830046
1.2/1701 -1 0.230092
1.2/1801 -1 0.460184
1.2/3901 -1 0.230092
1.2/4001 -1 0.230092
U /M D 258 -1 0.460184
1.3/01011 0.917292 2.78964
1.3/0201 -1 0.270108
1.3/0301 -1 0.270108
1.3/0401 0.084249 0.540216
1.3/0402 -1 0.989658
1.3/1301 -1 1.890018
1.3/1701 -1 0.090036
1.3/1801 -1 0.180072
Page 166
147
1.3/3901 -1 0.090036
1.3/4001 -1 0.090036
1.3/MD258 -1 0.180072
2/01011 0.461707 3.40956
2/0201 -1 0.330132
2/0301 0.230936 0.330132
2/0401 -1 0.660264
2/0402 -1 1.209582
2/1301 -1 2.310022
2/1701 -1 0.110044
2/1801 -1 0.220088
2/3901 -1 0.110044
2/4001 -1 0.110044
2/MD258 -1 0.220088
3/01011 -0.401635 3.40956
3/0201 -1 0.330132
3/0301 -1 0.330132
3/0401 -1 0.660264
3/0402 0.197157 1.209582
3/1301 -0.476412 2.310022
3/1701 -1 0.110044
3/1801 0.99954 0.220088
3/3901 -1 0.110044
3/4001 -1 0.110044
3/MD258 0.438202 0.220088
4/01011 -0.248165 9.60876
4/0201 -1 0.930372
4/0301 0.033816 0.930372
4/0401 -0.251278 1.860744
4/0402 -0.046451 3.408822
4/1301 0.664081 6.510062
4/1701 1 0.310124
4/1801 -1 0.620248
4/3901 -1 0.310124
4/4001 -1 0.310124
4/MD258 -1 0.620248
Page 167
148
MEMNA:HAPLOTYPE (DQA1/DPBI *) D* EXPECTED NUMBER OF
CHROMOSOMES
1.1/01011 -1 0.59976
1.1/0201 -1 0.59976
LI/0202 -1 0.20016
Ll/0301 -1 0.9
1.1/0401 -1 0.30024
Ll/0402 -1 0.9
Ll/1301 0.962233 1.90008
Ll/1701 -I 0.10008
Ll/1801 0.999201 0.10008
LI/2601 -1 0.10008
Ll/2801 -1 1.30032
1.1/3101 -I 0.10008
Ll/3301 0.999201 ,0008
1.2/01011 0.031101 0.839664
1.2/0201 0.031101 0.839664
1.2/0202 0.999164 0.280224
1.2/0301 -0.206286 1.26
1.2/0401 0.224527 0.420336
1.2/0402 -1 1.26
1.2/1301 -1 2.660112
1.2/1701 -I 0,140112
1.2/1801 -1 0.140112
1.2/2601 -1 0.140112
1.2/2801 -1 1.820448
1.2/3101 -1 0.140112
1.2/3301 -I 0.140112
1.3/01011 0.432091 0.719712
1.3/0201 0.053121 0.719712
1.3/0202 -I 0240192
1.3/0301 0.036381 LOS
1.3/0401 -1 0.360288
1.3/0402 -1 1.08
1.3/1301 0.214667 2.280096
1.3/1701 -1 0.120096
1.3/1801 -1 0.120096
Page 168
149
].3/2601 -1 0.120096
1.3/2801 -I 1.560384
1.3/3101 -I 0.120096
1.3/3301 -1 0.120096
2/01011 -1 0.239904
2/0201 1 0.239904
2/0202 -I 0.080064
2/0301 -1 0.36
2/0401 -1 0.120096
2/0402 0.293714 0.36
2/1301 -1 0.760032
2/1701 -! 0.040032
2/1801 -1 0.040032
2^2601 -1 0.040032
2/2801 -1 0.520128
2/3101 -1 0.040032
2/3301 -1 0.040032
3/01011 -1 0.179928
3/0201 0.179928
3/0202 ; 0.060048
3/0301 0.386286 0 2 7
3/0401 -1 0.090072
3/0402 -1 0.27
3/1301 -1 0.570024
3/1701 0.999258 0.030024
3/1801 -1 0.030024
3/2601 -1 0.030024
3/2801 0.344642 0.390096
3/3101 -1 0.030024
3/3301 -1 0.030024
4/01011 -0.414924 3.418632
4/0201 -0.678187 3.418632
4/0202 -1 1.140912
4/0301 0 .n 3 0 2 3 5.13
4/0401 0.223691 1.711368
4/0402 0.715721 5.13
4/1301 -0.228575 10.830456
Page 169
150
4/1701 -1 0.570456
4/1801 -1 0.570456
4/2601 0.998327 0.570456
4/2801 0.820624 7.411824
4/3101 0.998327 0.57456
4/3301 -1 0.57456
TSIMIHETY:HAPLOTYPE (DQA1/DPB1 *) D’ EXPECTED NUMBER OF
CHROMOSOMES
1.1/01011 -0.77098 4.59
1.1/01012 -1 0.34
1.1/0201 -1 0.51
1.1/0202 1 0.17
1.1/0301 -1 0.68
1.1/0401 0.309719 1.02
1.1/0402 -1 1.87
1.1/1101 -1 0.17
1.1/1301 0.479741 2.21
1.1/1701 0.196787 0.51
1.1/1801 0 39759 0.34
1.1/1901 1 0.17
1.1/2801 -1 0.34
1.1/MD258 -1 0.51
1.1/MD294 -1 0.17
1.2/01011 -0.265502 7.29
1.2/01012 I 0.54
1.2/0201 0.086758 0.81
1.2/0202 -1 0.27
1.2/0301 0.315069 1.08
1.2/0401 -0.352099 1.62
1.2/0402 -1 2.97
1.2/1101 -1 0.27
1.2/1301 0.115195 3.51
1.2/1701 0.543379 0.81
1.2/1801 0.315069 0.54
1.2/1901 -1 0.27
Page 170
151
1.2/2801 -1 0.54
1.2/MD258 0.086738 0.81
1.2/MD294 -1 0.27
1.3/01011 -0.409101 1.89
1.3/01012 0.14
1.3/0201 0.641577 0.21
1.3/0202 0.07
1.3/0301 0.28
1.3/0401 0.089421 0.42
1.3/0402 0.047619 0.77
1.3/1101 0.07
1.3/1301 0.91
1.3/1701 0.21
1.3/1801 0.14
1.3/1901 0.07
1.3/2801 0.14
1.3/MD258 0.21
1.3/MD294 0.07
2/01011 -0.273227 1.89
2/01012 0.14
2/0201 0.21
2/0202 0.07
2/0301 0.28
2/0401 0.42
2/0402 0.798426 0.77
2/1101 -1 0.07
2/1301 0.91
2/1701 -1 0.21
2/1801 -1 0.14
2/1901 -1 0.07
2/2801 -1 0.14
2/MD258 0.21
2/MD294 -1 0.07
3/01011 0.185962 2.7
3/01012 -1 0.2
3/0201 -1 0.3
3/0202 -1 0.1
Page 171
152
3/030! -1 0.4
3/0401 -1 0.6
3/0402 0.176 1.1
3/1101 -1 0.1
3/1301 -1 1.3
3/1701 -I 0.3
3/1801 -1 0.2
3/1901 -1 0.1
3/2801 -1 0.2
3/MD258 0.62963 0.3
3/MD294 1 0.1
4/01011 0.341179 8.64
4/01012 -1 0.64
4/0201 -1 0.96
4/0202 -1 0.32
4/0301 0.264706 1.28
4/0401 -0.216667 1.92
4/0402 -0.130909 3.52
4/1101 1 0.32
4/1301 -0.757308 4.16
4/1701 -1 0.96
4/1801 -1 0.64
4/1901 -1 0.32
4/2801 1 0.64
4/MD258 -1 0.96
4/MD294 -1 0.32
TSONGA:HAPLOTYPE (DQA 1 /DPB1 *) D ' EXPECTED NUMBER OF
CHROMOSOMES
1.1/01011 0.258086 5.76932
1.1/01012 -1 0.170068
1.1/0201 -1 0.340136
1.1/0301 -1 0.170068
1.1/0401 -1 1.190476
1.1/0402 -0.537942 3.229898
1.1/1301 0.464305 1.530612
Page 172
153
1.1/1701 -1 0.340136
1.1/1801 -1 1.020408
1.1/1901 -1 0.170068
1.1/3401 -1 0.170068
1.1/TS013 -I 0.340136
1.2/01011 -0.463598 7.749
1.2/01012 -1 0.2501
1.2/0201 -1 0.5002
1.2/0301 -1 0.2501
1.2/0401 0.574551 1.7507
1,2/0402 -0.0612 4.74985
1.2/1301 -I 2.2509
1.2/1701 -1 0.5002
1.2/1801 0.025683 1.5006
1.2/1901 -1 0.2501
1.2/3401 -1 0.2501
1.2/TS013 0.333333 0.5002
1.3/01011 -1 2.47968
1.3/01012 1 0.080032
1.3/0201 -1 0.160064
1.3/0301 I 0.080032
1.3/0401 0.! 11907 0.560224
1.3/0402 0.171548 1.519952
1.3/1301 -I 0.720288
1.3/1701 -I 0.160064
1.3/1801 0.163548 0.480192
1.3/1901 1 0.080032
1.3/3401 -1 0.080032
1.3/TS013 -1 0.160064
2/01011 -0.462081 1.85976
2/01012 -1 0.060024
2/0201 -1 0.120048
2/0301 -1 0.060024
2/0401 0.128945 0.420168
2/0402 -0.122428 1.139964
2/1301 -I 0.540216
2/1701 0.468085 0.120048
Page 173
154
2/1801 -1 0.360144
2/1901 -1 0.060024
2/3401 -1 0.060024
2/TS013 0.468085 0.120048
3/01011 0.030386 3.0996
3/01012 -1 0.10004
3/0201 -1 0.20008
3/0301 -I 0.10004
3/0401 -1 0.70028
3/0402 0.292985 1.89994
3/1301 -1 0.90036
3/1701 -1 0.20008
3/1801 -1 0.60024
3/1901 -1 0.10004
3/3401 -1 0.10004
3/TS013 -1 0.20008
4/01011 0.262011 10.53864
4/01012 -1 0.340136
4/0201 0.999379 0.680272
4/0301 -1 0.340136
4/0401 -1 2.380952
4/0402 -0.083881 6.459796
4/1301 0.157973 3.061224
4/1701 0.242424 0.680272
4/1801 0.242217 2.040816
4/1901 -1 0.340136
4/3401 1 0.340136
4/TS013 -1 0.680272
INDONESIANS:HAPLOTYPE (DQA1/DPB1 *) D ’ EXPECTED NUMBER OF
CHROMOSOMES
1.1/01011 0.524618 0.31744668
1.1/0201 -I 0.15797816
1.1/0202 -1 0.31744668
1.1/0301 0.524618 0.63481336
1.1/0401 -I 1.7437212
Page 174
155
1,1/0402 -1 0.95084968
1.1/0501 -0.181384 2.69606124
1.1/0901 -1 0.31744668
1.1/1301 0.288118 4.91520728
1.1/1401 -1 0.15797816
1.1/2601 -1 0.15797816
1.1/2801 -1 2.37861456
I.1/NEW2 -1 0.15797816
1.2/01011 -1 0.38090364
1.2/0201 -1 0.18955768
1.2/0202 -1 0.38090364
1.2/0301 -1 0.76180728
1.2/0401 0.540292 2.0922876
1.2/0402 -1 1.14092264
1.2/0501 -1 3.23499852
1.2/0901 0.38090364
1.2/1301 0.350594 5.89774744
1.2/1401 -1 0.1c j 768
1.2/2601 0.18955768
1.2/2801 -0.602438 2.85409488
1.2/NEW2 -1 0.18955768
1.3/01011 0.04759272
1.3/0201 -1 0.02368464
1.3/0202 0.606265 0.04759272
1.3/0301 0.09518544
1.3/0401 0.2614248
1.3/0401 0.14255422
1.3/0501 0.325624 0.40420296
1.3/0901 0.04759272
1.3/1301 0.7369051.2
1.3/1401 0.02368464
1.3/2601 0.02368464
1.3/2801 0.35661024
1.3/NEW2 1 0.02368464
2/01011 -1 0.06345696
2/0201 -1 0.03157952
2/0202 -1 0.06345696
Page 175
156
2/0301 -1 0.12691392
2/0401 -1 0.3485664
2/0402 0.290445 019007296
2/0501 0.598863 0.53893728
2/0901 -1 0.06345696
2/1301 -1 0.98254016
2/1401 -1 0.03157952
2/2601 -1 0.03157952
2/2801 -1 0.47548032
2/NEW2 -1 0.03157952
3/01011 -1 0.06345696
3/0201 -1 0.03157952
3/0202 -1 0.06345695
3/0301 -1 0.12691392
3/0401 -1 0.3485664
3/0402 -1 0.19007296
3/0501 -1 0.53893728
3/0901 -1 0.06345696
3/1301 -1 0.98254016
3/1401 -1 0.031579=2
3/2601 -1 0.03157952
3/2801 1 0.47548032
3/NEW2 -1 0.03157952
4/01011 0.291247 0.74594304
4/0201 1 0.37122048
4/0202 -1 0.74594304
4/0301 -1 1.49188608
4/0401 -0.210774 4.0974336
4/0402 0.6753 2.23432704
4/0501 0.331565 6.33526272
4/090! -1 0.74594304
4/1301 -0.298028 11.54985984
4/1401 1 037122048
4/2601 1 0.37122048
4/2801 0.042255 5.58931968
4/NFW2 -1 0.37122048
Page 176
157
APPENDIX A3:
ETHTCS CLEARANCE CERTIFICATE.UNI VERSI TY OF THE WITWATERSRANO. JOHANNESBURG
D i v i s i o n o f t h e D e p u t y R e g i s t r a r f R e s e a r c h )
COMMITTEE FOR RESEARCH ON HUMAN SUBJECTS (MEDICAL) R e f : R 1 4 / 4 9 T u r n e r
CLEARANCE CERTIFICATE PROTOCOL NUMBER M 9 5 0 7 2 2
PROJECT An i n v e s t i g a t i o n o f t h e HIA C l a s s p o l y m o r p h i s m i n t h e M a l a g a s y
INVESTIGATORS M i s s A T u r n e r
OEPARTMENl Human G e n e t i c s , 5 AI n R
DATE CONSIDERED 9 6 0 7 2 5
DECI SI ON OF THE COMHI
A p p r o v e d u n c o n d i t i o n a l l y
DATE 9 3 0 3 0 5
CHAIRMAN. ? ( P r o f e s s o r F E C l e a t o n - J o n e s )
c c S u p e r v i s o r : Dr A S LaneD e p t o f Human G e n e t i c s , SAIMR
DECLARATION OF INVESTIGATOR( 3 )
T o b e c o m p l e t e d i n d u p l i c a t e a nd ONE COPY r e t u r n e d t o t h eS e c r e t a r y a t Room 1 0 0 0 1 , 1 0 t h F l o o r , S e n a t e H o u s e , U n i v e r s i t y .
!/-*-= f u l l y u n d e r s t a n d t h e c o n d i t i o n s u n d e r w h i c h I a m /^ e — a u t h o r i z e d t o c a r r y o u t t h e a b o v e m e n t i o n e d r e s e a r c h a nd I / V » g u a r a n t e e t o e n s u r e c o m p l i a n c e w i t h t h e s e c o n d i t i o n s . S h o u l d a n yd e p a r t u r e t o be c o n t e m p l a t e d f r o m t h e r e s e a r c h p r o c e d u r e a sa p p r o v e d I Are- u n d e r t a k e t o r e s u b m i t t h e p r o t o c o l t o tr i e C o m m i t t e e .
. .................................................... o i u f l r t . u n :
Page 177
Author Turner A A
Name of thesis An Investigation Of The Hla Class Ii Polymorphism In The Malagasy Turner A A 1999
PUBLISHER: University of the Witwatersrand, Johannesburg
©2013
LEGAL NOTICES:
Copyright Notice: All materials on the Un i ve r s i t y o f the Wi twa te r s rand , Johannesbu rg L ib ra ry website are protected by South African copyright law and may not be distributed, transmitted, displayed, or otherwise published in any format, without the prior written permission of the copyright owner.
Disclaimer and Terms of Use: Provided that you maintain all copyright and other notices contained therein, you may download material (one machine readable copy and one print copy per page) for your personal and/or educational non-commercial use only.
The University of the Witwatersrand, Johannesburg, is not responsible for any errors or omissions and excludes any and all liability for any errors in or omissions from the information on the Library website.