Page 1
THE 19TH INTERNATIONAL CONFERENCE ON COMPOSITE MATERIALS
1 Introduction
When composite laminates are loaded above their
elastic limit, transverse cracks initiate in the off-axis
plies. Upon further loading, these cracks propagate
until they reach the ply boundaries, at which point
they form micro-delaminations. These micro-
delaminations then grow progressively and coalesce
to form macroscopic delaminations. The composite
material/structure then loses all of its structural
integrity, and fails catastrophically.
Advanced three-dimensional finite element damage
models are now commonplace to model failure in
laminated composite materials and structures. In
general, these models treat transverse cracks and
delamination as two separate non-interacting damage
mechanisms. However, as described above, these
damage mechanisms are in fact highly coupled. This
paper, thus, sets out to investigate the relationship
between transverse cracks and delamination in
laminate composite materials.
In order to examine this transverse crack-
delamination relationship (coupling), three-point,
four-point and four-point offset bending experiments
are carried out using a micro-tensile tester housed in
the chamber of a scanning electron microscope
(SEM), which allows for real-time analysis of the
microscopic damage mechanisms, as they initiate and
grow. The different bending modes produce different
combinations of direct (tension/compression) and
shear stresses on the composite beams. A suitable
combination of these test results allows for the
isolation of specific stresses and the effect of these
stresses on the damage progression. The failed beams
are subsequently analysed under an SEM to examine
the failure surfaces and conclusions are drawn.
2 Problem Description
2.1 Beam Geometries and Material
All testing was carried out using the carbon fibre
reinforced polymer, HTA/6376. The test specimens
were made using a vacuum assisted autoclave
process. Four different laminates were manufactured
and tested, which were variations of [90/0/90] and
[0/90/0] stacking sequences, as seen in Figure 1. All
specimens were 7mm wide, where the width is
represented by H. Thickness, T, is dependent on
stacking sequence and span length, L, is dependent on
test method. The thickness of each ply prior to curing
is given as 0.125mm. The coordinate system used is
shown in Figure 2.
Fig. 1: Thickness and fibre direction for (A)[904/07/904]
and (B)[04/90x/04] specimens.
The [90/0/90] specimen is used because the
transverse crack growth and development of
delaminations were easily tracked with 90˚ plies on
the outer tensile surface of the specimen. Due to the
steady growth of the delaminations, these specimens
AN INVESTIGATION INTO THE INTERACTION OF TRANSVERSE
MATRIX CRACKS AND DELAMINATIONS IN LAMINATED
COMPOSITE MATERIALS
D.J. Mortell1, D.A. Tanner2, C.T. McCarthy1* 1 Department of Mechanical, Aeronautical and Biomedical Engineering, and 2 Material and Surface Science
Institute, University of Limerick, Limerick, Ireland.
*Corresponding Author: ([email protected] )
Keywords: transverse cracking, delamination, micro-crack, scanning electron microscope,
micro-mechanical testing, flexure
Keywords: microtesting, SEM, transverse, crack, delamination (no more than 7)
Thickness for [904/07/904] = 2.038mm
Thickness for [04/903/04] = 1.544mm
Thickness for [04/907/04] = 2.038mm
Thickness for [04/9011/04] = 2.6mm
A
B
Page 2
2
are ideal for measurement of delamination length as a
function of applied load.
Specimens with a [0/90/0] stacking sequence were
loaded until significant transverse crack damage was
observed. The thickness of the 90˚ plies was varied to
investigate the correlation between the location of
transverse cracking and the thickness of the 90˚
section of the specimens. The [0/90/0] stacking
sequence was used in this case as having the stiffer 0˚
plies on the exterior of the specimen is more
representative of what would be used in industry and
is therefore highly relevant.
Fig. 2: Coordinate system and general dimensions for
specimens.
2.2 Characteristics Studied
The characteristics of delaminations that were studied
in this research were as follows:
The delamination length as a function of
applied load for specimens with single or
multiple transverse cracks.
The load levels at which new transverse
cracks were initiated.
The location of transverse cracks across the
span length as a function of the thickness of
the 90° layer in a [0/90/0] sequenced laminate.
2.3 Test Methods
All testing was conducted using a microtester (Deben
Ltd, UK) which provided three- and four-point
bending, as well as four-point offset bending
facilities, as shown in Figures 3, 4 and 5. The test rig
was specially designed to be controlled and carry out
tests from outside the SEM. Real-time video footage
was recorded during testing to identify failure events.
This video footage was then correlated with the load-
displacement data received from the mechanical
tester. From this data, the effects of the stress state on
the failure of the specimen was then interpreted.
2.3.1 Three-Point Bending
Figure 3 shows the geometry for the span length used
during three-point bending. Pins of 5mm diameter
with 8mm diameter lubricated bushings were used to
reduce frictional effects in all tests conducted. The
diameter of the loading pins do not have a strong
influence on test results, once bearing damage is
avoided from particularly small diameter pins [1].
The bending moment (BM) is represented by the
hatched pattern on the specimens in Figures 3, 4 and
5. Maximum normal stress due to bending occurs at
the centre of the span length at the loading pin.
Normal stresses are zero at the outer support pins.
Maximum tensile stress is on the surface furthest
from the loading pin, and maximum compressive
stress is on the surface touching the pin. Due to the
contact with the loading pin, there are additional
stress concentrations associated with this location.
The interlaminar shear stress is constant across the
span length of the specimen, varying parabolically
across the thickness, peaking at the neutral axis.
Fig. 3: Three-point bending moment variation across
span length. Distances between pins also shown.
2.3.2 Four-Point Bending
Figure 4 shows the geometry for the span length
tested in four-point bending. The bending moment,
which is at zero at each of the support pins, reaches a
maximum between the loading pins and is constant in
this section of the span length. Interlaminar shear
stress exists only in the outer quarters of the span
length, between the left and right sets of load and
support pins.
Support Pins
Loading Pin
Page 3
3
AN INVESTIGATION INTO DELAMINATION CRACKS AT PLY BOUNDARIES DUE TO MATRIX
CRACKING IN TRANSVERSE PLIES
Fig. 4: Four-point bending moment variation across
span length. Distances between pins also shown
2.3.3 Four-Point Offset Bending
The case of the stress state in four-point offset
bending is nearly the exact opposite of that for regular
four-point bending. At the centre of the span length
seen in Figure 5, the bending moment is zero, and the
interlaminar shear stress is at a constant maximum
between the two central opposing pins. Failure in this
region is attributed to shear stress. The results of four-
point offset bend tests were used in conjunction with
equations 1 - 4 to calculate the interlaminar shear
stress associated with the maximum load prior to
failure of specimens.
Fig. 5: Four-point offset bending moment variation
across span length. Distances between pins also shown.
3 Theoretical Analysis
3.1 Maximum Bending Moment
The following equation is used when calculating the
maximum bending moment in
Three-point flexure:
𝐵𝑀𝑚𝑎𝑥 =𝑃𝐿
4 (1)
Four-point flexure:
𝐵𝑀𝑚𝑎𝑥 =𝑃(𝐿 − 𝐿1)
4 (2)
For the crosshead geometry used in this study a higher
load is required in four-point bending when compared
to three-point bending to achieve comparable shear
and normal stresses. The negative side effects of this
relationship is discussed later.
3.2 Local Delamination Ratio
The local delamination ratio, τLDR, can be calculated
by measuring the lengths of delaminations under
SEM [2]. The local delamination ratio is then plotted
against the force applied, and repeated for various
different load levels.
𝜏𝐿𝐷𝑅 =𝑒
𝐻1 (3)
Where e is the length of the delamination to one side
of the transverse crack and H1 is the thickness of the
90° section of a laminate following a [90/0/90]
stacking sequence. This can be seen in Figure 6.
Fig. 6: Local delamination ratio of a [90/0/90] stacked
specimen.
3.3 Interlaminar Shear Stress For three-point bending of short beams and offset
four-point bending Equation 4 from classical beam
theory can be used to calculate the interlaminar shear
stress of unidirectional composite materials [3,4,5].
𝜏𝑢𝑛𝑖 =3𝑃
4𝑇𝐻 (4)
where P is the load applied.
1
Support Pins
Loading Pins
Page 4
4
However, none of the specimens tested for this paper
were unidirectional laminates. Interlaminar shear
stress of heterogeneous beams can be calculated once
a correction factor, β, has been applied [3,5]. β takes
the thickness of the 0° and 90° plies into consideration
(see Figure 7) when calculating interlaminar shear
stress by
𝜏𝑚𝑢𝑙𝑡𝑖 =3𝑃
4𝑇𝐻𝛽 (5)
where
𝛽 =1 + 𝑘2(𝑛 − 1)
1 + 𝑘3(𝑛 − 1) (6)
and from Figure 7
𝑘 =ℎ1
ℎ2 (7)
and
𝑛 =𝐸1
𝐸2 (8)
Where E1 and E2 are 140GPa and 10GPa,
respectively, for HTA/6376 [6].
Fig. 7: Ratio of ply thicknesses, to be used when
determining correction factor, k, for shear stress
calculation.
4 Results
The results from three- and four-point, as well as
offset bending are addressed separately.
4.1 Three Point Bending
4.1.1 Transverse Crack and Delamination
Development
In all stacking sequences tested, failure generally
occurred at the centre of the span length, at the central
loading pin of the three-point bending apparatus.
Examples of this can be seen in Figure 8.
Fig. 8: Failure in Three-Point Bending for (A)
[904/07/904], (B) [04/907/04], and (C) [04/903/04].
In the [904/07/904] specimens under three-point
bending, a number of locations along the span length
can be identified during testing at which microcrack
growth can be observed (Figure 9(A)). Generally,
only a single transverse crack fully develops from
this. While testing, it was observed that microcrack
growth occurred very gradually. The coalescence of
these microcracks and full transverse crack (Figure
9(B)) development was an almost instant process.
When delamination follows (Figure 9(C)), it was
observed to be a steady process with no sudden
changes but gradual separation between the plies
(Figure 9(D)) as load continued to increase.
A
B
C
Page 5
5
AN INVESTIGATION INTO DELAMINATION CRACKS AT PLY BOUNDARIES DUE TO MATRIX
CRACKING IN TRANSVERSE PLIES
Fig. 9: A - D, Stages of Failure in a [90/0/90] stacked
laminate. (A) Microcracking, (B) transverse cracking,
(C) delamination and (D) catastrophic failure are
shown.
In Figure 10A-E, all images were focused on the same
region of the [04/907/04] specimen during testing and
the mechanics of the delamination can be observed.
The failure of the bond between fibre and matrix as
delamination occurs is between 263N – 305N. The
series of images show the development of cusps [7]
associated with failure involving shear stress.
Fig. 10: A - E, Stages of Delamination. (A) 263N, (B)
285N, (C) 290N, (D) 295N and (E) 305N. Crescent
shaped voids are shown growing into delaminations,
with visible cusps.
While testing specimens with 0˚ on the exterior, such
as the [04/907/04] specimen seen in Figure 11, there
was very little indication, if any, of microcrack
growth prior to sudden catastrophic delamination.
Fig. 11: Z-Shaped Delamination Path in a [0/90/0]
stacked specimen. Crack path follows ply boundary
closest to loading/support pins.
Figure 11 shows the typical type of failure associated
with specimens tested with the 0˚ plies on the
exterior. Transverse cracking and delamination occur
suddenly and simultaneously, following a Z-shaped
path (highlighted in Figure 11 in white). It was noted
in both three- and four-point bending of these
specimens that the delamination occurred on the ply
boundary between the 0˚ and 90˚ plies closest to the
pins.
4.1.2 Three-Point Delamination Lengths
The load and displacement data for the specimens
tested in three-point bending can be seen in Figure 12.
Fig. 12: Three-point bending, load – displacement data
for all specimens tested.
0
200
400
600
800
1000
1200
0 1 2 3 4
Load
(N
)
Displacement (mm)
Series1
Series5
Series8
[04/9011/04]
A B
C D
A B
C D
E Cusps
Support Pin
Z-Shaped
Delamination
Loading Pin
[904/07/904]
[04/9011/04]
[04/907/04]
[04/903/04]
Page 6
6
Delaminations to the left and the right of the
transverse crack (TC), seen in Figure 13 were
measured at various load levels. Figure 14 shows the
length of the delaminations on either side of the main
transverse crack in two different [904/07/904]
specimens, similar to what is seen in the SEM image
of Figure 9(C).
Fig. 13: Delamination length left and right of TC in a
[90/0/90] stacked specimen.
The black markers on Figure 14 are from a specimen
with one transverse crack. The white markers are
from a specimen which developed a number of
transverse cracks, but only the lengths of the
delamination at the centre of bending were measured.
Fig. 14: Measurement of delamination lengths either
side of a transverse crack in two different [904/07/904]
specimens. Black markers for specimen with a single
TC, white markers for specimen with multiple TCs.
4.2 Four-Point Bending
4.2.1 Transverse Crack Location along Span
Catastrophic failure in four-point bending occurred in
different locations along the span length of the
specimen depending on stacking sequence. Figure 15
highlights the location of failure in four samples, one
from each variety of stacking sequence tested.
Fig. 15: Transverse cracking in (A) [904/07/904], (B)
[04/9011/04], (C) [04/903/04] and (D) [04/907/04].
The locations of the centre point of the transverse
crack on [0/90/0] stacked specimens was measured
with reference to the closest support pin which varied
from left to right depending on the particular
specimen, illustrated in Figure 16. These
measurements have been compiled in Figure 17 for
0
1
2
3
4
5
6
0 100 200 300 400 500
e/H1
Load (N)Single - Left of TC Single - Right of TC
Multi - Left of TC Multi - Right of TC
A
B
C
D
Page 7
7
AN INVESTIGATION INTO DELAMINATION CRACKS AT PLY BOUNDARIES DUE TO MATRIX
CRACKING IN TRANSVERSE PLIES
the various [0/90/0] specimens tested and plotted
against the thickness of the 90˚ plies.
Fig. 16: Transverse crack location in a [0/90/0]
specimen. Location given relative to loading and
support pins.
Fig. 17: Measurement of transverse crack location with
varying thickness of 90° plies.
All load and displacement data for specimens tested
in four-point bending can be seen in Figure 18. As
with the three-point bending test results, each
different stacking sequence tested is visually distinct
due to the variations in stiffness between specimens
tested.
4.2.2 Four-Point Delamination Length
Fig. 18: Four-point bending, load – displacement data
for all specimens tested.
Figure 19 indicates the load levels for three
[904/07/904] specimens at which a transverse crack
occurs. The hatched portion at the bottom of each bar
indicates the range of loading values for which there
were no transverse cracks. The top of each bar is the
load level at which the specimens failed. Each
horizontal line indicates the initiation of a new
transverse crack as load is increased, observed using
the SEM.
Fig. 19: Transverse crack initiation loads, and ultimate
failure loads for three [90/0/90] specimens.
0
0.1
0.2
0.3
0.4
0.5
0.6
0.7
0.8
0 1 2 3 4 5 6 7 8 9 10 11 12
A/B
Number of 90˚ Plies
Series1
Series2
[04/9011/04]
0
200
400
600
800
1000
1200
1400
0 2 4 6 8
Load
(N
)
Displacement (mm)
Series1
Series4
Series7
[04/9011/04]
[04/903/04]
[04/907/04]
[04/9011/04]
[04/9011/04]
[04/903/04]
[904/04/904]
[04/907/04]
Specimen A
Specimen B
Specimen C
Page 8
8
Specimens of stacking sequence [904/07/904] are used
to measure the length of delamination as a function of
load. A number of different transverse cracks (seen in
Figure 20) developed delaminations between the
loading pins of the four-point bending crossheads.
Similar to Figure 14, these are measured to the left
and right of the contributing transverse crack and can
be seen in Figure 20 and Figure 21.
Fig. 20: Delamination lengths to left of multiple TCs in
a [90/0/90] specimen.
Fig. 21: Delamination Lengths to right of multiple TCs
in a [90/0/90] specimen.
4.3 Four-Point Offset Bending
Four-point offset bending was carried out in order to
establish a value for the interlaminar shear strength of
the materials tested in the standard three- and four-
point flexural tests seen previously. Specimens of
[04/9011/04] (Figure 22(A)), [04/907/04] (Figure 22(B))
and [04/903/04] (Figure 22(C)) were tested and all
exhibited very similar failure modes. Transverse
cracks developed in all specimens at the centre of the
span length, between the two inner loading pins.
Fig. 22: Specimens (A) [04/9011/04], (B) [04/907/04] and
(C)[04/903/04] after failure during interlaminar shear
tests, under four-point offset bending. Transverse
crack location is highlighted in images.
4.3.1 Interlaminar Shear Stress
The load displacement data for four-point offset
bending can be seen in Figure 23.
Fig. 23: Four-point offset bending, load – displacement
data for [0/90/0] stacked laminates with varying
thicknesses of 90° plies.
Using the method outlined from Equation 4 – 8, the
interlaminar shear strength was calculated. Results
are seen in Table 1.
0
0.5
1
1.5
2
2.5
3
3.5
4
4.5
5
0 100 200 300 400 500
e/H1
Load(N)
0
0.5
1
1.5
2
2.5
3
3.5
4
4.5
0 100 200 300 400 500
e/H1
Load (N)
0
100
200
300
400
500
600
700
0 0.5 1 1.5 2
Load
(N
)
Displacement (mm)
Series2
Series3
Series4
A
B
C
[04/907/04]
[04/9011/04]
[04/903/04]
Page 9
9
AN INVESTIGATION INTO DELAMINATION CRACKS AT PLY BOUNDARIES DUE TO MATRIX
CRACKING IN TRANSVERSE PLIES
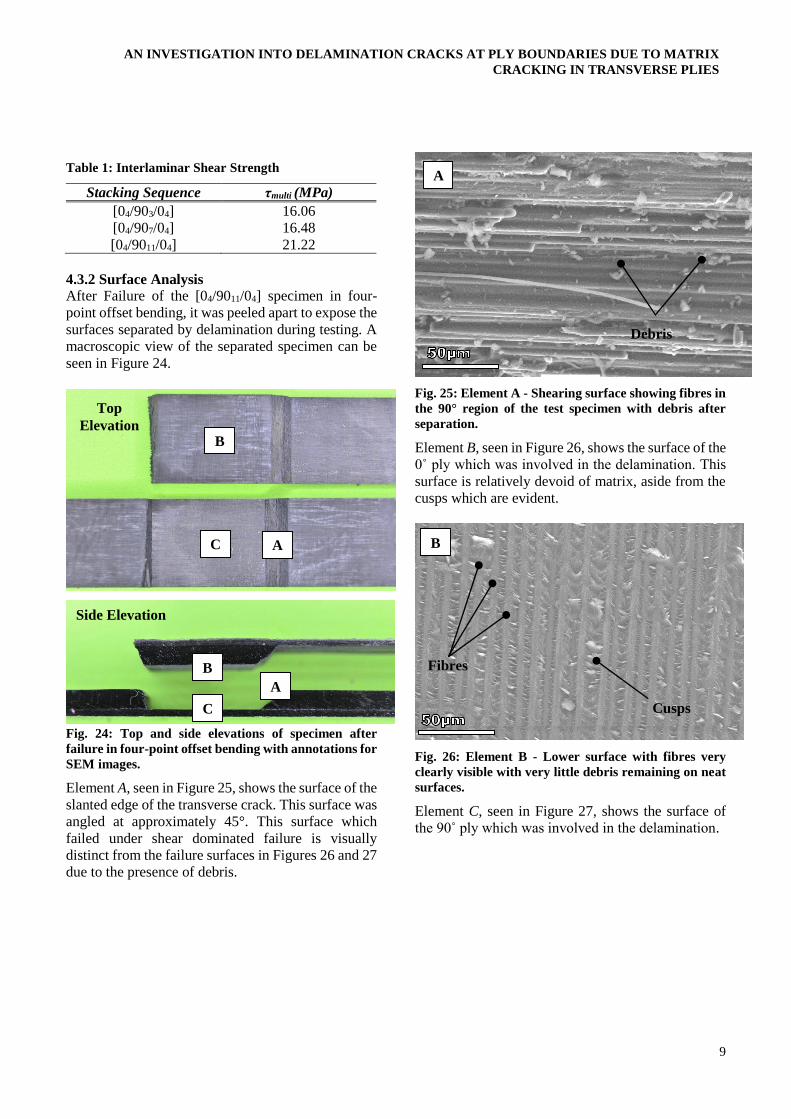
Table 1: Interlaminar Shear Strength
Stacking Sequence τmulti (MPa)
[04/903/04] 16.06
[04/907/04] 16.48
[04/9011/04] 21.22
4.3.2 Surface Analysis
After Failure of the [04/9011/04] specimen in four-
point offset bending, it was peeled apart to expose the
surfaces separated by delamination during testing. A
macroscopic view of the separated specimen can be
seen in Figure 24.
Fig. 24: Top and side elevations of specimen after
failure in four-point offset bending with annotations for
SEM images.
Element A, seen in Figure 25, shows the surface of the
slanted edge of the transverse crack. This surface was
angled at approximately 45°. This surface which
failed under shear dominated failure is visually
distinct from the failure surfaces in Figures 26 and 27
due to the presence of debris.
Fig. 25: Element A - Shearing surface showing fibres in
the 90° region of the test specimen with debris after
separation.
Element B, seen in Figure 26, shows the surface of the
0˚ ply which was involved in the delamination. This
surface is relatively devoid of matrix, aside from the
cusps which are evident.
Fig. 26: Element B - Lower surface with fibres very
clearly visible with very little debris remaining on neat
surfaces.
Element C, seen in Figure 27, shows the surface of
the 90˚ ply which was involved in the delamination.
A
B
C
A
B
Top
Elevation
Side Elevation
Fibres
Cusps
Debris
B
C
A
Page 10
10
Fig. 27: Element C - Upper surface showing matrix
material and very clear imprints of where fibres were
pulled away from.
5 Discussion
In three-point bending, failure generally occurred at
the centre of the span length of the specimen. This is
due to the coinciding of maximum shear stress and
direct stress due to bending at this location.
Microcrack growth in the [904/07/904] specimens was
relatively slow and steady with increasing load, prior
to sudden transverse crack growth. The gradual crack
opening which separated fibres and matrix, with
eventual failure of resin bridges connecting fibres
leading to ultimate failure which was observed during
testing is very similar to descriptions of similar failure
seen in previous research [8].
When the transverse crack reaches the ply boundary,
it is shown in Figure 10 that delamination in three-
point bending is a steady process, where there is an
almost linear increase in delamination length relative
to applied load. Figure 14 shows two of the same type
of specimen, [904/07/904], however the delamination
lengths of one of these specimens (white markers) is
significantly lower than the other specimens (black
markers). This is due to that particular specimen
having a number of transverse cracks and
delaminations along its span length. In the specimen
with the single transverse crack, the delamination is
focused at the centre of curvature. Delamination
lengths of both specimens tested showed a relatively
linear response to load increase. The delamination
lengths were presented in terms of τLDR which will
allow for appropriate comparison with specimens of
varying 90° ply thicknesses.
In four-point bending, there were typically 5 or 6
transverse cracks in [904/07/904] specimens tested
prior to ultimate failure. Figure 19 shows where the
initiation loads for transverse cracks were recorded. It
can be noted from Figure 19 that there is a relatively
steady increase in the number of transverse cracks
from the first to ultimate failure as load is increased
Ultimate failure in these specimens occurred when
the delamination from one transverse crack met an
opposing delamination from an alternative transverse
crack. This resulted in an immediate decrease in the
stiffness of the material.
Failure in the [904/07/904] specimens was observed in
the region of constant maximum tensile stress
between the two loading pins. However, failure in the
alternative style of stacking sequence, [0/90/0],
occurred beyond this region, in the quarters of the
span length between the loading pin and support pin.
This is the region of maximum shear stress in four-
point bending. Failure in this region was
characterised by a sudden transverse crack and
delamination which occurred simultaneously with no
obvious indication that failure was approaching. It
can be seen in Figure 11 that with this type of
transverse failure at the core of a specimen, the
delamination develops in a z-shaped path. The path
followed the boundary of alternately orientated plies
swapping from tensile to compressive sides of the
neutral axis to remain close to the nearest loading or
support pin. Transverse failure in this region is shear
stress dominated.
The location of the transverse crack relative to the
nearest support pin was measured. This distance was
then plotted against the number of 90° plies at the
core of the [0/90/0] specimens in Figure 17. It is
plotted in terms of A/B so as to allow for comparison
with similar analyses with varying distances between
loading and support pins. It is indicated from this
chart that the linear increase in thickness of the 90°
portion of the specimen, resulted in a linear increase
in distance from the outer support pin. It was
observed that the thinnest specimens failed closer to
the outer support pin, and with increasing thickness
this transverse failure approached the nearest loading
pin. This is most likely an effect of local stress
concentrations due to the pin diameters and span
length of the beam which will be investigated further
in future work. It was noted during testing that the
fewer the number of 90° plies in the [0/90/0]
sequenced specimens, the more difficult it is to induce
C
Fibre Imprints
Page 11
11
AN INVESTIGATION INTO DELAMINATION CRACKS AT PLY BOUNDARIES DUE TO MATRIX
CRACKING IN TRANSVERSE PLIES
transverse crack failure, and alternative failure modes
are often observed. For example, [04/903/04] nearly
always failed at the loading pin in the 0° plies by
compression and buckling. It was found in the
[04/907/04] specimens, that failure could be
encouraged to occur due to a transverse cracking in
the 90° plies by reducing the rate at which the
displacement was applied to the specimen.
It is suggested from Equations 1 and 2 that the
increased likelihood of failure due to compression
and buckling at the pins in four-point bending is as a
result of the differences in geometry of the three- and
four-point bending crossheads, in particular the
lengths L and L1. From Equations 1 and 2 it was
determined that the ratio of the bending moment
induced for a particular load applied for three- and
four-point bending was 14:15. This means that to
induce an equivalent bending moment, for every 14N
applied in three point bending, 15N is to be applied in
four-point bending. Although the bending moments
are the same, the stress concentration factor between
the specimen and the loading pin has a greater role to
play in failure due to the increased load required,
leading to the compressive buckling failure at the pins.
In four-point bending, the lengths of the
delaminations were measured from all transverse
crack locations. With the constant bending moment
between the two loading pins it was indicated that
there was a linear increase in delamination length
with load applied, independent of where across L1 the
transverse crack was located.
It was determined in four-point bending that in many
of the specimens of [0/90/0] stacking sequence,
excessive interlaminar shear stress was the leading
contributor to specimen failure. This was determined
from the location of failure, being outside of the
region of maximum normal stresses, but in the region
under the influence of interlaminar shear stress.
The four-point offset bend tests were carried out to
determine the interlaminar shear strengths of the
various stacking sequences. All specimens tested
failed in the region between the two central loading
pins. This region is subjected to pure shear stress with
no bending moment to provide normal stresses. This
allows for the interlaminar shear strength of the
material to be determined for the various stacking
sequences.
The two different sides of the delamination in four-
point offset bending were separated and this allowed
for SEM visual inspection of these surfaces. Figures
26 and 27 show the fibre dominated and matrix
dominated faces of the specimen. It can be seen that
there is very little contamination or bridging between
the two surface types in these two regions which were
peeled under mode-I dominated failure. The fibres,
and the imprints of the fibres on the opposing matrix
dominated surface are well defined. It has been
suggested that if bare fibres are very easily observed
after failure that there is a poor fibre matrix interface
strength [7]. Failure of this nature is attributed to
adhesive interfacial failure [8]. The blunt appearance
of the cusps seen in Figure 26 indicate a relatively
ductile matrix [7]. Figure 25 shows the slanted
surface of the transverse crack. By comparison there
are very distinct differences to be seen between this
surface which failed under shear, and the other
surfaces which were mode-I dominated. There is
much more matrix debris associated with this surface.
The fibres are not continuous and appear to have been
sheared during failure.
6 Conclusions
From this preliminary series of tests it can be seen that
in three- and four-point flexural testing once a
transverse crack has reached an opposing ply
boundary, the length of the delamination which
follows is proportional to the load applied.
It was observed during testing that in three-point
bending, specimens with multiple transverse cracks
had significantly shorter delamination lengths. It is
proposed that the sum of the length of the multiple
delaminations may be equivalent to the longer
delamination of a specimen with a single transverse
crack. Future work will include further measurement
of delamination lengths, particularly in specimens
with multiple transverse cracks.
Transverse crack initiation loads were observed
during testing. In specimens with multiple transverse
cracks it was shown that the specimens which
developed transverse cracks earlier also submitted to
catastrophic failure at a lower load level. Subsequent
transverse cracks occurred at relatively regular
intervals, with an atypically large interval prior to
catastrophic failure.
It has been shown in specimens which follow a
[0/90/0] stacking sequence that the location of the
transverse crack through the 90° portion varies
depending on the thickness of the 90° portion. Future
work will involve determining if this is a material
characteristic of altering the stacking sequence, or if
Page 12
12
this response is a result related to the geometry of the
microtester. The delamination which resulted from
these transverse cracks followed a route at the 0°/90°
ply boundary which kept the delamination as close to
the loading or support pins. This is due to the stress
concentrations associated with the pins in contact
with the surface of the specimens.
Failure in four-point offset bending occurred at the
very centre of the span length. This region is
subjected to pure shear stress and from this the
interlaminar shear strength of the material being
tested could be determined. From SEM, the failure
surface associated with shear failure was observed to
be distinct from the other regions which were
associated with mode-I dominated failure.
References
[1] Carlsson, L., Adams, D. F. & Pipes, R. B. 2002.
Experimental Characterization of Advanced
Composite Materials, Third Edition, Taylor & Francis.
[2] Ladevèze, P., Lubineau, G. & Marsal, D. 2006.
Towards a bridge between the micro- and
mesomechanics of delamination for laminated
composites. Composites Science and Technology, 66,
698-712.
[3] Daniel, I. M. & Ishai, O. 2006. Engineering
Mechanics of Composites Materials, Oxford
University Press, Incorporated. p.332-333
[4] Yoshihara, H. 2012. Interlaminar shear strength of
medium-density fiberboard obtained from
asymmetrical four-point bending tests. Construction
and Building Materials, 34, 11-15.
[5] Ganesan, R., 2008. ‘Experimental characterization of
interlaminar shear strength’ in Sridharan, S., ed,
Delamination Behaviour of Composites, Florida:
Woodhead Publishing, p.122-123
[6] Gray, P. J. & Mccarthy, C. T. 2011. A highly efficient
user-defined finite element for load distribution
analysis of large-scale bolted composite structures.
Composites Science and Technology, 71, 1517-1527.
[7] Greenhalgh, E. S. 2009. Failure Analysis and
Fractography of Polymer Composites, Woodhead
Pub, p.184
[8] Hobbiebrunken, T., Hojo, M., Adachi, T., De Jong, C.
& Fiedler, B. 2006. Evaluation of interfacial strength
in CF/epoxies using FEM and in-situ experiments.
Composites Part A: Applied Science and
Manufacturing, 37, 2248-2256.


![Improvement of Interfacial Shear Strength Using ...confsys.encs.concordia.ca/ICCM19/AllPapers/FinalVersion/RUT80577.pdf · modified by introducing nano, ... the IFSS [15] and, based](https://static.documents.pub/doc/80x56/5abd66f07f8b9a8e3f8bba70/improvement-of-interfacial-shear-strength-using-by-introducing-nano-the.jpg)


![MODELING STRUCTURAL BEHAVIOUR OF PVC …confsys.encs.concordia.ca/ICCM19/AllPapers/FinalVersion/...absorption of circular CFRP tubes with diameter/thickness ratio [7] (b) Photograph](https://static.documents.pub/doc/80x56/5adb09867f8b9a6d318d8ddd/modeling-structural-behaviour-of-pvc-of-circular-cfrp-tubes-with-diameterthickness.jpg)


