Page 1
An Investigation of key Determinants of Customer Loyalty
Evidence from Ghana’s Mobile Telecommunication Industry
Author: Emmanuel Ato Silva Quaye
Supervisor: Prof. Leif Egil Hem
Msc. Marketing and Brand Management
NORGES HANDELSHØYSKOLE
This thesis was written as a part of the Master of Science in Economics and Business
Administration program – Major in Marketing and Brand Management. Neither the
institution, nor the advisor is responsible for the theories and methods used, or the results
and conclusions drawn, through the approval of this thesis.
NORWEGIAN SCHOOL OF ECONOMICS
Bergen, December, 2012
Page 3
ii
ABSTRACT
In a fiercely competitive business environment such as the mobile network services setting,
it is a marketplace reality that the ability of firms to attract and retain customers ultimately
determines their growth and survival prospects. This study, therefore, investigates how
customer satisfaction, perceived service quality, perceived value, corporate image and
switching cost determine customer loyalty in the mobile network services setting of Ghana.
A total of 140 respondents completed an online survey via emails and social media
platforms in Ghana. The results of the empirical study reveal that customer satisfaction had
the greatest impact on loyalty. Service quality and perceived value are both directly and
indirectly related to loyalty through satisfaction. The results also show that corporate
image is a direct antecedent of customer loyalty. The role of image as a key factor in
mobile network services marketing is thus confirmed. However, the influence of switching
costs on customer loyalty was not corroborated in this study. We suggest that managers
should emphasize service quality and perceived value as core elements for building
satisfaction and loyalty. In regard to Mobile Number Portability (MNP) intentions, the
study found that there were as many customers who were likely to port their numbers as
there were those who might not. Notwithstanding, those with porting intent were fairly
larger. Some customers also reported indecisiveness with MNP. As such, brand managers
should design unique marketing strategies aimed at each of these consumer groups.
Page 4
iii
ACKNOWLEDGEMENT
I thank God almighty who has enabled me, through his son Jesus Christ, to complete this
project successfully. I am very excited that finally I can draw the curtains on this work.
While the journey has been daunting, all the way through, I am very convinced that my
motivation to complete this work was inspired by the relentless effort of some key people
in my life, whose encouragement and guidance steered me beyond my limitations to finish
this work.
Firstly, I would like to thank my supervisor, Prof. Leif Egil Hem, who showed deep
understanding during the entire process of writing this thesis. He was always available, and
willing to make compromises especially when meeting times were inconvenient for either
party. He gave me the opportunity to experiment with my ideas, while keeping appropriate
distance to peruse my novel ideas. The opportunity he gave me made me learn important
lessons for me which, I believe will influence my future career greatly. Your critical
reviews have made this work possible. Sir, I am very thankful.
Secondly, I would like to acknowledge my wife, Abigail, who has played diverse roles in
making this project a reality. Her suggestions and critical reviews were timely. She was
essentially part of my review committee. But most especially, her constantly reminding me
of the need to beat myself up until I am finally done is very much appreciated
Moreover, my heartfelt acknowledgement goes to all the respondents who took time to
complete the questionnaire. Moreover, I would like to thank all those who from the very
beginning contributed to shaping the direction of survey, particularly while researching
appropriate scale items. Even though majority of them were not connected to me in any
way imaginable, yet you saw it necessary to offer your opinion on the subject matter. I am
very grateful.
Finally, I would like to take this opportunity to recognize the impact made on me by the
numerous lecturers and administrator staff at NHH I came in contact. Their sense of duty is
unmatched. They showed high commitment to educate and assist students in every way
possible. Particularly, the staff at international students’ office was remarkable. They truly
cared and supported everyone. On behalf of all students, I say a big thank you for the
numerous lives you are transforming every single day through the medium of education.
We have a lot to be grateful for, because you made it possible. And to all the wonderful
colleague students I became friends with, I say thank you for the valuable experiences.
Page 5
iv
TABLE OF CONTENTS ABSTRACT ..................................................................................................................................... ii
ACKNOWLEDGEMENT .................................................................................................................. iii
CHAPTER 1 .................................................................................................................................... 1
1. INTRODUCTION .................................................................................................................. 1
1.1 Background .......................................................................................................................... 2
1.2 Overview of Ghana’s Mobile Telecommunication services market .............................. 5
1.3 Problem definition ............................................................................................................... 8
1.4 Aims and Objectives ........................................................................................................... 10
1.5 Research Questions ............................................................................................................ 10
CHAPTER 2 .................................................................................................................................. 13
2. THEORETICAL BACKGROUND AND HYPOTHESIS DEVELOPMENT ........................................... 13
2.1 In-Depth Literature Review Based on Proposed Theoretical Model..................................... 14
2.2 Customer Loyalty ............................................................................................................... 14
2.3 Antecedents of customer loyalty .................................................................................... 15
2.3.1 Customer satisfaction .................................................................................................. 18
2.3.2 Perceived Service Quality ............................................................................................ 20
2.3.2.1 Perceived service quality, customer satisfaction and customer loyalty ...................... 23
2.3.3 Perceived Value ........................................................................................................... 24
2.3.3.1 Perceived value, customer satisfaction and customer loyalty .................................... 26
2.3.4 Corporate Image.......................................................................................................... 26
2.3.5 Switching Costs............................................................................................................ 29
CHAPTER 3 .................................................................................................................................. 32
3. METHODOLOGY ................................................................................................................... 32
3.1 Research Design ................................................................................................................. 33
3.2 Sample, data collection and questionnaire development .................................................... 34
3.2.1 Demographics ............................................................................................................. 34
3.2.2 Online survey advantages ............................................................................................ 36
3.2.3 Data collection procedure ........................................................................................... 36
3.2.4 Ethical considerations .................................................................................................. 37
3.2.5 Instrument Development............................................................................................. 38
3.3 Measures ........................................................................................................................... 39
3.3.1 Customer loyalty ......................................................................................................... 40
3.3.2 Customer satisfaction .................................................................................................. 40
Page 6
v
3.3.3 Perceived service quality ............................................................................................. 41
3.3.4 Perceived value ........................................................................................................... 42
3.3.5 Corporate Image.......................................................................................................... 42
3.3.5 Switching costs ............................................................................................................ 43
3.4 Methodological issues ........................................................................................................ 44
CHAPTER 4 .................................................................................................................................. 45
4. RESULTS ............................................................................................................................... 45
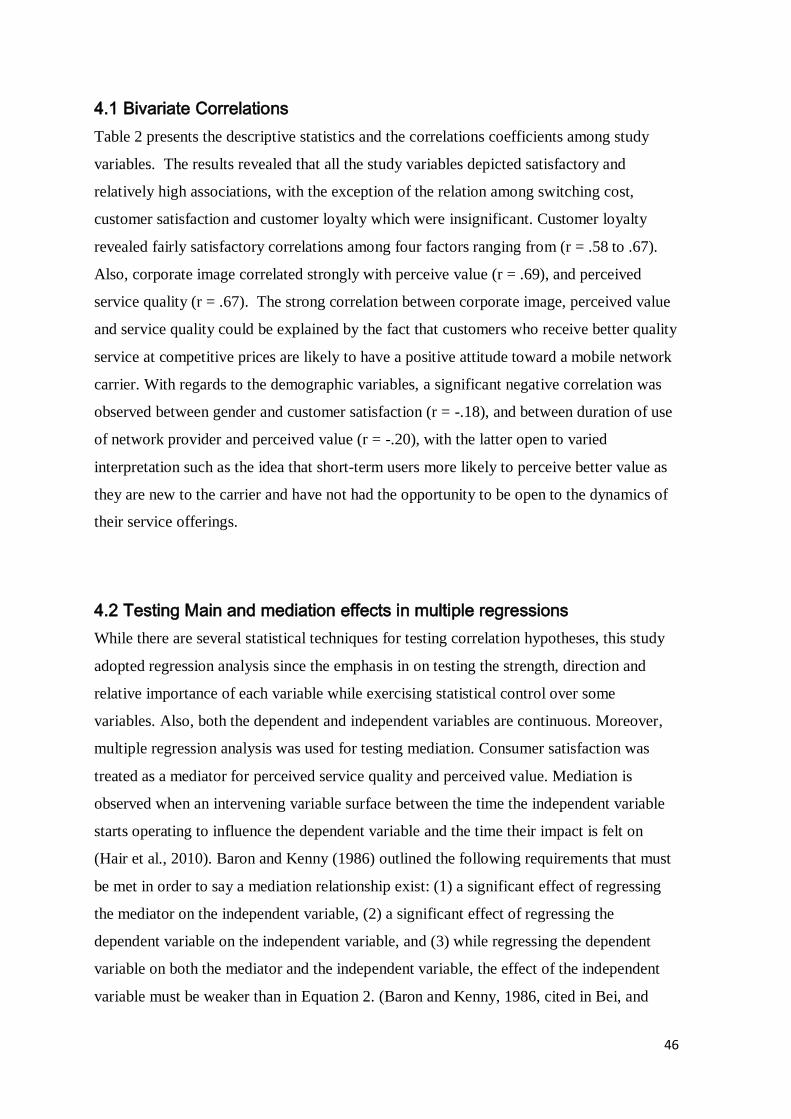
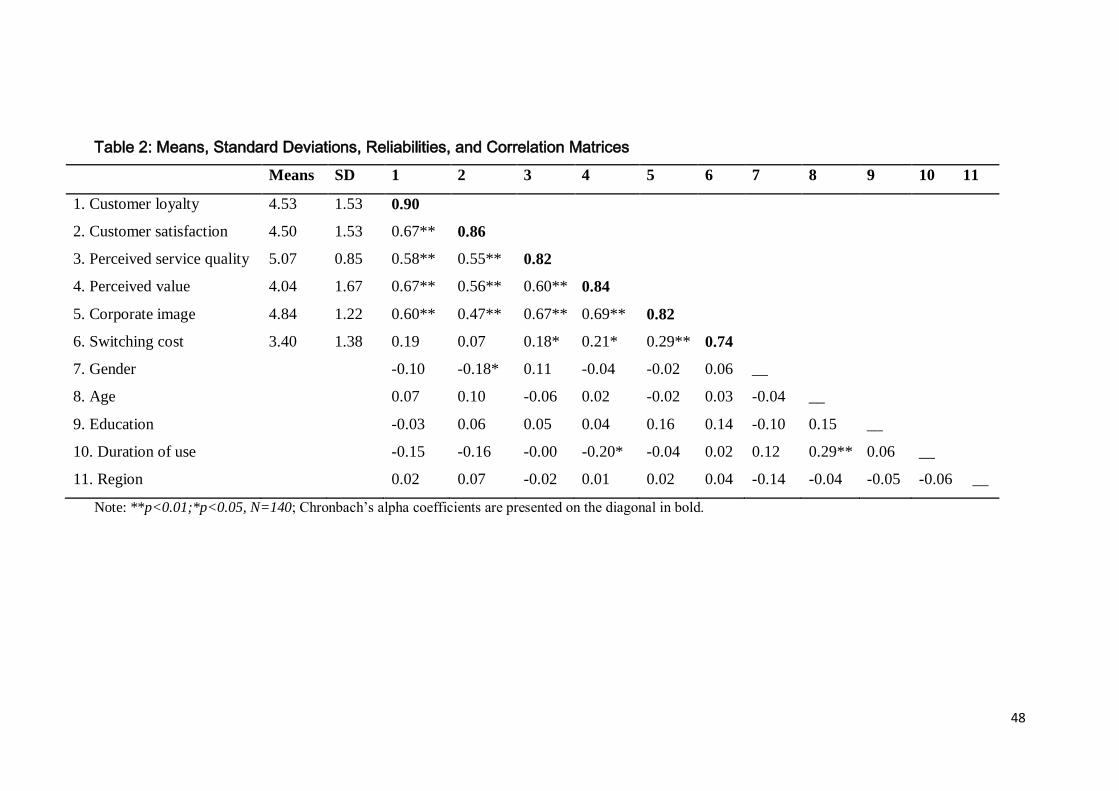
4.1 Bivariate Correlations ......................................................................................................... 46
4.2 Testing Main and mediation effects in multiple regressions ................................................ 46
4.3 Determinants of customer loyalty ...................................................................................... 49
4.3.1 The effect of customer satisfaction on customer loyalty .............................................. 49
4.3.2 Relationship between perceived service quality, customer satisfaction and loyalty...... 50
4.3.3 Relationship between perceived value, customer satisfaction and loyalty.................... 52
4.3.4 The effect of Corporate Image on customer loyalty ..................................................... 53
4.3.5 The effect of switching cost on customer loyalty.......................................................... 53
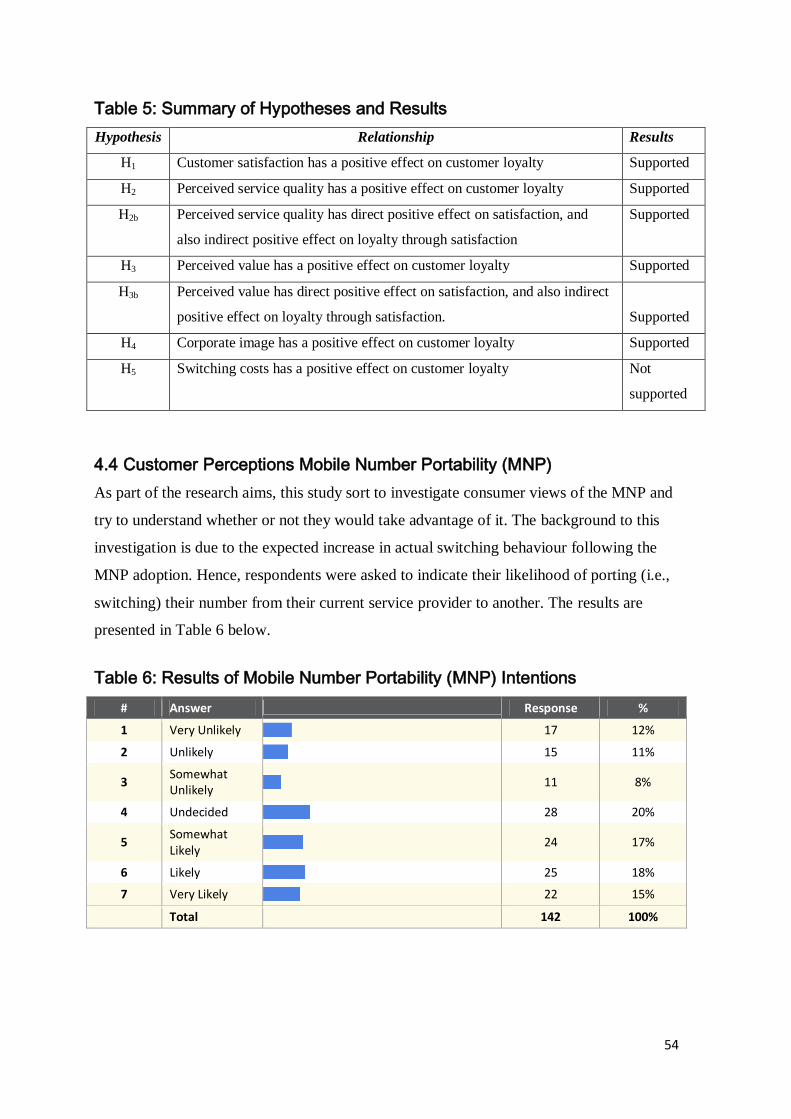
4.4 Customer Perceptions Mobile Number Portability (MNP) ................................................... 54
CHAPTER 5 .................................................................................................................................. 56
5. DISCUSSION AND CONCLUSION ............................................................................................ 56
5.1 Discussion .......................................................................................................................... 57
5.1.1 The effect of customer satisfaction on customer loyalty .............................................. 57
5.1.2 The direct and indirect influence of Perceived Service Quality ..................................... 58
5.1.3 The direct and indirect influence of Perceived Value .................................................... 60
5.1.4 The effect of corporate image on customer loyalty ..................................................... 62
5.1.5 The effect of switching costs on customer loyalty ........................................................ 64
5.2 Assumptions on Mobile Number Portability (MNP) ............................................................ 65
5.3 Managerial Implications ..................................................................................................... 66
5.4 Limitations and future research recommendations ............................................................ 69
5.5 Conclusion ......................................................................................................................... 70
6. REFERENCES ............................................................................................................................ 71
7. APPENDIX ................................................................................................................................ 81
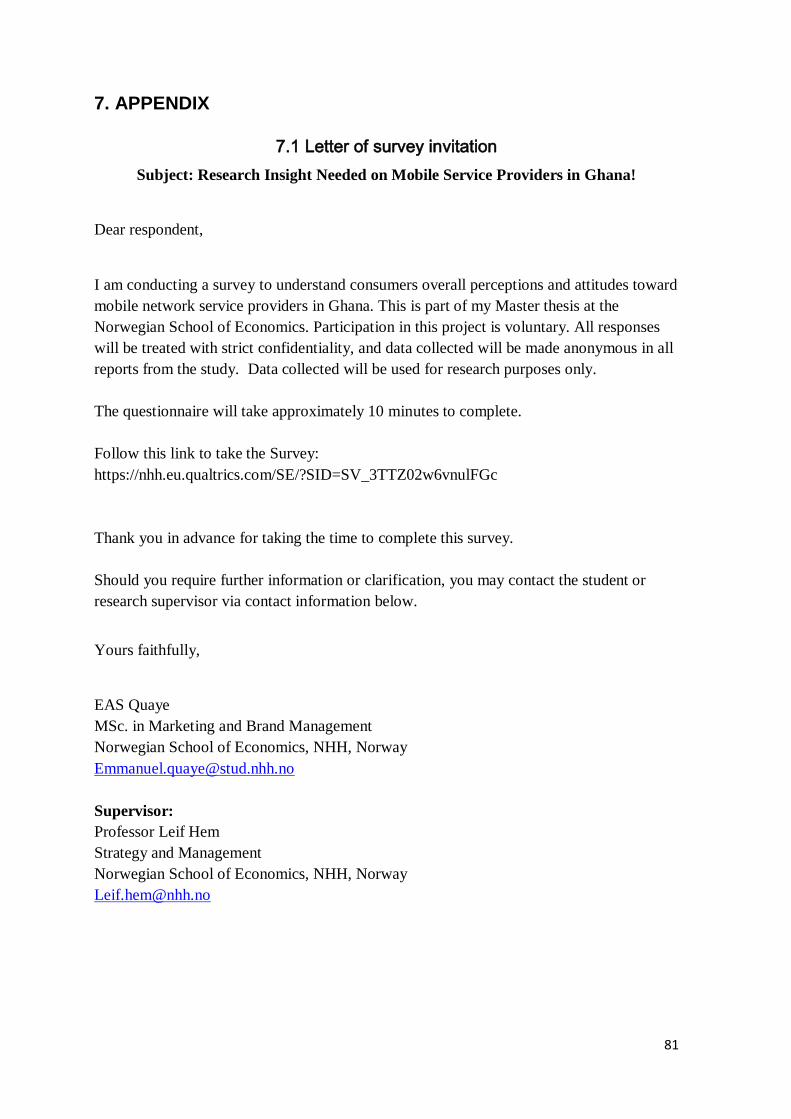
7.1 Letter of survey invitation .................................................................................................. 81
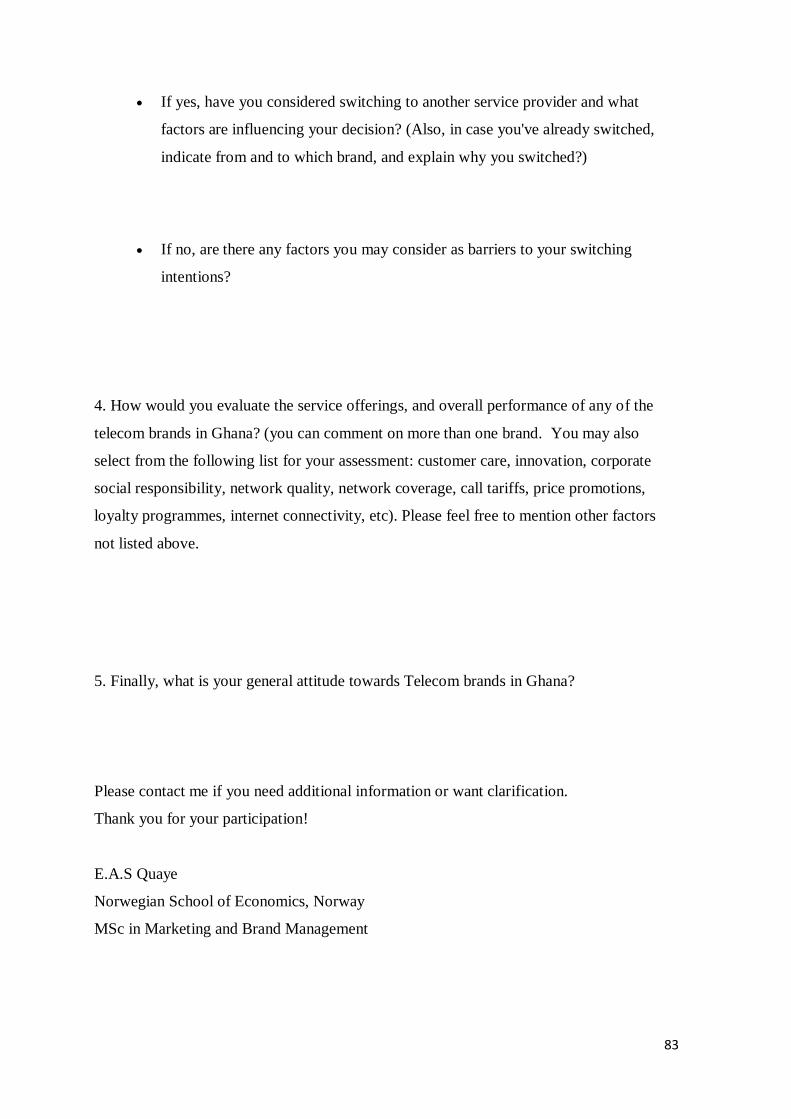
7.2 Pilot Email interview........................................................................................................... 82
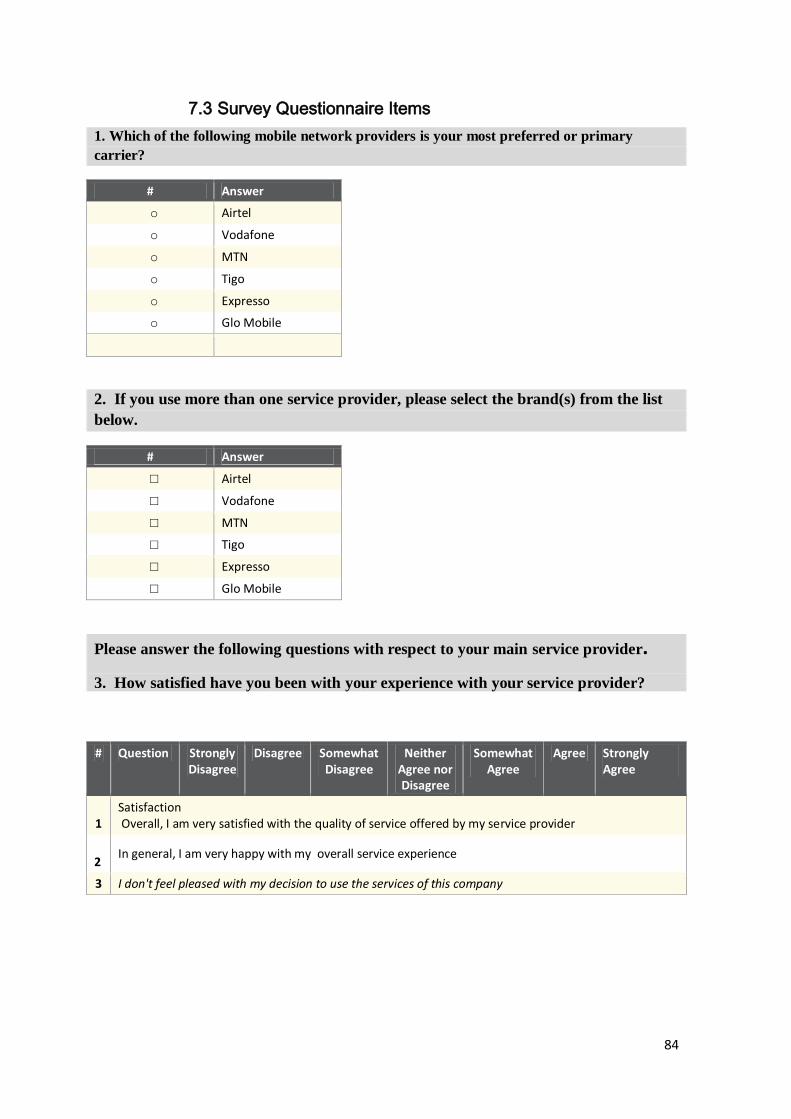
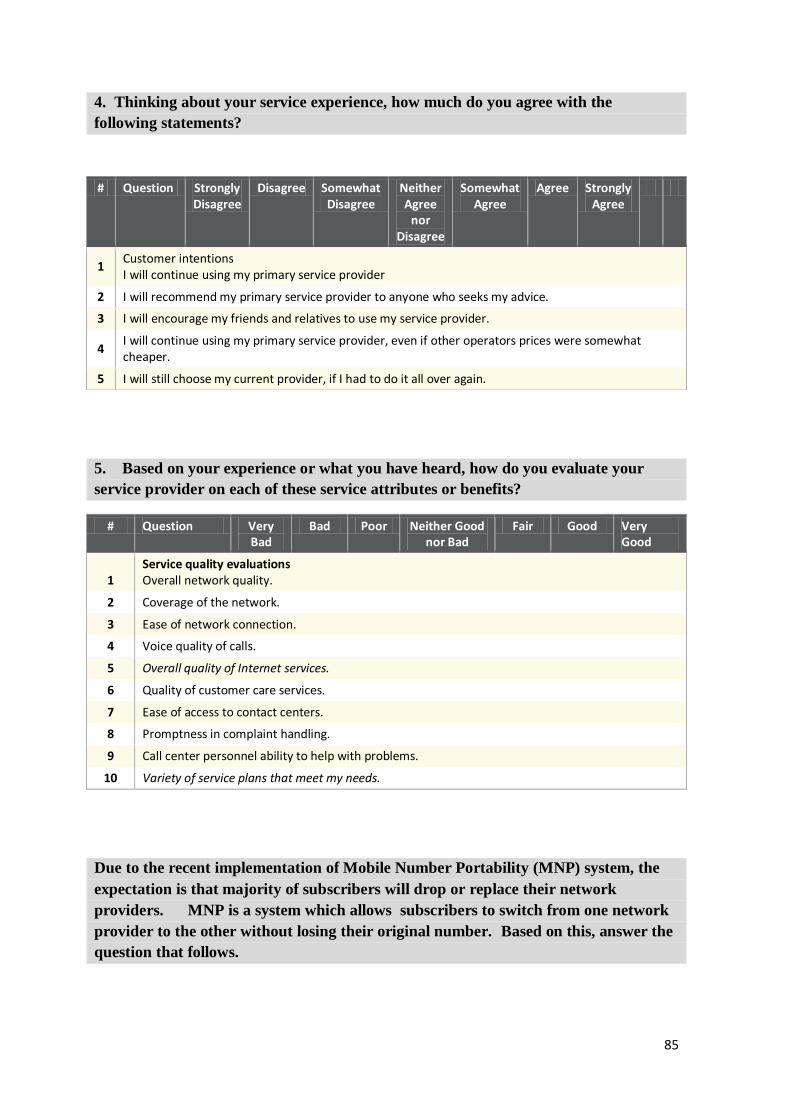
7.3 Survey Questionnaire Items ............................................................................................... 84
Page 7
vi
LIST OF TABLES Table 1: Respondents profile ........................................................................................................ 35
Table 2: Means, Standard Deviations, Reliabilities, and Correlation Matrices ............................... 48
Table 3: Multiple Regression results for testing Direct effects on Loyalty ..................................... 49
Table 4: Multiple Regression results for testing Direct and Mediation effects ............................... 50
Table 5: Summary of Hypotheses and Results .............................................................................. 54
Table 6: Results of Mobile Number Portability (MNP) Intentions .................................................. 54
LIST OF FIGURES
Fig 1: Ghana’s Mobile Penetration Rate (1998 - 2012) .................................................................... 7
Fig 2: Research Model .................................................................................................................. 11
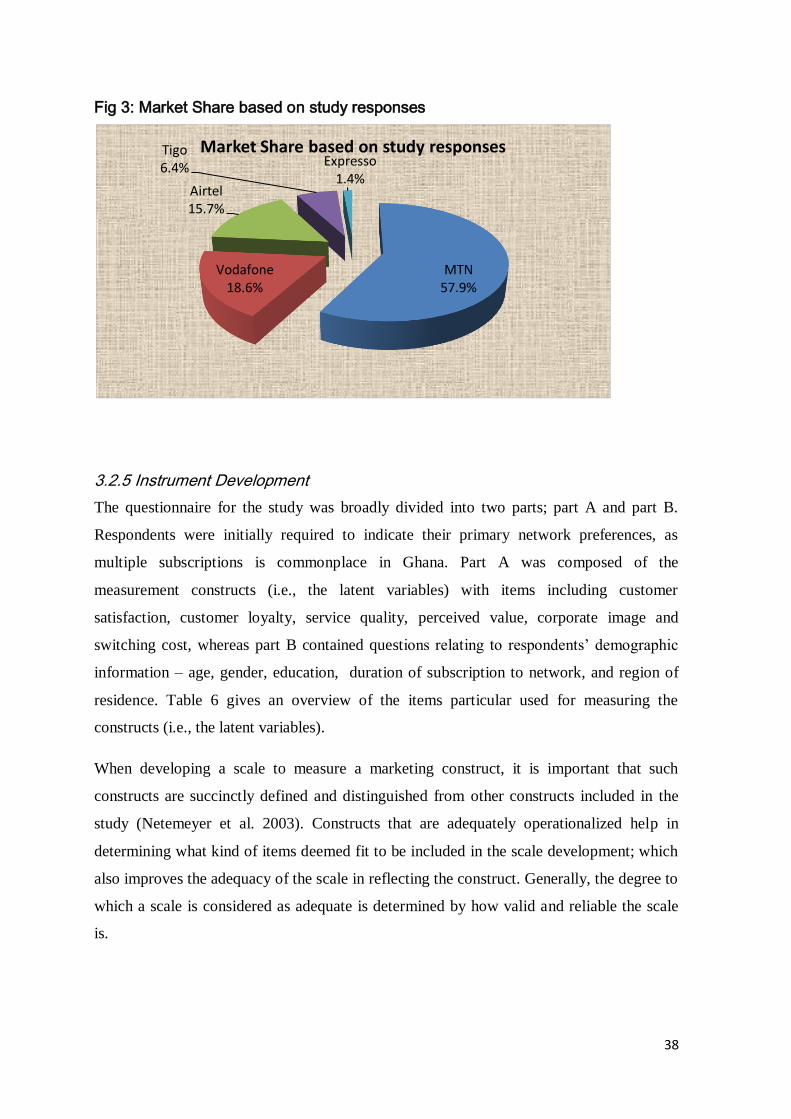
Fig 3: Market Share based on study responses ............................................................................. 38
Page 8
1
CHAPTER 1
1. INTRODUCTION
Companies increasingly look to quality, satisfaction and loyalty as keys to achieving
market leadership. Understanding what drives these critical elements, how they are linked
and how they contribute to your company’s overall equity is fundamental to success.” (AC
Nielsen, 2000; cited in Cronin et al. 2000, p. 210).
The purpose of this thesis was to investigate how factors including customer satisfaction,
perceived service quality, perceived value, corporate image and switching costs are crucial
to influencing customer loyalty within Ghana’s mobile network services sector. In this
opening chapter, a background for the study, critical research questions, and outline of the
dissertation are carved out.
Page 9
2
1.1 Background
The mobile telecommunication industry has become increasingly challenging and complex
as an environment to operate in (Kim and Yoon, 2004; Seo, Rangathan, and Babad, 2008).
The industry has become fiercely competitive and growing at an unprecedented rate during
the last several years. The significant growth in the mobile telephony market can be the
attributable to massive technical advances as well as the increased number of network
operators, resulting in fierce competition (Gerpott, Rams, and Schinler, 200). While the
increasing number of subscriber base has contributed to competition, the variety of
services made available such as short message services (SMS), high-volume data
applications, and internet enabled functionalities (MMS, WAP, GPRS etc) have also
contributed immensely to this process (cf. Seo, Ranganathan and Babab, 2008).
Importantly, the de-regularization of the sector through the removal of state monopoly
rights has made it possible for private participation in the mobile telephony sector in many
parts of the world, particularly Ghana. The Government of Ghana’s restructuring of the
state owned monopolistic telecommunication sector and subsequently, limiting her control
has contributed to a more open and free market system. Now there is an equal playing field
for all the brands in the sector to operate effectively and profitably without unnecessary
interferences from the government.
Currently, there are 6 licensed mobile service providers in the country, namely MTN,
Vodafone Ghana, Tigo, Airtel, Espresso, and, recently licensed carrier Glo Mobile, which
is scheduled to become fully operational in the first quarter of 2012. Participation by such
players has injected a certain level of energy and competitiveness in the market. Today,
Ghana’s mobile telecommunication market can be described as intensely competitive.
Notwithstanding, the competition has breathed newness into the sector, making it more
effective and efficient. The industry can now boast of reasonable levels of service quality,
value-added services and active engagement with, and contribution to society. Boohene
and Agyapong (2011) observed that with the deregulation of Ghana’s telecommunication
sector, along with its intense competition and advances in information and communication
technology (ICT), considerable pressure has mounted on the companies to demonstrate
their capacity to create customer value and remain attractive to consumers. These network
service providers are finding it extremely difficult to differentiate themselves. All of them
are scrambling to earn consumers’ confidence and trust. Such complexities are challenging
Page 10
3
the business models of Ghana’s mobile service providers. Evidently, winning over new
customers through substantial price cuts, promotions, and bundled offerings are
commonplace. While this approach may seem viable, it is hurting meaningful growth.
One remarkable development in Ghana’s mobile telephony sector is the implementation of
Mobile Number Portability. As a result, network carriers have embarked on aggressive ad
campaigns and various marketing tactics to lure consumers into switching to their
respective networks, with the promise of providing better service than they currently
receive. Notably, with the entry of Glo Mobile into an already saturated business
environment, it is obvious that Glo Mobile’s initial strategy would be to pitch themselves
as a favourable alternative to win brand switchers. Their first gamble will be to target
consumers with high switching propensity. Indeed, incumbent brands such as MTN,
Vodafone and Tigo, while they welcome the entry of a new player, have expressed some
level of fear and uncertainty due to the likelihood of customer loss. Also, the continuing
decline in average revenue per user (ARPU), due in part to increased multiple
subscriptions, is a source of worry to many industry experts and the network carriers
(Frempong, 2010). In fact, recent statistics by the National Communication Authority
(2011), confirmed that four months into the implementation of MNP system, a total of
138,458 network subscribers have moved from one carrier to the other by October, 2011.
This demonstrates that sizeable incidence of switching behaviour is currently underway.
While it is true that customers differ in terms of their loyalty to a particular brand, it is
equally certain that customers who may perceive the current levels of service offering as
below industry standard or their expectations may intensify their search for alternative
service provider considered superior. In the United States, for example, customers are
provided with financial incentives to subscribe to or switch from one operator to the other
(Lai, Griffin, and Babin, 2009). Such trends are beginning to inform companies that
performance improvements and profitability can be achieved by focusing on retaining and
maintaining existing profitable customers. Thus, the strategic need for retaining current
customers has increased dramatically (Seo, Ranganathan, and Babab, 2008).
Management scholars have long argued that the prime guarantee of business growth and
profitability is on shifting attention from the activity of attracting customers to one which
relies on retaining and maintaining relationship with existing customers (e.g., Ravald and
Gronroos, 1996; Reichheld, Markey and Hopton, 2000; Andaleed, 1996;
Page 11
4
Athanassopoulous and Iliakopoulous, 2003). Berry (1980) observed that “having
customers not merely acquiring customers is crucial for service firms.” The criticality of
this assumption is based on the notion that it cost as much as 6 times more to win new
customers than it does in keeping an existing one (Rosenberg and Czepiel, 1984, p. 45).
Reichheld (1993) posit that, in relation to a specific industry, the likelihood of increasing
profits by up to 60% is greater when potential customer migration is reduced by only 5%.
The fundamental principle underlying these assumptions is rooted in relationship
marketing’s emphasis on the maintenance of relations between the company and its
external actors, with customers classified as the most important actor. This activity
facilitates the creation of customer loyalty so that a stable, mutually beneficial, and long-
term relationship is sustained. Thus, a leading business strategy depends on the ability to
build and maintain loyal and valued customer relationship; resulting in positive
consequences including reducing alternative search behaviour, repeat purchase, spending
on ancillary services, creating exit barriers, stimulating consumer cooperative behaviour
etc. (Baloglu, 2002; Andeleed, 1996; Reichheld, Markey, and Hopton, 2000).
Relatedly, the creation of customer perceived value is considered an important component
of relationship marketing (Ravald and Gronroos, 1996). A cursory evaluation of the
literature reveal that the ability of service firms to provide superior customer value is
regarded as one of the most successful strategies for achieving favourable behavioural
intentions (e.g., Cronin, Brady and Hult, 2000; Olaru and Purchase, 2008), hence
sustainable competitive advantage. Thus, it has become imperative for Telecom brands in
Ghana’s Mobile telephony market to understand that customer-oriented business strategy is
the most attractive alternative for sustainable competitive advantage, and profitability, and
importantly, as a guarantee for survival (Kim et al., 2004). Needless to say, all strategic
priorities and activities should be founded on creating superior customer value and loyalty
thereby. It is critical for these players to identify the various dimensions related to
customer loyalty and how they could be improved so that customer bonds are strengthened
and customer loyalty achieved as a result. Various constructs including service quality,
satisfaction, network quality, switching barriers, brand image/corporate reputation,
customer care service, call tariff plans, promotions, etc. are associated in different ways to
customer loyalty in the mobile telecommunication sector (e.g., Wang and Lo, 2002); each
producing idiosyncratic outcomes given their separate settings.
Page 12
5
1.2 Overview of Ghana’s Mobile Telecommunication services market
The government of Ghana liberalized the ICT industry in the early 1990s to ensure
effective private participation in the industry. The change in direction was consistent with
global policy changes in the ICT industry, since many countries resorted to deregulation to
make the industry internally vibrant and globally attractive. Ghana sought to boost
maximum accessibility to, and extended coverage of ICT facilities, introduction of value-
added services, and improved consumer access to the state-of-the art technology
(Frempong, 2005). As a consequence, various policy frameworks and regulatory bodies
were developed to facilitate the transformation of the sector by promoting a broader
opening of all market environments to private and competitive market forces. For example,
the National Telecom Policy (NTP) was designed to promote the creation of suitable ICT
market conditions founded on the principles of open markets and fair competition
(Frempong, 2010). Also, National Communication Authority (NCA) was equally mandated
to ensure that all players in the sector were sufficiently regulated, while putting in place all
necessary measures to stimulate fair competition within Ghana’s Telecommunication
industry (Frempong, 2010).
Ghana liberalized its telecommunication sector in the early 1990s in order to exploit the
potential benefits of reform. As a consequence, in 1994, the government adopted a Five-
year Accelerated Development Programme (ADP) with the sole aim of increasing
telephone coverage in the country by allowing for private participation in all sectors of the
industry (Frempong, 2007).
In December 1996, Ghana partially privatized its incumbent, Ghana Telecom, and allowed
another company to start operating a competing network (Haggarty, Shirley, and Wallsten,
2002). This was due to the fact that the operations of the incumbent was marked by
constrained access, poor service, inefficiency, prohibitive pricing, etc., making
privatization and competition more attractive to the government. This milestone on the
part of the government, in an attempt to revolutionize the telecommunication industry by
encouraging competition, set the stage for fundamental changes to continue afterwards.
In 1992, the first private mobile cellular company, Mobitel, began operations following the
government’s invitation for private participation. In that year 19,000 Ghanaians begun to
use mobile phones and number has increased since. A second mobile operator entered in
Page 13
6
1995, and a third in 1996. All these earmarked significant events in the history of Ghana’s
telecommunication industry.
With government’s commitment to optimizing the fortunes of the nation through ICT
developments, Ghana has undoubtedly become one of the most technologically advanced
countries in the sub-region. The industry has been one of the fastest growing sectors of the
country, while keeping appropriate speed with global ICT developments, particularly in the
mobile cellular market. This demonstrates the significant contribution of open-market
policy in the country. In Ghana, currently, the telecom market has six operators, and two
national fixed-network operators. The mobile network service providers include MTN
Ghana (a subsidiary of MTN South Africa), Tigo Ghana Limited (owned by Millicom
International Cellular), Vodafone Ghana (part of Vodafone group), Airtel (owned by
Bharti Airtel of India), Expressso (formerly Kasapa Telecom), and Glo Mobile (Nigeria),
though licensed, is yet to commence business. Apart from MTN and Glo Mobile the
remaining operators are subsidiaries of multinational telecom without African origin.
Frempong (2007) observed that the mobile telephone service market is the most pervasive
voice communication in the country; due in part to the explosive growth in the market
since reforms. Statistics reported by him revealed that, by the close of 2005, there were
almost three million mobile service subscribers in the country, with MTN, then Areeba,
controlling about 59% of market share. Between 2000 and 2005, the growth rate for mobile
telephone subscription was at 87.4%. Recently, the subscriber base has grown larger, with
a remarkable number of 21.17 million subscribers, representing 84.9%. But as of August,
2012, the total mobile voice subscriber base in Ghana was 24,438,983 representing 98% of
a population of 25million people, according to the National Communication Authority
(NCA). Yet, due to multiple subscriptions, where an individual customer may have more
than one mobile line, the true rate of penetration based one customer/one mobile line may
be difficult to ascertain.
By August 2012, figures from NCA showed MTN continuing their commanding lead with
more than 11million subscribers representing 45% market share. Vodafone placed second
with 20% market share of 4,901,555 subscribers, after improving subscriber base
marginally. NCA figures also show Tigo recording marginal losses to record 15% market
shares; making a minor loss of 0.6%. This represented a significant turnaround after
battling eight months decline. Airtel, on the other hand, increased its subscriber base to
Page 14
7
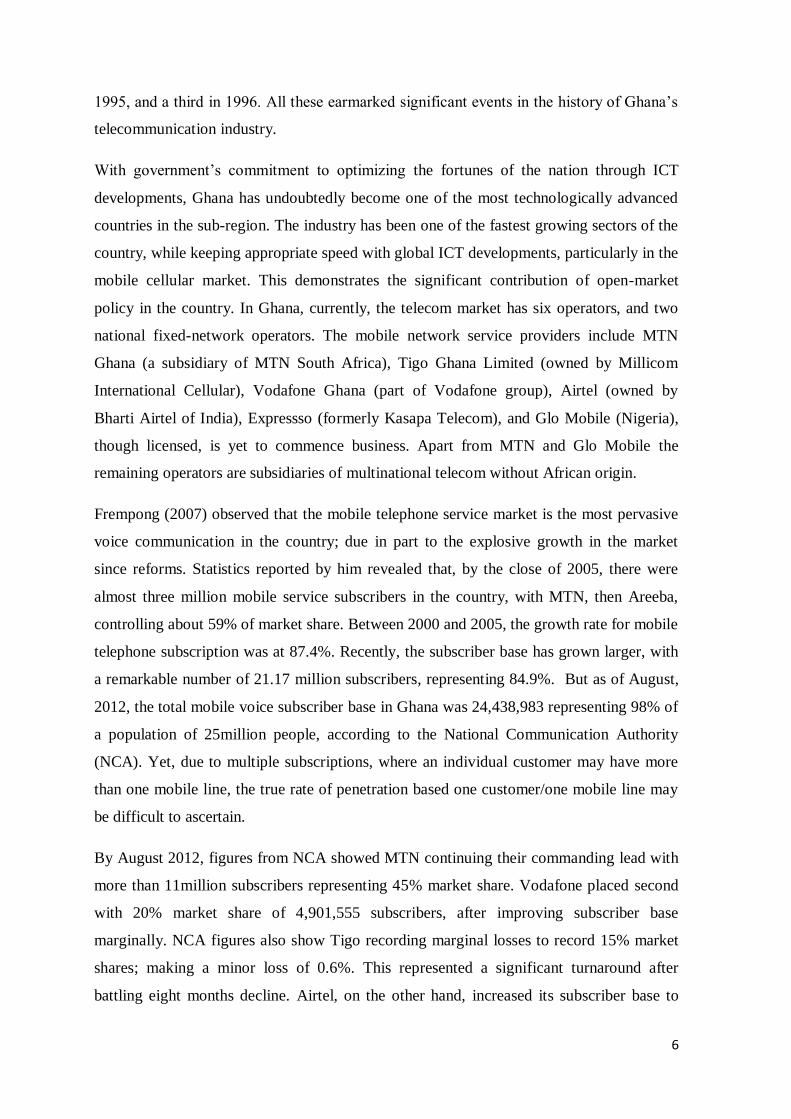
3.685million representing 12% market share. Meanwhile, Glo Mobile after barely 4
months of commercial operations recorded 1.15 million users representing 7% market
share. Regrettably, Expresso continued their steep decline ending the period with only
178,799 users, representing 0.7% market share (NCA, 2012; Myjoyonline.com, 2012).
Evidently, the figures show that while mobile penetration levels have been rising since,
market share rises among mobile carriers does not follow a consistent trajectory. There are
likely to be gains and losses among players along the way, further demonstrating the
dynamic nature of the market landscape. Notwithstanding, telecom players with better
strategy based on core consumer needs will be triumphant.
Below is a graphic representation of the rate of mobile penetration since 1998.
Fig 1: Ghana’s Mobile Penetration Rate (1998 - 2012)
Source: National Communication Authority, and Myjoyonline.com
Thus, a cursory assessment of Ghana’s mobile telephony market indicates that the market
is highly saturated. The industry, at the moment, has become very exciting as competition
paces on. In such an intense competitive environment telecom service providers have no
option but to adopt creative strategies in order to gain significant share of the market.
Additionally, numerous researches have confirmed that competition in the
telecommunication industry has improved overall sector performance compared to
monopoly provision in many parts of the world, leading to lower prices, better services,
wider access, and quicker expansion of capacity (Choi, Lee and Chung, 2001; Kim, Park
and Jeong, 2004; Wang and Lo, 2002).
0.22 0.36 0.66 1.21 1.87 3.76 7.85 13.03
23.12 33
49.37
63.25 71.3
79.1
98
0
20
40
60
80
100
120
1996 1998 2000 2002 2004 2006 2008 2010 2012 2014
Per
cen
tage
Pen
etra
tio
n
Years
Mobile Penetration (1998 - 2012)
Page 15
8
This observation is equally true for Ghana’s telecommunication industry. The current
business conditions have opened a wave of opportunities for Ghanaian consumers to a
broad choice of quality service among service providers, which was hitherto not the case.
While competition has been conceptualized to lead to improvements in service delivery,
majority of Ghanaian consumers still complain of poor network quality, limited coverage,
poor customer service, complex call tariff plans, internet service problems etc. It appears
these service operators have become untouchable. MTN Ghana, which is the current
market leader, with a market share of 45% (NCA, 2012), is usually associated with much
of these problems.
1.3 Problem definition
As competition intensifies, companies are confronted with various threats and
opportunities in an effort to sustain their market position. In Ghana’s saturated mobile
services market, where both carriers and subscribers have either reached or nearing their
peak levels; attracting and creating new customers, has become overwhelmingly difficult,
and also very costly in terms of marketing spend (Kim, Park and Jeong, 2004). With
mobile penetration rate standing at 84.9%, new subscriptions are expected to slow down
and also stabilize, as observed in other markets (Santourisdis and Trivellas, 2010).
However, multiple subscriptions continue to see steady growth. Currently there are six
mobile service providers, of which four are strong international brands, competing for the
patronage of over twenty one million mobile phone users; based on past trends the
competitive landscape is expected to get ugly in the foreseeable future. The largest market
share is held by MTN (47%), while the second and third positions shared by Tigo and
Vodafone Ghana changes frequently between them over the last few months (NCA, 2012).
Meanwhile, with the implementation of Mobile Number Portability (MNP) system,
network carriers face new challenges of preventing and protecting their existing profitable
customers from migrating to competing brands. Industry watchers have welcomed the
implementation of MNP, arguing that, it will have a positive impact on competition and
also expand consumer choice in regard to changing service providers (Business Monitor
International, 2011). In terms of its adoption, the expectation is that as awareness become
intensified, increasingly, more consumers may try it. Notably, with the market leader’s
resolve to hold on to its sought-after position, and with the entry of Nigeria’s largest
Page 16
9
network service provider, Glo Mobile, promising complete nationwide coverage (key point
of differentiation), and phenomenal value added services, competition is again expected to
reach heightened levels with varying outcomes. They include considerable customer
defections, and decline in average revenue per user (ARPU) partly attributable to multiple
subscriptions (Frempong, 2010). For the consumer, competition will result in better quality
services, lower prices, enhanced choice alternatives, creative innovations etc.
Thus, market conditions depicting this scenario has led experts to conclude that a
fundamental marketing strategy for the future is to attempt retaining existing customers by
enhancing customer loyalty and perceived value (Kim, Park and Jeong, 2004; Gerpott et
al., 2001; Santouridis and Trivellas, 2010). Based on previously mentioned facts, it can be
argued that Ghana’s mobile telephony market represents an exciting research setting for
investigating customer loyalty and its antecedents. Due to increasing threats of customer
defection, incumbent network providers are using various tactics including free minutes,
promotions, and discounted bundled offerings to sweeten their offerings and lock-in
customers. But Eshghi, Haughton, and Topi (2007) argue “to assume that customer
defection can be controlled by providing financial incentives is fundamentally flawed” (p.
94). Rather, customer loyalty, as a matter of fact, is driven by multiplicity of interrelated
factors. Despite its grave importance, scarcely will you find sufficient reported research on
the subject in the mobile telecommunication services industry, particularly in Ghana; just a
handful of studies have been reported in recent times. Thus, a firm understanding of these
factors must precede marketing strategies aimed at reducing customer defection. As
consequence, this research endeavors to develop and test a model to deepen further our
understanding of the drivers of customer loyalty within the mobile telephony context. The
model will have significant strategic implications for companies in extremely competitive
markets such as in Ghana (see page 11 for research model).
Page 17
10
1.4 Aims and Objectives
The main aim of this study is to investigate how customer satisfaction, perceived service
quality, perceived value, corporate image and switching costs affect customer loyalty in
Ghana’s mobile network communication services sector. Central to this objective was the
need to understand the intervening role of customer satisfaction between service quality
and loyalty on one hand, and perceived value and loyalty on the other hand. Second, the
study attempts to understand how mobile phone users’ view Mobile Number Portability
and their willingness to take advantage of it, i.e., the likelihood that consumers would
actually use the Mobile Number portability scheme to enhance their choice set and service
experience, thereby.
1.5 Research Questions
It is no longer enough to derive market advantage on the basis of a superior product
(Johnson and Sirikit, 2002); other marketing tactics need to be uniquely configured and
tactically implemented in order to achieve such meaningful growth and profitability.
Service quality, value, and customer loyalty are now considered as keys to achieving
market dominance (Nielson, 2000). Understanding what underlies these factors, how they
are linked, and how they contribute to company success is essential. Noted earlier,
customer loyalty is increasingly viewed as a prime determinant of long-term financial
performance in a competitive market (Reichheld, 1996), which is determined by multitude
of interrelated factors (Eshghi et al., 2007) Therefore, this study proposes to test the
following questions:
What are the key drivers of customer loyalty?
What are the possible causal links among the drivers of customer loyalty?
- How does customer satisfaction mediate the relationship between perceived service
quality and customer on one hand, and between perceived value and customer
loyalty on the other hand?
How does corporate image influence customer loyalty?
Is there a link between perceived switching cost and customer loyalty?
What is the likelihood that mobile phone subscribers would use Mobile Number
Portability to extract better value and improve their service experience?
Page 18
11
A better understanding of these factors and how they relate with each other would assist
management and employees, particularly marketing executives, to fashion out winning
strategies for sustaining customer loyalty, and marketing performance. In the following
pages, the research model guiding the entire empirical study is provided.
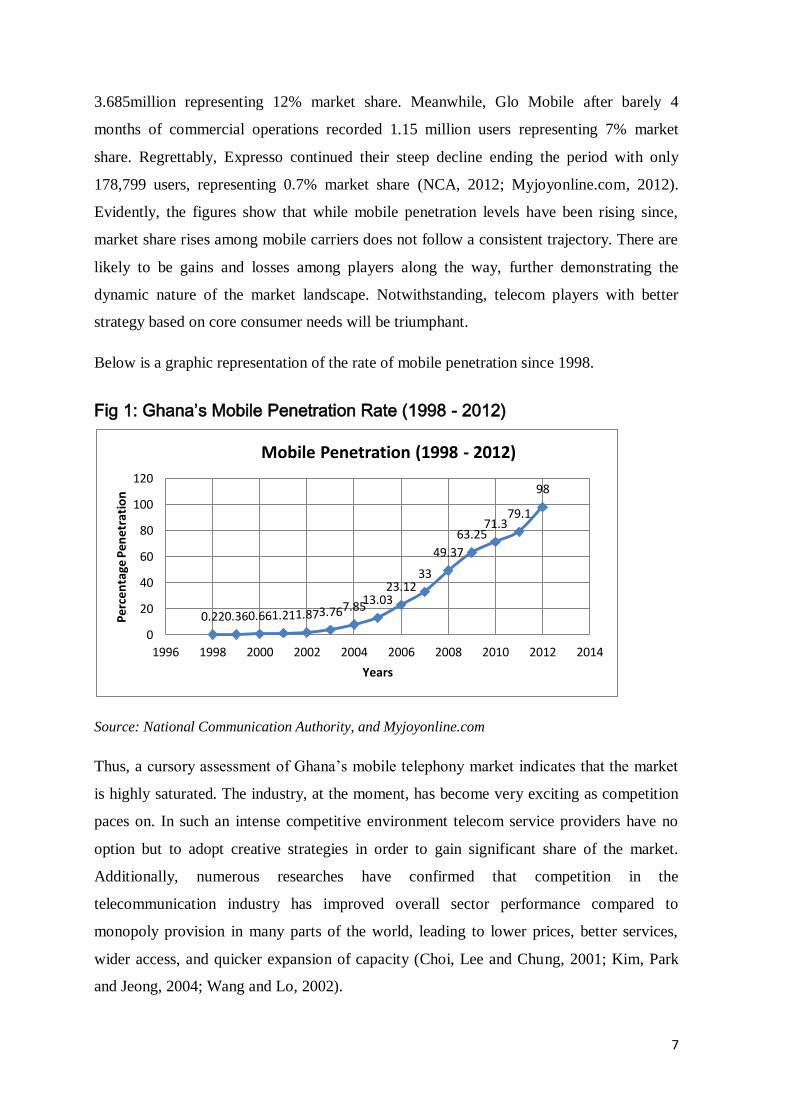
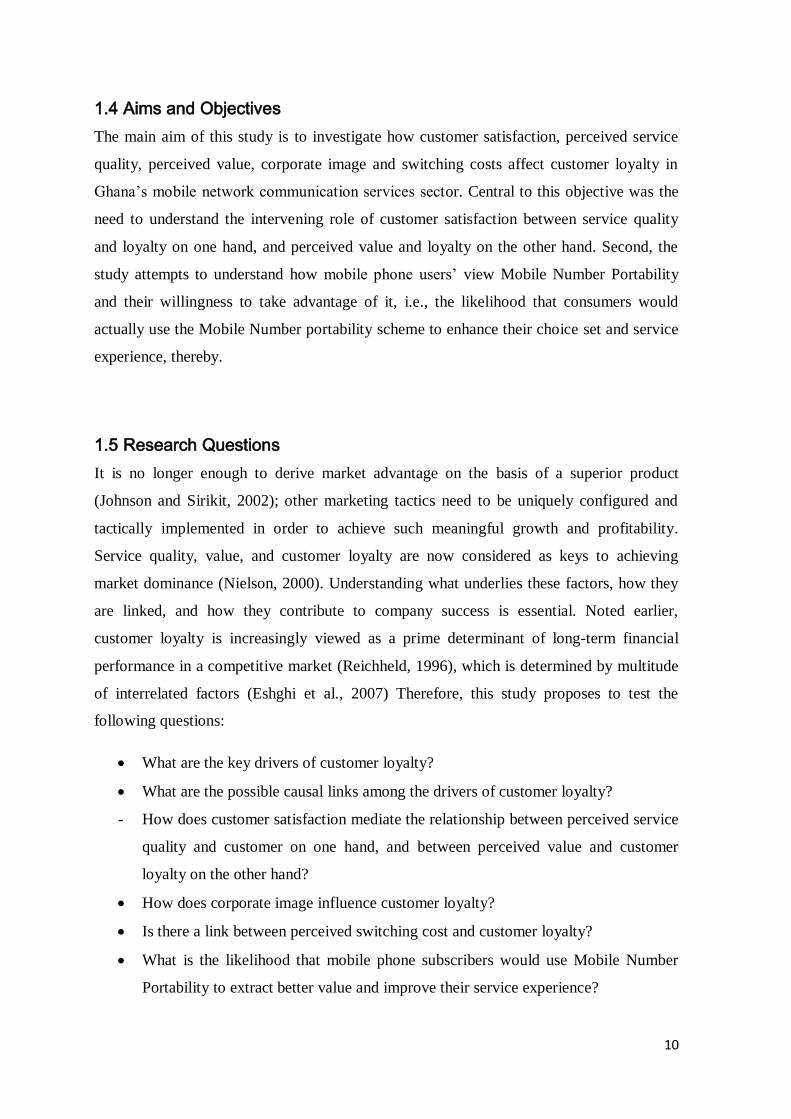
Fig 2: Research Model
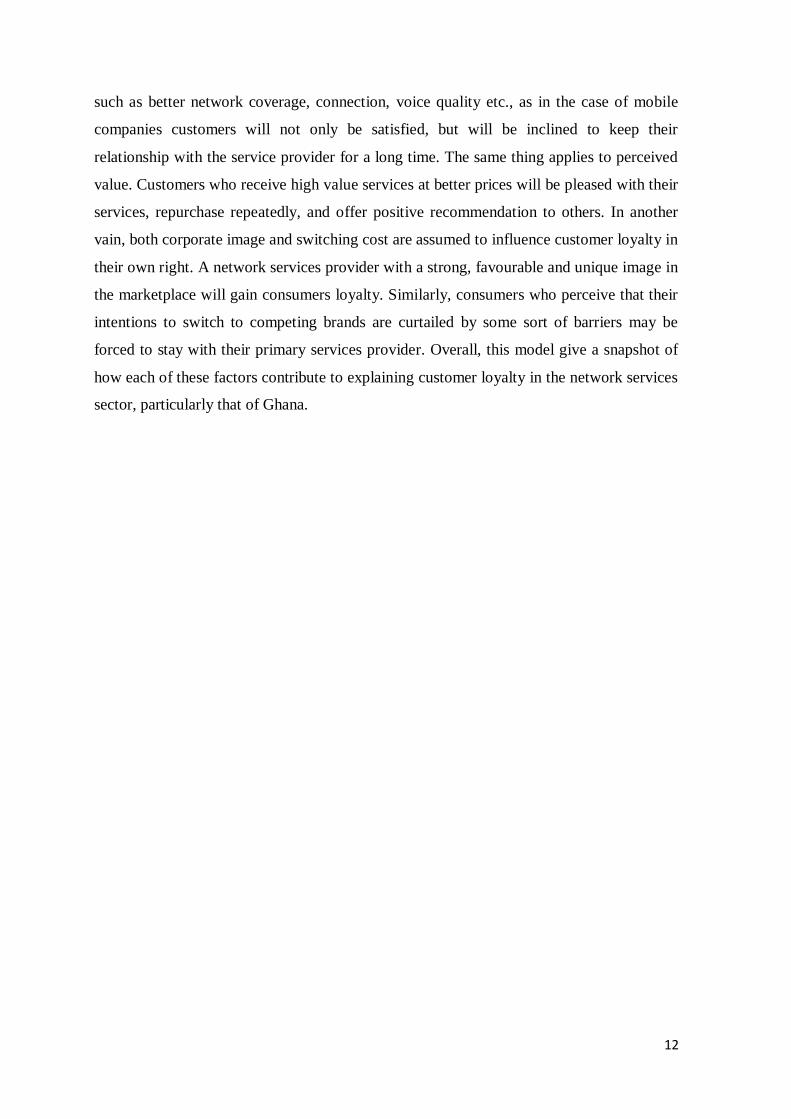
The model above encapsulates the whole research agenda. In the model, customer loyalty
is the outcome variable all the dimensions are trying to explain. The assumption is that for
customers to remain loyal to a service provider, certain critical decision factors would have
to be present. First, customer satisfaction is assumed to directly relate to customer loyalty.
Numerous studies have demonstrated that satisfied customers are profitable due to their
loyalty. Moreover, satisfaction in the model mediates the relationship between service
quality and loyalty, and also between perceived value and loyalty. It is noted that service
quality and perceived value are posited to exert direct influence on both customer
satisfaction and loyalty. The idea is that when services meet the highest possible standard,
Customer
loyalty
Customer
satisfaction
Perceived
service quality
Perceived value
Switching cost
Corporate
image
Page 19
12
such as better network coverage, connection, voice quality etc., as in the case of mobile
companies customers will not only be satisfied, but will be inclined to keep their
relationship with the service provider for a long time. The same thing applies to perceived
value. Customers who receive high value services at better prices will be pleased with their
services, repurchase repeatedly, and offer positive recommendation to others. In another
vain, both corporate image and switching cost are assumed to influence customer loyalty in
their own right. A network services provider with a strong, favourable and unique image in
the marketplace will gain consumers loyalty. Similarly, consumers who perceive that their
intentions to switch to competing brands are curtailed by some sort of barriers may be
forced to stay with their primary services provider. Overall, this model give a snapshot of
how each of these factors contribute to explaining customer loyalty in the network services
sector, particularly that of Ghana.
Page 20
13
CHAPTER 2
2. THEORETICAL BACKGROUND AND HYPOTHESIS DEVELOPMENT
In the introductory section, a foundation for investigating factors influencing consumer
attitudes and behaviors within the Ghanaian mobile services sector was laid, with
particular reference to the recent Mobile Number portability framework adopted by the
National Communication Authority, Ghana. This section will be devoted to building a
theoretical framework to guide the empirical investigations.
Page 21
14
2.1 In-Depth Literature Review Based on Proposed Theoretical Model
The literature review is structured in accordance with the proposed research model for
Ghana’s mobile network services sector (see figure 2, page 11). As recap, the model
depicts customer loyalty as the outcome variable, with customer satisfaction, perceived
service quality, perceived value, corporate image and switching costs all serving as
predictors. Customer satisfaction is also included as a mediator in the relationship between
perceived service quality and loyalty on one hand, and perceived value and loyalty on the
other hand. This section begins by providing a critical review of how customer loyalty has
been conceptualized, with subsequent subsections demonstrating how each of the predictor
variables is connected to customer loyalty.
2.2 Customer Loyalty
While the focus of attention by researchers aimed at defining and measuring customer
loyalty has been driven by products, the importance of the construct for services is also
recognized (Dick and Basu, 1994). The need to fully understand the antecedents and
consequences of loyalty is against the backdrop that establishing and maintaining a loyal
relationship with customers has considerable effect on long-term financial performance in
competitive markets (Hallowell, 1996; Reichheld, 1996). This is because customers who
engage in repetitive purchases despite pressure to switch to another brand will, in the long
run, contribute to business growth and profitability. Loyal customers are a valuable asset to
any firm since they tend to spend on regular basis, and provide positive recommendation to
other consumers.
Despite its importance, the definition of customer loyalty has remained a matter of debate.
In his view, Oliver (1999, p.34) describes loyalty as “a deeply held commitment to rebuy
or repatronize a preferred product/service consistently in the future, thereby causing
repetitive same-brand purchasing, despite situational influences and marketing efforts
having the potential to cause switching behaviour .” Beerli, Martin, and Quintana (2004, p.
254) argue that the essence of loyalty has long been summarized as “repeat purchasing
frequency or relative volume of same-brand purchase.” Several definitions that examine
loyalty from a behavioural standpoint (e.g., repeat purchase) without delving into the
psychological meaning of the term are considered problematic (Oliver, 1999). Jacoby and
Chestnut (1978) investigated the psychological meaning of loyalty in order to separate it
from behavioural (i.e. repeat purchase) loyalty. They concluded that using repetitive
Page 22
15
purchasing as a measure of loyalty could be invalid due to happenstance purchasing or a
need for convenience. Also, where consumers are multi-brand loyal, inconsistent buying
could mask loyalty.
Therefore, in an attempt to provide an alternative and a more comprehensive definition,
researchers including, Dick and Basu (1994) suggested that loyalty should comprise both
behavioural and attitudinal properties, and also determined by the strength of the
association between relative attitude and repeat purchase. Hence, the general consensus
among researchers is that both behavioural and attitudinal elements must be included when
defining and conceptualizing customer loyalty (Santouridis and Trivellas, 2010). The
behavioural dimension referring to issues related to frequency of repeated purchases and
brand switches (Santouridis and Trivellas, 2010; Bowen and Shoemaker, 1998), whereas
the attitudinal dimensions emphasizes psychological involvement and preference with a
unique focus on issues such as brand recommendation, resistance to superior products,
repurchase intentions and willingness to pay a premium price (Cronin and Taylor, 1992).
Overall, customers who become loyal are more likely to increase their repurchase
activities, make business referrals, give favourable word of mouth and are also less likely
to switch to alternative suppliers in the face of attractive price inducements as compared to
less loyal customers (Cheng, Lai, and Yeung, 2008). In other words, customers who
exhibit both attitudinal and behavioural features of loyalty tend to demonstrate greater
commitment to their relationship with their service suppliers. With the strategic importance
of customer loyalty highlighted, it is necessary to understand, in depth, factors that drive
customer loyalty.
2.3 Antecedents of customer loyalty
There has been increased interest, over several decades, in understanding the factors
determining customer loyalty. While plethora of factors are assumed to influence loyalty, it
is difficult, if not impossible; to find one study that has investigated all the antecedent
factors of loyalty simultaneously and jointly (Aydin and Ozer, 2005; Cronin et al., 2000).
Obviously, several factors are assumed to determine customer loyalty. Particularly, in the
mobile services sector, over the past decade factors including customer satisfaction
(Gerpott et al., 2001; Kuo, Wu, Deng, 2009) ; perceived value (Wang and Lo, 2002),
service quality (including network quality) (Lim, Widdows and Park, 2006; Johnson and
Page 23
16
Sikirit, 2002); switching cost (Kim et al., 2004; Seo and Badad, 2008); corporate image
and trust (Aydin and Ozer, 2005) and other relationship marketing tactics have been
reported to influence customer loyalty considerably. Thus, the proposed theoretical model
for this study has identified customer satisfaction, perceived service quality, perceived
value, corporate image, and switching cost as key determinants of customer loyalty in the
mobile telecommunication sector of Ghana. As such, a synopsis of the effects of these
factors on customer loyalty reported by other researchers in their respective mobile
services market is outlined below
First the proposed model shows a direct link between customer satisfaction and customer
loyalty. This is supported by a study investigating customer retention, loyalty and
satisfaction within the German cellular market, where Gerpott, Rams, and Schindler (2001)
found that overall customer satisfaction had a significant effect on customer loyalty, which
in turn influenced customers’ decision regarding whether or not to terminate/extend their
contractual relationship with their mobile service providers. Second, perceived service
quality is proposed to influence both satisfaction and loyalty directly. An indirect effect on
loyalty is also assumed through satisfaction (e.g., Caruana, 2002). Santourisdis and
Trivellas (2010) studying drivers of customer loyalty in the Greece mobile telephony
market found, among other things, that service quality, measured by factors including
network, customer service, value added services etc., had a direct as well as indirect effect
through customer satisfaction, on customer loyalty.
Kuo, Wu and Deng (2009), however, reported that service quality did not have a direct
effect on consumers’ post purchase intentions with mobile value-added service offerings in
China. On the contrary, they found satisfaction to fully mediate this interaction. Also, Kim
et al. (2004) found that call quality, value-added services and customer support, all
measuring service quality had a very strong impact on customer satisfaction, which in turn
influenced Koreans loyalty in their mobile service providers. Specifically, call quality
emerged as a very important attribute in the service quality – loyalty link. While service
quality has been found to significantly influence customer loyalty, it is obvious from the
above studies that varying outcomes are likely given the uniqueness of the research
settings.
Third, perceived value is proposed to influence customer satisfaction and loyalty directly.
Likewise, an indirect effect of perceived value on loyalty through satisfaction is also
Page 24
17
assumed in the model. Previous studies provide strong support for the positive linkage
between customer perceptions of value and customer loyalty. For example, the study by
Kuo, Wu and Deng (2009) showed that perceived value had a direct and positive effect on
customer satisfaction and post-purchase intentions. Particularly, Hutchinson, Lai and Wang
(2009) investigating the behavioural intentions of golf travelers in the tourism setting
found that perceived value had direct positive effect on intention to revisit and favourable
word of mouth. As shown in their study, they further suggested that perceived value be
used as an immediate antecedent of customer satisfaction, empirically tested by other
researchers (e.g., Brady and Cronin, 2001; Cronin et al., 2000; Oh, 2000). When customer
needs, problems, frustrations, challenges, difficulties are solved by the service offering, so
that they can achieve the desired outcome optimally, and at affordable cost, they become
very pleased. Consequently, they would be inclined to revisit and/or say positive things
about the service provider. On the contrary, if in trying to solve their communication
problems, they encounter further challenges or frustrations deemed costly, they would be
upset and, in turn, be negative about the service provider.
Lastly, the model proposes a direct effect of corporate image and switching cost on
customer loyalty. Some previous studies reported that perceived switching cost, and
corporate image both hanced customers’ loyalty in their mobile service providers. For
example, Aydin and Ozer (2005) investigating the Turkish mobile sector observed that
perceived switching cost had positive and significant effect on loyalty. They, however, did
not find the relationship between corporate image and loyalty to be statistically significant.
Also, Kim et al. (2004) observed that customers were more likely to remain with their
existing mobile service carriers even at lower levels of satisfaction, especially when they
perceive overall switching barriers to be high. They argue that for carriers to cement their
relationship with customers they needed to embark on various customer reward programs
including price discounts and mileage programs to lock phone users in, a move general
described as erecting intentional barriers (Klemperer, 1987).
In a related study, Lai, Griffin, and Babin (2009) suggests that corporate image shaped in
part by customers’ overall consumption experiences, and with service quality constituting
these consumption experiences, seems to bolster loyalty for a company. However, they
found that this image-loyalty link was mediated by customer satisfaction and perception of
value. Yet, Boohene and Agyapong’s (2011) investigation of Ghanaian’s mobile services
sector found a direct positive effect of corporate image on customer loyalty.
Page 25
18
In sum, foregoing discussion provided a quick snapshot of how the dimensions are linked
to loyalty. Preceding sections show a more detailed theoretical review and consequences of
each of the constructs on customer loyalty within the mobiles services sector.
2.3.1 Customer satisfaction
Just like customer loyalty, customer satisfaction has attracted a lot of debate in regard to
how the construct should be defined. In the marketing literature, at least, two dominant
categorization of customer satisfaction have been suggested: transaction-specific and
cumulative perspective (Anderson, Fornell and Lehmann, 1994). Researchers following the
transaction-specific logic (e.g., Bitner, 1990; Oliver, 1993; Cronin and Taylor, 1992, p.56)
have described satisfaction as a “post choice evaluative judgment of a specific purchase
occasion” (Anderson, Fornell and Lehmann, 1994, p. 54). By contrast, cumulative
customer satisfaction adherents, including Fornell (1992), and Anderson et al., (1994) have
suggested that customer satisfaction be viewed as an overall evaluative process based on
the complete purchase consumption and experience of products or services over time.
Following the cumulative perspective, this paper views customer satisfaction with a mobile
network service provider as the totality of customers’ experience, based on an overall
evaluation of various aspects of the service offering over time (e.g., Pappu and Quester,
2006). This conceptualization takes into consideration the past, present, and future
performance of a firm (Anderson, Fornell and Lehmann, 1994), which is particularly
relevant for the mobile telephony services sector, given the continuous long-term
contractual relationship that must be sustained for mutual value creation (Gerpott, et al.,
2001).
Despite the different ways customer satisfaction has been treated, there is a general
consensus that, “satisfaction is a person’s feeling of pleasure or disappointment resulting
from comparing a product’s perceived performance (outcome) in relation to his or her
expectations” (Kotler, 2003, p. 36). This means that customer satisfaction is a function of
the perceived discrepancy between prior expectation and perceived performance following
consumption, so that when a consumers’ overall perceived experience differs markedly
from expectation, dissatisfaction is assumed to have occurred (Oliver, 1980). Rust and
Oliver (1994) defined satisfaction as the degree to which a consumer believes that an
experience induces positive feelings – a function of expectation fulfillment.
Page 26
19
Customer satisfaction has received considerable attention in the extant literature as it has
been considered a key determinant of various consumer behavioural outcomes, particularly
customer loyalty (e.g., Cronin and Taylor, 1992). For example, Anderson and Sullivan
(1993) observed that when customers become satisfied, they have a greater propensity to
be retained and to be resistant to alternative offerings. In the same vein, Fornell (1992)
argued that high satisfaction leads to customers with increased loyalty, and less susceptible
to competitive inducements. Anderson, Fornell and Leymann (1994) pointed out that low
customer satisfaction implied greater customer turnover, and higher replacement cost, due
to the acquisition cost and difficulty in winning over customers who are satisfied with a
competitors offering. As such, firms that ensure levels of customer satisfaction are
sustained will benefit immensely as the cost of attracting new customers will be
considerably lower (Hallowell, 1996). But more importantly, satisfied customers are more
likely to engage in favourable word of mouth, and less likely to engage in damaging
negative word of mouth (Fornell, 1992; Anderson, Fornell, and Leyman, 1994).
Hutchinson et al. (2009) found that customer satisfaction had a strong impact on positive
word of mouth and intention to revisit a golf travel destination. Satisfaction, however, did
not influence golfer’s search for alternative destinations. This finding may explain variety-
seeking behaviours, such that no matter the level of satisfaction, some customers will
search alternative sources (e.g, Kahn, 1995).
Moreover, Fornell, Johson, Anderson, Cha and Bryant (1996) pointed out that increased
customer satisfaction is immediately followed by decreased customer complaints and
increased customer loyalty. This is because when customers are dissatisfied they have the
option of either resorting to exiting tactics (i.e., going to a competitor) or voicing their
complaints in an attempt to receive retribution. Thus, complaint behaviour is reduced
markedly when customers become satisfied, which leads to loyalty thereby (Fornell, et al.,
1996). In addition, in a study of retail banking services, Hallowell (1996) found a causal
link between customer satisfaction, customer loyalty and profitability. Brown and Gulycz
(2002) suggested that customer satisfaction should be considered as a competitive weapon
since traditional approaches to differentiation, such as product/service features, price, and
distribution strategies were insufficient. Overall, it can be concluded from the reported
findings that customer satisfaction has strong and positive impact on both behavioural and
attitudinal aspects of loyalty (e.g., Santouridis and Trivellas, 2010). More specifically,
higher levels of customer satisfaction lead to customer loyalty.
Page 27
20
Similar results have been found in the mobile telecommunication services literature, where
satisfaction has emerged to strongly influence customer loyalty (e.g., Lim, Widdows and
Park, 2006; Gerpott et al. 2001; Liu, Guo and Lee, 2011; Kuo et al., 2009). For example,
Lim, Widdows and Park’s (2006) study of the US mobile services market found customer
satisfaction as a strong predictor of customer loyalty. Gerpott et al. (2001) revealed that
customer satisfaction had a strong indirect effect on customer retention, with this linkage
fully mediated by customer loyalty toward a service provider. In other words, higher levels
of customer satisfaction led to customer loyalty which, in turn, improved customer
retention rates. In the Taiwanese mobile services market, Liu et al. (2011) found that
satisfied customers were more likely to stay with their carrier and also recommend them to
others while Kuo et al. (2009) discovered that customer satisfaction positively influenced
consumers’ post-purchase intentions in mobile added-value services. Lastly, while positive
linear relationships between satisfaction and loyalty have been reported extensively, some
scant negative relationships have also been found. For example, Boohene, and Agyapong
(2011) analysis of customer loyalty in the Ghanaian telecommunication sector discovered
that customer satisfaction had a significant, but negative effect on loyalty, implying that
despite the low levels of satisfaction, consumers still remained loyal (i.e., repeat purchase)
to their network providers. Notwithstanding, the general consensus is that customer
satisfaction has a strong positive effect on customer loyalty. Therefore, it is hypothesized
that:
H1. Customer satisfaction has a direct positive effect on customer loyalty
2.3.2 Perceived Service Quality
Researchers and practitioners interest in service quality is clear, reflected in the fact that
poor quality compromises a firm’s ability to effectively differentiate itself in the
marketplace, potentially driving away customers (Lovelock and Wirtz, 2011). Thus, the
delivery of higher service quality has long been recognized as a key differentiating strategy
due to its strong impact on customer satisfaction, customer loyalty, profitability, and
overall business performance. Given the unique impact of service quality on firm
performance, several authors have sought to explain quality, thereby resulting in several
distinct definitions and conceptualizations. For example, in marketing and economics,
quality has often been viewed as dependent on the level of product quality (e.g., Hauser
Page 28
21
and Shugan, 1983). The operations management school (e.g., Garvin, 1988) also views
quality as having two distinct features: (1) Fitness for use - referring to whether the product
or service does what it is supposed to do, and also possess features that meet the needs of
customers; and (2) Reliability – implying the extent to which the product is free from
deficiencies. In the services marketing literature, quality is viewed as an overall assessment
(e.g., Parasuraman, Zeithaml and Berry, 1985) of service attributes.
Specifically, service quality, according to the services literature is defined as a form of
attitude, related but not equivalent to satisfaction, that result from the comparison of
expected service levels with perceived performance (Bolton and Drew, 1992; Parasuraman,
Zeithaml, and Berry, 1998, Cronin and Taylor, 1992, Johnson and Sirikit, 2002). Similarly,
Anderson, Fornell and Leymann (1994, p. 54) described perceived quality as the “global
judgment of a supplier’s current offering.” Advocating a performance-based approach to
understanding service quality, Cronin and Taylor (1992) proposed that overall perceived
quality be measured by having customers assess the performance of a firm’s business
processes. This is similar in spirit to the position taken by Gronroos (2007) who suggested
that perceive service quality should be understood as the result of an evaluation process in
which the customer compare their perceptions of the service delivery process, and its
outcome to their expectations; hence, the distinction between functional (or process)
quality, and technical (or outcome) quality.
In general, there is considerable evidence suggesting that service quality functions as an
antecedent to customer satisfaction (Cronin and Taylor, 1992; Reichheld and Sasser,
1990), and consequently to customer loyalty. This has created considerable practitioner
interest which focusses on identifying strategies for improving service quality. The
measurement of service quality occupies center stage in service improvement programmes
(Johnson and Sirikit, 2002). Particularly, the SERQUAL model developed by Parasuraman
et al. (1988) and consisting of five dimensions namely reliability, responsiveness,
assurance, empathy and tangibles is popularly considered as a robust measure of service
quality. The SERQUAL instrument assesses overall service quality by making a
comparison between service expectations and actual performance along the five
SERQUAL dimensions.
While the SERQUAL framework is extensively applied in various service settings, in
recent years, however, considerable attempts have been made to conceptualize and
Page 29
22
measure service quality relative to the demands and unique attributes of a particular service
industry, with no exception to the mobile services industry. Given the rapid growth and
increased importance of the mobile telephony sector, several attempts have been made to
measure service quality as it is perceived by key actors, particularly consumers (e.g.,
Gerpott et al., 2001; Ayden and Ozer, 2005; Kim et al., 2001; Lim et al., 2006; Lee et al.,
2001),. For example, Gerpott et al. (2001) and Kim et al. (2004) measured service quality
by the following dimensions: call quality, pricing structure, mobile devices, value-added
services, convenience in procedure, and customer support. Lim et al. (2006) used various
dimensions including pricing plans, network quality, entertainment services, billing
systems, and customer service to measure consumers’ perceived quality of mobile services.
Furthermore, Chae, Kim, Kim and Ryu (2002) adopted connection quality, content quality,
interaction quality, and contextual quality to measure the information quality of mobile
networking services. To identify key dimensions for measuring service quality in the
Ghanaian mobile network services market, a pilot email survey was initiated. Following
this, and in agreement with previous studies, seven items including network connection,
network coverage, quality of voice call, customer care service etc., were used as relevant
measures of perceived service quality in this study.
Several research studies in different industry sectors have found causal links between
service quality, customer satisfaction and customer loyalty (e.g., Cronin and Taylor, 1992;
Reichheld and Sasser, 1990; Cronin et al., 2000). Similar conclusions have been identified
in studies of mobile telephony services, where positive impact of service quality on
customer satisfaction is observed (Kim et al., 2004, Lim et al., 2006; Santouridis and
Trivellas, 2010; Wang et al., 2004). For example, Kim et al. (2004) in their investigation of
Korea’s mobile services sector reported that service quality positively influenced customer
satisfaction. Similar outcome was found by Deng et al. (2009) in relation to mobile instant
messaging among Chinese consumers.
Numerous scholars have long demonstrated the direct effect on customer loyalty by service
quality (e.g., Cronin and Taylor, 1992; Johnson and Sirikit, 2002; Parasuraman, Zeithaml,
and Berry 1991).The underlying assumption is that better service quality boost customer’s
propensity to repurchase again, to buy other ancillary services, to be become less price-
sensitive, and to give positive word of mouth about their experience to others (Venetis and
Ghauri, 2000). Yet, Kuo et al. (2009) studying undergraduate and graduate students’ usage
of mobile value added services in Taiwan, however, did not find significant positive effect
Page 30
23
of service quality on post purchase intentions. Cheng et al. (2008) and Lai et al. (2009)
reported similar findings among Hong Kong internet service users’ and Chinese telecom
consumers, where insignificant relationship was found between service quality and
customer loyalty. Meanwhile, Aydin and Ozer (2005) discovered that perceived service
quality directly and positively affect customer loyalty. Similarly, Boohene and Agyapong
(2011) found a strong positive relationship between service quality and customer loyalty.
In general, consumers experiencing better service quality have greater tendency to stay
with their service provider over the long haul, buy more, and offer favorable
recommendations to others. Therefore, the following hypotheses are advanced:
H2: Perceived Service quality has a direct positive effect on customer loyalty
2.3.2.1 Perceived service quality, customer satisfaction and customer loyalty
A number of empirical findings have found support for the assumption that service quality
affects behavioral intentions only through customer satisfaction (e.g., Anderson and
Sullivan, 1993; Gotlieb, Grewal, and Brown, 1994). The assumption that satisfaction
mediates the quality-loyalty linkage is underpinned by Bagozzi’s (1992) argument that
initial service evaluations create emotional reaction, which ultimately drives behavior. This
implies that service quality and value appraisals precede satisfaction and ultimately
intended or actual behaviour, as demonstrated empirically by Cronin et al. (2000). They
reported that service quality had an indirect effect on customer loyalty through satisfaction
in all six service industries studied. By investigating retail banking customers, Caruana
(2002) also found that customer satisfaction played a significant mediating role in the
effect of service quality on customer loyalty. Still, within the mobile value-added services
sector, Kuo et al., (2009) did not find direct effect of service quality on post-purchase
intentions. Instead, they showed that service quality indirectly influenced post-purchase
intentions through customer satisfaction. Recently, Turel and Serenko (2006) found among
Canadian mobile services consumers that service quality was a key driver of customers’
satisfaction which, in turn, influenced the extent of their loyalty. Thus, the assumption that
service quality affects customer satisfaction, and ultimately loyalty leads to the following
hypothesis:
H2b: Perceived service quality has a direct positive effect on customer satisfaction,
and also indirect positive effect on customer loyalty through customer satisfaction.
Page 31
24
2.3.3 Perceived Value
Understanding the nature of customer perceived value, and how it affects customer loyalty
is a fundamental basis for business strategy since it provides a crucial link between
marketing and financial performance (Cretu and Brodie, 2007). Day (1990) claimed that
creating superior customer value should reflect the key goal of market-driven firms.
According to Holbrook (1994, p.22) customer perceived value is “the fundamental basis
for all marketing activity” (cited in Yang and Peterson, 2004, p. 803), as better value
constitutes a key motivation for customer repurchase intentions. The concept of customer
perceived value has long been considered to be very personal and subjective (Parasuraman
et al., 1985). Ravald and Gronroos (1996, p. 21) concluded that “the ultimate aim of adding
more value to the core product in order to enhance customer loyalty, will hardly be reached
if the value added is not customer oriented.” Thus, learning about customer value should
be tackled from the standpoint of the customer, since it is the customer and not the service
provider who makes assessment of whether or not a product or service provides better
value.
While the importance of customer value is widely recognized, there exist different
conceptualizations of the construct (Wang and Lo, 2002). Yet the general definition of
value reflects a “consumer’s perception of the subjective worth of some activity or object
considering all the net benefits and costs of consumption (Babin et al., 1994, cited in Lai et
al., 2009). Several authors, including Zeithaml, 1988; Monroe, 1991; Whittaker, Ledden
and Kalafatis, 2007), have adopted a cost-benefit perspective of customer perceived value,
where value is characterized on the basis of a “get for give” notion (Brodie et al., 2009). In
this regards, the benefits are what the customer gets, whereas costs are what the customer
gives up. According to McDougall and Levesque (2000) the costs include the price paid
plus other cost associated with the purchase. Zeithaml (1988, p. 14) describes perceived
value as the customer’s overall assessment of the utility of a product based on perceptions
of what is received and what is given; implying a trade-off between perceived benefits and
perceived costs (Lovelock, 2000).
Zeithaml (1988) emphasized the point that what constitutes perceived value is subjective
and highly idiosyncratic, and as such varies among consumers. According to Zeithaml
(1988), even though what consumers receive in a value exchange varies, some may be
particularly interested in volume, others better quality, still others convenience. Also what
is given up may vary; some consumers may be concerned only with the price paid, whereas
Page 32
25
others with the time and effort expended. Therefore, customers who perceive they have
received “value for money” are more satisfied than those who do not perceive to have
received “value for money” (McDougall and Levesque, 2000).
From the stand point of equity theory, customer-perceived value is based on the evaluation
of the relative rewards and sacrifices associated with an offering, derived from a
comparison between consumers’ outcome/input to that of the service provider’s
output/input. As inherent in the equity perspective, customers have the tendency to feel
equitably treated (e.i., to have received better value) if they perceive the ratio of their
outcome to inputs to the ratio of outcome to inputs derived by the company is comparable
(Oliver and DeSarbo, 1988). Poor customer value is derived when consumers have the
impression that suppliers extract greater value than what they contribute. Usually,
competitors’ offerings may serve as appropriate benchmark for making such equity
evaluations (Yang and Peterson, 2004). So that if a company’s input/outcome is perceived
to be higher relative to competitors’ offerings, lower perceived value is likely to be
experienced. Hence, perceived value can be viewed as a relative measure of the costs and
other monetary aspects of the service relative to competition (McDougall and Levesque,
2000). This is particularly the case in the telecom sector where cut-throat competition is
forcing companies to price their service offerings dramatically lower. And given the fact
that switching cost is generally low, and with increased multiple subscriptions, competitors
who are perceived to have better price offerings will be equated with providing
competitive value, and as a consequence achieve market dominance.
Previous empirical studies have identified perceived value as a major determinant of
customer satisfaction and customer loyalty in various industry settings (e.g., Cronin et al.,
2000; McDougall and Levesque, 2000). The assumption is that future intentions are partly
determined by perceived value (McDougall and Levesque, 2000). This is against the
backdrop that the decision to continue business relationship with a service provider is
likely to be based on whether or not customers consider themselves to receive better value
for what they sacrifice. Anderson and Srinivasan (2003) observed that when perceived
value is low, customers would be more likely to switch to a competitor in order to generate
better value, thus contributing to declining loyalty. Cronin et al. (2000) demonstrated in
their study that perceived value impact customer loyalty positively. Based on these
arguments, the following hypothesis is proposed:
Page 33
26
H3: Perceived value has a direct positive effect on customer loyalty.
2.3.3.1 Perceived value, customer satisfaction and customer loyalty
This line of argument is further extended to include the idea that when customers believe
they have received value for money they are more likely to be satisfied which, in turn, may
influence future intentions. According to Bei and Chiao (2001) when consumers perceive
that the price of a service or product is reasonable, they are likely to respond through
repeat purchase behavior, whereas if they do not perceive what they’ve received as
worthwhile in relation to their sacrifices, they are likely to avoid future repurchase
behavior, even when they are satisfied with the quality of the service or product.
McDougall and Levesque (2000) investigating four services found that perceived value
contributed directly to satisfaction, and in turn, to customer loyalty. Chen and Chen (2010)
study of the tourism services market demonstrated that perceived value was a strong
predictor of customer satisfaction and behavioural intentions. In the telecommunication
sector, Kuo et al. (2009) (focusing on the mobile value added services in Taiwan), Lai et
al. (2009) (focusing on the Chinese telecom industry) and Yang and Peterson (2004)
(investigating online consumers) all found perceived value to be a strong predictor of
customer satisfaction and behavioural intentions or customer loyalty. Thus, the assumption
that customer perceived value affects customer satisfaction and ultimately loyalty leads to
the following hypothesis:
H3b: Perceived value has a direct positive effect on customer satisfaction, and also
indirect positive effect on customer loyalty through customer satisfaction.
2.3.4 Corporate Image
Corporate image is a key element in the overall service evaluation (Lai et al., 2009).The
image consumers hold in their minds regarding a company or brand may have considerable
effect on their attitudes and/or judgment about a company’s overall excellence or
superiority. Unlike products, services evaluations pose a great challenge for consumers as
it is inherently intangible and process driven. The corporate image, therefore, becomes the
lens through which consumers are able to make appropriate judgment regarding the firms
overall outlook vis-a-vi other competitors. It affects how people think and relate with the
company. A vast body of literature has indicated that firms possessing good corporate
Page 34
27
image are better able to strategically differentiate themselves since image is linked to a
core aspect business success such as customer repurchase or loyalty (e.g. Bloemer, de
Ruyter and Peeters, 1998). This makes it very vital for firms to imprint superior image on
the minds of their customers through creative use of various marketing communication
strategies, and management of service encounters in order to win the battle for a share of
their mind space.
Usually used interchangeably with the term reputation, numerous defintions of corporate
image have been offered in the past (Barich and Kotler, 1991; Bloemer, de Ruyter and
Peeters, 1998; Ngugen and LeBlanc, 1998) Gronroos (1988) and Keller (1993) describe
corporate image as the set of associations held about an organization in consumer memory,
and which works as a filter to influence the perception of the operations of the company.
According to Barich and Kotler (1991) corporate image is “the overall impressions made
on the minds of the public about a firm” (cited in Wang, 2010, p. 255). Treadwell and
Harrison (1994) also defined it as “an individual’s current idiosyncratic representation of a
particular organization, including related attitudes, beliefs, and impressions about the
organization and its behaviour” (p. 64). And Wan and Schell (2007), from a public
relations standpoint, argued that organizational (or corporate) image encompasses “the set
of cognitions, including beliefs and attitudes, that people hold about the sum of the entire
organization, including the company’s products, services, management quality,
communication activities, employee orientation, and corporate philanthropy” (p. 28). This
study adopts the later definition as basis for the measurement of corporate image since
mobile service providers in Ghana widely resort to practices described in the definition to
enhance their image.
Attempts to understand how image is formed in people’s mind have attracted different
propositions (Ngugen and Leblanc, 2001). Yet researchers generally agree that corporate
image formation is process oriented. Nguyen and Leblanc (2001, p. 228) observed that
corporate image is related to the physical and behavioural attributes of the firm, such as
business name, architecture, range of products/services, and to the impression of quality
communicated by each person interacting with the firm’s clients. It also reflects the
publics’ evaluations about a company’s performance in areas such as management quality,
employment orientation, and communication activities (Wan and Schell, 2007). Again,
while consumers may not have all relevant information about a firm, information cues
obtained from different sources including advertisement and word of mouth will affect the
Page 35
28
process of corporate image formation (Aydin and Ozer, 2005). In his view, Gronroos
(1984) pointed out that corporate image is built mainly by technical quality – what
customers receive from the service experience, and functional quality – the process by
which the service is delivered. Thus, the content and quality of delivery systems contribute
to building corporate image. Corporate image is, as a consequence, an aggregate process
by which the public makes an assessment of how firms perform on various attributes
(Ngugen and Leblanc, 2001).
By way of predicting an individual’s behaviour, Fisbein and Ajzen (1975) attitude theory
suggest that belief causes attitude which, in turn, causes intentions to behave. According to
them, beliefs are formed when a person associates an object with various attributes,
whereas attitude is the function of a person’s salient beliefs at a given point in time
(Fishbein and Ajzen, 1975, p. 222). In Fishbein and Ajzen’s framework, attitude toward an
object is regarded as a driving force in forming a person’s intentions to engage in a variety
of behaviours related to that particular object. In addition, direct experience makes attitude
more accessible and, as a consequence, predictive of future behaviours (Lai et al., 2009).
Thus, attitudes are functionally related to behavioural intentions, and that intentions are
strong predictors of actual behaviour (Fisbein and Ajzen, 1975). Hence, corporate image,
conceptualized as attitudinal, must determine behavioural intentions such as customer
loyalty (Aydin and Ozer, 2005).
The exact link between corporate image and loyalty has been demonstrated in numerous
studies. Nguyen and Leblanc (2001) found that corporate image positively affects customer
loyalty in three service sectors namely telecommunication, education and retailing.
Andreassen and Lindestad (1998) demonstrated that corporate image determines corporate
loyalty in the package tour industry in Norway. Boohene and Agyapong (2011) also found
a direct positive effect of corporate image on customer loyalty. On the other hand, there is
ample evidence to suggest that the link between corporate image and customer loyalty is
mediated by customer evaluative judgments such as satisfaction and quality perceptions,
and switching cost. For example, Wang (2010) found that the relationship between
corporate image and customer loyalty depended on perceived switching cost, such that as
switching cost increased, the relationship between corporate image and customer loyalty
reduces considerably. Hart and Rosenberg (2004) found that corporate image has a
“marginally significant” direct influence on customer loyalty, yet the effect on customer
loyalty by image is significantly mediated by satisfaction. Despite varying accounts of the
Page 36
29
effect of corporate image on customer loyalty, it is established that favourable corporate
image seems to encourage loyalty for a firm. Based on abovementioned reasons, it is
hypothesized that:
H4: Corporate image has a direct positive effect on customer loyalty
2.3.5 Switching Costs
Switching costs are considered as key drivers in customer retention or switching decisions.
Switching costs are generally described as the costs incurred when switching from one
service provider to a competitor, with such costs including time, money and psychological
cost (Dick and Basu, 1994). According to Murray (1991) switching costs may also entail
perceived risks, to the extent that there are potential losses perceived by customers when
switching service providers, such as losses of a financial, performance-related, social,
psychological, and safety-related nature (cited in Chen, Lai and Yeung, 2008, p.30). It is
assumed that the higher the switching cost the greater the propensity that a customer will
be forced to stay with his or her current service provider, despite being dissatisfied or
having experienced poor service quality. Fornell (1992) observed that a customer
dissatisfied with current service levels is faced with switching barriers or costs when they
encounter difficulty in switching due to financial, social and psychological burden
experienced by the customer when switching to another service provider.
Switching costs may also include all costs a customer incurs when switching between
different brands of products or services (Seo et al., 2008). Some of the factors identified to
boost switching barriers include search costs, transaction costs, learning costs, loss of
loyalty discounts, loss of established habits and relationships, and risk of the unknown
(Fornell, 1992; Klemperer, 1987). For example, by making particular reference to the
mobile telephony sector, Kim et al (2004) identified three factors influencing switching
cost namely loss cost, adaptation cost, and move-in cost. According to the authors, loss
cost refers to the perceived loss in social status or performance, when a customer cancels
service contract with an existing carrier; they will be unable to enjoy those services and its
perceived attendant benefits again. Adaption loss, on the other hand, refers to perceived
cost involved in adapting to a new carrier including search cost, and learning cost. And
lastly, move-in cost is the economic cost of switching to a new service provider, e.g., the
Page 37
30
purchase of a new device and the subscription fees. All these costs, including others,
reduce the incentive to switch between brands.
In a similar vein, Klemperer (1987) identified three kinds of switching costs – transaction,
learning and artificial or contractual costs. While the transaction costs and learning costs
are costs initiated by the customers such as cost incurred when changing carrier or making
the effort to become acquainted with new products and/or services to derive the same level
of comfort as with the old provider, artificial or contractual costs are those that are
intentionally designed by the service provider to lock customers into the relationship
(Klemperer, 1987; Seo et al., 2008). This may include such schemes such as loyalty
benefits or contractual withdrawal penalties to encourage retention of existing subscribers
(Shin, 2006). Essentially, the contractual costs are designed as part of firm strategy to
disincentivize subscribers who may want to switch by erecting intentional barriers
(Klemperer, 1987).
One important strategy considered to influence customer switching behaviour is
interpersonal relationships built through frequent interactions between the service provider
and customers (e.g., Kim et al., 2004). Such relationships solidify the bonds between actors
and may lead to long term-relationships, making it psychologically burdensome for
customers to switch. Jones, Mothersbaugh and Betty (2000) observed that relationship-
specific investments enhance customers’ dependence and, as a consequence, reinforces the
switching barriers they experience.
Altogether, both monetary and nonmonetary factors exert considerable influence on
customers perceived switching costs. It is important to emphasize that given the industry
conditions some key factors may increase switching costs greatly than others. With the
introduction of Mobile Number Portability in many countries, which is assumed to reduce
the financial cost of switching, and make it relatively easy for customers willing to switch
to other service providers to do so, yet social cost of brand switching (Shin, 2006) may as
well exert considerable influence on switching decisions. While switching may appear
attractive, especially in the face of customer dissatisfaction or poor service quality,
majority of subscribers in the popular media within the Ghanaian telecommunication
sector have cited subscriber base commanded by their primary service carrier, and the
relative length of relationship on a particular network to influence their switching attitudes.
In other words, greater number of subscribers (market share) and longer duration on a
Page 38
31
particular network (duration of usage) creates switching barriers for subscribers who may
otherwise want to switch. Lack of attractive alternative is also identified as a key factor
influencing switching intentions (Han, Kim and Hyun, 2011).
To reiterate, when customers perceive alternative providers as not good enough, or similar
to their existing provider they are less inclined to switch (Kim et al., 2004; Han, Kim and
Hyun, 2011). Lack of superior alternatives or no perceived differences among alternatives
may create favourable attitudes towards existing service providers (Han, Kim and Hyun,
2011). Such situation is likely to mask the true nature of customer loyalty since customers
who perceive the performance of their existing service provider to be less optimal and
unsatisfactory, may continue patronage, when they feel their current provider is somewhat
better than competitors. Hence, lack of attractive alternatives may play an important role
in customers’ switching decisions (Han, Kim and Hyun, 2011).
Thus, when switching cost is perceived to be high, increased customer loyalty is likely to
be the consequence. Dick and Basu (1994) suggested that customers may remain with a
company not only because of loyalty to the brand, but also due to high perceived switching
barriers. Importantly, the effect of perceived switching cost on customer loyalty has been
empirically corroborated in various service settings. For example, Kim et al. (2004) found
that switching cost had a direct as well as interaction effect with satisfaction to determine
customer loyalty. They concluded that customers’ were more likely to stay with their
existing provider despite being dissatisfied, particularly when overall perceived switching
barriers are high. In a study of haircut services, Wang (2010) found that the effect of
customer perceived value and corporate image on customer loyalty was reduced under
conditions of high switching costs. Cheng, Lai and Yeung (2008) focusing on internet
service users in Hong Kong found a direct positive effect of switching cost on customer
loyalty. Aydin and Ozer (2005) also in the Turkish telecommunications industry found
similar results. Lastly, Liu, Guo and Lee (2011) found that switching barriers led to
customer loyalty. Therefore, it is hypothesized that:
H5: Perceived switching cost has a direct positive effect on customer loyalty.
Page 39
32
CHAPTER 3
3. METHODOLOGY
The previous chapter gave an overview of the conceptual underpinnings of the research
model. Testable hypothesis were also proposed in regard to the influence of the study
variables on customer loyalty within the mobile network services industry Ghana. This
chapter will, however, touch on issues relating to the research design, sampling, data
collection procedures, survey instrument development, and measurement of the study
constructs.
Page 40
33
3.1 Research Design
The design of the research seeks to outline the blueprint or framework for conducting
marketing research project. Three main research designs are broadly classified as casual,
exploratory and descriptive designs (Malhotra, 2010). The choice of any type of design is
influenced particularly by the research question under investigation. In this study, the
objective is to determine the effect of customer satisfaction, service quality, perceived
value, corporate image and switching costs on customer loyalty. All hypotheses are framed
as correlations, and the research design outlines a detailed plan for empirical testing
(Ravndal, 2006).
This study adopts descriptive design for the following reasons. Descriptive design follows
a quantitative approach where the focus is on headcount or numbers. Quantitative research
relates to quantity, and is dependent on large numbers of interviews to achieve robust
measurement and make substantial claims. Besides, large numbers of interviews require
sufficient structure in the questions, with interviews composed of closed questions instead
of open questions.
Whiles descriptive design attempts to determine the proportion of the population that
behave or think in a certain way and how much of effect is contributed by each explanatory
variable on the outcome, the aim of exploratory design, which is qualitative in nature, is to
dig deep into respondents’ motivation and experiences by using loosely structured
interviewing by a skilled researcher or from a focus group, and with few respondents
(Malhotra, 2010). The advantage of the latter method is in its flexibility as an approach
which relies heavily on the skills of the researcher to interact with respondents and dig
deeper into their experiences. Hence, qualitative approach seeks quality over quantity vice
versa.
When the goal of the research is to establish a causal relationship among variables, then an
experimental design is implied (Cook and Campbell, 1979). The strength of an
experimental design over those discussed above is that possible confounding variables can
be controlled during the experiment. It also allows for manipulation of independent
variables, and enables comparison across various treatment conditions. However, factors
such as assignment of participants into respective experimental conditions, maturation,
experience with experiment etc. could undermine the strength of experimental design.
Page 41
34
Therefore, the design adopted in this thesis is descriptive, cross-sectional survey design
wherein structured questions are used to obtain data from study participants. This research
design is well suited since we are interested in how much of effect is contributed
individually by the independent variables on the outcome. A cross-sectional design enables
the testing of the hypotheses by establishing correlations among variables while controlling
for spurious effects (Ravndal, 2006). With this method, the focus is on quantity, and
variables are related, no deeper insight from study participants is sought, and manipulation
of study conditions is not necessary.
3.2 Sample, data collection and questionnaire development
3.2.1 Demographics
The sample consisted of significantly more men (94; 69.1%) than women (42; 30.9%).
The median age category ranged from 25 to 34 years old (70.6%). Respondents with
undergraduate and postgraduate degrees accounted for 51.9% and 30.1% respectively.
Moreover, majority of respondents were drawn from the regional capital of the country
(Accra); hence we observe a relatively large number of respondents accounting for 81.2%
of the population, with the second largest region by respondents accounting for barely
7.5%. Finally, of the 140 customers in the analysis, 25.2% (34) have usage duration of
more than 6 months but less than 2 years, whereas those who have usage duration of
between two(2) to four(4) years and four (4) to six (6) years account for 28.9% of length of
use (39) in both situations. Table 1 shows details of respondents’ demographics.
Page 42
35
Table 1: Respondents profile
Variables Frequency %
Gender
Male
Female
94
42
69.1
30.9
Age Distribution
18-24
25-34
35-44
45-54
Over 55
19
96
15
5
1
14.0
70.6
11.0
3.7
0.7
Education
Senior High (SSSCE)
Higher National Diploma(HND)
Undergraduate degree
Master degree
Other
10
5
69
40
9
7.5
3.8
51.9
30.1
6.8
Duration of Use
Less than 6 months
Over 6 months - less than 2 yrs
2-4 years
4-6years
7-10 years
More than 10 years
3
7
34
39
39
13
2.2
5.2
25.2
28.9
28.9
9.6
Region
Ashanti Region
Greater Accra Region
Central Region
Volta Region
Brong-Ahafo Region
Eastern Region
Upper East Region
Western Region
Upper West Region
10
108
3
3
1
4
1
2
1
7.5
81.2
2.3
2.3
0.8
0.8
3.0
1.5
0.8
Page 43
36
3.2.2 Online survey advantages
To collect data necessary for investigating the problem, a web-based questionnaire survey
was employed in this study. Online survey was selected for data gathering since it has the
ability to reach the survey audience instantaneously; defying geographic barriers with just
a click of the button. Online survey is efficient to develop and distribute. Second, online
survey enables the researcher to track who has taken the survey and the direction of
response. Results come in real-time. Instantly, the researcher knows how many
respondents have been reached. Unlike paper based surveys, online surveys have the
benefit of increasing response rate through reminders with just a click of the button.
Finally, online survey gives the researcher control over the results; no data imputation, no
missing papers, or respondent hesitation to return filled papers etc. Therefore, online
survey was favored.
3.2.3 Data collection procedure
To begin with, a letter of solicitation transmitted by e-mail to 723 respondents selected
from e-mailing list, and social media platforms (i.e., Facebook and LinkedIn) was used.
The emailing list as well as social media contacts comprised mobile phone subscribers,
some of which were personally known to the researcher, while others were recruited at
random. Similar approach was used by Torel and Serenko (2006) where mobile phone
users personally known to the researchers were arbitrarily chosen to participate in their
study.
The e-mail detailed out the research objective, with an invitation for each receiver to take
part in the survey. With regards to social media, the invitation e-mails were sent directly
into respondents inbox instead of their main page in order to control for who responded to
the study. Respondents were required to follow the URL address provided in the e-mail
invitation to submit their responses. Anonymous links was used for the invitation e-mails
to distribute the questionnaire survey. The selection of the sample was based on
convenience sampling approach; i.e., dependent on the researchers’ judgment of those
deemed suitably placed to comment on the subject matter (Malhotra, 2010). Again, such
individuals were contacted via e-mail, Facebook and LinkedIn. The samples are general
Ghanaian mobile network service consumers who are currently subscribed to mobile
services.
Page 44
37
Additionally, using a “snowball” approach, respondents were asked, having finished
answering the questionnaire, to forward the e-mails to contacts they knew. This was
possible due to the anonymous link unlike the panel distribution approach that was
adopted. Panels are pre-determined email contacts the researcher assembles to serve as
survey audience. The Qualtrics software suite was used for data collection. Before
initiating the survey, the questionnaire was pre-tested with a convenience sample of 15
respondents, including the research supervisor, to examine the questionnaire design in
terms of the clarity, readability, and understandability of all the items and instructions used
(Lim et al., 2006). Moreover, two industry experts from the Ghanaian mobile services
sector reviewed the questionnaire to determine its face and content validity. Feedback from
the pre-test participants and industry experts was used to refine the questionnaire.
While the sampling procedure adopted in this research has limitations in regard to
generalizability relative to other probabilistic methods of sampling, it was assumed that the
sample duly served as a representation of the whole population of mobile network services
consumers in Ghana. No single identifiable group became the focus of study as attempts to
use institutional or group contact emails failed, neither was it possible to contact
respondents through the network providers. While response rate is difficult to ascertain on
the assumption that some participants would forward the survey to friends, about 723
invitation e-mails were originally sent through traditional e-mails, Facebook and LinkedIn
platforms. The survey was conducted over a four-week period; from February 15 to March
20, 2012. With 169 respondents starting the survey, representing 80% click-through rate.
Responses with over 50% missing data were excluded from the analysis. Overall, 140
usable questionnaires were obtained for data analysis. The respondent’s distribution in
terms of the mobile telecom operators’ share of the market is presented in fig 3 on next
page.
3.2.4 Ethical considerations
Ethical standards for collecting and storing personal data as per regulations from the
Norwegian Social Sciences Data Services (NSD) were complied with. As such, this project
ensured that responses were treated with strict confidentiality, and that personal data were
made anonymous in all reporting in this study. It was also emphasized in the email
invitation that participation was voluntary. Lastly, it was indicated that all data material
will be made anonymous and deleted after project end; this involves directly and indirectly
indentifying data (connections to name/emails, addresses and background information).
Page 45
38
Fig 3: Market Share based on study responses
3.2.5 Instrument Development
The questionnaire for the study was broadly divided into two parts; part A and part B.
Respondents were initially required to indicate their primary network preferences, as
multiple subscriptions is commonplace in Ghana. Part A was composed of the
measurement constructs (i.e., the latent variables) with items including customer
satisfaction, customer loyalty, service quality, perceived value, corporate image and
switching cost, whereas part B contained questions relating to respondents’ demographic
information – age, gender, education, duration of subscription to network, and region of
residence. Table 6 gives an overview of the items particular used for measuring the
constructs (i.e., the latent variables).
When developing a scale to measure a marketing construct, it is important that such
constructs are succinctly defined and distinguished from other constructs included in the
study (Netemeyer et al. 2003). Constructs that are adequately operationalized help in
determining what kind of items deemed fit to be included in the scale development; which
also improves the adequacy of the scale in reflecting the construct. Generally, the degree to
which a scale is considered as adequate is determined by how valid and reliable the scale
is.
MTN 57.9%
Vodafone 18.6%
Airtel 15.7%
Tigo 6.4% Expresso
1.4%
Market Share based on study responses
Page 46
39
The validity of a scale may be defined as the extent to which the scale measures what it is
supposed to measure (Coolican, 1999). While different validity typologies have been
distinguished, construct validity which includes convergent, discriminant and nomological
validity is considered, since both convergent and discriminate validity are easily identified
using statistical tools such as factor analysis. Convergent validity deals with the extent to
which the scale correlates positively with other measures of the same construct, whereas
discriminant validity refers to the extent to which measures does not correlate with other
constructs from which they are supposed to differ. It reflects a lack of correlation among
differing constructs (Malhotra, 2010). Scale validity is usually robust when sample size is
considerably large.
On the contrary, reliability is defined as the ‘degree of inter-relatedness among a set of
items designed to measure a latent variable.’(Netemeyer et al, 2003). The coefficient alpha
or Cronbah’s alpha is usually used to determine reliability of scale items. The coefficient
varies from 0 to 1, with a value of 0.6 or less generally considered unsatisfactory internal
consistency reliability (Malhotra, 2010). An important feature of Cronbrach’s alpha is that
its value tends to increase with an increase in the number of scale items. Hence, multiple
items measuring a construct tend to improve the reliability.
3.3 Measures
Items for measuring the constructs in this study are based on previous studies. All the
factors in the study were measured with a multi-item measurement scale. Items adapted
from previously validated studies were used either verbatim to preserve its original
meaning or rephrased in an easy-to-understand language. All the constructs were measured
as weighted average of multiple indicators, since they are treated as abstract and theoretical
phenomenon (Andreassen, 1997). In this regard, measurement errors in the index are
compensated for given the quality and quantity of the measures being adopted (Fornell,
1989, cited in Andreassen, 1997). Consequently, customer loyalty, customer satisfaction,
perceived service quality, perceived value, corporate image and switching costs were all
measured with multiple indicators. A description of the measures is presented in preceding
sections.
Page 47
40
3.3.1 Customer loyalty
Theory indicates that enhancing customer retention, or importantly lowering the rate at
which customers defect, is crucial key to the ability of a service provider to generate
meaningful growth (Zeithaml, Berry, and Parasuraman, 1996). Precisely, Zeithaml, Berry,
and Parasuraman (1996) suggestion that favourable behavioural intentions regarding a
service provider will make the customers 1) say positive things about the company, 2)
recommend them to other consumers, 3) remain loyal to them (e.i., engage in repeat
purchase), 4) spend more with the company, and 5) pay price premium.
Based on this reasoning, the five-item scale used by Aydin and Ozer (2005) was adapted to
the Ghanaian telecom sector. Consequently, four items are adapted to measure customer
loyalty to a network provider, with operational measures comprising (1) repurchase
intentions (e.i., I will continue using my primary service provider, and I will still choose
my primary service provider if I had to do it all over again, and (2) willingness to
recommend (i.e., I will recommend my primary service provider to anyone who seeks my
advice). A seven-point Likert-type scale format was used ranging from 1 “strongly
disagree” to 7 “strongly agree.” Internal consistency, i.e., the Cronbach alpha value for
customer loyalty was 0.90, reflecting high construct reliability.
3.3.2 Customer satisfaction
Due to its potential effect on customer behavioural outcomes (e.g., Cronin and Taylor,
1992; Anderson and Sullivan, 1993; Fornell, 1992; Cronin et al., 2000; Oliver, 1980),
customer satisfaction has attracted significant amount of attention in the literature. Rust
and Oliver’s (1994) definition of satisfaction reflects the degree to which a consumer
believes that the possession a product and/or use of a service stimulates positive feelings.
Smith (2007) has suggested that the measurement of satisfaction involves three
psychological elements for the evaluation of the product or service experience: cognitive
(thinking/evaluation), effective (emotional-feeling/like-dislike), and behavioral
(current/future actions). Since satisfaction is described as being an evaluative as well as
emotion-based response to a service experience (Oliver, 1997; Cronin and Taylor, 2000),
this study adopts a similar approach.
Hence, two set of items are used, with the first set reflecting the “evaluative measure,”
which highlights the overall opinion of a consumer’s experience with the service
encounter. This is an appraisal or conclusion that the product or service was useful, fit the
Page 48
41
situation or exceeded the requirements of the situation/problem (Smith, 2007). The second
set of item is the “emotion-based” measure which captures the consumer’s overall
emotional feelings towards a product performance or service encounter. The items were
adapted from Lam et al., (2004), and Malhotra (2010). This factor was scored on a seven-
point Likert-type format ranging from 1 “strongly disagree” to 7 “strongly disagree.” The
Cronbach alpha value for customer satisfaction was 0.86.
3.3.3 Perceived service quality
The service quality construct has been widely conceptualized as a consumer’s appraisal of
a services overall excellence or superiority (e.g., Zeithaml, 1988). Recently, several
empirical studies have adopted this definition. Importantly, the measurement of service
quality (SQ) construct with the expectation-oriented SERQUAL index and/or the
popularized performance based SERVPERF index are congruent with this conceptual
definition (Ranaweera and Neely, 2003). While numerous studies in the services literature
have followed the SERQUAL scale in measuring the SQ construct, this study used specific
items which were perceived as relevant for the industry settings. Notwithstanding, some of
the selected items were informed by the SQ measures. In the current study, perceived
service quality is measured as an attitudinal construct with some performance-based
measures from Cronin, Brady, and Hult (2000) serving as background for the scale
construction.
Prior to the study, an e-mail interview was initiated to identify those items customers
perceived as key elements in their evaluation of service quality. Respondents were asked,
in an open ended fashion, to state “what factors or characteristics of their mobile service
provider do they consider important for using their services.” The pilot exercise was based
on the suggestion by Cronin and Taylor (1992) that scale items that define service quality
in one industry may be different in another. Consistently, factors such as network quality,
network coverage, network connection, voice call quality, quickness in complaint handling
etc. were cited by respondents as among items perceived as critical to service quality
evaluations. These items are consistent with the factors adopted by Lim et al. (2006) in
their conceptualization of mobile service quality. The authors maintained that a
comprehensive set of well-established scales for mobile service quality is nonexistent.
Thus, the exploratory nature of their mobile service quality measure informed the path
adopted in this study. The work by Gerpott et al. (2001) was also consulted in the selection
of industry specific measures.
Page 49
42
While several dimensions were adopted by Lim et al. (2006) to measure mobile service
quality including network quality, billing system, data services etc, this study adopted four
network quality factors (overall network quality, coverage, connection, voice call quality )
as well as four performance-based elements to measure (customer care service, promptness
in complaint handling, ease of access to call center, and service personnel ability to handle
problems) to measure perceived service quality in the mobile service sector. Altogether
eight items measured perceived service quality. These items were also adapted from Lim et
al. (2006) and Gerpott et al. (2001). All the items were scored on a Likert-type scale
format. Using eight (8) items in all, respondents assessed perceived service quality using a
7-point Likert-type scale, anchored from “very bad” (1) to” very good” (7). The internal
validity of perceived service quality, i.e., Cronbach alpha score was 0.82.
3.3.4 Perceived value
Value is conceptualized as consumer’s perception of the subjective worth of some activity
while considering all the net benefits and cost of consumption (Babin et al., 1994;
Zeithaml, 1988). It is the overall benefits/price assessment, i.e., benefits given price. It
reflects consumers’ perceptions of the monetary and the non-monetary sacrifice associated
with the acquisition and use of a service or product (Bei, and Chiao, 2001).
To measure perceived value, respondents were asked to comment on two statements, e.g.,
“my service provider offers good value for money,” and “my service provider offers
overall better pricing plan compared to its competitors.” These measures were adapted
from Lim et al. (2006), Cheng et al. (2008), and Kuo, Wu, and Deng (2009). Both
measures also used 7-point Likert-type scale, anchored at “strongly disagree” (1) to
“strongly agree.” The Cronbach alpha value was 0.84, showing good construct reliability.
3.3.5 Corporate Image
Corporate image is conceptualized as an overall impression held by consumers regarding
the company. In this study, no attempt was made to distinguish between corporate image
and corporate reputation, as both reflects the overall impression that is made on the minds
of the public by the company (e.g., Barich and Kotler, 1991). While there is lack of
consensus on the valid scales for measuring corporate image, in the current study, the
operationalization by Nguyen and LeBlanc (2001) formed the basis for measurement.
Page 50
43
Hence, this construct was measured by adapting four items from Nguyen and LeBlanc
(2001), Aydin and Ozer (2005), and Cheng et al. (2008). For example, respondents were
asked to assess the following statements, “my service provider is innovative and forward
looking,” “my service provider takes social responsibility seriously,” and “my service
provider has a positive image in the minds of consumers.” Similarly all items were
measures also used 7-point Likert-type scale, anchored at “strongly disagree” (1) to
“strongly agree.” The Cronbach alpha value was 0.82, indicating high construct reliability.
3.3.5 Switching costs
For the purpose of this study, switching cost is conceptualized as consumer perception of
the time, money and effort required in changing service providers (Jones, Mothersbaugh,
and Beatty, 2000) Murray (1991) described switching cost as the risks in terms of potential
losses perceived by customers when changing service providers, with such losses including
financial, performance related, social, psychological and safety-related nature. Hence, all
those factors making it more difficult or somewhat costly, in both monetary and
nonmonetary terms, for consumers to change service providers constitute switching cost.
In this regard, perceived switching costs were measured by three items adapted from Jones,
Mothersbaugh, and Beatty (2000) and Wang (2010). Some of the operational measures
include “the cost in time and effort for changing my current service provider will be high
for me,” and “switching to another provider will bring economic loss to me.” All items
were measured on 7-point Likert-type scale, anchored at “strongly disagree” (1) to
“strongly agree.” The Cronbach alpha value was 0.74, indicating fairly strong construct
reliability.
Page 51
44
3.4 Methodological issues
Cross-sectional survey design, while it affords several benefits, including being time
efficient, allowing for quantification of data, comparison between groups, and detailed
analysis of association among factors in a study, could as well be fraught with some
setbacks. Some of the challenges include social desirability bias in responses, lack of
external validity of study results, and inability to claim causality which is only possible
with experimental or causal designs. Cross-sectional design can only make claims of
possible associations among variables.
Particularly, causality cannot be inferred in this study; it cannot be claimed that, in fact, all
the independent variables are actually the cause of customer loyalty among Ghanaian
mobile network subscribers. Based on the research design adopted, it can only be said that
the variables are related. Collecting data at multiple time intervals, and using the same
research participants under controlled experimental conditions would allow for causal
inferences to be made about cause-and-effect imposed by the dimensions. In this case, a
longitudinal study will suffice.
With regards to sampling procedures, data was collected via online route making it rather
difficult, if not impossible, to give a comprehensive account of the nature of respondents
and their setting. No single identifiable group was recruited as research sample. All users
of mobile telecommunication services in Ghana perceived to be internet savvy were
targeted as potential research respondents.
Moreover, no information exists on validity scores in this thesis. Only reliability figures
are reported. This stems from the fact that there were problems with the factor loadings in
terms of discriminant and convergent validity. For example, there was lack of discriminant
validity between customer loyalty and customer satisfaction factors. Items belonging to
both variables converged on one factor. While the rest of items show minimal problems as
far as the loadings were concerned, some items also exhibited cross-loadings, with their
elimination further exacerbating the situation. The expectation is that the validity results
would have been robust with a large sample, hence their exclusion.
Page 52
45
CHAPTER 4
4. RESULTS
In chapter two, the conceptual framework and various hypotheses were advanced in regard
to the anticipated changes in customer loyalty connected to variations in satisfaction,
perceived service quality and the other explanatory variables. Research design issues and
data gathering techniques highlighted in Chapter three. This chapter presents the main
findings of the study by testing each hypothesis in turn.
Page 53
46
4.1 Bivariate Correlations
Table 2 presents the descriptive statistics and the correlations coefficients among study
variables. The results revealed that all the study variables depicted satisfactory and
relatively high associations, with the exception of the relation among switching cost,
customer satisfaction and customer loyalty which were insignificant. Customer loyalty
revealed fairly satisfactory correlations among four factors ranging from (r = .58 to .67).
Also, corporate image correlated strongly with perceive value (r = .69), and perceived
service quality (r = .67). The strong correlation between corporate image, perceived value
and service quality could be explained by the fact that customers who receive better quality
service at competitive prices are likely to have a positive attitude toward a mobile network
carrier. With regards to the demographic variables, a significant negative correlation was
observed between gender and customer satisfaction (r = -.18), and between duration of use
of network provider and perceived value (r = -.20), with the latter open to varied
interpretation such as the idea that short-term users more likely to perceive better value as
they are new to the carrier and have not had the opportunity to be open to the dynamics of
their service offerings.
4.2 Testing Main and mediation effects in multiple regressions
While there are several statistical techniques for testing correlation hypotheses, this study
adopted regression analysis since the emphasis in on testing the strength, direction and
relative importance of each variable while exercising statistical control over some
variables. Also, both the dependent and independent variables are continuous. Moreover,
multiple regression analysis was used for testing mediation. Consumer satisfaction was
treated as a mediator for perceived service quality and perceived value. Mediation is
observed when an intervening variable surface between the time the independent variable
starts operating to influence the dependent variable and the time their impact is felt on
(Hair et al., 2010). Baron and Kenny (1986) outlined the following requirements that must
be met in order to say a mediation relationship exist: (1) a significant effect of regressing
the mediator on the independent variable, (2) a significant effect of regressing the
dependent variable on the independent variable, and (3) while regressing the dependent
variable on both the mediator and the independent variable, the effect of the independent
variable must be weaker than in Equation 2. (Baron and Kenny, 1986, cited in Bei, and
Page 54
47
Chiao, 2001 p.133). Once all these conditions are met, the mediation model is supported.
Baron and Kenny further argued that maximum mediation effect (i.e., full mediation) is
achieved when the independent variable “drops out,” which is to say becomes insignificant
in Equation 3.
The above is presented mathematically below:
Step 1: Regress mediator on the independent variable
Step2: Regress dependent variable on independent variable
Step 3: Regress the dependent variable on both the mediator and the independent variable
In step 3, we confirm that the mediator is a significant predictor of the dependent variable
while controlling for the effect of the independent variable.
eXY 0
eXZ 0
Z = 0
+ 1
X
+ 2
Y
+ e
Page 55
48
Table 2: Means, Standard Deviations, Reliabilities, and Correlation Matrices
Means SD 1 2 3 4 5 6 7 8 9 10 11
1. Customer loyalty 4.53 1.53 0.90
2. Customer satisfaction 4.50 1.53 0.67** 0.86
3. Perceived service quality 5.07 0.85 0.58** 0.55** 0.82
4. Perceived value 4.04 1.67 0.67** 0.56** 0.60** 0.84
5. Corporate image 4.84 1.22 0.60** 0.47** 0.67** 0.69** 0.82
6. Switching cost 3.40 1.38 0.19 0.07 0.18* 0.21* 0.29** 0.74
7. Gender -0.10 -0.18* 0.11 -0.04 -0.02 0.06 __
8. Age 0.07 0.10 -0.06 0.02 -0.02 0.03 -0.04 __
9. Education -0.03 0.06 0.05 0.04 0.16 0.14 -0.10 0.15 __
10. Duration of use
11. Region
-0.15
0.02
-0.16
0.07
-0.00
-0.02
-0.20*
0.01
-0.04
0.02
0.02
0.04
0.12
-0.14
0.29**
-0.04
0.06
-0.05
__
-0.06 __
Note: **p<0.01;*p<0.05, N=140; Chronbach’s alpha coefficients are presented on the diagonal in bold.
Page 56
49
4.3 Determinants of customer loyalty
Multiple regressions were performed to test both main effects and mediation relationships.
In determining the effect of each of the independent variables, customer loyalty was
regressed on measures including customer satisfaction, perceived service quality,
perceived value, corporate image, and switching cost. Specifically, two separate regression
models were estimated. The first model contained the variables customer satisfaction,
corporate image and switching cost. They were used to assess their direct effect on
customer loyalty. In a separate model, customer loyalty was regressed on perceived service
quality and perceived value, with customer satisfaction serving as a mediator. Table 3 is
used to test main effects, whereas table 4 shows results for both direct and mediation
effects.
Table 3: Multiple Regression results for testing Direct effects on Loyalty
Variables Coefficients t-values
Constant - .01
Customer satisfaction
Corporate Image
Switching cost
F-statistic = 52.63**
Adjusted R² = 0.53
.49
.35
.06
7.38**
5.08**
.90
** Significant at p<0.01, N = 140
4.3.1 The effect of customer satisfaction on customer loyalty
Customer satisfaction, together with corporate image and switching cost will be dealt with
under table 3. The results concerning corporate image and switching costs, which are also
contained in table 3 will be discussed in later sections.
Testing of H1: Hypothesis 1 proposes a direct positive effect of customer satisfaction on
customer loyalty. The empirical finding in this model confirms that customer satisfaction
was significant in predicting customer loyalty (F = 52.63, p < 0.01), with the overall model
accounting for 53% of the variance explained. A look at the Beta ( ) coefficients show
that customer satisfaction made the greatest impact in the model, accounted for 49% of the
explained variance. The results suggest that the relationship between customer satisfaction
and customer loyalty is positive and significant for mobile networks services in Ghana.
Page 57
50
Hence, Hypothesis 1 is supported. Previous studies have also reported similar findings
(e.g., Cronin et al. 2000; Gerpott et al. 2001; Kuo et al., 2009; Lim and Parks, 2006).
Table 4: Multiple Regression results for testing Direct and Mediation effects
Independent variables Coefficients t-values
Model 1
Service quality
Perceived value
F- statistic = 39.14**
Adjusted R² = 0.36
Customer Satisfaction
.30
.38
3.52**
4.39**
Model 2
Service quality
Perceived value
F-statistic = 65.18**
Adjusted R² = 0.49
Customer loyalty
.27
.51
3.49**
6.61**
Model 3
Service quality
Perceived value
Customer satisfaction
F-statistic = 61.40**
Adjusted R² = 0.57
Customer loyalty
.16
.37
.37
2.13*
4.90**
5.27**
*signifies p<0.05; ** signifies p<0.01; N = 140
4.3.2 Relationship between perceived service quality, customer satisfaction and
loyalty
The results of the regression equations necessary for testing both main effects and
mediation are shown in Table 4. All conditions required for mediation to hold are present.
As was previously pointed out, the first model regresses customer satisfaction on perceived
service quality, and perceived value. The second model regresses customer loyalty on
perceived service quality, and perceived value. In the last model, customer loyalty is again
regressed on the two independent variables as well as customer satisfaction. All three
models were significant in explaining their respective outcome variables, (F = 39.14, p <
Page 58
51
0.01), (F = 65.18, p < 0.01), and (F = 61.04, p < 0.01) respectively. Again, each model
significantly accounted for 36%, 49%, and 57% respectively of the total variance
explained, measured by the adjusted R2.
Testing H2 and H2b: First, Hypothesis 2b proposes that customers’ perceived service
quality has a positive main effect on customer loyalty. The results of the regression model
2 show that perceived service quality has a direct positive effect on loyalty (t = 3.49,
p<0.01). Perceived service quality accounted for 27% of the explained variance. Hence, H2
is supported. This finding is consistent with prior research where it was concluded that
service quality is antecedent of customer loyalty (Rust and Oliver, 1994)
The second hypothesis (H2b) proposes that first perceived service quality will affect
satisfaction directly and, in turn, affect customer loyalty indirectly through satisfaction. In
model 1, service quality has a significant effect on customer satisfaction (t = 3.52, p<0.01),
and accounted for 30% of the explained variance in loyalty, showing that service quality
has direct positive effect on customer satisfaction. As has already been established, service
quality affected customer loyalty directly (t = 3.49, p<0.01). Yet in model 3, the effect of
service quality on customer loyalty is much less (β = 0.16) than in model 2 (β = 0.27). The
reduction in coefficient values in indication that the influence of service quality on
customer loyalty is partially explained by customer satisfaction. The adjusted R2 has
improved 57% compared to 49% in model 2. While full mediation cannot be claimed as
the beta for perceived service quality in model 3 is still significant (t = 2.13, p<0.05),
mediation effect can still be assumed as the beta value has declined considerably. This
reflects the fact that, when satisfaction is introduced in model 3, the effect of service
quality on customer loyalty reduced considerably, confirming its indirect effect on
customer loyalty.
Putting all three models together, the effect of service quality on both satisfaction and
loyalty is confirmed. First, perceived service quality directly impacts customer loyalty. It
also directly impacts customer satisfaction, and through satisfaction again acts on loyalty).
This is evidenced by the weakened impact of service quality on loyalty through satisfaction
in Model 3. The results imply that perceived service quality has direct effect on both
customer satisfaction and loyalty but at the same time indirect effect on customer loyalty
through customer satisfaction.
Page 59
52
4.3.3 Relationship between perceived value, customer satisfaction and loyalty
Testing H3 and H3b: Similar procedure was used to explain the interaction between
perceived value, customer satisfaction and customer loyalty. First, Hypothesis H3
postulated that perceived value affects customer loyalty positively. The regression equation
shows that this is significant (t = 6.61, p< 0.01) in model 2. In addition, Hypothesis H3b
postulated that perceived value will affect satisfaction directly and, in turn, affect customer
loyalty also through satisfaction. In model 1, it is noted that perceived value has a
significant effect on customer satisfaction (t = 4.39, p<0.01) by accounting for 38% of the
explained variance in loyalty, implying that perceived value has a direct positive effect on
customer satisfaction. Perceived value accounted for slightly larger proportion of
explained variance in customer satisfaction, 38% compared to 30% attributable to
perceived service quality. This finding is consistent with previous findings satisfaction
studies. Turel and Serenko (2006) reported a significant main effect of perceived value on
satisfaction among Canadian mobile phone users.
Moreover, it was observed that perceived value had a direct effect on customer loyalty in
model 2 (t = 6.61, p < 0.01), as well as in model 3 (t = 4.90, p < 0.01). However, by
contrasting models 2 and 3, it is observed that while the beta coefficient of perceived value
is high is model 2 ( β = 0.51), this value reduces substantially when customer satisfaction is
introduced as additional independent variable in model three, weakening the beta
coefficient to ( β = 0.37) in model 3. The reduction in coefficient values is indication that
the influence of perceived value on customer loyalty is partially explained by customer
satisfaction.
Meanwhile, the fact that perceived value is significant (β = 0.37, p < 0.01) in model 2 is
evidence that it has direct effect on customer loyalty. Altogether, the effect of perceived
value on both satisfaction and loyalty are confirmed. That is, first, perceived directly
impacts customer loyalty. Second, perceived value directly impacts customer satisfaction,
and through satisfaction influences customer loyalty. The indirect effect is evidenced by
the reduced impact of perceived value on loyalty through customer satisfaction. The
results imply that perceived value has direct effect on both customer satisfaction and
loyalty, but at the same time indirect effect on customer loyalty through customer
satisfaction. These findings are corroborated by previous reported studies supporting the
claim that perceived value affects customer loyalty directly (e.g., Bei and Chiao, 2006;
Cronin et al., 2000; Turel and Serenko 2006). Support for the results indicating that
Page 60
53
perceived value indirectly affects customer loyalty through satisfaction have also been
reported in the literature (e.g., Chen and Chen, 2010; Turel Serenko, 2006; Kuo et al.,
2009, Yang and Peterson, 2004).
4.3.4 The effect of Corporate Image on customer loyalty
Testing of H4: Hypothesis 4 proposes that corporate image will affect customer loyalty
positively. In table 3, the model reveal that corporate image was a significant predictor of
customer loyalty (F = 52.63, p < 0.01), with the overall model accounting for 53% of the
variance explained. Inspection of the beta ( ) coefficients shows that corporate image
accounted for 35% of the variance in customer loyalty. Hence, Hypothesis 4 is supported.
While several researchers have confirmed that a positive relationshipexist between
corporate image and customer loyalty (e.g., Andreassen and Lindestad, 1994; Ngugen and
LeBlanc, 2001; Boohene and Agyepong, 2011), others including Aydin and Ozer (2005)
have found a lack of association between the two. Based on this study, it can be concluded
that users of mobile phone services consider the reputation or image of the provider as
critical in their choice to remain loyal.
4.3.5 The effect of switching cost on customer loyalty
Testing of H5: Hypothesis 5 postulates that perceived switching costs affect customer
loyalty positively, such that the higher the switching cost the more the likelihood that
mobile phone subscribers will remain loyal. However, results from table 3 reveal that
switching cost was not a significant predictor of customer loyalty ( , p = 0.37).
Hence, Hypothesis 5 is not supported. The findings suggest that customers do not consider
switching cost as a key factor to influence their loyalty intentions and actual behavior. This
implies, in effect, that even if customers should face significant switching costs, they do
not consider such factors to influence their loyalty. This finding is incongruent with a
number of previous studies which has reported significant association between switching
cost and customer loyalty (e.g., Aydin and Ozer, 2005; Cheng, Lai and Yeung, 2008; Liu,
Guo and Lee, 2011). One factor that may explain this situation is the recent
implementation of Mobile Number Portability in Ghana, with the aim of eliminating
switching barriers substantially.
Page 61
54
Table 5: Summary of Hypotheses and Results
Hypothesis Relationship Results
H1 Customer satisfaction has a positive effect on customer loyalty Supported
H2 Perceived service quality has a positive effect on customer loyalty Supported
H2b Perceived service quality has direct positive effect on satisfaction, and
also indirect positive effect on loyalty through satisfaction
Supported
H3 Perceived value has a positive effect on customer loyalty Supported
H3b Perceived value has direct positive effect on satisfaction, and also indirect
positive effect on loyalty through satisfaction.
Supported
H4 Corporate image has a positive effect on customer loyalty Supported
H5 Switching costs has a positive effect on customer loyalty Not
supported
4.4 Customer Perceptions Mobile Number Portability (MNP)
As part of the research aims, this study sort to investigate consumer views of the MNP and
try to understand whether or not they would take advantage of it. The background to this
investigation is due to the expected increase in actual switching behaviour following the
MNP adoption. Hence, respondents were asked to indicate their likelihood of porting (i.e.,
switching) their number from their current service provider to another. The results are
presented in Table 6 below.
Table 6: Results of Mobile Number Portability (MNP) Intentions
# Answer
Response %
1 Very Unlikely
17 12%
2 Unlikely
15 11%
3 Somewhat Unlikely
11 8%
4 Undecided
28 20%
5 Somewhat Likely
24 17%
6 Likely
25 18%
7 Very Likely
22 15%
Total 142 100%
Page 62
55
The results show that with a total of 142 respondents, as much as 33% percent of the
respondents showed a strong propensity to port – represented by the likely and very likely
group, whereas 23% said they were not considering porting their number – represented by
the unlikely and very unlikely group. Also, a greater percentage of respondents (45%)
demonstrated high uncertainty; they are unsure whether or not to port their numbers,
though it was a possibility.
While this data may be scant in representing the actual intentions of the whole population
of mobile phone subscribers, a number of important insights could be drawn from it. Based
on the results, it is assumed that three groups are likely to be present – those with
favourable intentions toward porting, those without porting intentions, and the undecided
group. Those with positive intentions toward porting their original numbers could be
customers who are highly dissatisfied with present levels of service and would want to try
another carrier. They may also be frequent brand switchers demonstrating variety-seeking
behaviour (Hoyer and MacInnis, 2010). It is assumed that Glo Mobile, which launched
operations later part of 2011, may attract a greater percentage of such customers.
On the other hand, customers who are less likely to port to another network carrier are
those who may be loyal customers, or those who feel all the network providers are
basically the same and hence switching might not have a significant impact on their service
experience. Such customers usually feel there are not superior alternatives available and
porting might not make much difference (Han, Kim and Hyun, 2011). As such they may
exhibit low effort into seeking out better alternative. Lastly, the undecided group may be
particular consumers who lack sufficient information about the benefits of MNP, and are
unable to make a firm decision on porting. Inertia and personal indifference may play key
roles (Ranaweera and Neely, 2003) Perceived risk of porting could also undermine their
ability to experiment with the system. Thus, those consumers who would not port or have
less probability of porting may also reflects some of sort of buyer dependence on the
provider since the need to maintain long-term relationship with the service provider is
critical to the overall service experience(Lam et al. 2004). Ultimately, each of these groups
may require critical marketing attention; to either encourage those likely brand switchers to
switch or disincentivize customers from switching. For those customers who are
undecided, it is important to emphasize key brand attributes that make it appropriate to
remain loyal.
Page 63
56
CHAPTER 5
5. DISCUSSION AND CONCLUSION
In the previous chapters, the rationale and objectives of the study were outlined, followed
by theoretical underpinnings of the proposed model and hypothesis development.
Methodological approaches and results of the study have also been reported. In this last
chapter, a detailed discussion of the results, together with implications of the findings for
research and practice will be identified. The concluding part will concentrate on limitations
of the study and direction for future research.
Page 64
57
5.1 Discussion
The findings in this study provides vivid insights into the complex interrelationships
among customer satisfaction, perceived service quality, customer perceived value,
corporate image, switching cost and customer loyalty dimensions. The data was analyzed
using multiple regression analysis. The results generally indicate that while majority of the
factors are significant in their interaction with customer loyalty, switching cost was not
significant. Broadly, the results are discussed in the following sections.
5.1.1 The effect of customer satisfaction on customer loyalty
In this study, it was found that customer satisfaction had a significant positive effect on
customer loyalty. This finding is in support of previous studies (e.g., Anderson and
Sullivan 1993; Anderson, Fornell and Leymann 1994; Cronin et al., 2000; Hutchinson et
al., 2009) that highly satisfied customers maintain deeper loyalty toward their network
service providers. Importantly, the results give credence to the assumption that satisfied
customers are good for service providers than unsatisfied customers. Recently, researchers
investigating the satisfaction-loyalty link within the mobile telecommunication services
sector have also reported similar findings (e.g., Lim and Park, 2006; Gerpott et al. 2001;
Liu et al., 2011; Kuo et al., 2009), that customer satisfaction was a strong predictor of
customer loyalty. For example, Liu et al. (2011) investigating Taiwan’s mobile services
sector indicated that satisfied customers not only had greater propensity to stay with their
network carrier, but also were more willing to recommend them to others.
Clearly, ensuring that mobile network subscribers experience higher levels of satisfaction
will make the firm profitable, overall. The profitability accruing from satisfied customers
stems from the fact that there is higher turnover and replacement cost among less satisfied
customers (Anderson, Fornell, and Leyman, 1994). Moreover, the acquisition cost and the
daunting task of winning over already satisfied customers involved with a competitor
brand makes customer satisfaction a desirable marketing benchmark to aim for.
Importantly, when customers are satisfied with the overall service offering, they are more
likely to be tolerant should there be any unintended service failures. On the contrary,
customers who have repeatedly experienced poor services may not even recognize, or
appreciate it when services are enhanced somewhat. Such categories of customers are easy
targets for competitor brands.
Page 65
58
Given the recent adoption of Mobile Number Portability facility in Ghana, it is very crucial
to emphasize the need for network service providers to concern themselves with higher
levels of customer satisfaction. Brown and Gulycz (2002) recognized that satisfaction
should be viewed as an important competitive weapon as traditional approaches to
differentiation such as product/service features, pricing and distribution strategies were
inadequate. Mobile carriers in Ghana will win the battle for customer mind and wallet
space if they place much emphasis on making customers satisfied with their offerings.
Boohene and Agyapong (2011) argued that, while mobile phone users in Ghana were
generally dissatisfied, they continued their relationship with their primary service provider.
Such negative association is widely reported in the popular media in Ghana where majority
of customers complain about their displeasure with levels of services quality, yet are
unable to do anything due to lack of attractive alternatives. However, the fierce
competition among the players has injected some sanity into the mobile services sector,
with record improvements in service quality levels, which has resulted in some
improvement in customer satisfaction. Overall, this study has shown that improvement in
customer satisfaction affects customer loyalty positively. And since service quality is
widely considered as antecedent of customer satisfaction, and invariably affecting
customer loyalty, it is necessary to report on the quality-satisfaction-loyalty linkages.
5.1.2 The direct and indirect influence of Perceived Service Quality
It was anticipated that perceived service quality will affect customer loyalty directly and
indirectly through customer loyalty. The results demonstrate that, in fact, perceived service
quality has direct as well as indirect effect through customer satisfaction on customer
loyalty in Ghana’s mobile services sector. The result is consistent with previous findings
that perceived service quality is a key determinant of customer satisfaction (Cronin and
Taylor, 1992; Reichheld and Sasser, 1990; Cronin et al., 2000; Kim et al., 2004, Lim et al.,
2006; Santouridis and Trivellas, 2010; Wang et al., 2004). The results also show that the
effect of perceived service quality on customer loyalty can be direct, which is well
documented in the services literature (Parasuraman, Zeithaml, and Berry 1991; Rust and
Oliver, 1994; Aydin and Ozer, 2005), but also indirectly through customer satisfaction
(Caruana, 2002; Cronin et al., 2000; Turel and Serenko, 2006). Essentially, this suggests
that the degree of service quality is an important determinant of a person’s satisfaction with
Page 66
59
mobiles services; satisfaction, in turn, determines whether or not a person will be
committed to a service relationship. It is mostly the case that highly satisfied customers
tend to demonstrate higher propensity to repeat purchase and higher tolerance for price
increases by their service providers, or price decreases by competitors (Turel and Serenko,
2006). Again, service quality, which is shown to directly affect loyalty, is underpinned by
the assumption that when the level of quality is high, such as better network quality, better
call and voice quality, uninterrupted connection call, excellent customer service, call center
responsiveness, etc., as is characteristic of mobile network services, customer will
demonstrate greater likelihood to remain loyal with a network carrier and give positive
word of mouth about their experience to others (Venetis and Ghauri, 2000). This suggests
that boosting customer loyalty is determined, to a greater extent, by network providers
promoting the highest standards of service quality possible.
Given the mediating influence of customer satisfaction on customer loyalty, the effect of
service quality is thus reduced considerably. This implies that perceived service quality is
better able to affect customer loyalty substantially when customers are satisfied. As such, it
is concluded that network providers seeking to improve customer loyalty should, first and
foremost, boost customer satisfaction, as it invariably affects loyalty. This study contrast
conclusions by Boohene and Agyepong (2011), also studying the Ghanaian mobile
services sector that perceived service quality cannot be mediated by customer satisfaction
to influence customer loyalty. It has been demonstrated that, in fact, in the face of customer
satisfaction, perceived service quality is a significant predictor of customer loyalty. Cronin
et al. (2000) suggested that service quality would directly and indirectly lead to favourable
behavioural intentions simultaneously. As such, both service quality and satisfaction
should be treated as not mutually exclusive in attempts to enhancing customer loyalty.
Rather than focusing on service quality alone, this study indicates that it is important to lay
emphasis on the role of customer satisfaction in customer loyalty improvements
mechanisms. Improvements is service quality is good for the firm as it affects consumer
behavior outcomes, overall (Parasuraman, Zeithaml, and Berry 1991; Rust and Oliver,
1994). However, given the subjective nature of customer satisfaction, it becomes even
more important to ensure that customers’ overall experience with the firm, ranging from
every aspect of a company’s offerings - quality of customer care, advertising, service
features(e.g., network quality, coverage, connection, voice call quality), reliability etc. are
all in harmony.
Page 67
60
Since customer satisfaction is the aggregation of a series of customer experiences, Mayer
and Schwager (2007) suggest that it is important that such experiences are
decompartmentalized into its component experiences to understand customer satisfaction,
as a great deal of customer experiences are not the direct consequences of the brand’s
message or the actual company’s offerings. Rather, it derives from the totality of
customer’s prior experiences and expectations, which should be monitored and
investigated in an ongoing basis (Mayer and Schwager , 2007). As such, all direct contacts
including purchase and use of services initiated by the customer, as well as indirect
contacts involving unintended encounters with brand or service representatives which takes
the form of word-of-mouth recommendations, or complaints, advertisement, media reports
etc., should be monitored, kept in balance and linked to growth targets.
In sum, this study has shown the important role perceived quality and customer
satisfaction play in determining customer loyalty. Specifically, the study has demonstrated
that perceived service quality is an important driver of customer satisfaction. Second, it is
confirmed that while service quality affects customer loyalty directly, such effect is
strengthened when customer satisfaction is present. As such customer satisfaction should
be occupy center stage when designing strategies for promoting customer loyalty.
5.1.3 The direct and indirect influence of Perceived Value
It was anticipated that perceived value will have a direct positive effect on customer
loyalty, as well as an indirect positive effect on customer loyalty via customer satisfaction
(e.i., a mediator effect). The analysis show that, indeed, perceived value has direct
influence on customer loyalty. Likewise, the study confirms that perceived value is
partially mediated my customer satisfaction to influence customer loyalty among mobile
service consumers in Ghana. This suggests that customer perceived value affects customer
satisfaction, and customer satisfaction affects customer loyalty.
The revelation that perceived value directly influences customer loyalty is widely
confirmed (Anderson and Srinivasan, 2003; Cronin et al., 2000; McDougall and Levesque,
2000; Lam et al., 2009) in the services literature. The findings emphasize the view that
customers who feel they receive high-value services (i.e., quality services at reasonable
prices) are more likely to repeat patronizing the service provider, and also to recommend
the service provider to other customers. This is particularly true for the
Page 68
61
telecommunications sector where cutthroat competition is rampant and key differentiator is
price. Telecom players who are able to offer quality services at relatively better prices
stand the chance to win the patronage of consumers. Within the context of Ghana’s mobile
network services sector, high-value offering is of great essence, given that consumers have
the ability to increase their usage of a particular network provider due to multiple
subscriptions, and the seeming ease of switching to another provider under the Mobile
Number Portability facility. Obviously, customers have greater propensity to repurchase
and recommend network service provider to others if the offering is considered “value for
money.” Kuo et al. (2009) concluded that telecom brands should give priority to
improvements in perceived value when they seek to enhance customer loyalty. This should
be achieved by evaluating to what extent consumers feel certain aspects of the service
gives better value than it costs, and the reasonableness of its prices relative to competition.
In addition, the findings confirm the mediating role of customer satisfaction in the effect of
customer perceived value on customer loyalty. The results show that customer perceived
value is partially mediated by satisfaction to influence loyalty. However, the mediation
effect by satisfaction in the value-loyalty link is not as pronounced as it was in the service
quality-loyalty link. This suggests that the effect of customer perceived value on customer
loyalty was not weakened substantially in the presence of customer satisfaction. Prior
studies have demonstrated a positive relationship between customer perceived value and
satisfaction (Turel and Serenko, 2006; Lam et al., 2009). The indirect relationship between
perceive value and customer loyalty via satisfaction have also been confirmed in prior
studies (Chen and Chen, 2010; Cronin et al., 2000; Bei and Chiao, 2006; Yang and
Peterson, 2004).
Thus, consumers in this mobile network services context are driven more by the high-value
these service providers offer. While service quality is generally perceived to be an
important driver of customer loyalty, perceived value seems to contribute the greatest
impact. Within developing countries context, telecommunications network service
attributes such as network coverage, network connection, network quality, call quality,
customer service etc. are critical to consumption decisions. Pricing also appears to be very
essential in determining the extent of consumers’ willingness to do business with a
particular service provider over the long haul. It seems appropriate to suggest that service
providers who are able to offer competitive pricing stand the chance to win customer over.
Page 69
62
In addition, these results imply that the relative importance of perceived value on customer
loyalty is recognized via the mediating effect of customer satisfaction in the mobile
network services context. According to Lam et al. (2009), prior studies have not formally
or thoroughly accounted for this mediating role, which is particularly true for the mobile
services sector. By using the well-established attitudinal framework of cognition →
affect→ behavioural intent or behavior, a theoretical justification for this role is provided,
by labeling perceived value as cognition, customer satisfaction as affect, and customer
loyalty as behavior (or the tendency to behave favourably toward as service provider).
In sum, unlike service quality, perceived value contributed significantly greater impact on
customer loyalty and satisfaction. The mediation effect on perceived value was also not
substantial. This implies that perceived value explains customer satisfaction and loyalty
better than service quality. It appears customers are not only driven by perceived value but
also their satisfaction (affect) of a service provider when deciding to be committed to a
service relationship. Hence, customer who perceive greater value and are highly satisfied
are more likely to remain loyal than those who do not. For the purpose of enhancing
customer loyalty, it is necessary to track changes in both customer satisfaction and
perceived value, as customer satisfaction does not fully mediate the impact of perceived
value on customer loyalty.
5.1.4 The effect of corporate image on customer loyalty
Corporate image has long been considered a key driver of customer loyalty within the
services industry, with no exception to the mobile services sector (e.g., Aydin and Ozer,
2005). This study posited that corporate image will influence customer loyalty positively.
The results confirmed the assumption that strong loyalty to mobile service providers was
likely to the extent that service providers maintained strong, favourable, and unique
corporate image. Several other studies have found justification for this notion (Andreassen
and Lindestad (1998, Bloemer, de Ruyter and Peeters, 1998; Ngugen and LeBlanc, 1998;
Wang, 2010).
In the mobile network services sector, corporate image is shown to influence customer
loyalty directly (Aydin and Ozer, 2005; Boohene and Agyepong, 2011; Ogwo and Igwe,
2012). Thus, the results point to the fact that there is a significant positive relationship
between mobile network service providers’ image or reputation, and customers’ intention
to provide positive word-of-mouth and stay connected to mobile services in Ghana. This
Page 70
63
suggests that building strong, favourable and unique brand image or reputation by way of
corporate social responsibility investments, marketing promotions, quality advertisements,
events, sponsorships etc. are critical to sustaining customer loyalty. Moreover, given that
corporate image is the subjective representation about an organization and its behaviour
(Treadwell and Harrison, 1994), it is crucial that every aspect of mobile services
companies performance in areas such as company’s products and services, management
quality, communication activities, corporate philanthropy etc. are monitored and
influenced on day to day basis (Wan and Schell, 2007).
Building strong corporate image necessary to affect customer loyalty requires feeding the
public with all vital information cues such as the impression of quality communicated by
each service employee as they interact with the firms’ clients. Thus, corporate image
formation sources by the public are numerous. Aydin and Ozer (2005) noted that since
consumers may be limited in terms of all relevant information in forming complete image
about a firm, they may rely on various information cues from different sources, particularly
advertisement and word of mouth. Hence, establishing constant monitoring and feedback
processes will guide the company to deeply understand what factors customers consider
important in shaping corporate image formation. However subjective corporate image
process may be, better engagement with the public should be top priority if mobile service
providers wish to influence loyalty through corporate image.
Others have, however, found that the interaction between corporate image and customer
loyalty may be further influenced by factors such as customer satisfaction and switching
cost. For example, Hart and Rosenberg (2004) reported that the effect of corporate image
on customer loyalty was “marginally significant,” but this effect is substantially mediated
by customer satisfaction. In another instance, Wang (2010) demonstrated that the effect of
corporate image on customer loyalty depended on switching cost, such that higher
switching cost mitigated the influence of corporate image on loyalty, suggesting that when
customers perceive considerable switching barriers, e.g., promotions, they may be less
inclined to be influenced by corporate image. Given that several factors influence
corporate image formation, brand building efforts should be frequent, and focus on all
aspects of the company’s performance and activities that consumers perceive as critical in
influencing their impressions about the mobile services provider, and loyalty, thereby.
Page 71
64
5.1.5 The effect of switching costs on customer loyalty
Switching costs was hypothesized to have direct positive effect on customer loyalty. The
results did not support this hypothesis. It was found that switching cost was insignificant in
predicting customer loyalty within Ghana’s mobile network services sector. The results
suggest that customer do not perceive barriers in switching to another network provider.
This result is inconsistent with other reported findings that switching costs determines
customer loyalty (Fornell, 1992; Klemperer, 1987; Seo et al., 2008). Aydin and Ozer
(2005), Cheng, Lai and Yeung (2008), Liu, Guo and Lee (2011), all investigating the
mobile network services sector found direct positive effect of switching costs on customer
loyalty.
Others have also treated switching costs as a mediator/moderator in explaining customer
loyalty. For example, Wang (2010) reported that the effect of customer value and corporate
image on customer loyalty was mitigated under conditions of higher switching costs. Yet
Kim et al. (2004) found that switching costs had direct as well as interaction effect with
customer satisfaction to influence loyalty, suggesting that customer’s showed greater
propensity to stay loyal to a service provider despite being dissatisfied, especially when
perceived switching costs were high.
The assumption that higher switching costs may force customers to remain locked up with
their service companies is not entirely obvious in this study. As demonstrated by the results
perceived switching costs does not encourage customer loyalty in mobile network services
sector in Ghana. This may be explained by the fact that, first, network consumers normally
maintain multiple subscriptions, such that one person may sometimes have two or three
subscriptions to compensate for the network deficiencies or perceived benefits a particular
carrier may possess. For example, a mobile subscriber who rates network coverage as a
favourable attribute will subscribe to MTN since they lead the market in that regard, but at
the same time subscribe to a second provider such as Vodafone Ghana on account of better
price offers. Second, given the implementation of the Mobile Number Portability facility,
customers are emboldened to switch freely should they consider a network provider less
attractive. With the implementation of the MNP, mobile network providers in Ghana as
well as the National Communication Authority have reported increased activity of
customers wanting to switch from one network provider to the other. These two factors
may explain why respondents do not consider switching costs as a driver of customer
loyalty.
Page 72
65
Notwithstanding, the email interviews which launched this study suggests that, overall,
many customer do perceive some factors such as network coverage, price promotions,
length of subscription, corporate image etc. as barriers to switching. Yet others did not
perceive any switching barriers, and instead argued that there were no suitable alternative
to their current subscription. Han, Kim and Hyun (2011) noted that when customers
perceive alternative service providers as not good enough or similar to their existing
service providers, they are less likely to switch. Therefore, the lack of superior alternatives
or no significant perceived differences among alternative brands may induce positive
liking for the existing service provider.
While switching cost may not be a particularly favourable approach to inducing customer
loyalty due to it being insignificant in this study, some factors cited as critical to
encouraging customer lock-in are worth considering. Given the aggressive nature
competition among network providers to attract and retain customers, price is viewed as a
key weapon. Frequent price promotions and loyalty benefits may be used to disincentivize
subscribers who may wish to switch. Jones, Mothersbaugh and Betty (2000) have also
noted that relationship specific investments which create customer dependence may be
used to erect switching barriers. In mobile network services setting, frequent customer
engagement with the service center is considered critical to the overall service experience.
Such processes should be monitored and improved to further lock customers in the service
relationship. Hence, service personnel should be adequately trained and equipped with the
relevant skill set to demonstrate high professionalism, promptness in dealing with customer
complaints, preparedness in handling customer queries etc. Such actions will enhance
service personnel-customer interactions and, consequently, promote positive customer
attitudes.
5.2 Assumptions on Mobile Number Portability (MNP)
As recap, three consumer groups were identified in regard to their intentions toward
Mobile Number Portability. The first group comprised those who had greater propensity to
port their numbers. The second group was less likely to port their numbers, with the third
category showing little interest in MNP. The latter group was classified as undecided. The
assumption is that each of these groups show different attitudes toward MNP, and hence
may require idiosyncratic marketing strategies to either win them over or keep them loyal.
Overall, telecom players that promise innovative products and service solutions, better
Page 73
66
service quality, high-value added services, better pricing, exceptional customer service etc.
will be able to hedge themselves against incessant inducement from competitors. New
entrants and follower brands may target likely brand switchers to improve their subscriber
base and hence their chances of survival. For leading brands, it is equally important that
they avoid unnecessary customer losses by improving on areas that are core to their brand
equity. Critical attributes such as network coverage, connectivity, call quality, better
pricing, innovative products and service solutions, strong brand image, social investments,
customer service excellence etc. should form the basis of all marketing activities. Telecom
players which are able to lead in these areas will gain considerably given the increased
customer switching that has characterized the market place following MNP roll out.
MNP offers all players within the industry an opportunity to offer improved service
delivery and better choice set. Customers will ultimately benefit from this system as it
forces phone operators to offer their best least they lose significant market share, or
reduced service patronage (Shin, 2006). Yet, multiple subscriptions could be a major factor
that may mask the true effect of MNP. It is possible to suggest that customers who show no
interest at all at porting may be dual customers. In this case, they are able to compensate
for the lapses in one network with the perceived advantages in the other. In sum,
companies can target all three customer groups identified in this study with appropriate
marketing action. In the end, those telecom players able to offer better value will be able to
capture likely brand switchers, and sustain their market share.
5.3 Managerial Implications
The findings of this study provide useful guidelines for management and employees of
mobile services providers, particularly brand managers, and marketing communication
practitioners in understanding key drivers of customer loyalty. Such guidelines will help
drive marketing performance in areas necessary to attract new customers and retain
existing once in a fiercely competitive business landscape such as the telecommunications
sector in Ghana.
In the first place, the results have shown that satisfied customers will remain loyal with
their network services provider. Hence, brand building executives must ensure that
customer satisfaction levels are closely monitored through interviews and focus group
Page 74
67
discussions (qualitative approaches) as well as periodic surveys (quantitative approaches)
to gauge satisfaction/dissatisfactions levels. In dialogue with customers, management and
employees should strive to understand customer expectations and attempt to exceed those
expectations. Beyond the core services, customers expect to be treated respectfully and in
friendly manner. Customers should be made to believe that the company has their best
interest at heart.
In addition, the findings have shown that perceived service quality affects customer loyalty
directly, but this direct effect is also mediated by customer satisfaction. This indicates that
brand managers should focus their attention on the influence of service quality on customer
loyalty in tandem with satisfaction. The results indicate that even though there is a direct
positive relationship between service quality and loyalty, other intermediate determinants
need attention too. Just focusing on service quality may result in alienating other important
drivers of customer loyalty in the equation. Looking at the individual dimensions of service
quality, it is obvious that mobile carriers should place particular emphasis on improving
their network (i.e. coverage, connection, voice call, and overall network quality) as well as
empowering service personnel to deal with complaints promptly, and demonstrate
professional competence at handling issues. Access to customer service centers should also
be hassle free, and within reach.
A third managerial implication is that customer perceived value should be boosted as
affects customer satisfaction and loyalty greatly. This study has shown that what customer
give up, i.e., the price they pay for the services they receive have strong bearing on loyalty.
Thus, brand executives must ensure that they give customers good value for the money
they pay. Customers seem to be pleased with a network carrier that offer value added
services such as free data allowance, talk time or tariff bonus, and other features that are
not originally contained in the service price. When customer receive better value for their
subscription, they become satisfied, which in turn determines their willingness to offer
favourable word of mouth and continue patronizing the service providers’ offering.
Importantly, the study indicates that perceived value rather than service quality contributes
the greatest impact on customer loyalty, even in the face of customer satisfaction. This
implies that mobile phone users’ customers regard monetary sacrifice (price) as a key
driver of their loyalty. Marketing executives should constantly scan their environments to
counter the effect of competitors pricing strategies through retaliatory pricing.
Page 75
68
Fourth, the findings show that corporate image affects customer loyalty positively.
Customers are more inclined to remain loyalty to a network carrier which is has a strong
image or reputation in the market. And corporate image creation touches on various
aspects of the corporation ranging from management quality, advertising, price
promotions, and sponsorships to social philanthropy (Keller, 2008). Management should
endeavor to continue investing in key areas that will generate favourable impressions in the
public’s mind. Since image is subjective, and one area that has direct bearing on the
company’s image is the quality of products or services of the company, it is essential that
brand executives monitor corporate image improvements in relation to service quality
dimensions. Employee orientation, especially customer service personnel, should attract
critical attention as customer ongoing engagement with the mobile career has a significant
effect on their overall experience with the service provider. Any negative experience with
service personnel will ruin customers’ attitudes and cognition, which in turn, may affect
their image of the network provider. Continuous monitoring and improvements in sources
of brand image and reputation will have direct effect on customer loyalty.
Finally, caution should be exercised in regard to the impact of switching costs on customer
loyalty. The findings reveal that switching costs does not affect customer loyalty. While
this finding may hold true, brand executives should interpret it in the light of the prevailing
market conditions. With the Mobile Number Portability in place, some barriers to
switching has somewhat been mitigated. Secondly, given that a significant number of
customers hold multiple subscriptions of different mobile carriers, barriers that may have
been posed by a competitor may, in fact, be reduced by the customer himself. When a
customer holds two subscriptions, he or she compensates for the weaknesses in either
carrier by straddling between services. Notwithstanding, brand managers may attempt
locking customers into their platform by making improvements in customer engagement
activities, which has the potential to create barriers to switching. Overall, strong corporate
image, better service offerings, extraordinary customer care etc. has the potential to erect
switching barriers.
Brands, particularly follower brands, which have registered significant customer defection
through MNP should continuously and critically examine factors causing such losses and
curb it. MNP has come to stay and it is important that network carriers feature it
prominently in their marketing strategy to prevent any negative effect.
Page 76
69
Theoretically, this study has shed light on various ways of measuring perceived service
quality. Essentially, the study demonstrates the necessity to tailor measurement items to
suit the research setting. So the case of this research items unique to the industry such as
mobile network factors, and key service performance variables were used. Additionally,
our understanding of the effect of factors including perceived value, satisfaction, corporate
image and switching costs have been extended, particularly within a developing country
context.
5.4 Limitations and future research recommendations
All research is beset with limitations, and this study is no exception. First, given the cross-
sectional nature of the study, with results relating to only the respondents in this study,
generalizations to a broader population or sector should be done with caution. Also, the
regional distribution of the sample is uneven, with the greater Accra region representing
the largest respondents. This may undermine the true state of affairs in terms of how each
region rates the telecom brands on particular attributes. For example, a region that is
lacking in network coverage may rate it highly, whereas another may rate customer service
favourably. This needs to be balanced in future research. The sample size is also not large
enough, though adequate for the type of analysis carried out. The sample size could have
been expanded to ensure that each network carrier’s brand was fairly represented by
respondents. The online data gathering process may have alienated several respondents,
especially those who are not IT savvy. However, the online survey approach proved
suitable due to time and geographical constraints.
Furthermore, this study, as is characteristic of many reported researches, aggregated
responses across all telecom players. This may not reveal the true performance of
individual players. Future studies may benefit from examining each mobile carrier by
grouping responses according to customers’ network subscription and, possibly, compare
them along study variables, to determine how their market share compares with crucial
marketing attributes.
While the study has made key inputs into Mobile Number Portability intentions, large data
set may be necessary to provide robust results, conclusions and recommendations. Future
research could look at developing a model specifically dealing with MNP. Importantly,
Page 77
70
researchers could also look into actual porting behaviour and link it with variables such as
satisfaction and loyalty – whether customers have actually ported their original numbers,
what factors prompted such behaviour, assess their satisfaction levels, and how this
behaviour affects their loyalty.
5.5 Conclusion
In the wake of the Mobile Number Portability enactment, and weakening market growth
rate of the mobile network service sectors in Ghana, acquiring new customers and retaining
existing ones has become both costly and extremely difficult in terms of marketing for
mobile operators. With subscriber numbers at its highest, and six players scrambling to
either protect their market base, or win over competitors’ customers, the industry-wide
belief that “the best core marketing strategy for the future is try to retain existing customers
by heightening customer loyalty and customer value” (Kim et al., 2004, p. 146) couldn’t be
far from the truth in the case of Ghana. And in market conditions such as this, price has
usually been a competitive weapon. Competitive pricing, which may work for a while,
normally hurt industry-wide profitability.
As evidenced in this study, perceived (value for money) made considerable impact on
customer satisfaction and loyalty. Yet, it is important for operators to decrease customers’
price sensitivity. This may be difficult, particularly in a developing economy.
Nevertheless, key drivers such as perceived service quality, positive corporate image, and
perceived switching costs can help strengthen loyalty and decrease sensitivity to price
(Aydin and Ozer, 2005). Though lower pricing may hurt industry-wide profitability and
growth, it still remains probably the most important decision criteria for mobile network
consumers, particularly in developing nations. Yet, it still remains a great challenge for
Telecom players to differentiate themselves on key attributes such as service quality,
image and satisfaction (Keller, 2008). Differentiation of services and guaranteed service
quality will remain game changers. Mobile carriers which are able to differentiate their
offerings, offer better quality and high-value added services will not only keep customers
pleased instead they will keep them for good. Mobile carriers that are able to endow their
brand with critical attributes perceived by consumers as choice factors will enhance their
attractiveness and fortify themselves from increased subscriber losses.
Page 78
71
6. REFERENCES
Anderson, E.W., Fornell, C. & Leymann, D.R. (1994). Customer satisfaction, Market share
and Profitability: Findings from Sweden. Journal of Marketing, 58(July), 53-66.
Andaleeb, S. S. (1996). An Experimental Investigation of Satisfaction and Commitment in
Marketing Channels: The Role of Trust and Dependence, Journal of Retailing, 72
(1), 77-93.
Andreassen, T.W., & Lindestad, B. (1998). The effect of corporate image in the formation
of customer loyalty. Journal of Service Research, 1(1), 82-92.
Andreassen, T. W. (1998). Customer loyalty and complex services: The impact of
corporate image on quality, customer satisfaction and loyalty for customers with
varying degrees of service expertise. International Journal of Service Industry
Management, 9 (1), 7-23.
Anderson, E. & Sullivan, M. (1993), The Antecedents and Conse-quences of Customer
Satisfaction For Firms, Marketing Science, 12 (Spring), 125-143.
Anderson, R.E., & Srinivasan, S.S. (2003). E-satisfaction and e-loyalty: a contingency
framework, Psychology & Marketing 20(2), 123–138.
Athanassopoulos, A.D. & Iliakopoulos, A. (2003). Modeling Customer satisfaction in
telecommunications: Assessing the effects of multiple transactions points on the
perceived overall performance of the provider. Production and Operation
Management, 12, 224-245.
Aydin, S., & Ozer, G. (2005). The analysis of antecedents of customer loyalty in the
Turkish mobile telecommunication market, European Journal of Marketing, 39(7),
910-925.
Bagozzi, R. P. (1992). The Self-Regulation of Attitudes, Intentions, and Behavior, Social
Psychology Quarterly 55, 178-204.
Barich, H., & Kotler, P. (1991). A framework for marketing image management. Sloan
Management Review, 32(2), 94-104.
Page 79
72
Baron, R. M., & Kenny, D. A. (1986). The moderator-mediator variable distinction in
social psychological research: Conceptual, strategic, and statistical considerations.
Journal of Personality and Social Psychology, 51(6), 1173-1182.
Baloglu, S. (February, 2002). Dimensions of Customer loyalty: Separating friends from
well-wishers. Cornell Hotel and Restaurant Administration Quarterly, 43 (1), 47-59.
Beerli, A., Martin, J.D., & Quintana, A. (2004). A model of customer loyalty in the retail
banking market. European Journal of Marketing, 38(1/2), 253-275.
Bei, L. T., & Chiao, Y. C. (2001). An integrated model for the effects of perceived
product, perceived service quality, and perceived price fairness on consumer
satisfaction and loyalty. Journal of Consumer Satisfaction, Dissatisfaction and
Complaining Behavior, 14, 125-140.
Berry, L.L. (1980). Services Marketing is Different, Business, 30 (May – June), 24-28.
Bitner, M.J. (1990). Evaluating Service Encounters: The effects of physical surroundings
and employee responses, Journal of Marketing, 56(April), 69 – 81.
Brady, M.K., & Cronin, J.J. (2001). Some new thoughts on conceptualizing perceived
service quality: A hierarchical approach, Journal of Marketing, 65(3), 34-49.
Boohene, R. & Agyapong, G.K.Q. (2011). Analysis of the antecedents of customer loyalty
of Telecommunication Industry in Ghana: The case of Vodafone (Ghana).
International Business Research, 4 (1), 229-240.
Bolton, R. N., & Drew, J.H. (1992). Mitigating the Effect of Service Encounters,
Marketing Letters, 3 (1), 57-70.
Bowen, J.T., & Shoemaker, S. (1998). Loyalty: A strategic commitment. Cornell and
Hotel Restaurant Administrative Quarterly, 39(1),12-25.
Brodie, R.J., Whittome, J.R.M., & Brush, G.J. (2009). Investigating the service brand: A
customer value perspective, Journal of Business Research, 62(3), 345-355.
Brown , S.A. and Gulycz, M. (2002) Performance Driven CRM: How to make your
customer relationship management visions a reality. John Wiley: Ontario.
Page 80
73
Bloemer, J., Ruyter, K. D., & Peeters, P. (1998). Investigating drivers of bank loyalty: the
complex relationship between image, service quality and satisfaction. International
Journal of Bank Marketing, 16(7), 276-286.
Caruana, A. (2002). The effects of service quality and the mediating role of customer
satisfaction, European Journal of Marketing, 36(7/8), 811-828.
Chae, M., Kim, J., Kim, H., and Ryu, H. (2002). Information quality for mobile internet
services: A theoretical model with empirical validation. Electronic Markets, 12(1),
38-46
Cheng, T., Lai, L., & Yeung, A. (2008). The driving forces of customer loyalty: a study of
internet service providers in Hong Kong. International Journal of E-business
Research, 4(4), 26-42.
Chen, C.F., & Chen, F.S. (2010). Experience quality, perceived value, satisfaction and
behavioural intentions for heritage tourists. Tourism management, 31, 29-35.
Choi, S.K., Lee, M.H. & Chung, G.H. (2001). Competition in Korean Mobile
Telecommunication Market: Business Strategy and Regulatory Environment.
Telecommunication Policy, 25 (1-2), 125-138.
Cook, T, D. & Campbell, D. T. (1979). Quasi- Experimentation: Design and Analysisf or
Field Settings. Boston: Houghton Mifflin and Company.
Cretu, A.E., & Brodie, R.J. (2007). The influence of Brand Image and Corporate
Reputation Where Manufacturers Market to Small Firms: A Customer Value
Perspective, Industrial Marketing Management, 36(2), 230-240.
Cronin, J.J., & Taylor, S.A. (1992). Measuring service quality: A re-examination and
extension. Journal of Marketing, 56(3), 55-68.
Cronin, J.J., Brady, M.K., & Hult, G.T.M. (2000). Assessing the effects of quality, value
and customer satisfaction on customer behavioural intentions in service
environments. Journal of Retailing, 76(2), 193-218.
Day, G.S. (1990). Market driven strategy: Processes for creating value. Free Press: New
York.
Page 81
74
Deng, Z., Lu, Y., Wei, K. K., & Zhang, J. (2009). Understanding customer satisfaction and
loyalty: An empirical study of mobile instant messages in China.
International Journal of Information Management, 30, 289-300.
Dick, A.S., & Basu, K. (1994). Customer loyalty: Toward an integrated conceptual
framework. Journal of the Academy of Marketing Science, 22, 99-113.
Eshghi, A., Haughton, D., & Topi, H. (2007). Determinants of customer loyalty in the
wireless telecommunication industry. Telecommunication Policy, 31, 93-106.
Fornell, C. (1992). “A National Customer Satisfaction Barometer: The Swedish
Experience.” Journal of Marketing, 55 (January), 1-21.
Fornell, C., Johnson, M.D., Anderson, E.W., Cha, J., & Bryant, B.E. (1996) The America
customer satisfaction index: Nature, purpose, and findings. Journal of Marketing,
60(4), 7-18.
Fishbein, M., & Ajzen, I. (1975). Belief, attitude, intention, and behavior. Reading, MA:
AddisonWesley.
Frempong, G. (2005). Research support for Policy formulation and Private sector
development: The Case of Ghana. Presented at Accra Roundtable on Public Sector,
July (PowerPoint Presentation).
Frempong, G.K. (2007). 2007 Telecommunication sector performance review: A supply
side analysis of policy outcomes. Science and Technology Policy Research Institute,
Accra Ghana. Retrieved on 25th Nov. 2011 from: www.researchictafrica.net.
Frempong, G. (2010). Ghana ICT Sector Performance Review 2009/2010. Towards
Evidence-based ICT Policy and Regulation, Vol. 2, Policy Paper 8, 2010.
Garvin, D. A. (1988). Managing quality: The strategic and competitive edge. New York:
Free Press.
Gerpott, T.J., Rams, W., & Schindler, A. (2001). Customer retention, loyalty, and
satisfaction in the German mobile cellular telecommunication market.
Telecommunication Policy, 25, 249-269.
Page 82
75
Gotlieb, J.B., Grewal,D., & Brown, S.W. (1994). Consumer Satisfaction and Perceived
Quality: Complementary or Divergent Constructs? Journal of Applied Psychology 79
(6): 875-885.
Gronroos, C. (1984). A Service Quality Model and its Implications, European Journal of
Marketing, 18(4), 36 – 44.
Gronroos, C. (1988). New Competition of the Service Economy: The Five Rules of Service
International Journal of Operations & Production Management, 8, 9–19
Gronroos, C. (2007). In Search of a New Logic for Marketing, Wiley, Chichester.
Haggarty, L., Shirley, M.M., & Wallsten, S. (2002). Telecommunication Reform in Ghana.
Policy Research Working Paper, World Bank.
Han, H., Kim, W., & Hyun, S.S. (2011). Switching intention model development: Role of
service performance, customer satisfaction, and switching barriers in the hotel
industry. International Journal of Hospitality Management, 30, 619-629.
Hallowell, R. (1996). The relationship of customer satisfaction, customer loyalty and
profitability: An empirical study. International Journal of Service Industry
Management, 7 (4), 27-42.
Hauser, J.R., & Shugan, M. (1983). Defensive Marketing strategies, Marketing Science,
2(Fall), 319-360.
Holbrook, M. B. (1994). The Nature of Customer Value: An Axiology of Services in the
Consumption Experience, In Service Quality: New Directions in Theory and
Practice, Roland T. Rust and Richard L. Oliver, (Eds.), pp. 21–71, Newbury Park,
CA: Sage.
Hoyer, W. D. and MacInnis, D. J. (2010): Consumer Behavior, Fifth edition, South-
Western, Cengage Learning, USA.
Hutchinson, J., Lai, F., & Wang, Y. (2009). Understanding the relationships of quality,
value, equity, satisfaction, and behavioral intentions among golf travelers. Tourism
Management, 30, 289-308.
Page 83
76
Jacoby, J., & Chestnut, R. (1978). Brand loyalty: Measurement and Management, John
Wiley & Sons: New York, NY.
Johnson, W.C. & Sirikit, A. (2002). Service quality in the Thai telecommunication
industry: a tool for achieving a sustainable competitive advantage. Management
Decision, 40(7), 693-701.
Jones, M. A., Mothersbaugh, D. L., & Betty, S. E. (2000). Switching barriers and
repurchase intentions in services. Journal of Retailing, 76(2), 259-272.
Kahn, B. E. (1995). Consumer variety-seeking among goods and services. Journal of
Retailing and Consumer Services, 2(30), 139-148.
Keller, K. L. (1993), Conceptualizing, Measuring, and Man-aging Customer-Based Brand
Equity, Journal of Marketing, 57 (1), 1-22.
Keller, K. L. (2008). Strategic Brand Management: Building, Measuring, and Managing
Brand Equity. 3rd
Ed. Prentice Hall: Pearson International Edition: NJ.
Kim, H.S. & Yoon, C.H. (2004). Determinants of subscriber churn and customer loyalty in
the Korean Mobile telephony market. Telecommunication Policy, 28, 751-765.
Kim, M.K., Park, M.C. & Jeong, D.H. (2004). The effects of customer satisfaction and
switching barrier on customer loyalty in Korean mobile telecommunication services.
Telecommunication Policy, 28, 145-159.
Kotler, P. (2003). Marketing Management, 11th ed., Prentice-Hall, Englewood Cliffs, NJ.
Klemperer, P. (1987). Markets with consumer switching costs. Quarterly Journal of
Economics, 102(2), 375-394.
Kuo, Y.F., Wu, C.M., & Deng, W.J. (2009). The relationships among service quality,
perceived value, customer satisfaction, and post-purchase intention in mobile value-
added services, Computers in Human Behaviour, 25(4), 887-896.
Lai, F., Griffin, M., & Babin, B.J. (2009). How quality, value, image, and satisfaction
create loyalty at a Chinese telecom. Journal of Business Research, 62, 980 - 986.
Lam, S.Y., Shankar, V., Erramilli, M.K., & Murthy, B. (2004). Customer Value,
Satisfaction, Loyalty and Switching costs: An illustration from a Business-to-
Page 84
77
Business Service Contex. Journal of the Academy of Marketing Science, 32(3), 293-
311.
Lee, J., Lee, J., & Feick, L. (2001). The impact of switching costs on the customer
satisfaction–loyalty link: Mobile phone service in France. Journal of
Services Marketing, 15, 35–48.
Lim, H., Widdows, R., & Park, J. (2006). M-loyalty: winning strategies for mobile carriers,
Journal of Consumer Marketing, 23(4), 208-210.
Liu, C.T., Guo, Y.M., & Lee, C.H. (2011). The effects of relationship quality and
switching barriers on customer loyalty. International Journal of Information
Management, 31, 71-79.
Lovelock, C. H.(2000). Service marketing (4th ed.). NJ: Prentice Hall International.
Lovelock, C.H., & Wirtz, J. (2011). Services Marketing: People, Technology and Strategy,
Global Edition, Pearson: Boston.
Malhotra, N.K. (2010). Marketing Research: An Applied Orientation, (6 Ed.). New York:
Prentice Hall.
McDougall, G.H., & Levesque, T. (2000). Customer satisfaction with services: putting
perceived value into the equation. Journal of Services Marketing, 14, (5), 392-410.
Meyer, C. and Schwager, A. (2007). "Understanding customer experience." Harvard Business
Review, (February),117-126.
Monroe, K.B. (1991), Pricing – Making Profitable Decisions, McGraw-Hill, New York,
NY.
Murray, K. B. (1991). A test of services marketing theory: Consumer information
acquisition activities. Journal of Services Marketing, 55, 10-25.
Myjoyonline (2012). Mobile penetration hit 98% in Ghana. Retrieved December 12, 2012,
from: http://business.myjoyonline.com/pages/news/201210/95084.php
Page 85
78
Ngugen, N., & Leblanc, G. (1998).The mediating role of corporate image on customers’
retention decisions: an investigation in financial services. International Journal of
Bank Marketing, 16(2), 52-65.
Ngugen, N., & Leblanc, G. (2001). Corporate image and corporate reputation in
customers’ retention decisions in services. Journal of Retailing and Consumer
Services. 8, 227-236.
Netemeyer, R., Bearden, W., & Sharma, S. (2003). Scaling procedures: Issues and
applications. Thousand Oaks, CA: Sage.
Oh, H. (2000). Diner’s perceptions of quality, value and satisfaction. Cornell Hotel and
Restaurant Administrative Quality, 41(3), 58-66.
Olaru, D. & Purchase, S. (2008). From Customer value to repurchase intentions and
recommendations. Journal of Business and Industrial Marketing, 23(8), 554-565.
Oliver, R. L. (1980). A Cognitive Model of the Antecedents and Consequences of
Satisfaction Decisions, Journal of Marketing Research, 17(November), 460-469.
Oliver, R.L. (1993). A Conceptual Model of Service Quality and Service Satisfaction:
Compatible Goals, Different Concepts. In Advances in Services Marketing and
Management: Research and Practice, vol. 2, Teresa A. Swartz, David E. Bowen, and
Stephen W. Brown, eds. Greenwich, CT: JAI Press.
Oliver, R. L., and DeSarbo, W.S. (1988), "Response Determi-nants in Satisfaction
Judgments," Journal of Consumer Research, 14 (March), 495-507
Oliver, R.L.(1999). Whence customer loyalty? Journal of Marketing, 63(4), 33-44.
Pappu, R., & Quester, P. (2006). Does customer satisfaction lead to improved brand
equity? An empirical examination of two categories of retail brands. Journal of
Product & Brand Management, 15(1), 4-14.
Parasurman, A., Zeithaml, V.A. & Berry, L.L. (1985). A Conceptual Model of Service
Quality and Its Implications for Future Research," Journal of Marketing, 49 (Fall),
41-50.
Page 86
79
Parasuraman, A., Zeithaml, V. A., & Berry, L. L. (1988). SERVQUAL: A multiple-item
scale for measuring consumer perceptions of service quality. Journal of Retailing,
64: 12-37.
Ranaweera, C. & Neely, A. (2003). Some moderating effects on the service quality-
customer retention link. International Journal of Operations and Production
Management, 23(2), 230-248.
Ravald, A. & Gronroos, C. (1996). The value concept and relationship marketing.
European Journal of Marketing, 30(2), 19-30.
Ravndal, B. (2006). Governance of IT Sourcing Relationships: An Empirical Investigation
of the influence of Contract Mechanisms on Contract Behaviour. Phd dissertation
submitted at Norwegian School of Economics and Business Administration.
Reichheld, F. F. (1993). Loyalty-based management. Harvard Business Review. 71(2), 64-
72.
Reichheld, F. F. (1996). The Loyalty Effect, Boston: Harvard Business School Press.
Reichheld, F.F., Markey, R.G., & Hopton, C. (2000). The loyalty effect – the relationship
between loyalty and profits. European Business Journal, 134-139.
Reichheld, F. F., & Sasser, W.E. (1990). Zero Defections: Quality comes to Service,
Harvard Business Review, (September –October), 105-111.
Rosenberg, L., & Czepiel, J.A. (1984). A Marketing Approach to Customer Retention.
Journal of Consumer Marketing, 1, 45-51.
Rust, R.T., & Oliver, R.L. (1994). Service quality: insights and managerial implications
from the frontier, in Rust, R.T. and Oliver, R.L. (Eds), Service Quality: New
Directions in Theory and Practice, pp. 1-20. Sage: Thousand Oaks, CA.
Santouridis, I., & Trivellas, P. (2010). Investigating the impact of service quality and
customer satisfaction on customer loyalty in mobile telephony in Greece. The TQM
Journal, 22(3), 330-343.
Page 87
80
Seo, D., Ranganathan, C., and Babad, Y. (2008). Two-level model of customer retention in
the US mobile telecommunications service market. Telecommunication Policy, 32,
751-765.
Shin, D. H. (2006). A study of mobile number portability effects in the United States.
Telematics and Informatics, 24, 1-14.
Treadwell, D.F., & Harrison, T.M. (1994). “Conceptualizing and assessing organizational
image: model images, commitment and communication.” Communication
Monographs, 61, 63-85.
Turel, O. & Serenko, A. (2006), Satisfaction with mobile services in Canada: an empirical
investigation, Telecommunications Policy, 30(5-6), 314-331.
Venetis, K.A. & Ghauri, P.N. (2000), The importance of service quality on customer
retention: an empirical study of business service relationships”, Proceedings of the
Marketing in a Global Economy Conference, Buenos Aires, June 28-July 1, pp. 215-
224.
Wan, H. H., & Schell, R. (2007). Reassessing Corporate Image – An Examination of How
Image Bridges Symbolic Relationships with Behavioral Relationships. Journal of
Public Relations Research, 19(1), 25-45.
Wang, Y.G. & Lo, H.P. (2002). Service quality, customer satisfaction, customer value, and
behaviour intentions: evidence from China’s telecommunication industry. The
Journal of Policy, Regulation, and Strategy for Telecommunications, 4(6), 50-60.
Wang, C.Y. (2010). Service Quality, Perceived value, corporate image, and customer
loyalty in the context of varying Levels of Switching costs. Psychology and
Marketing, 27(3), 253-262.
Whittaker, G., Ledden, L., Kalafatis, S.P. (2007). A re-examination of the relationship
between value, satisfaction and intention in business services. Journal of Services
Marketing 21 (5), 345-357.
Yang, Z., & Peterson, R.T. (2004). Customer Perceived value, satisfaction, and Loyalty:
The role of switching costs. Psychology and Marketing, 21(10), 799-822.
Zeithaml, V.A. (1988). Consumer Perceptions of price, quality, and value: a means-end
model and synthesis of evidence. Journal of Marketing, 52(2), 2-22.
Page 88
81
7. APPENDIX
7.1 Letter of survey invitation
Subject: Research Insight Needed on Mobile Service Providers in Ghana!
Dear respondent,
I am conducting a survey to understand consumers overall perceptions and attitudes toward
mobile network service providers in Ghana. This is part of my Master thesis at the
Norwegian School of Economics. Participation in this project is voluntary. All responses
will be treated with strict confidentiality, and data collected will be made anonymous in all
reports from the study. Data collected will be used for research purposes only.
The questionnaire will take approximately 10 minutes to complete.
Follow this link to take the Survey:
https://nhh.eu.qualtrics.com/SE/?SID=SV_3TTZ02w6vnulFGc
Thank you in advance for taking the time to complete this survey.
Should you require further information or clarification, you may contact the student or
research supervisor via contact information below.
Yours faithfully,
EAS Quaye
MSc. in Marketing and Brand Management
Norwegian School of Economics, NHH, Norway
[email protected]
Supervisor:
Professor Leif Hem
Strategy and Management
Norwegian School of Economics, NHH, Norway
[email protected]
Page 89
82
7.2 Pilot Email interview
Dear participant,
Subject: Investigating consumer perceptions of telecom brands in Ghana
I am currently working on my thesis dissertation which is aimed at investigating consumer
perceptions of Mobile Telecommunication brands in Ghana. I would be glad if you could
take some time to share your thoughts with me. This is part of an initial pilot study.
Please you are encouraged to answer all the questions, and also provide as much
information as possible to enable me get a better appreciation of the subject areas.
However, if you feel strongly about a particular question, you may decline to answer.
Questions:
1. Which service provider do you use (state your most preferred or frequently used brand):
1b. In case you use multiple brands, provide the list below in order of usage and/or
importance.
2. In your opinion, what factors or characteristics of your mobile service provider do you
consider important for using their services. (Please provide as many reasons or list of
factors as possible). e.g., price promotions etc.
2b. Again, in your opinion, what are the most critical elements that differentiates your
current mobile service provider from the rest of the competition
3. Are you familiar with the Mobile Number Portability (MNP) facility; Yes or No: ....
MNP is the process whereby you can retain your mobile number while switching your
service to another operator of your choice.
Page 90
83
If yes, have you considered switching to another service provider and what
factors are influencing your decision? (Also, in case you've already switched,
indicate from and to which brand, and explain why you switched?)
If no, are there any factors you may consider as barriers to your switching
intentions?
4. How would you evaluate the service offerings, and overall performance of any of the
telecom brands in Ghana? (you can comment on more than one brand. You may also
select from the following list for your assessment: customer care, innovation, corporate
social responsibility, network quality, network coverage, call tariffs, price promotions,
loyalty programmes, internet connectivity, etc). Please feel free to mention other factors
not listed above.
5. Finally, what is your general attitude towards Telecom brands in Ghana?
Please contact me if you need additional information or want clarification.
Thank you for your participation!
E.A.S Quaye
Norwegian School of Economics, Norway
MSc in Marketing and Brand Management
Page 91
84
7.3 Survey Questionnaire Items
1. Which of the following mobile network providers is your most preferred or primary
carrier?
# Answer
o Airtel
o Vodafone
o MTN
o Tigo
o Expresso
o Glo Mobile
2. If you use more than one service provider, please select the brand(s) from the list
below.
# Answer
□ Airtel
□ Vodafone
□ MTN
□ Tigo
□ Expresso
□ Glo Mobile
Please answer the following questions with respect to your main service provider.
3. How satisfied have you been with your experience with your service provider?
# Question Strongly Disagree
Disagree Somewhat Disagree
Neither Agree nor Disagree
Somewhat Agree
Agree Strongly Agree
1
Satisfaction Overall, I am very satisfied with the quality of service offered by my service provider
2
In general, I am very happy with my overall service experience
3 I don't feel pleased with my decision to use the services of this company
Page 92
85
4. Thinking about your service experience, how much do you agree with the
following statements?
5. Based on your experience or what you have heard, how do you evaluate your
service provider on each of these service attributes or benefits?
# Question Very Bad
Bad Poor Neither Good nor Bad
Fair Good Very Good
1
Service quality evaluations Overall network quality.
2 Coverage of the network.
3 Ease of network connection.
4 Voice quality of calls.
5 Overall quality of Internet services.
6 Quality of customer care services.
7 Ease of access to contact centers.
8 Promptness in complaint handling.
9 Call center personnel ability to help with problems.
10 Variety of service plans that meet my needs.
Due to the recent implementation of Mobile Number Portability (MNP) system, the
expectation is that majority of subscribers will drop or replace their network
providers. MNP is a system which allows subscribers to switch from one network
provider to the other without losing their original number. Based on this, answer the
question that follows.
# Question Strongly Disagree
Disagree Somewhat Disagree
Neither Agree
nor Disagree
Somewhat Agree
Agree Strongly Agree
1 Customer intentions I will continue using my primary service provider
2 I will recommend my primary service provider to anyone who seeks my advice.
3 I will encourage my friends and relatives to use my service provider.
4 I will continue using my primary service provider, even if other operators prices were somewhat cheaper.
5 I will still choose my current provider, if I had to do it all over again.
Page 93
86
6. How likely are you to port (i.e., switch) your number from your current service
provider to another?
# Answer
1 Very Unlikely
2 Unlikely
3 Somewhat Unlikely
4 Undecided
5 Somewhat Likely
6 Likely
7 Very Likely
7. How do you rate your level of agreement to each statement in relation to general
attitudes toward switching?
# Question Strongly Disagree
Disagree Somewhat Disagree
Neither Agree Nor Disagree
Somewhat Agree
Agree Strongly Agree
1 Switching attitudes The cost in time and effort for changing my current service provider will be high for me.
2 It would be very inconvenient for me to switch to another service provider.
3 I am not ready to put forth the effort required for switching.
4 Changing my phone company will not make much difference.
5 Switching to another provider will bring economic loss to me.
Page 94
87
8. The following lists of statements describe different perceptions about telecom
service providers. For each statement, please indicate your level of agreement in
relation to your service provider
# Question Strongly Disagree
Disagree Somewhat Disagree
Neither Agree
nor Disagree
Somewhat Agree
Agree Strongly Agree
1
Network Provider perceptions My service provider is innovative and forward-looking.
2 My service provider takes social responsibility seriously.
3 My service provider has a reputation for quality.
4 My service provider has a positive image in the minds of consumers.
5 My service provider offers good value for money.
6 My service provider offers overall better pricing plan compared to its competitors.
7 Considering the price I pay, I am not happy with the value I receive.
Demographics
9. What is your gender?
# Answer
o Male
o Female
10. What is your age?
# Answer
o Less than 18
o 18 to 24 years
o 25 to 34 years
o 35 to 44 years
o 45 to 54 years
o 55 to 64 years
o 65 and above
Page 95
88
11. What is your highest level of education?
# Answer
o SSSCE
o HND
o Undergraduate degree
o Master degree
o PhD
o other (specify)
12. How long have you used your main mobile service provider?
# Answer
o Less than 6 months
o More than 6 months - but less than 2 years
o 2 to 4 years
o 4 to 6 years
o 7 to 10 years
o More than 10 years
13. In which region (city) do you live at the moment?
Answer Answer
o Central Region o Eastern Region
o Ashanti Region o Upper East Region
o Northern Region o Volta Region
o Greater Accra Region o Brong-Ahafo Region
o Upper West Region o Western Region
NB: Items in italics were deleted while computing the various constructs to improve
the scale reliability.