An Investigation of the Equivalent Resistance, Power Requirements and Field Characteristics of Electric Fishing Electrodes R&D Technical Report W2-076/TR W R C Beaumont, M J Lee and G Peirson
Transcript
An Investigation of the Equivalent Resistance, PowerRequirements and Field Characteristics of ElectricFishing Electrodes
All rights reserved. No part of this document may be produced, stored in a retrieval system, ortransmitted, in any form or by any means, electronic, mechanical, photocopying, recording orotherwise without the prior permission of the Environment Agency.
The views expressed in this document are not necessarily those of the Environment Agency. Itsofficers, servants or agents accept no liability whatsoever for any loss or damage arising from theinterpretation or use of the information, or reliance upon the views contained herein.
Dissemination statusInternal: Released to RegionsExternal: Released to Public Domain
Statement of UseThis report should be read in conjunction with R&D Technical Report W2-054/TR Best PracticeGuidelines for Electric Fishing Operations. The detailed information on power requirements andeffective capture field sizes will form part of a field manual for electric fishing operations which willbe distributed to all staff engaged in directing electric fishing operations in the field.
KeywordsElectric fishing, equivalent electrode resistance, voltage gradient.
Research ContractorThis document was produced under R&D Project W2-076 by :
Environment Agency Project ManagerThe Environment Agency’s Project Manager for R&D Project W2-076 was:Dr Graeme Peirson, National Coarse Fish Centre
Further copies of this report are available from:Environment Agency R&D Dissemination CentreWRc, Frankland Road, Swindon, Wilts. SN5 8YFTel: 01793 865000 Fax: 01793 514562 E-mail: [email protected]
R&D TECHNICAL REPORT W2-076/TR i
CONTENTS Page
List of Figures ii
List of Tables iii
Acknowledgements iii
Executive Summary iv
Key Words iv
1. Introduction 1
2. Methods 5
2.1 Voltage Gradient (E) 10
3. Results 12
3.1 Equivalent Electrode Resistance 123.2 Power Requirements 183.3 Voltage Gradient (E) 223.4 Novel Anode Assessment 24
4. Discussion 25
5. References 28
Appendix I Measured Electrode Equivalent Resistance ValuesAppendix II Measured Electrode Equivalent Resistance ValuesAppendix III Duty Cycle/Pulse Width ConversionAppendix IV Output Power and Voltage Gradient Model
R&D TECHNICAL REPORT W2-076/TR ii
LIST OF FIGURES Page
Figure 1 Electrode resistance factors for ring electrode shapes 2(adapted from Novotny and Priegel 1974)
Figure 2 Anode sizes tested, not including Pulse box manufacturers designs. 5Top row left to right 6 mm, 10 mm and 20 mm gauge 200 mm,400 mm and 600 mm size anodes, Lower row novel anode design
Figure 3 Pulse box manufacturers anode designs. Left to right, Electracatch; 6Millstream; Intelysis
Figure 4 Mesh design cathode suspended in non-conducting cradle 8
Figure 5 Experimental set up 9
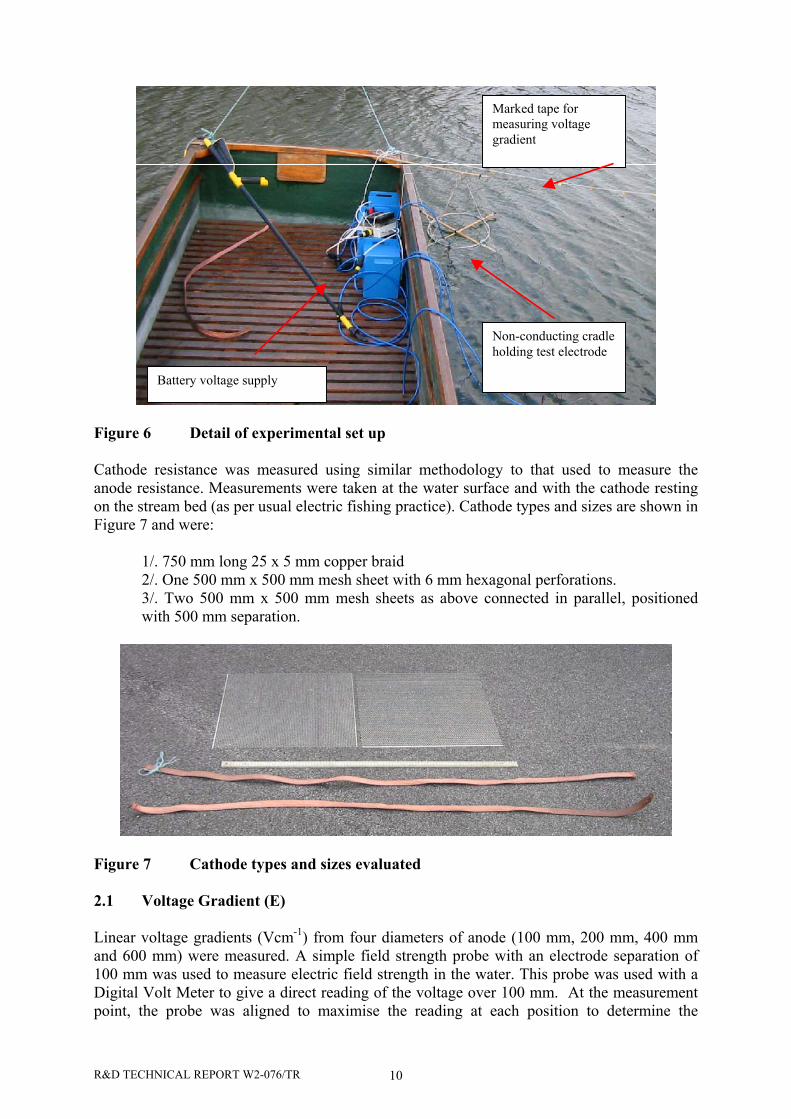
Figure 6 Detail of experimental set up 10
Figure 7 Cathode types and sizes evaluated 10
Figure 8 Inter-electrode voltage gradient between two 600 mm rings at 128 m separation
Figure 9 Equivalent resistance values for different gauges of electrode 15
Figure 10 Relationship between ring diameter and equivalent resistance 16measured at surface and at 500 mm depth
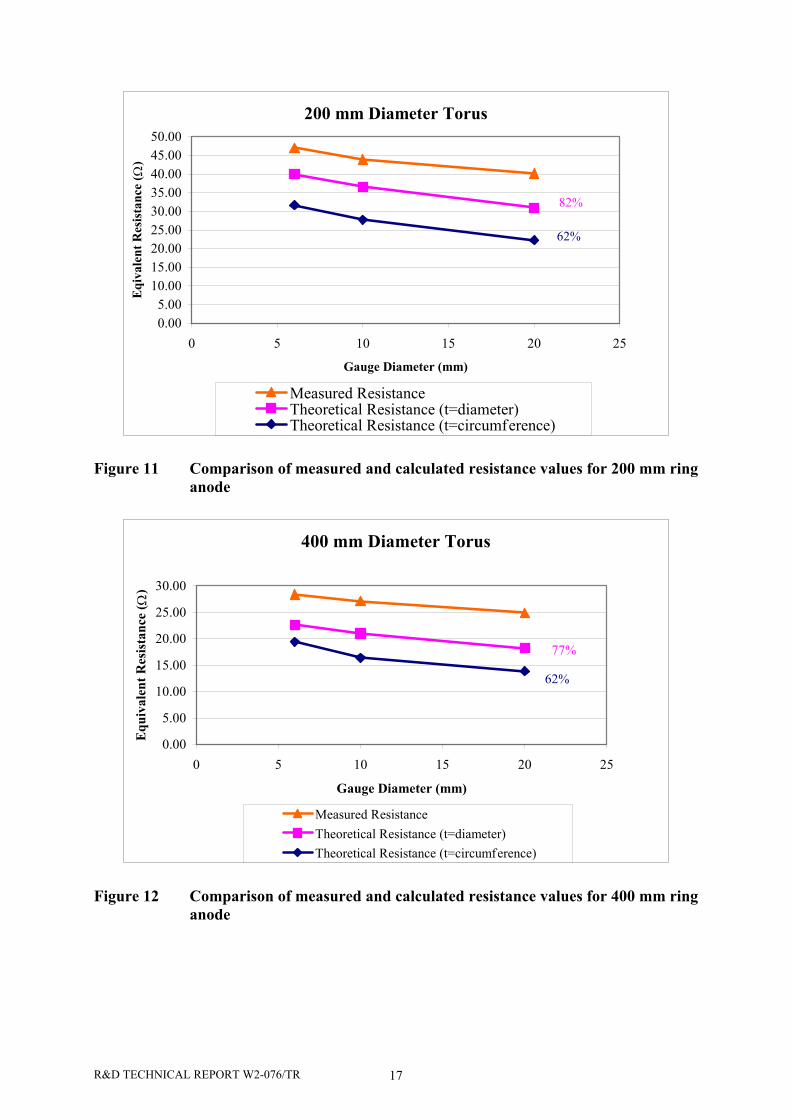
Figure 11 Comparison of measured and calculated resistance values for 17200 mm ring anode
Figure 12 Comparison of measured and calculated resistance values for 17400 mm ring anode
Figure 13 Comparison of measured and calculated resistance values for 18600 mm ring anode
Figure 14 Input VA required to energise a 100 mm x 6 mm ring (plus cathode) 19at different water conductivity values (100 µScm-1 to 2000 µScm-1)
Figure 15 Input VA required to energise a 200 mm x 10 mm ring (plus cathode) 19at different water conductivity values (100 µScm-1 to 2000 µScm-1)
Figure 16 Input VA required to energise a 400 mm x 10 mm ring (plus cathode) 20at different water conductivity values (100 µScm-1 to 2000 µScm-1)
Figure 17 Input VA required to energise a 600 mm x 10 mm ring (plus cathode) 20at different water conductivity values (100 µScm-1 to 2000 µScm-1)
R&D TECHNICAL REPORT W2-076/TR iii
LIST OF FIGURES (CONTINUED) Page
Figure 18 Threshold distances for 0.1, 0.2, 0.5 and 1.0 V/cm thresholds at 22differing input voltage values for a 100 mm diameter ring anode
Figure 19 Threshold distances for 0.1, 0.2, 0.5 and 1.0 V/cm thresholds at 22differing input voltage values for a 200 mm diameter ring anode
Figure 20 Threshold distances for 0.1, 0.2, 0.5 and 1.0 V/cm thresholds at 23differing input voltage values for a 400 mm diameter ring anode
Figure 21 Threshold distances for 0.1, 0.2, 0.5 and 1.0 V/cm thresholds at 23differing input voltage values for a 600 mm diameter ring anode
LIST OF TABLES Page
Table 1 Anode sizes assessed 5
Table 2 Equivalent resistance for a range of ring electrodes and water 13conductivities
Table 3 Electrode resistance for a range of cathode sizes and water 14conductivities
ACKNOWLEDGEMENTS
Thanks to Luke Scott for setting up the equipment and assistance with measuring theelectrical outputs.
R&D TECHNICAL REPORT W2-076/TR iv
EXECUTIVE SUMMARY
The relationship between the diameter of ring anodes and their equivalent electrical resistancehas been measured for a range of anode designs currently in use by workers in the UK. Inaddition, equivalent resistance values have been measured for two designs of cathode.
Measured values did not correspond well with published methods of calculating equivalentelectrode resistance by theoretical means.
The empirical relationship between anode ring diameter, water conductivity and equivalentresistance has been modelled. Results from the modelled data are within 1% of the datameasured.
Knowledge of the equivalent electrode resistance has also enabled a model to be constructedto determine the input power required to energise an electric fishing system for a range ofwater conductivities and applied anode voltages.
Voltage field measurements have also been mapped for a range of anode ring sizes and thesetoo have been modelled over a range of input voltage values.
KEYWORDS
Electric fishing, equivalent electrode resistance, voltage gradient.
R&D TECHNICAL REPORT W2-076/TR 1
1. INTRODUCTION
Knowledge of the electrical resistance of the electrode system used in electric fishing is bothfundamental to understanding the effects of the electrodes and vital if it is required todetermine the power required to energise the electrodes. Likewise, knowledge of the size ofthe electrical field produced by differing electrode shapes and designs is essential if thecorrect energising voltage (i.e. one that is not damaging to fish) is to be used for electrodes ofdiffering diameters. Current European Standards for electric fishing (EN 14011:2003) alsoconfer an onus of care on the electric fishing operator regarding not damaging fish duringelectric fishing operations. Thus, information regarding non-harmful waveforms and fieldintensity is of increasing importance.
With the exception of very high conductivity water (>1000 µScm-1) available power from thegenerator is rarely an issue when using pulsed direct current (pdc) waveforms. However,concerns regarding the potential for fish injury caused by using pdc has led to a generalrecommendation that direct current (dc) should be used wherever possible (Beaumont et al.2002). If large anode diameters and high-applied voltages are used when fishing with dchowever overloading of generators can occur at even moderate water conductivities.Knowledge of the required power input for the electrode array will overcome this potentiallyhazardous situation.
When describing the electrical resistance of electric fishing electrode (anode and cathode)systems the term equivalent electrical resistance is used. The electrodes themselves, beingmade from a conductive metal (usually Aluminium, Stainless Steel or Copper), linked toconnectors by means of copper cables, have a very low electrical resistance. Even with verylong cables, the value of resistance from the connector to any point on the anode or cathodemay be expected to be less than 0.25 Ohm. If the electrodes were to come into electricalcontact, then the total circuit resistance between the two connectors would be the sum of thetwo individual electrode resistances, e.g. 2 * 0.25 Ohms = 0.5 Ohms. However, when twoelectrodes are separated in a volume of water, the electrical resistance between the electrodeconnectors is a function of two components. One component is the sum of the two individualelectrode resistances (e.g. 0.5 Ohms in the example above), the other, and major component,is a function of the conductivity of the water, the spacing of the electrodes, and thedimensions and geometry of the electrodes. Orientation of the electrodes has only a minorimpact upon their equivalent resistance provided that; the spacing of the electrodes is largecompared to the dimensions of the electrodes; the volume of water is large compared with thespacing; and the electrodes are not close to boundaries such as surface, bottom or sides of thevessel (or river). Thus, the resistance of electrodes in water is equivalent to a higher valuethan that of the electrodes alone.
Novotny and Priegel (1974) described a theoretical relationship between these parameters toevaluate the “Electrode Equivalent Resistance” (Equation 1).
wKfR σγ )(= Equation 1
where, for a circular or ring shaped electrode made from round or tube shapedmaterial:
dt=γ Equation 2
R&D TECHNICAL REPORT W2-076/TR 2
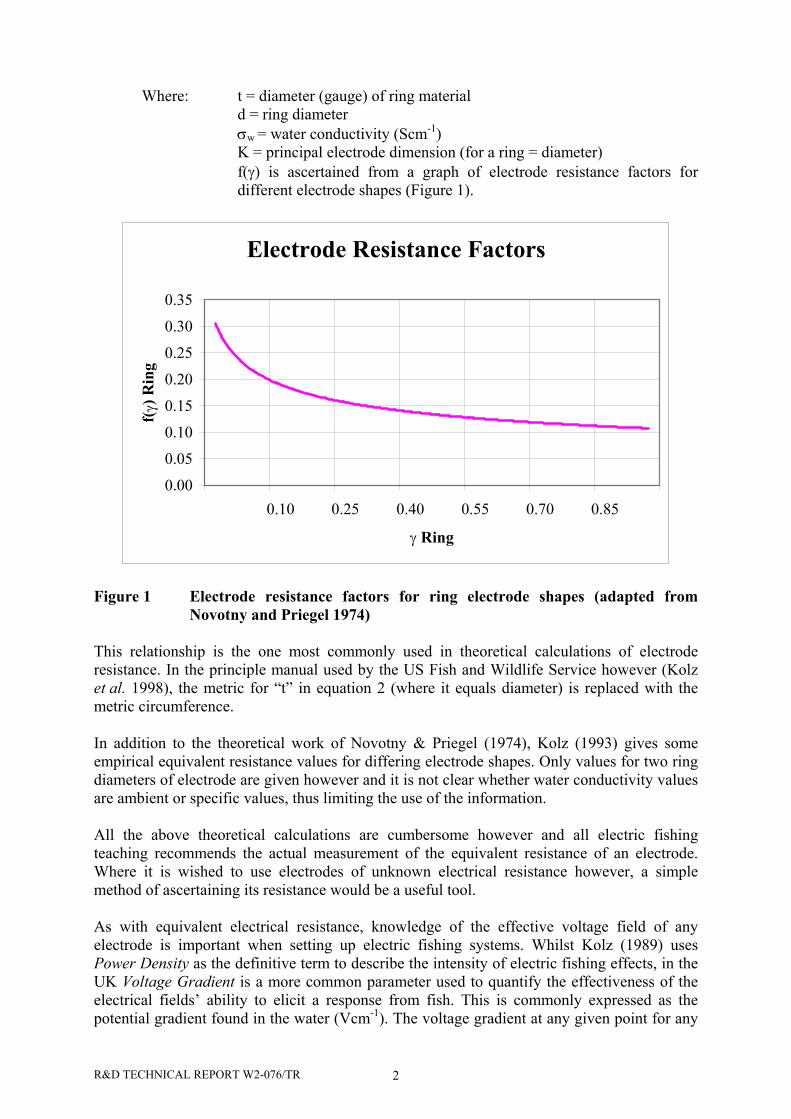
Where: t = diameter (gauge) of ring materiald = ring diameterσw = water conductivity (Scm-1)K = principal electrode dimension (for a ring = diameter)f(γ) is ascertained from a graph of electrode resistance factors fordifferent electrode shapes (Figure 1).
Electrode Resistance Factors
0.00
0.05
0.10
0.15
0.20
0.25
0.30
0.35
0.10 0.25 0.40 0.55 0.70 0.85
γ Ring
f(γ)
Rin
g
Figure 1 Electrode resistance factors for ring electrode shapes (adapted fromNovotny and Priegel 1974)
This relationship is the one most commonly used in theoretical calculations of electroderesistance. In the principle manual used by the US Fish and Wildlife Service however (Kolzet al. 1998), the metric for “t” in equation 2 (where it equals diameter) is replaced with themetric circumference.
In addition to the theoretical work of Novotny & Priegel (1974), Kolz (1993) gives someempirical equivalent resistance values for differing electrode shapes. Only values for two ringdiameters of electrode are given however and it is not clear whether water conductivity valuesare ambient or specific values, thus limiting the use of the information.
All the above theoretical calculations are cumbersome however and all electric fishingteaching recommends the actual measurement of the equivalent resistance of an electrode.Where it is wished to use electrodes of unknown electrical resistance however, a simplemethod of ascertaining its resistance would be a useful tool.
As with equivalent electrical resistance, knowledge of the effective voltage field of anyelectrode is important when setting up electric fishing systems. Whilst Kolz (1989) usesPower Density as the definitive term to describe the intensity of electric fishing effects, in theUK Voltage Gradient is a more common parameter used to quantify the effectiveness of theelectrical fields’ ability to elicit a response from fish. This is commonly expressed as thepotential gradient found in the water (Vcm-1). The voltage gradient at any given point for any
R&D TECHNICAL REPORT W2-076/TR 3
given electrode configuration is independent of water conductivity provided the appliedvoltage is kept constant (Cuinat 1967). However, the power needed to supply that constantvoltage will vary with water conductivity, as the water conductivity will affect the equivalentresistance of the electrodes. For a given electrode the voltage gradient is also directlyproportional to the input voltage of the electrode. Thus, once determined for one electrode atone applied voltage the gradient value can be extrapolated to any given input voltage for thatelectrode.
Cuinat (1967) considered that the electrical characteristics of the commonly used ring anodecould be adequately described by the electrical characteristics of hemispheres, with the metricfor the diameter of the ring anode (d) being replaced by the radius of a hemisphere having theequivalent electrical characteristics (re). From this it is possible to calculate the voltagerequired to be applied to the electrode to produce a particular voltage gradient at any distancefrom any sized anode.
eD r
DEVa2
*= Equation 3
Where: Va = applied anode potential (Volts)ED = voltage gradient at distance DD = the distance between the centre of the anode and a point in thewaterre = Radius of hemispherical anode having an electrical resistanceequivalent to the anode ring diameter.
As voltage gradient is independent of conductivity equation 3 can be used to calculate thedistance away from the anode that various voltage gradients occur for differing appliedvoltage at the anode.
=
D
e
ErVD * Equation 4
Cuinat (1967) obtained the value for re for a ring electrode by a look-up table, however it canbe represented by the formula
( )61.0*39.1 dre = Equation 5
Where: d = ring anode diameter
Equation 4 therefore becomes
( )DE
dVD61.0*39.1*
= Equation 6
As with the theoretical calculations of equivalent electrode resistance however, empiricalmeasurement is the best way to accurately assess voltage gradient characteristics ofelectrodes.
R&D TECHNICAL REPORT W2-076/TR 4
Regarding the actual “best” diameter of electrode to be used, the basic rule regarding anodesize is “use as large a diameter as possible”. Not only are voltage gradients close to the anodelower with large rings (for a given applied voltage) but also power requirements per m2 offishing zone are reduced (Cuinat 1967). Within this ideal, restrictions will be based uponhaving sufficient power to energise the anodes and the physical size of the stream to be fished.Within the UK the most common anode sizes are in the range 250 – 400 mm (Beaumont et al.2002). Lamarque (1990) however considered that in water of 30 - 500 µScm-1 conductivityelectrodes of 600 mm ring diameter, 20 mm tube diameter were effective. Likewise, Cuinat(1967) gives information regarding 600 mm diameter anodes noting however [whilst anodesgreater than 400 mm are rarely used] “it would be advantageous to use electrodes larger thanthis”. These large anodes (correctly powered) should give a good taxis field yet a smalltetanising field and thus be less damaging [to fish] than smaller electrodes.
The only empirical data for such large anodes is given in Cuinat (1967) and Beaumont et al.(2002) noted that further investigation of the ease of use and voltage fields produced by large(>400 mm) electrodes would be useful. It was also noted that within the Agency the majorityof anodes are of one or two designs and that these “standard” anodes, fitted with a range ofdiameter heads, should have their resistance empirically measured in order to assist incalculating power requirements.
The objectives of this study therefore were to:
1. Achieve an accurate model (based on empirical measurements) to predict thepower required to energise electric fishing electrodes of differing physicalproperties in different water conductivities.
2. Map effective (0.1 – 1.0 Vcm-1) one-dimensional linear voltage gradientsproduced by a variety of anode designs.
3. Investigate the implications of varying applied voltage upon field (voltagegradient) characteristics.
4. Trial the ease of use and electrical characteristics of the novel large anodedesign described in Beaumont et al. (2002)
R&D TECHNICAL REPORT W2-076/TR 5
2. METHODS
A range of electrode sizes (Figure 2) was constructed from stainless steel and their effectiveelectrical resistance empirically measured. Electrodes designs represented anodes (ringshaped) and cathodes (braid and mesh plates). The diameter and gauge (ring thickness) for theanodes used are shown in Table 1.
Table 1 Anode sizes assessed
Diameter Ring Thickness100 mm 6 mm200 mm 6 mm 10 mm 20 mm400 mm * 6 mm 10 mm 20 mm600 mm 6 mm 10 mm 20 mm600 mm 10 mm thickness with spacers and central fixing for anode pole.* = Reference anode diameter
Figure 2 Anode sizes tested, not including Pulse box manufacturers designs. Toprow left to right 6 mm, 10 mm and 20 mm gauge 200 mm, 400 mm and 600mm size anodes, Lower row novel anode design
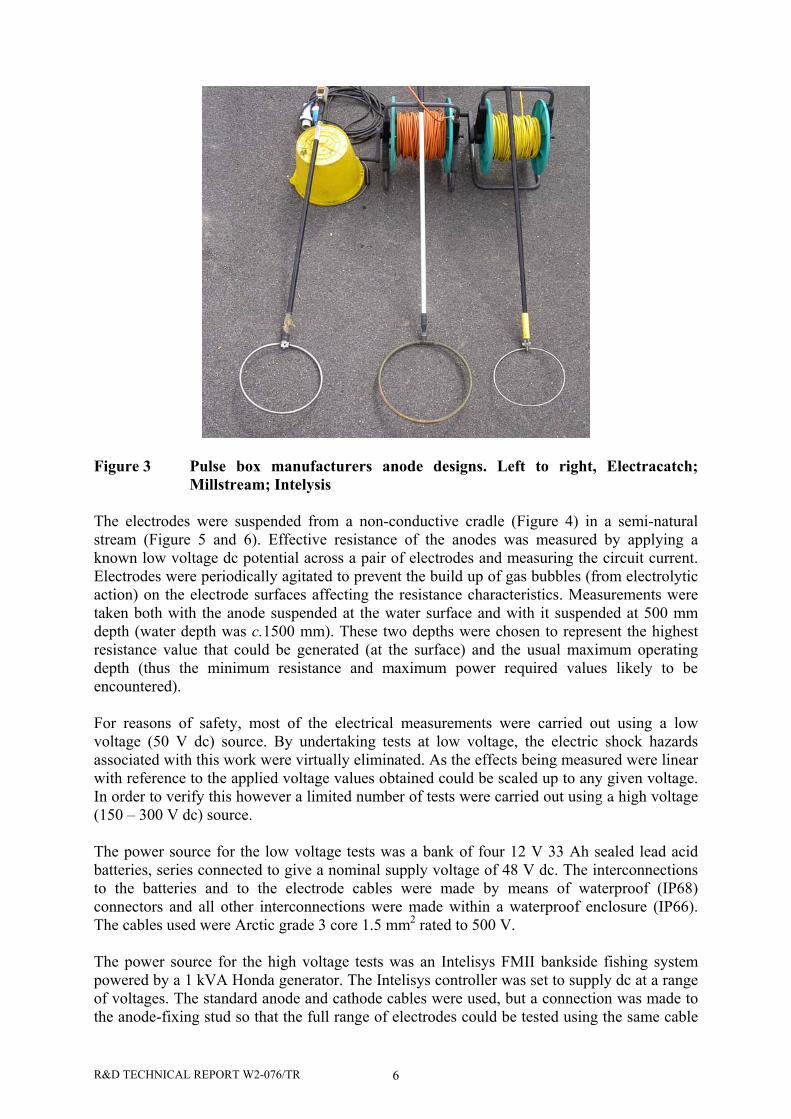
In addition to the range of standard anode sizes measured, examples of anode ring designsused by pulse box manufacturers were also tested. Anode rings on electrodes supplied byElectracatch, Millstream and Intelysis (Figure 3) plus others not currently in common use inthe UK were removed from the handles and tested in the manner described above.
R&D TECHNICAL REPORT W2-076/TR 6
Figure 3 Pulse box manufacturers anode designs. Left to right, Electracatch;Millstream; Intelysis
The electrodes were suspended from a non-conductive cradle (Figure 4) in a semi-naturalstream (Figure 5 and 6). Effective resistance of the anodes was measured by applying aknown low voltage dc potential across a pair of electrodes and measuring the circuit current.Electrodes were periodically agitated to prevent the build up of gas bubbles (from electrolyticaction) on the electrode surfaces affecting the resistance characteristics. Measurements weretaken both with the anode suspended at the water surface and with it suspended at 500 mmdepth (water depth was c.1500 mm). These two depths were chosen to represent the highestresistance value that could be generated (at the surface) and the usual maximum operatingdepth (thus the minimum resistance and maximum power required values likely to beencountered).
For reasons of safety, most of the electrical measurements were carried out using a lowvoltage (50 V dc) source. By undertaking tests at low voltage, the electric shock hazardsassociated with this work were virtually eliminated. As the effects being measured were linearwith reference to the applied voltage values obtained could be scaled up to any given voltage.In order to verify this however a limited number of tests were carried out using a high voltage(150 – 300 V dc) source.
The power source for the low voltage tests was a bank of four 12 V 33 Ah sealed lead acidbatteries, series connected to give a nominal supply voltage of 48 V dc. The interconnectionsto the batteries and to the electrode cables were made by means of waterproof (IP68)connectors and all other interconnections were made within a waterproof enclosure (IP66).The cables used were Arctic grade 3 core 1.5 mm2 rated to 500 V.
The power source for the high voltage tests was an Intelisys FMII bankside fishing systempowered by a 1 kVA Honda generator. The Intelisys controller was set to supply dc at a rangeof voltages. The standard anode and cathode cables were used, but a connection was made tothe anode-fixing stud so that the full range of electrodes could be tested using the same cable
R&D TECHNICAL REPORT W2-076/TR 7
and connection system that was used in the low voltage tests. Safety was ensured whenhandling the electrodes both by the standard Intelisys “dead-mans” safety switch and,additionally, by isolating the electrode by means of an in-line waterproof connector (IP68)before making any adjustments or changes to the electrode. A single 750 mm long copperbraid (25 mm x 5 mm) cathode was used.
Electrical coupling between electrodes was assessed by positioning two 600 mm diameterelectrodes 8 m apart in the stream and energising them with c.50 V dc (one ring thusbecoming the anode and the other the cathode). Voltage gradient between the two electrodeswas measured to determine if significant inter-electrode electrical coupling between theelectrodes was taking place; the 600 mm electrodes having the largest field and thus the beingthe most likely to be coupled.
For all tests, water flow was negligible and total water depth at the site of the electricalmeasurements was c.1.5 m.
Specific water conductivity was measured using a laboratory calibrated Ciba-CorningCheckmate #90 conductivity meter. Specific conductivity was 558 µScm-1 at 5.8 C, from thisambient conductivity was calculated to be 350 µScm-1.
From the voltage and current readings the effective electrode resistance was calculated fromequation 7:
Thereafter single electrodes of differing diameter and thickness were substituted for one of thereference electrodes and the effective resistance of the new electrode calculated usingEquation 8.
refx RIVR −
= Equation 8
where: Rx = the resistance of the new electrodeRref = reference anode resistance
R&D TECHNICAL REPORT W2-076/TR 8
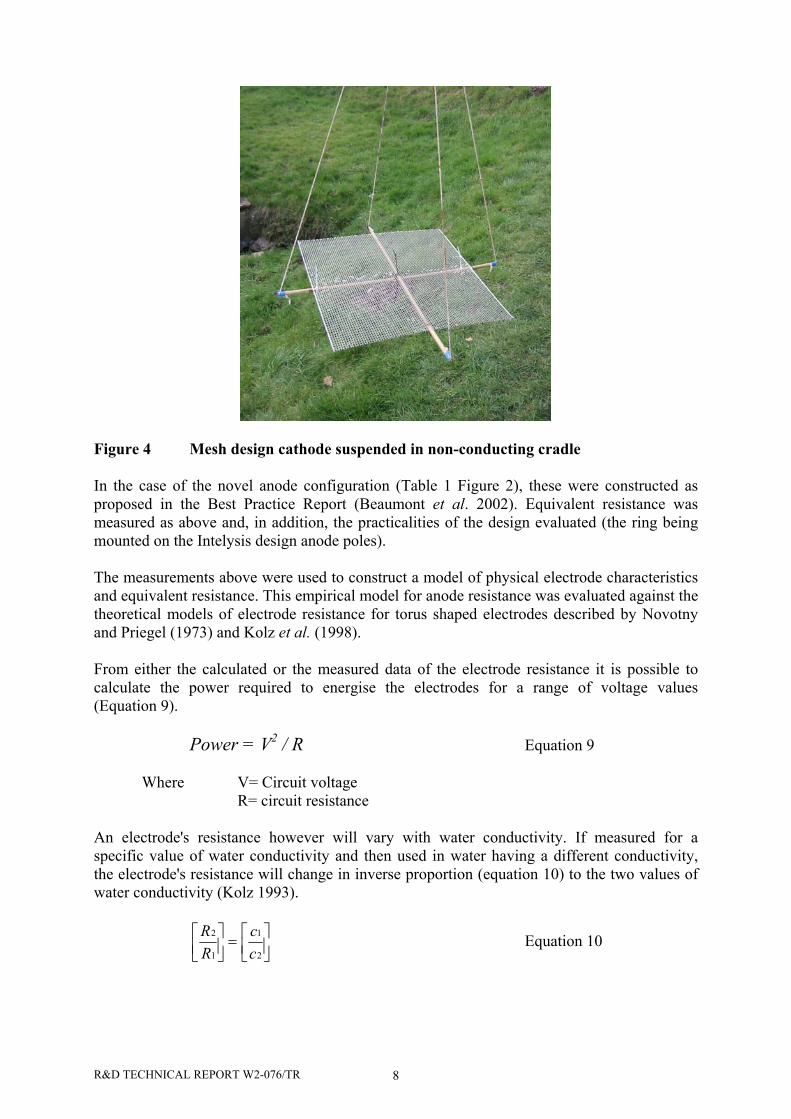
Figure 4 Mesh design cathode suspended in non-conducting cradle
In the case of the novel anode configuration (Table 1 Figure 2), these were constructed asproposed in the Best Practice Report (Beaumont et al. 2002). Equivalent resistance wasmeasured as above and, in addition, the practicalities of the design evaluated (the ring beingmounted on the Intelysis design anode poles).
The measurements above were used to construct a model of physical electrode characteristicsand equivalent resistance. This empirical model for anode resistance was evaluated against thetheoretical models of electrode resistance for torus shaped electrodes described by Novotnyand Priegel (1973) and Kolz et al. (1998).
From either the calculated or the measured data of the electrode resistance it is possible tocalculate the power required to energise the electrodes for a range of voltage values(Equation 9).
Power = V2 / R Equation 9
Where V= Circuit voltageR= circuit resistance
An electrode's resistance however will vary with water conductivity. If measured for aspecific value of water conductivity and then used in water having a different conductivity,the electrode's resistance will change in inverse proportion (equation 10) to the two values ofwater conductivity (Kolz 1993).
=
2
1
1
2
cc
RR Equation 10
R&D TECHNICAL REPORT W2-076/TR 9
Where: R1 is the resistance of the electrode in the water having a conductivityequal to c1,R2 is the resistance of the electrode in the original water having aconductivity of c2.
Therefore, the resistance of an electrode can be calculated for any value of water conductivityonce its resistance is experimentally determined for water of known conductivity usingEquation 11.
R2 = ( )
2
11*c
cREquation 11
The equivalent resistance values at differing water conductivities were thus also used tocalculate the power required to energise differing electrode types using equation 9.
The power value derived from equation 9 however needs to be corrected for adverse powerfactor. The Power Factor of the electric fishing control box will depend upon the circuitrywithin the unit. Adverse power factor occurs in ac - input power converters of the type used inelectric fishing control boxes due to the non-linear nature of the rectifier/capacitor inputcircuit. This results in an input current with a high harmonic content. These harmoniccomponents do not contribute to the power since they do not have corresponding componentsin the input voltage waveform. It is technically feasible to design circuitry with unity powerfactor with little detriment to conversion efficiency, however the added complexity would belikely to increase the cost of the power converter by 50%. In practice, with currently availableequipment, it may be anticipated that power factor may be as low as 0.6. This value thereforehas been used in the calculations of Input VA required to energise the electrodes.
Figure 5 Experimental set up
Securely moored punts
R&D TECHNICAL REPORT W2-076/TR 10
Figure 6 Detail of experimental set up
Cathode resistance was measured using similar methodology to that used to measure theanode resistance. Measurements were taken at the water surface and with the cathode restingon the stream bed (as per usual electric fishing practice). Cathode types and sizes are shown inFigure 7 and were:
1/. 750 mm long 25 x 5 mm copper braid2/. One 500 mm x 500 mm mesh sheet with 6 mm hexagonal perforations.3/. Two 500 mm x 500 mm mesh sheets as above connected in parallel, positionedwith 500 mm separation.
Figure 7 Cathode types and sizes evaluated
2.1 Voltage Gradient (E)
Linear voltage gradients (Vcm-1) from four diameters of anode (100 mm, 200 mm, 400 mmand 600 mm) were measured. A simple field strength probe with an electrode separation of100 mm was used to measure electric field strength in the water. This probe was used with aDigital Volt Meter to give a direct reading of the voltage over 100 mm. At the measurementpoint, the probe was aligned to maximise the reading at each position to determine the
Marked tape formeasuring voltagegradient
Non-conducting cradleholding test electrode
Battery voltage supply
R&D TECHNICAL REPORT W2-076/TR 11
maximum field strength. For a given voltage, the voltage gradient produced by a standardanode will remain constant irrespective of the water conductivity (Kolz 1993, Beaumont et al.2002 Appendix 3) thus correction for water conductivity was not required.
R&D TECHNICAL REPORT W2-076/TR 12
3. RESULTS
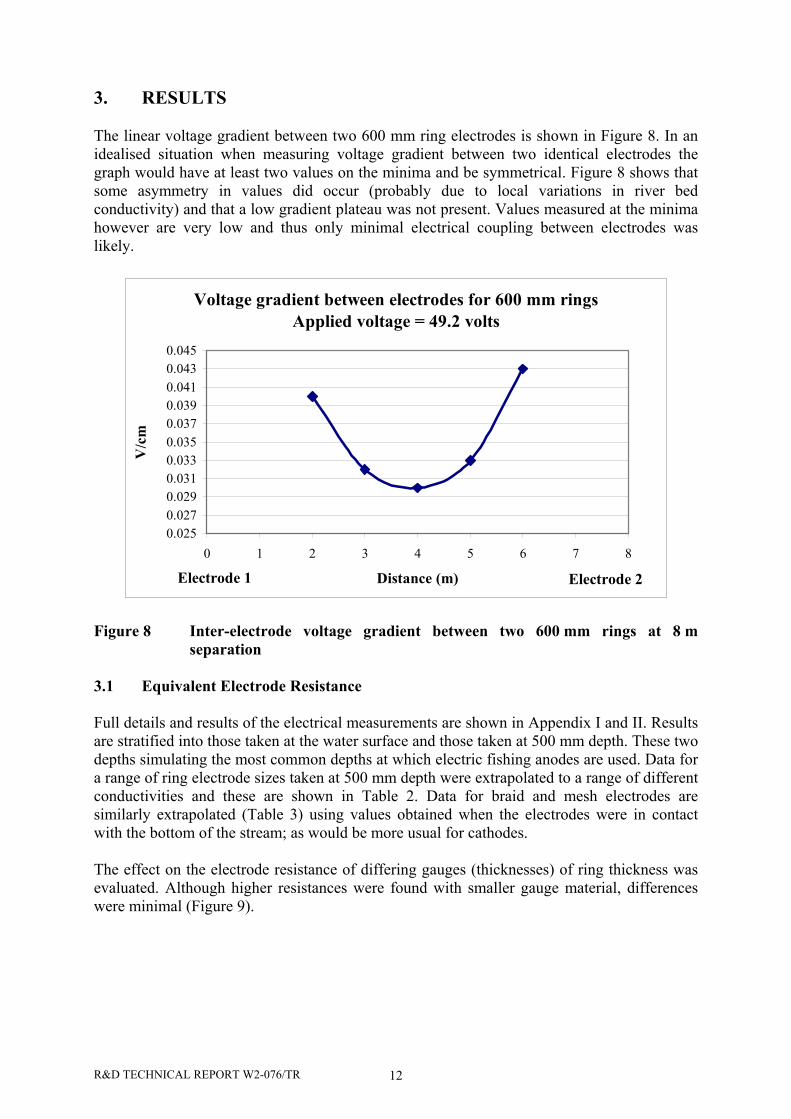
The linear voltage gradient between two 600 mm ring electrodes is shown in Figure 8. In anidealised situation when measuring voltage gradient between two identical electrodes thegraph would have at least two values on the minima and be symmetrical. Figure 8 shows thatsome asymmetry in values did occur (probably due to local variations in river bedconductivity) and that a low gradient plateau was not present. Values measured at the minimahowever are very low and thus only minimal electrical coupling between electrodes waslikely.
Voltage gradient between electrodes for 600 mm ringsApplied voltage = 49.2 volts
Figure 8 Inter-electrode voltage gradient between two 600 mm rings at 8 mseparation
3.1 Equivalent Electrode Resistance
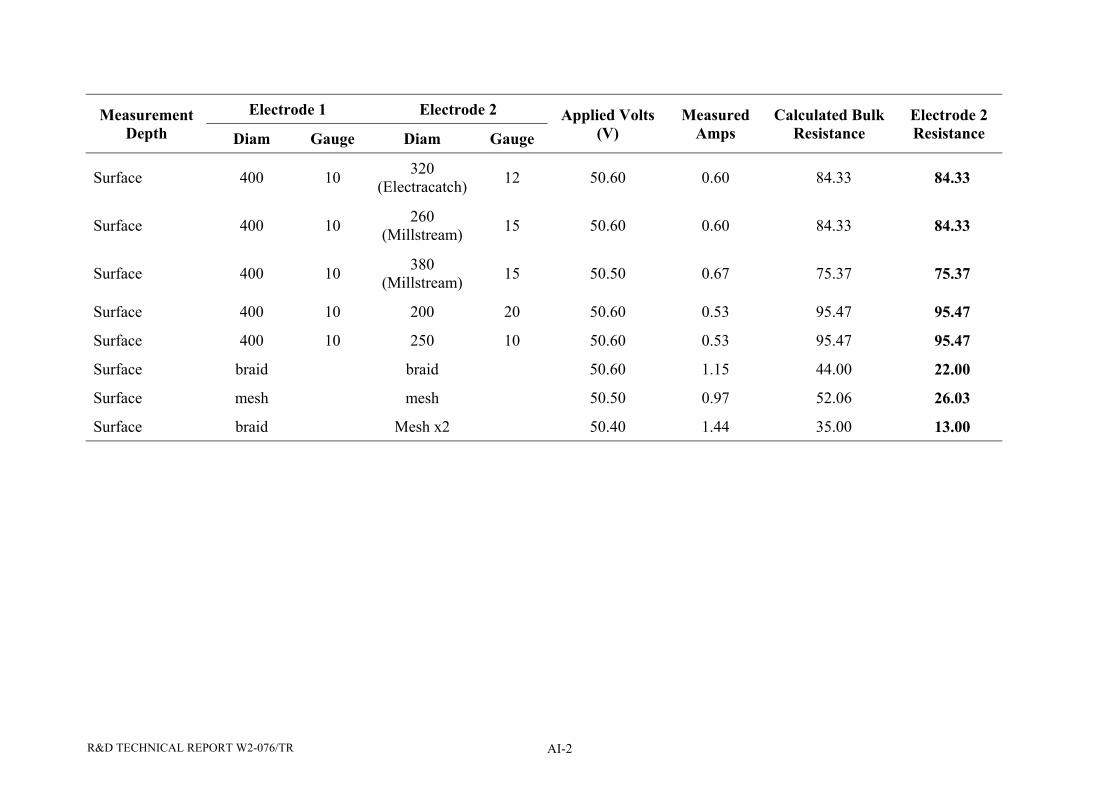
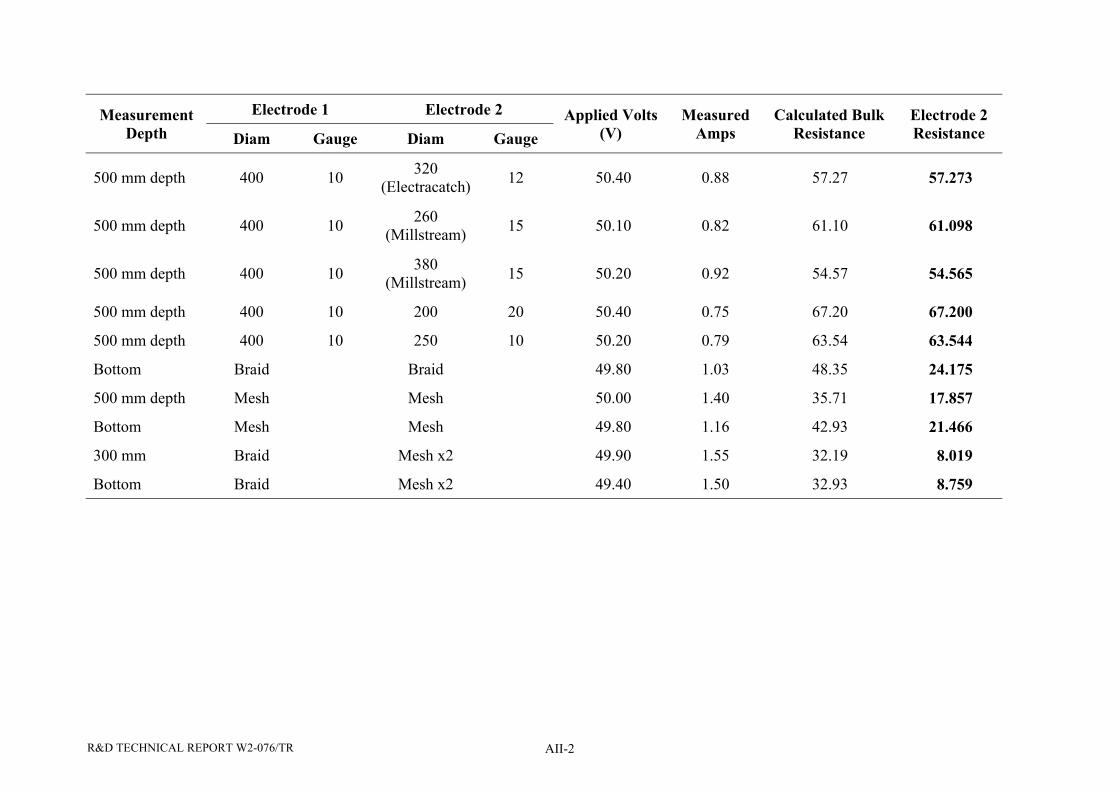
Full details and results of the electrical measurements are shown in Appendix I and II. Resultsare stratified into those taken at the water surface and those taken at 500 mm depth. These twodepths simulating the most common depths at which electric fishing anodes are used. Data fora range of ring electrode sizes taken at 500 mm depth were extrapolated to a range of differentconductivities and these are shown in Table 2. Data for braid and mesh electrodes aresimilarly extrapolated (Table 3) using values obtained when the electrodes were in contactwith the bottom of the stream; as would be more usual for cathodes.
The effect on the electrode resistance of differing gauges (thicknesses) of ring thickness wasevaluated. Although higher resistances were found with smaller gauge material, differenceswere minimal (Figure 9).
R&D TECHNICAL REPORT W2-076/TR 13
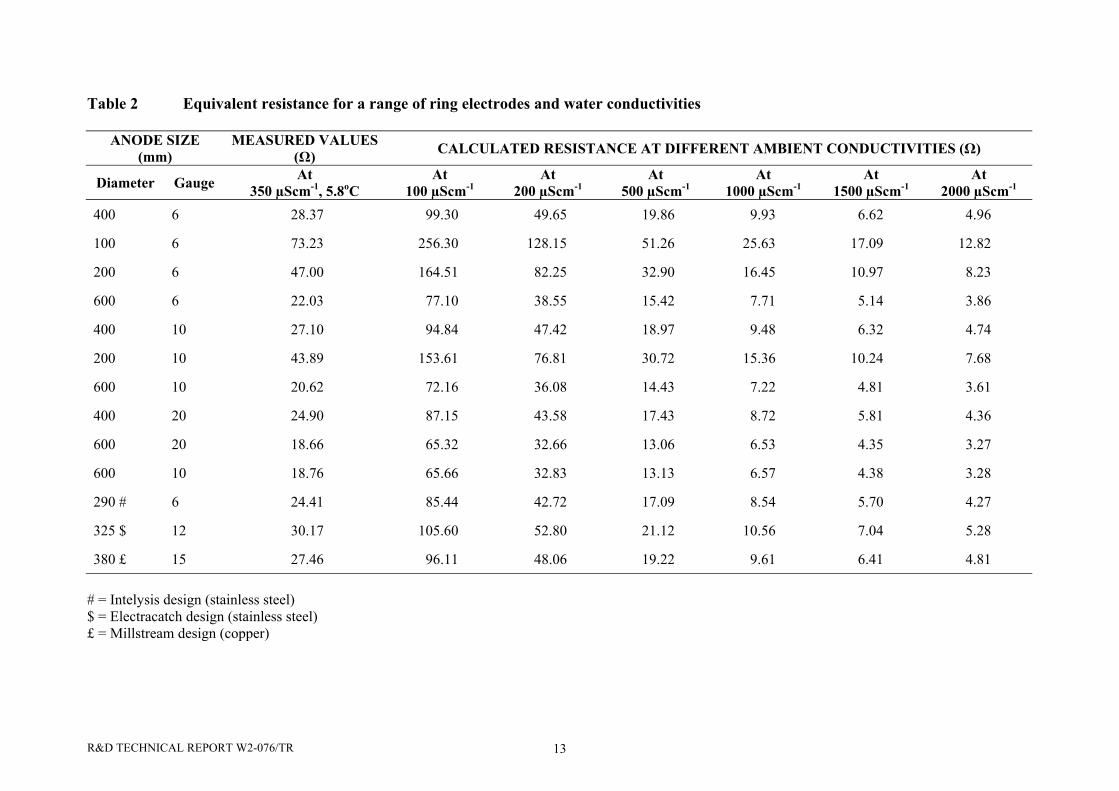
Table 2 Equivalent resistance for a range of ring electrodes and water conductivities
ANODE SIZE(mm)
MEASURED VALUES(Ω) CALCULATED RESISTANCE AT DIFFERENT AMBIENT CONDUCTIVITIES (Ω)
Table 3 Electrode resistance for a range of cathode sizes and water conductivities
CATHODE TYPE MEASURED VALUES(Ω) CALCULATED RESISTANCE AT DIFFERENT AMBIENT CONDUCTIVITIES (Ω)
Diameter Gauge At350 µScm-1, 5.8oC
At100 µScm-1
At200 µScm-1
At500 µScm-1
At1000 µScm-1
At1500 µScm-1
At2000 µScm-1
Braid 750 mm 24.2 84.70 42.35 16.94 8.47 5.65 4.24
Mesh 600 x 600 mm 21.5 75.25 37.63 15.05 7.53 5.02 3.76
Mesh x2 600 x 600 mm 8.7 30.45 15.23 6.09 3.05 2.03 1.52
R&D TECHNICAL REPORT W2-076/TR 15
Different gauge thickness
0
10
20
30
40
50
60
70
80
0 100 200 300 400 500 600 700
Electrode Diameter (mm)
Res
ista
nce
( Ω)
6 mm Gauge
10 mm Gauge
20 mm Gauge
Figure 9 Equivalent resistance values for different gauges of electrode
As gauge of ring material had minimal effect on the readings, data for all gauges werecombined for calculating resistance values at the surface and at 500 mm depth. Equivalentelectrode resistance was found to be higher when measured at the surface when comparedwith the 500 mm depth measurements (Figure 10). Measurements at 500 mm depth being onaverage 70% of those measured at the surface.
Equivalent electrode resistance was found to consist of a power law relationship withelectrode diameter.
For an electrode at the surface:
Req = 3076 D –0.74 R2 = 0.93 p = <0.001 Equation 12
For an electrode at 500 mm depth:
Req = 1956 D –0.72 R2 = 0.98 p = <0.001 Equation 13
Thus equations 11 and 12 can be use to calculate the equivalent electrical resistance of anydiameter electrode and then adjusted according to the conductivity of the water in which it isbeing used using equation 10.
R&D TECHNICAL REPORT W2-076/TR 16
Equivalent Electrode Resistance vs Diameter
y = 3075.7x-0.7436
R2 = 0.93
y = 1956.1x-0.7181
R2 = 0.980
20
40
60
80
100
120
0 100 200 300 400 500 600 700
Electrode Diameter mm
Equ
ival
ent R
esis
tanc
e Ω
Resistance at Surface Resistance at 500 mm depth
Figure 10 Relationship between ring diameter and equivalent resistance measured atsurface and at 500 mm depth
Measured values of resistance (at 500 mm depth) were compared with values calculated bythe method proposed by Novotny and Priegel (1974) and Kolz et al. (1998). Data has beenstratified into the three thicknesses of electrode measured and values for the metric “t” of bothdiameter and circumference has been used (Figures 11 - 13).
Figure 12 Comparison of measured and calculated resistance values for 400 mm ringanode
R&D TECHNICAL REPORT W2-076/TR 18
600 mm Diameter Torus
0.00
5.00
10.00
15.00
20.00
25.00
0 5 10 15 20 25
Gauge Diameter (mm)
Equ
ival
ent R
esis
tanc
e ( Ω
)
Measured Resistance
Theoretical Resistance (t=diameter)
Theoretical Resistance (t=circumference)
57%
72%
Figure 13 Comparison of measured and calculated resistance values for 600 mm ringanode
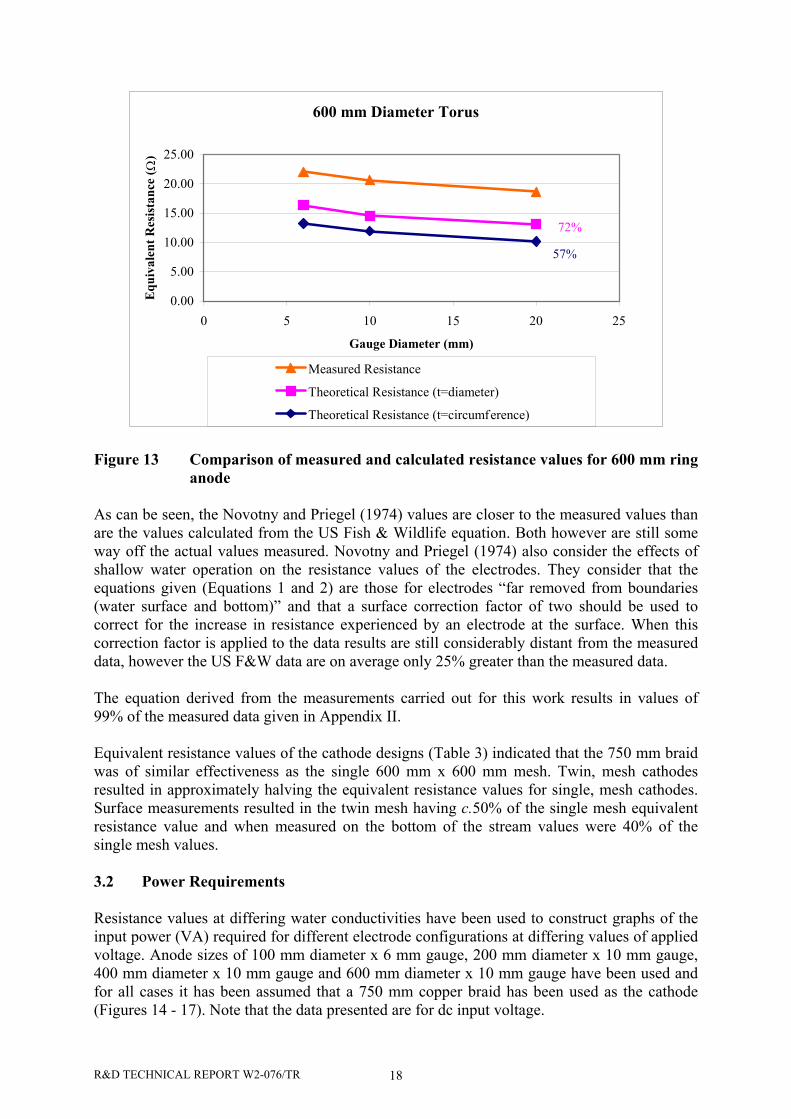
As can be seen, the Novotny and Priegel (1974) values are closer to the measured values thanare the values calculated from the US Fish & Wildlife equation. Both however are still someway off the actual values measured. Novotny and Priegel (1974) also consider the effects ofshallow water operation on the resistance values of the electrodes. They consider that theequations given (Equations 1 and 2) are those for electrodes “far removed from boundaries(water surface and bottom)” and that a surface correction factor of two should be used tocorrect for the increase in resistance experienced by an electrode at the surface. When thiscorrection factor is applied to the data results are still considerably distant from the measureddata, however the US F&W data are on average only 25% greater than the measured data.
The equation derived from the measurements carried out for this work results in values of99% of the measured data given in Appendix II.
Equivalent resistance values of the cathode designs (Table 3) indicated that the 750 mm braidwas of similar effectiveness as the single 600 mm x 600 mm mesh. Twin, mesh cathodesresulted in approximately halving the equivalent resistance values for single, mesh cathodes.Surface measurements resulted in the twin mesh having c.50% of the single mesh equivalentresistance value and when measured on the bottom of the stream values were 40% of thesingle mesh values.
3.2 Power Requirements
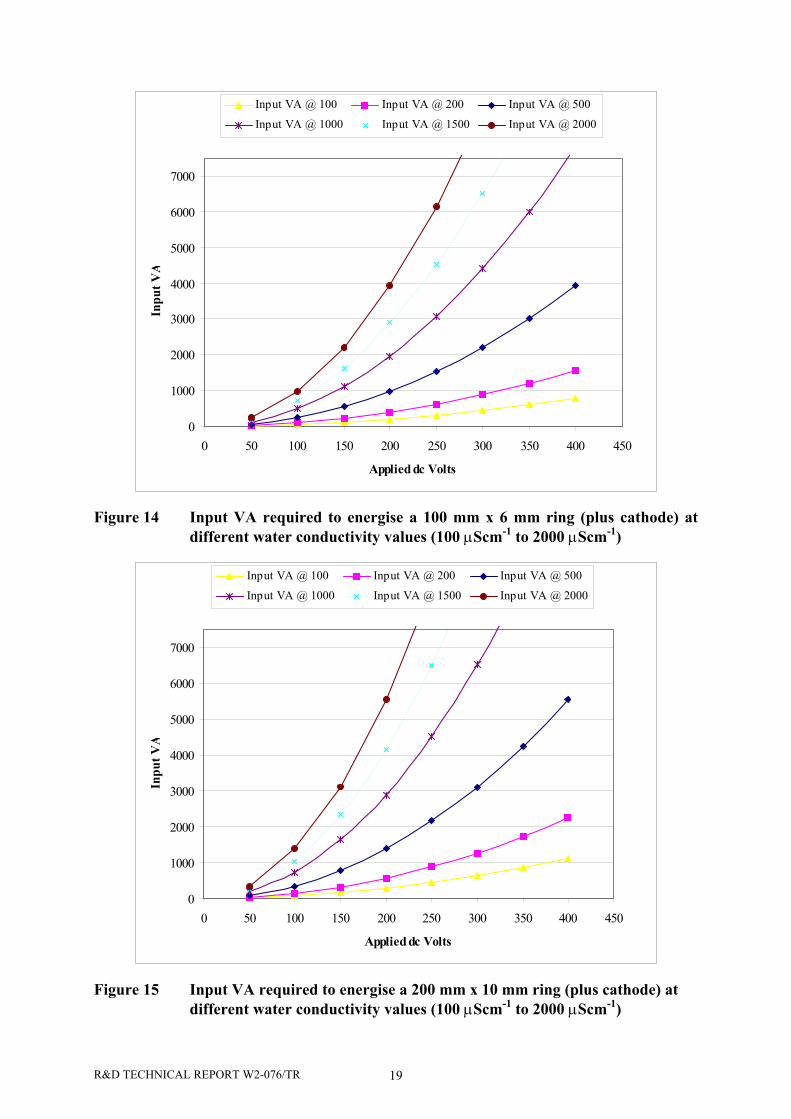
Resistance values at differing water conductivities have been used to construct graphs of theinput power (VA) required for different electrode configurations at differing values of appliedvoltage. Anode sizes of 100 mm diameter x 6 mm gauge, 200 mm diameter x 10 mm gauge,400 mm diameter x 10 mm gauge and 600 mm diameter x 10 mm gauge have been used andfor all cases it has been assumed that a 750 mm copper braid has been used as the cathode(Figures 14 - 17). Note that the data presented are for dc input voltage.
R&D TECHNICAL REPORT W2-076/TR 19
0
1000
2000
3000
4000
5000
6000
7000
0 50 100 150 200 250 300 350 400 450
Applied dc Volts
Inpu
t VA
Input VA @ 100 Input VA @ 200 Input VA @ 500
Input VA @ 1000 Input VA @ 1500 Input VA @ 2000
Figure 14 Input VA required to energise a 100 mm x 6 mm ring (plus cathode) atdifferent water conductivity values (100 µScm-1 to 2000 µScm-1)
0
1000
2000
3000
4000
5000
6000
7000
0 50 100 150 200 250 300 350 400 450
Applied dc Volts
Inpu
t VA
Input VA @ 100 Input VA @ 200 Input VA @ 500
Input VA @ 1000 Input VA @ 1500 Input VA @ 2000
Figure 15 Input VA required to energise a 200 mm x 10 mm ring (plus cathode) atdifferent water conductivity values (100 µScm-1 to 2000 µScm-1)
R&D TECHNICAL REPORT W2-076/TR 20
0
1000
2000
3000
4000
5000
6000
7000
0 100 200 300 400 500
Applied dc Volts
Inpu
t VA
Input VA @ 100 Input VA @ 200 Input VA @ 500
Input VA @ 1000 Input VA @ 1500 Input VA @ 2000
Figure 16 Input VA required to energise a 400 mm x 10 mm ring (plus cathode) atdifferent water conductivity values (100 µScm-1 to 2000 µScm-1)
0
1000
2000
3000
4000
5000
6000
7000
0 50 100 150 200 250 300 350 400 450
Applied dc Volts
Inpu
t VA
Input VA @ 100 Input VA @ 200 Input VA @ 500
Input VA @ 1000 Input VA @ 1500 Input VA @ 2000
Figure 17 Input VA required to energise a 600 mm x 10 mm ring (plus cathode) atdifferent water conductivity values (100 µScm-1 to 2000 µScm-1)
R&D TECHNICAL REPORT W2-076/TR 21
If using pdc, input VA is proportional to the duty cycle being used. Required input VA for pdcwaveforms can therefore be calculated. Where pulse box output is only shown as pulse width(milliseconds) Appendix III can be used to ascertain the duty cycle (to the nearest 5%) fordiffering frequencies and pulse widths.
The relationship between input VA required and input voltage, electrode diameter, waterconductivity and duty cycle has been modelled for ring shaped anodes and can be representedby the equation:
DCPRcRa
VInputVA *100*1*
2
+
= Equation 14
For water depth of 500 mm
wCDRa *350
)(*1.1956 72.0−
= Equation 15
and
wCCrRc *350
= Equation 16
Where: V = applied voltage applied at anodeRa = Anode resistanceRc = Cathode resistanceDC = % Duty Cycle (if pdc is used)Cw = Ambient Conductivity of the waterCr = Cathode resistance @ 350 µScm-1 (from Appendix II)P = Power conversion factor (0.6)
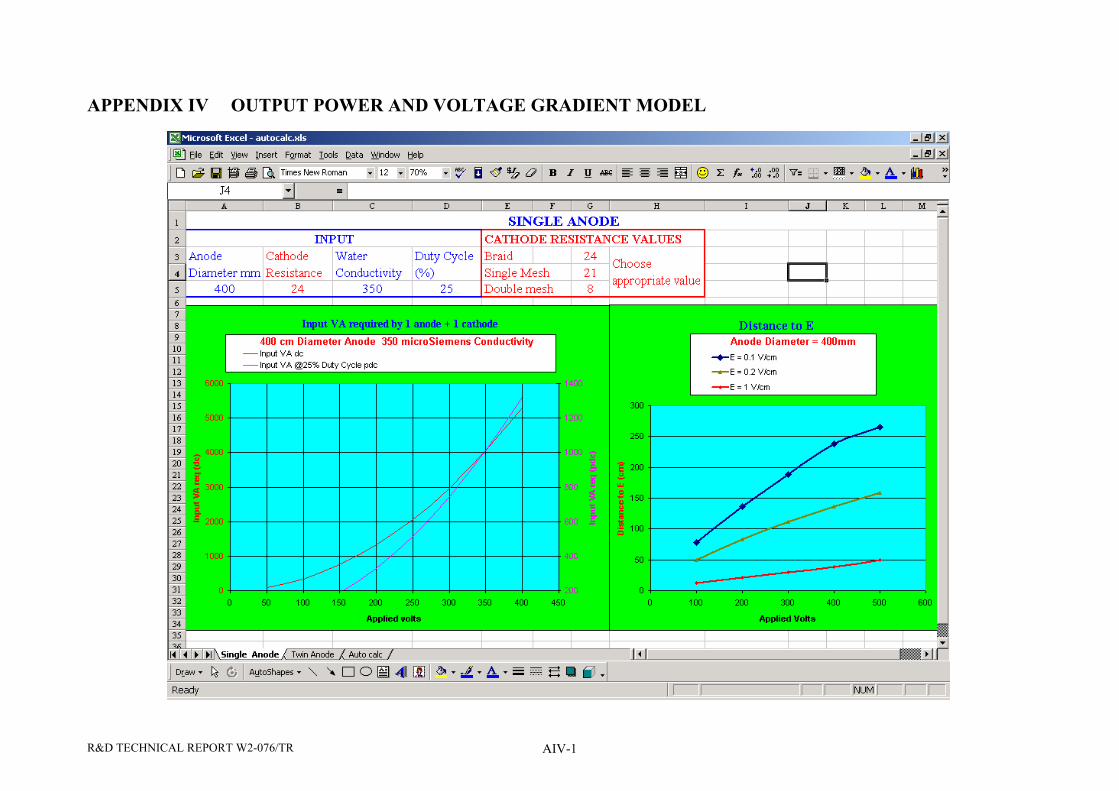
Equations 14 to 16 have been combined into an Excel spreadsheet (Appendix IV) where,when input variables are entered, the input VA for both dc and pdc output are automaticallycalculated.
This spreadsheet has also been extrapolated to twin anode situations by using the equation forcalculating resistance in parallel circuits.
21
1 *ReqRRRR r
+= Equation 17
Where Req = circuit resistanceR1 = equivalent resistance of anode 1R2 = equivalent resistance of anode 2
In reality actual measurements of twin anode circuits result in measurements slightly higherthan that predicted by theory. This is due to electrical coupling between the electrodes:electrical theory assuming perfect isolation of each resistor whereas in realty the twin anodesare often in relatively close proximity to each other.
For all the above spreadsheet calculations choice of cathode design is limited to either the750 mm copper braid, a single 500 x 500 mm mesh sheet or a double 500 x 500 mm meshsheet. It has been assumed that twin cathodes will also be used for the twin anode situation.
R&D TECHNICAL REPORT W2-076/TR 22
3.3 Voltage Gradient (E)
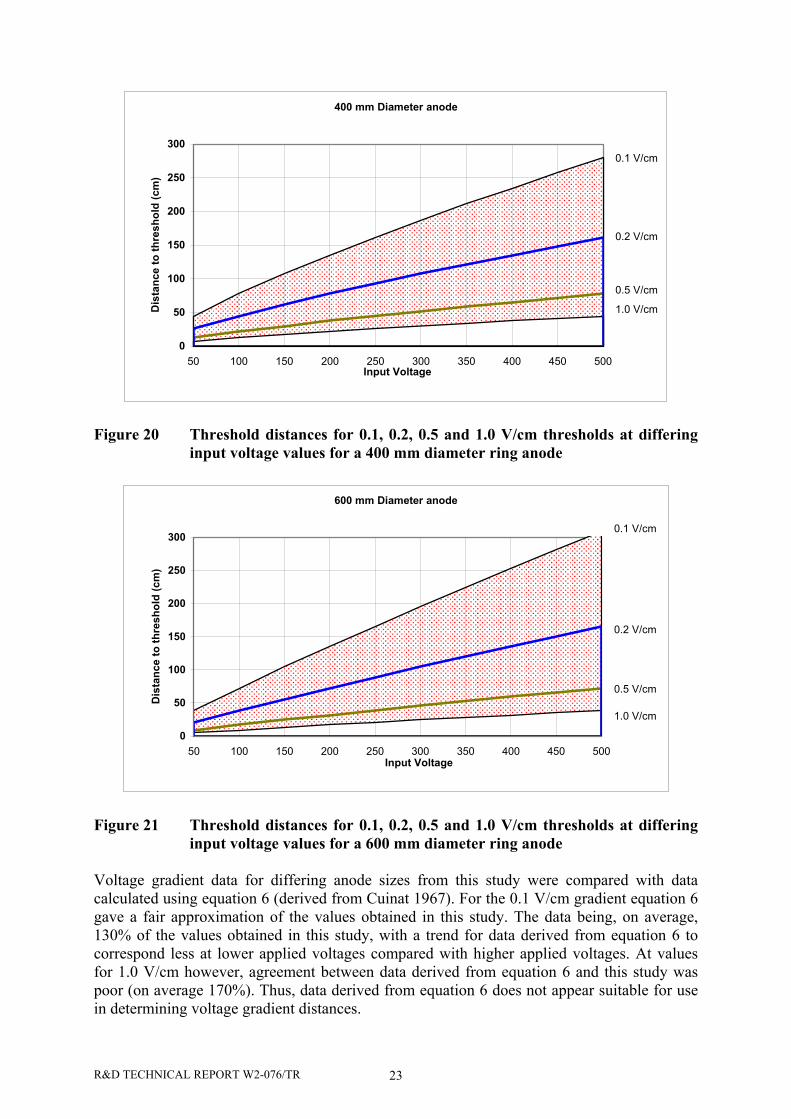
Voltage gradients were measured from 100 mm, 200 mm, 400 mm and 600 mm diameter ringelectrodes (with 750 mm braid cathode positioned at right angles to the measured axis). Thesedata were extrapolated for a range of input voltage values. Values for the threshold values of0.1 V/cm (commonly considered the lower limit for dc taxis), 0.2 V/cm, 0.5 V/cm and1.0 V/cm (commonly considered the threshold at which dc tetanus occurs) are shown infigures 18 – 21.
Figure 21 Threshold distances for 0.1, 0.2, 0.5 and 1.0 V/cm thresholds at differinginput voltage values for a 600 mm diameter ring anode
Voltage gradient data for differing anode sizes from this study were compared with datacalculated using equation 6 (derived from Cuinat 1967). For the 0.1 V/cm gradient equation 6gave a fair approximation of the values obtained in this study. The data being, on average,130% of the values obtained in this study, with a trend for data derived from equation 6 tocorrespond less at lower applied voltages compared with higher applied voltages. At valuesfor 1.0 V/cm however, agreement between data derived from equation 6 and this study waspoor (on average 170%). Thus, data derived from equation 6 does not appear suitable for usein determining voltage gradient distances.
R&D TECHNICAL REPORT W2-076/TR 24
3.4 Novel Anode Assessment
An assessment of the ergonomics of using the novel anode design showed that whilst the sizeof the electrode was not a problem and in use, the anode design had some advantages over theusual anode design (lack of rotational force) the design was too heavy to use for electricfishing. A construction using thin walled stainless steel or aluminium tube may overcome thisproblem.
R&D TECHNICAL REPORT W2-076/TR 25
4. DISCUSSION
The graph of voltage gradient between the 600 mm electrodes (Figure 8) indicated minimalinter-electrode coupling was taking place. However some of the voltage gradient results fromthe 600 mm electrodes show readings less than would be anticipated by comparison with theresults of the smaller electrodes (Figure 21). If some inter-electrode coupling were takingplace then this would also have had an effect on the current readings when measuring theequivalent resistance values of the large electrodes (see Figure A3.7 in Beaumont et al. 2002regarding current values at low inter-electrode separation). No such effect was apparenthowever (Figures 9 and 10) thus indicating that if electrode coupling was occurring its effectwas minimal.
The effect of anode gauge thickness was not significant over the range of thicknessesmeasured. However there was some effect of depth on the measured resistance. Novotny andPriegel (1974) recommend doubling the equivalent resistance of an electrode measured at thesurface to correct for surface effect. At the two depths used in this report however the deepermeasurements were only 70% of the surface measurements. This discrepancy is to beexpected as Novotny and Priegel’s data refer to electrodes only being half submerged whereasin this work the “surface” measurements were taken with the electrodes completelysubmerged. Data from the 500 mm depth have been used in the subsequent extrapolation ofdata as the data both more realistically represents the depth at which an anode is held duringelectric fishing and because they provide a “worse case” scenario for determining powerrequirements (the lower the equivalent electrode resistance the more power is required).
Results from this study show that the variation of equivalent resistance of electrodes withdiameter can be described by a power law equation (p=<0.001). Further, it has been shownthat neither the Novotny and Priegel (1974) equation nor the variation of that equationdescribed in Kolz et al. (1998) are particularly accurate in determining actual equivalentresistance values. The fact that the graphic calculation of f(γ) for most ring electrode sizes incommon use requires interpretation of the far left hand side of the graph (Figure 1) can onlyadd to the likelihood of error using this method. The application of a simple conductivitycorrection to the relationship found in this study will allow a more accurate determination oftheoretical values to be obtained for any diameter of anode in any water conductivity.
Equivalent resistance of the single mesh sheet and the braid were very similar this is incontrast to Beaumont et al. (2002) where it was found that generally braid cathodes had a farmore intense voltage gradient than mesh cathodes. The reason for the discrepancy between thetwo findings is not certain but could be due to the differing mesh size and overall size of thevarious types of cathode used in the two studies. It should also be noted that Beaumont et al.(2002) measured voltage gradient and whilst low gradients should be associated with lowequivalent resistance, the physical shape of the electrode will affect the gradient far more thanthe equivalent resistance.
The equivalent resistance of the twin mesh cathode configuration was greater than predictedfrom resistance theory. This was probably due to inter-electrode coupling at the 500 mmseparation used.
The input power requirement for different anode diameters at different applied dc voltages hasbeen modelled and is presented in a series of “look-up” graphs. From these it is possible toascertain the size generator required to power the electric fishing system (assuming a standardbraid cathode and 0.6 Power Factor conversion) at different input voltage values at a range of
R&D TECHNICAL REPORT W2-076/TR 26
different water conductivities. Whilst figures shown represent power required when using dc,the percentage of the power being used by pdc can be determined by applying a correction tothe dc data based on the percentage of the power (% duty cycle) being used when compared todc. Graphs have been truncated at 7.5 kVA as this represents the maximum generator size(based on weight and physical size of generator) it is feasible to use in a “field” situation (andthen only in boat mounted situation). Few Agency fishery groups have generators above 3kVA however (Beaumont et al. 2002) and for practical purposes where manual transportationis used a 3 kVA generator (dry weight c.60 Kg) should probably be used as an upper limit forgenerator size.
Power input required to operate electric fishing gear using standard anode and cathode designsand dc waveform is very high. If 3.0 kVA is the likely upper limit of generator size suitablefor portable field use and 250 V input the likely minimum applied voltage required, a waterconductivity of 500 µS-1 is the probable upper limit for dc electric fishing (using a single 400mm diameter anode and 750 mm braid cathode).
Voltage gradients of four different diameters of simple anode design at different input voltagevalues have been determined. Values for 0.1 V/cm, 0.2 V/cm, 0.5 V/cm and 1.0 V/cm havebeen used as threshold values as these encompass the published data regarding the minimum(0.1 V/cm) and maximum (1.0 V/cm) values that should be used for dc electric fishing(Lamarque 1967, Cuinat 1967, Kolz and Reynolds 1989, Kolz et al. 1998). Note however thatdata on voltage gradients required for pdc electric fishing indicate that higher gradients maybe required for this waveform compared to dc fields. Measurements were taken using a simplestainless steel anode with a 750 mm copper braid cathode.
It should be noted that the voltage gradient at a point near to an electrode in a given waterconductivity is dependant upon the total current flowing through the electrode. If the totalcurrent is reduced, then the voltage gradient will also be reduced. Such a reduction in currentcould be achieved either by reducing the applied voltage, or by increasing the resistance of theother electrode. Thus, the voltage gradient adjacent to an anode would, in general, change ifthe cathode geometry (and hence resistance) changed. In the ideal electric fishing scenario, thecathode resistance is very much less than the anode resistance hence, small changes in thecathode resistance would have little effect on the total current or on the voltage gradient closeto the anode. The use in this study of the simple anode design and relatively standard cathodehowever should minimise differences for most UK applications.
Over a range of voltage gradient thresholds data calculated using equation 6 (derived fromCuinat 1967) showed poor agreement with the data obtained from the measured andcalculated values from this study. Values derived from equation 6 ranged between 130% ofthis study’s findings (for 0.1 V/cm gradient) to 170% for the 1.0 V/cm gradient threshold.
Data from this study have been incorporated into a spreadsheet model that graphicallydisplays input power required and anode voltage gradient thresholds (E). On inputting detailsof anode diameter, cathode type, output voltage required and duty cycle, an output of thepower required to energise the fishing system is shown for both dc (the left y-axis of thegraph) and pdc (the right y-axis of the graph) fishing output. The spreadsheet includes twinanode (and twin cathode) electric fishing systems. Whilst anode resistance is calculated fromthe diameter of the ring, the resistance value for the cathode (two cathodes for the twin anodecalculations) is entered from a list of values for differing cathode types.
R&D TECHNICAL REPORT W2-076/TR 27
Information regarding anode voltage gradient for the chosen anode size is shown on a separategraph and shows the distance to the 0.1 V/cm, 0.2 V/cm and 1.0 V/cm thresholds.A disc containing the spreadsheet is incorporated into the report together with screen grabs ofthe spreadsheet (Appendix IV). The spreadsheet requires Microsoft Excel® to run.
The results from this study gives information that both elucidates equivalent resistance valuesfor a size range of electrodes and gives information about specific anode designs currently inuse in the UK. Measurements have been taken at depths that represent the real life situation ofelectric fishing and thus results are directly applicable to the type of classical electric fishingused by researchers and managers. The results allow equivalent electrode resistance to becalculated with a high degree of certainty without recourse to graphic extrapolations. Noevaluations of “Wisconsin ring” designs of anode have been undertaken: these are oftenunique in their design and thus require measuring empirically.
Data from this study now make it possible to predict with a high degree of certainty the likelydistance to specific voltage gradient thresholds. However, whilst a reasonable amount of dataexists regarding the dc voltage gradient thresholds required to elicit a response from a fish,little is known about what those values (to maximise fish capture and minimise fish injury)should be for pdc. With dc fields being impractical to use in water conductivity of abovec. 500 µScm-1 (due to high power requirements) research on thresholds required for pdc isurgently required.
R&D TECHNICAL REPORT W2-076/TR 28
5. REFERENCES
Beaumont W R C, Taylor A A L, Lee M J and Welton J S. (2002) Guidelines for ElectricFishing Best Practice. Report to Environment Agency 179pp EA Technical ReportW2-054/TR
Cuinat R (1967) Contribution to the study of physical parameters in electrical fishing in riverswith direct current. In: Fishing with electricity: Its application to biology and managementEd R Vibert. Fishing News Books pp 131-171.
Kolz A L and Reynolds J B (1989) Electrofishing, A Power Related Phenomenon US Fishand Wildlife service. Fish and Wildlife Technical Report 22 pp 1-25.
Kolz A L (1993) In-water Electrical Measurements for Evaluating Electrofishing. US Fish andWildlife service. Fish and Wildlife Technical Report 11 pp 1-26.
Kolz A L, Reynolds J, Temple A, Boardman J and Lam D (1998) US Fish and WildlifeService National Conservation Training Centre. Branch of Aquatic Resources Training
Lamarque P (1967) Electrophysiology of fish subject to the action of an electric field. In:Fishing with electricity: Its application to biology and management Ed R Vibert Fishing NewsBooks pp 65-89.
Novotny D W and Priegel G R (1974) Electrofishing boats. Improved designs and operationalguidelines to increase the effectiveness of boom shockers. Tech. Bull. 74. Dep. NaturalResources Madison Wisconsin
R&D TECHNICAL REPORT W2-076/TR AI-1
APPENDIX I MEASURED ELECTRODE EQUIVALENT RESISTANCE VALUES


![Numerical investigation on ballistic resistance of ... · Numerical investigation on ballistic resistance of aluminium 53 In the corresponding study by Holmen et al. [27] perforation](https://static.documents.pub/doc/80x56/5fbfd4d3bb596232b845c4d2/numerical-investigation-on-ballistic-resistance-of-numerical-investigation-on.jpg)


