Page 1
AN INVESTIGATION OF THE INTERNET BANKING (IB) ADOPTION,
USE, AND SUCCESS IN SAUDI ARABIA (SA)
A Thesis
Submitted for the degree of
DOCTOR OF PHILOSOPHY
IN THE FACULTY OF MANAGEMENT
BY
Mohammed Eid Al-Qahtani
Business School Department
Hull University
Hull, UK
May, 2014
© (Mohammed E. Al-Qahtani), 2014
All rights reserved
Page 2
II
Dedication
"O my Lord! Let my entry be by the Gate of Truth and Honour, and likewise my exit by the Gate of Truth and Honour; and grant me from
Thee an authority to aid (me)." (Holy Quraan 017.080)
(May God Almighty rest his soul in peace).
To
My Parents (who passed away without seeing this
achievement), Wife, Son, Daughters and all my Brothers and Sisters
Page 3
III
Acknowledgment
Upon to the completion of this research, I am grateful to a number of people, as without
their help; hardly would I finish the work. Due to that, I would like to thank the following
people, as they have a great contribution to this research.
First, I am grateful to my most supervisor Dr Dimitrios Tsagdis senior lecturer and Director
of the research Centre for Regional and International Business at Hull University Business
School, for his tolerance and high level of freedom that he granted me. He has spent his
precious time to discuss and to make valuable comments on the project, from an earlier
model of the study, through the questionnaire and the writing of this thesis. He gave his
valuable advice and guideline generously at all times. I also wish to thank my second
supervisor Professor John Reast as well as the examiners of my thesis Professor G. de
Zeeuw and Professor Chanaka Jayawardhena for their valuable comments.
I am also grateful to my wife, for her great support during the period of my PhD. She has
spent the time, day and nights, standing beside me encouraging and motivating me to
overcome the obstacles and increase my performance. I am also grateful to all my brothers
and sisters who provided me with their emotional and moral support.
A special thanks to Mr. Hussam Haddad the general director of Al-Wahda Express Saudi
Company for their participation in the field work of this research. Mr. Haddad has provided
his great and unreserved support in collecting the required data for this research. Many
thanks also go to Al-Wahda Express employees in the central and eastern province who
provided their help and support as and when it was needed.
I am also grateful to Dr. Faisal Mohammed Al-Muhanna Abalkhail the Cultural Attache of
the Saudi Embassy and the academic advisors in the Saudi Cultural Bureau in London for
their continued support. Many thanks also go to the many friends and associates over the
past four years in the banking, private and the government sectors who provided moral
support, insightful comments and sharp wit when they were most needed. Finally, I would
like to thank all the respondents for giving their valuable time and information in this
research. Without their co-operation, the research would not have been possible.
Mohammed E. Al Qahtani
May, 2014
Page 4
IV
Abstract
This thesis attempts to empirically investigate the different factors that have relation with the
adoption, use and success (Dependent variables) of Internet Banking (IB). It extended the
previous marketing literature and TAM model by investigating different factors that might
have relationship with the adoption and use of the IB. In addition to that, and since the
success of IB has not been found in the reviewed literature, this study introduces the success
variable following the DeLone and McLean (2003) IS success model. This thesis responds to
several researchers’ calls by conducting an investigation in Saudi Arabia (SA), where it has
special socio-economic motives and social values such as Islamic Banking (IsB).
The data of this study were collected through a survey (postal questionnaires), sample
(n=1000), which has been conducted randomly using SA’s Residential Telephone Directory.
A total of 228 usable questionnaires were returned (22.8% response rate). The data were
analysed using descriptive statistics method, and a factor analysis was also used to classify
the variables into a set of dimensions. Moreover, multiple regression analysis was performed
to test the research hypotheses. As a result, the researches’ models of adoption, use and
success have shown high, good and fair prediction powers (R²=62%, 39.4% and 30%,
respectively), which are comaparable to other studies in the area.
The research findings suggest that awareness, resistance to change, satisfaction, perceived
ease of use, self-efficiency, high cost, availability of IsB services online, and income
(independent variables) were affecting the IB customers’ adoption, use and success in
different degrees. The awareness and self-efficiency of the IB were found to significantly
affect the adoption of IB, whereas self-efficiency and satisfaction “convenience”
significantly affect the use of IB. However, frequency and wide range of the used IB
services, satisfaction “time saving and customers’ needs fulfilment”, income and the
availability of IsB services were found to also affect the success of the IB services.
Surprisingly, the research findings indicate that security does not contribute significantly to
the adoption, use, and success of IB services and that is due to some reasons which is
recommended for future studies. It is also essential to highlight that IB customers’
satisfaction was found to be a very significant factor in motivating the new adopters to use
the services frequently, which will lead to a successful competitive performance. This thesis
concludes with implications for researchers, practitioners, and policy makers in addition to
research limitations and recommendations for future studies.
Page 5
V
Table of Content
Dedication ......................................................................................................................... II
Acknowledgment ............................................................................................................. III
Abstract ............................................................................................................................ IV
Table of Content ............................................................................................................... V
List of Tables .................................................................................................................... X
List of Figures ................................................................................................................ XII
List of Acronyms .......................................................................................................... XIV
Chapter One: Introduction .............................................................................................. 1
1.1 Research Background ................................................................................................... 1
1.2 Background of SA......................................................................................................... 3
1.2.2 SA Demographics Background...............................................................................5
1.3 E-Banking ..................................................................................................................... 9
1.4 Internet Banking (IB) .................................................................................................. 11
1.5 IB in SA ...................................................................................................................... 14
1.6 The Importance of the Study....................................................................................... 17
1.7 Research Questions ..................................................................................................... 22
1.8 Research Aims and Objectives ................................................................................... 23
1.9 Research Methodology ............................................................................................... 23
1.10 Thesis Structure ........................................................................................................ 25
Chapter Two: Literature Review and Hypotheses Development ............................... 28
2.1 Introduction ................................................................................................................. 28
2.2 Models, theories and customer attitudes towards IT .................................................. 29
2.2.1 Consumer Behaviour Matrix .................................................................................30
2.2.2 Hoxmeier Model ...................................................................................................31
2.2.3 Theory of Reasoned Action (TRA).......................................................................32
2.2.4 Technology Acceptance Model (TAM) ................................................................34
2.2.5 DeLone and McLean’s (D & M) Model of IS Success ........................................36
2.3 Customer Attitudes towards IT and IB ....................................................................... 37
2.3.1 Attitudes towards IT and IB in SA .......................................................................37
2.3.2. Attitudes towards IT and IB in Developing Economies ......................................42
Page 6
VI
2.3.3 Attitudes towards IT and IB in Developed Economies ........................................48
2.4 The Research's Conceptual Model and Hypotheses Development ............................. 59
2.4.1 Research Conceptual Model Development ...........................................................59
2.4.2 Research Hypotheses ............................................................................................64
2.4.2.1 Awareness ......................................................................................................64
2.4.2.2 Resistance to change ......................................................................................65
2.4.2.3 Self-efficiency ................................................................................................66
2.4.2.4 The availability of infrastructure ...................................................................67
2.4.2.5 Security ..........................................................................................................68
2.4.2.6 High Cost .......................................................................................................70
2.4.2.7 Satisfaction .....................................................................................................71
2.4.2.8 Perceived ease of use .....................................................................................73
2.4.2.9 Perceived usefulness ......................................................................................74
2.4.2.10 Availability of online IsB.............................................................................76
2.4.2.11 Demographic factors (Age, Education and Income) ....................................77
2.4.2.12 Adoption, Use and Success facets ...............................................................78
2.5 Chapter summary ........................................................................................................ 84
Chapter Three: Banking Industry and IB Issues ........................................................ 88
3.1 Introduction ................................................................................................................. 88
3.2 The Changing Nature of the Banking Sector .............................................................. 89
3.2.1 External Forces .....................................................................................................90
3.2.2 Internal Forces ......................................................................................................92
3.3 SA Economic Background .......................................................................................... 95
3.4 Financial Services History in SA ................................................................................ 98
3.4.1 SA Monetary Agency (SAMA) “The Central Bank” ...........................................98
3.4.2 The Saudi Stock Market......................................................................................101
3.5 Islamic Banking (IsB) ............................................................................................... 104
3.6 ICT Evolution in SA ................................................................................................. 107
3.6.1 ICT (Computer, Telephone and Mobile) Diffusion in SA ..................................110
3.6.2 Internet Service Diffusion in SA.........................................................................112
3.7 Chapter Summary ..................................................................................................... 122
Chapter Four: Research Methodology ....................................................................... 125
4.1 Introduction ............................................................................................................... 125
Page 7
VII
4.2 Research aim and objectives ..................................................................................... 125
4.3 Key research questions ............................................................................................. 126
4.4 Research philosophy and methodology .................................................................... 127
4.5 Research design ........................................................................................................ 133
4.6 Research Population.................................................................................................. 134
4.7 Sampling ................................................................................................................... 135
4.8 Data Collection Methods .......................................................................................... 138
4.9 Data coding and processing ...................................................................................... 141
4.10 Dealing with Missing Data ..................................................................................... 142
4.11 Questionnaire Construction and Pre-Testing .......................................................... 144
4.11.1 Question Types and Formats ............................................................................144
4.11.2 Questionnaire Pre-Testing and Pilot Work .......................................................147
4.11.3 The Covering Letter ..........................................................................................148
4.11.4 Content of the Questionnaire ............................................................................150
4.12 Administrating the Questionnaire and Response Profile ........................................ 151
4.13 Reliability and validity ............................................................................................ 152
4.13.1 Reliability ..........................................................................................................153
4.13.2 Validity .............................................................................................................155
4.13.2.1 Constructs Discriminant Validity ..............................................................157
4.13.2.2 Construct Operationalisation and Measurement ........................................159
4.13.2.3 Common Method Variance (CMV) ...........................................................160
4.13.2.4 Reflective and Formative measures ...........................................................165
4.14 Validity of statistical methods of data analysis....................................................... 169
4.14.1 Descriptive statistics: frequencies and means ...................................................170
4.14.2 Descriptive analysis of research variables ........................................................170
4.14.3 Common Method Bias statistical Test Methods ...............................................172
4.14.4 Inferential statistics: reliability, factor, correlation, and MR analysis ..............174
4.15 Chapter Summary ................................................................................................... 177
Chapter Five: Descriptive Statistics and Discussion.................................................. 180
5.1 Introduction ............................................................................................................... 180
5.2 Sample Characteristics .............................................................................................. 180
5.2.1 Demographic Characteristics ................................................................................. 181
5.2.1.1 Gender ..........................................................................................................182
Page 8
VIII
5.2.1.2 Age ...............................................................................................................183
5.2.1.3 Respondents’ income ...................................................................................184
5.2.1.4 Educational level ..........................................................................................186
5.2.1.5 Occupation ...................................................................................................188
5.2.1.6 Ability to use a computer .............................................................................190
5.2.1.7 Access to the internet ...................................................................................191
5.2.1.8 Field of study ...............................................................................................192
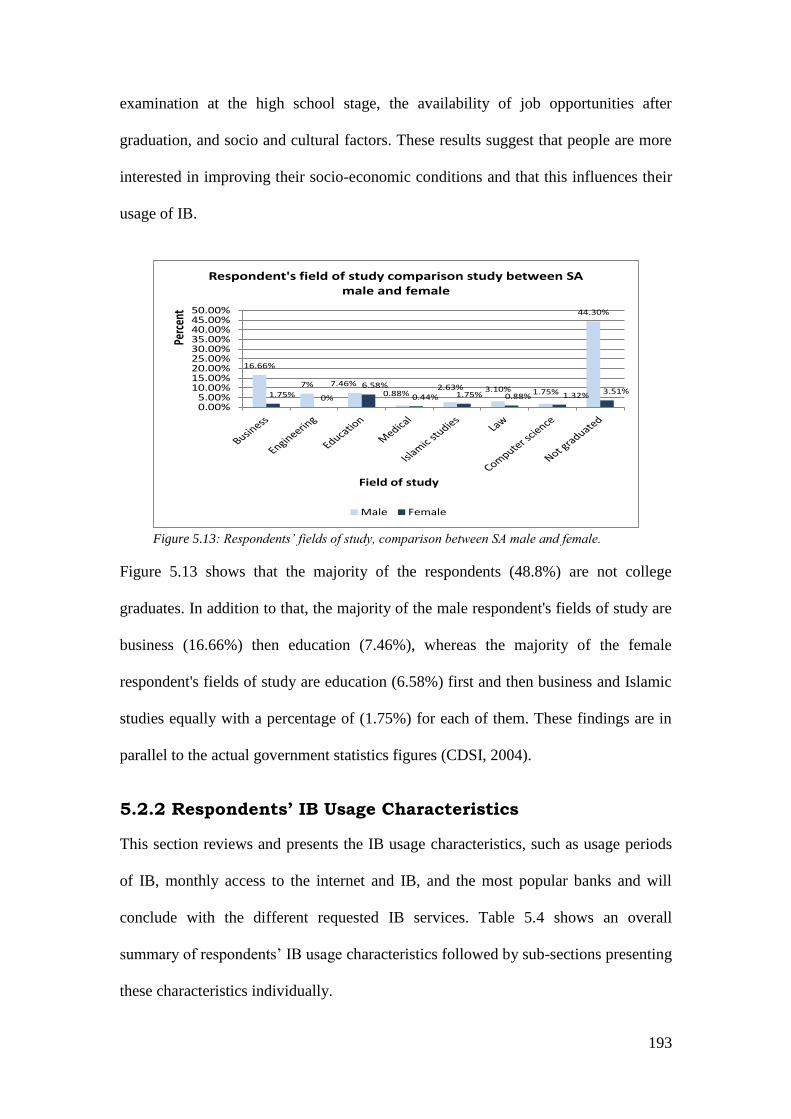
5.2.2 Respondents’ IB Usage Characteristics ................................................................. 193
5.2.2.1 Usage period of the internet .........................................................................195
5.2.2.2 Access to the internet monthly .....................................................................196
5.2.2.3 Banks............................................................................................................196
5.2.2.4 Usage period of IB (Adoption) ....................................................................198
5.2.2.5 Access to IB monthly (Use) .........................................................................199
5.2.2.6 Access to IB in the future.............................................................................199
5.2.2.7 Reasons for using IB (Success)....................................................................200
5.2.3 Demographic Characteristics of Adoption, Use & Success................................... 201
5.3 Chapter Summary ..................................................................................................... 204
Chapter Six: Inferential Statistics and Discussion ..................................................... 206
6.1 Introduction ............................................................................................................... 206
6.2 Testing of Research Hypotheses ............................................................................... 206
6.2.1 Factor Analysis ...................................................................................................206
6.2.1.1 Satisfaction of IB Services ...........................................................................206
6.2.1.2 Perceived usefulness of IB services .............................................................207
6.2.1.3 Perceived ease of use of IB services ............................................................207
6.2.1.4 Security of IB services .................................................................................208
6.2.1.5 Awareness ....................................................................................................208
6.2.1.6 Self-efficiency ..............................................................................................209
6.2.1.7 Availability of infrastructure........................................................................209
6.3 Testing the hypotheses: factors relating to IB adoption ............................................ 210
6.4 Testing the hypotheses: factors relating to the IB use .............................................. 225
6.5 Testing the hypotheses: factors relating to IB success .............................................. 237
6.6 Findings and Discussion ........................................................................................... 249
6.7 Chapter Summary ..................................................................................................... 257
Page 9
IX
Chapter Seven: Conclusion and Implications ............................................................ 259
7.1 Introduction ............................................................................................................... 259
7.2 Discussion and summary of main findings ............................................................... 262
7.2.1 Market status of IB services in SA .....................................................................262
7.2.2 IB adoption: The Key Relations .........................................................................263
7.2.3 IB Use: The Key Relations .................................................................................264
7.2.4 IB Success: The Key Relations ...........................................................................266
7.3 Internal validity ......................................................................................................... 269
7.4 External Validity ....................................................................................................... 272
7.5 Research Contribution .............................................................................................. 278
7.6 Implications of research findings for knowledge ...................................................... 282
7.6.1 Implications for Policy Makers ...........................................................................282
7.6.2 Implications for Practice .....................................................................................285
7.6.3 Implications for Academic Research ..................................................................290
7.7 Limitations and further research agenda ................................................................... 292
References ...................................................................................................................... 298
APPENDICES ............................................................................................................... 332
APPENDIX A ................................................................................................................ 333
APPENDIX B ................................................................................................................ 338
APPENDIX C ................................................................................................................ 348
APPENDIX D ................................................................................................................ 352
APPENDIX E ................................................................................................................. 356
APPENDIX F.................................................................................................................. 360
APPENDIX G ................................................................................................................. 364
APPENDIX H ................................................................................................................. 366
APPENDIX I .................................................................................................................. 369
APPENDIX J .................................................................................................................. 371
APPENDIX K ................................................................................................................. 386
Page 10
X
List of Tables
Table 1.1: Saudi businesswomen barriers in SA ................................................................ 6
Table 1.2: Average wages, in Saudi Riyal (SR), in SA during the period (1994-2008)..... 8
Table 1.3: Summary of the benefits and problems associated with IB from the literature13
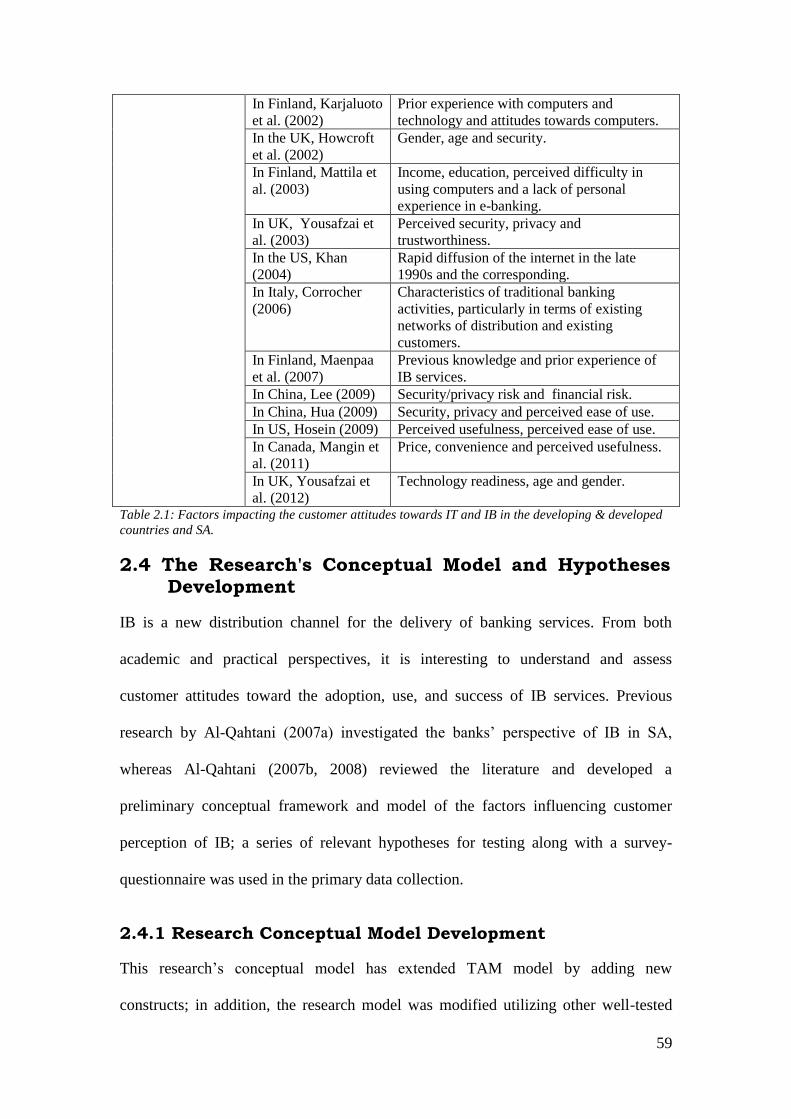
Table 2.1: Factors impacting the customer attitudes towards IT and IB in the developing
& developed countries and SA. ...................................................................... 59
Table 3.1: GDP growth, inflation and unemployment rates for SA (2000-2011). ........... 96
Table 3.2: Saudi-listed companies and number of shares issued (1990-2011). .............. 103
Table 3.3: Direct and Indirect IT Market Drivers and Barriers in SA. ........................... 109
Table 3.4: SA main historical development internet events. .......................................... 113
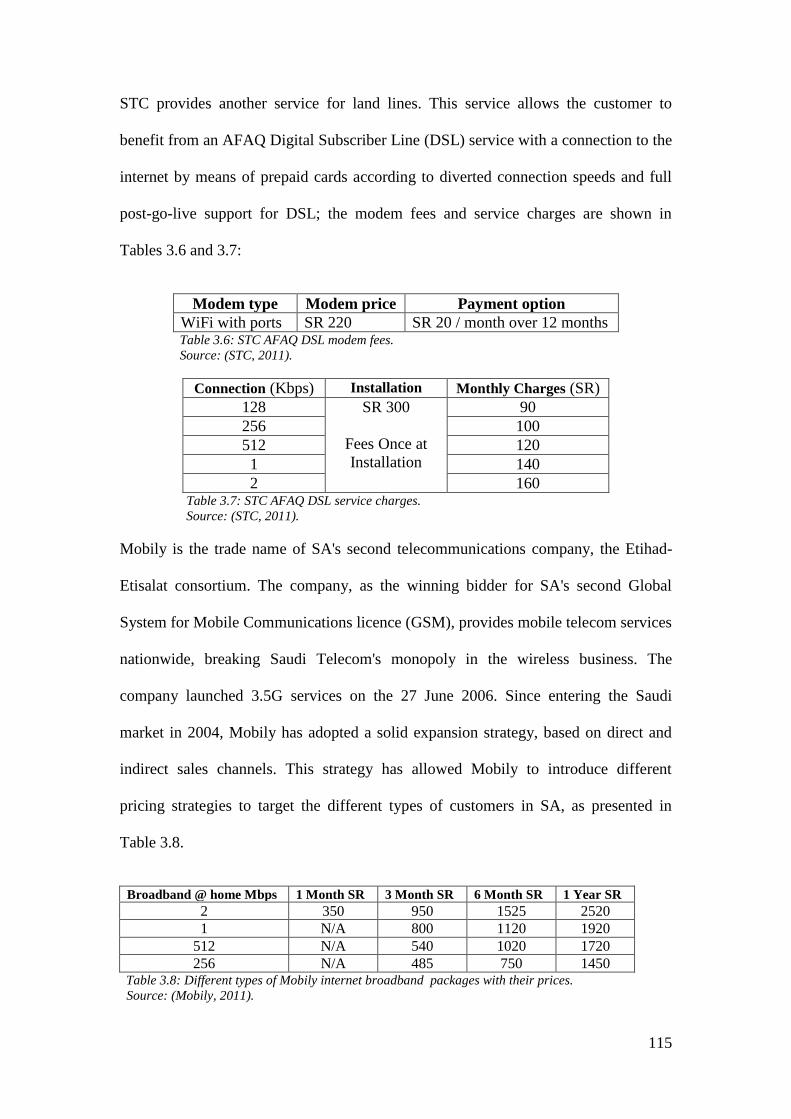
Table 3.5: Different types of STC internet broadband packages with their prices ........ 114
Table 3.6: STC AFAQ DSL modem fees. ...................................................................... 115
Table 3.7: STC AFAQ DSL service charges. ................................................................. 115
Table 3.8: Different types of Mobily internet broadband packages with their prices. .. 115
Table 3.9: Different types of Zain internet broadband packages with their prices ......... 116
Table 3.10: The internet penetration rate in SA, GCC and other countries, as end of 2010.
....................................................................................................................... 117
Table 4.1: Contrasting implications of positivism and social constructionism. ............. 128
Table 4.2: Examples of previous studies used postal survey, with different response rates
and different countries .................................................................................. 138
Table 4.3: Survey response profile. ................................................................................ 152
Table 4.4: Cronbach’s alpha values for the research independent variables .................. 154
Table 4.5: T-Test two mean comparison between early and late respondents. .............. 155
Table 4.6: Constructs Discriminant Validity .................................................................. 159
Table 4.7: Natures of reflective and formative constructs .............................................. 166
Table 4.8: Descriptive statistics for research variables (N = 228). ................................. 171
Table 5.1: SA 13 Actual population per provinces and the research’s response rate. .... 181
Table 5.2: Summary of respondents’ demographics. ...................................................... 182
Table 5.3: Ability of respondents to use a computer. ..................................................... 190
Table 5.4: Respondents’ IB usage characteristics........................................................... 194
Table 5.5: Usage period of internet by respondents. ...................................................... 196
Table 5.6: Frequency and percent of access to internet monthly by respondents........... 196
Page 11
XI
Table 5.7: Respondent distribution across the 11 banks ................................................. 197
Table 5.8: Usage period of IB by respondents ................................................................ 198
Table 5.9: Respondents’ access to IB monthly. .............................................................. 199
Table 5.10: Thinking of using IB in the next period. ...................................................... 200
Table 5.11: Reasons for using IB. ................................................................................... 200
Table 5.12: Crosstabulation between number of the used IB services and Satisfaction. 201
Table 6.1: Exploratory factor analysis for satisfaction of IB services. ........................... 207
Table 6.2: Exploratory factor analysis for perceived usefulness of the IB services. ...... 207
Table 6.3: Exploratory factor analysis for perceived ease of use of the IB services. ..... 208
Table 6.4: Exploratory factor analysis for security of the IB services............................ 208
Table 6.5: Exploratory factor analysis for awareness. .................................................... 209
Table 6.6: Exploratory factor analysis for self-efficiency. ............................................. 209
Table 6.7: Exploratory factor analysis for availability of infrastructure ........................ 209
Table 6.8: Factors influencing adoption of IB services. ................................................. 211
Table 6.9: Factors influencing IB services use. .............................................................. 226
Table 6.10: Factors influencing IB service success. ....................................................... 238
Table 6.11: Results of the research hypotheses test. ....................................................... 249
Table 6.12: Variables Sig. and Beta values, comparision between IB adoption, use &
success. ........................................................................................................ 250
Table 7.1: Factors affecting the adoption, use and success of IB services. .................... 273
Page 12
XII
List of Figures
Figure 1.1: SA 13 Provinces ............................................................................................... 4
Figure 1.2: Communication methods and access devices in e-banking............................ 10
Figure 1.3: Virtual reality: The need for human contact for financial services ................ 11
Figure 2.1: Consumer behaviour matrix. ......................................................................... 30
Figure 2.2: Email attitudes and confidence ....................................................................... 32
Figure 2.3: The Theory of Reasoned Action (TRA). ........................................................ 32
Figure 2.4: The Technology Acceptance Model (TAM). ................................................. 34
Figure 2.5: D & M IS Success Model. .............................................................................. 37
Figure 2.6: Unified Theory of Acceptance and Use of Technology (UTAUT). ............... 40
Figure 2.7: IB Acceptance Model (IBAM). ...................................................................... 41
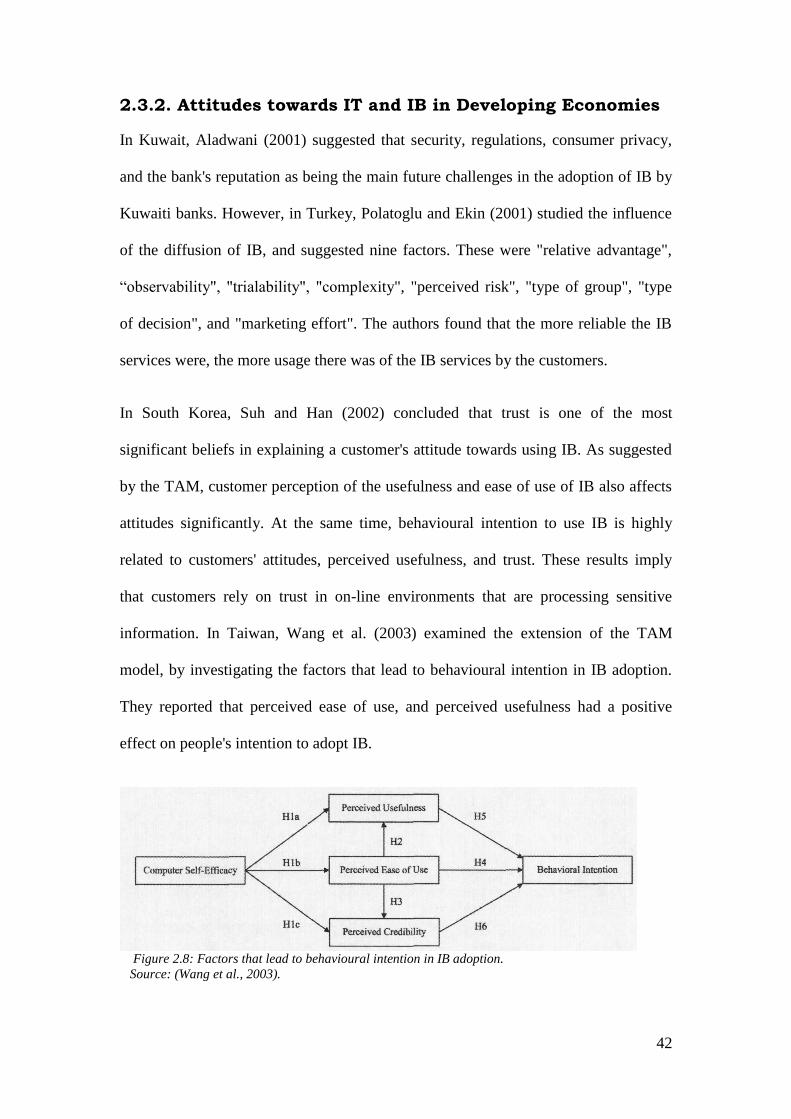
Figure 2.8: Factors that lead to behavioural intention in IB adoption. ............................. 42
Figure 2.9: Factors influencing the adoption of IB in Tunisia. ......................................... 46
Figure 2.10: Sathye’s model of IB adoption. .................................................................... 49
Figure 2.11: A model for IB adoption. ............................................................................. 51
Figure 2.12: Pikkarainen et al.’s model of IB use............................................................. 53
Figure 2.13: Lichtenstein and Williamson’s model of IB adoption. ................................. 54
Figure 2.14: Updated D & M IS Success Model. ............................................................. 61
Figure 2.15: Conceptual Model of the factors influencing IB adoption, use, and success.
......................................................................................................................... 63
Figure 3.1: The banking services sector and interaction with forces ................................ 90
Figure 3.2: Monthly Crude Oil Prices with the adjusted inflation (1946-2010) ............... 97
Figure 3.3: Global prosperity performance growth of real GDP per capita adjusted in PPP
terms, CAGR (1998-2007).............................................................................. 98
Figure 3.4: The SAMA system . ...................................................................................... 99
Figure 3.5: Saudi market index (TASI) levels and traded values year ends (2000-2011).
....................................................................................................................... 103
Figure 3.6: Telephone line growth in SA (2001-2011 3Q). ............................................ 111
Figure 3.7: Mobile Penetration in SA (2001-2011 3Q). ................................................. 112
Figure 3.8: Internet infrastructure in SA. ........................................................................ 113
Figure 3.9: Internet penetration in SA (2001-2011 3Q). ................................................ 117
Figure 3.10: Number of the registered domain names in SA as of February 2012 ........ 118
Page 13
XIII
Figure 3.11: Broadband penetration in SA (2004-2011 3Q). ......................................... 119
Figure 3.12: Saudi attitudes toward internet content. ..................................................... 120
Figure 3.13: Saudi usage of internet content. ................................................................. 121
Figure 5.1: Comparison between the SA actual gender and the study respondents’ gender.
....................................................................................................................... 183
Figure 5.2: Respondents’ age. ......................................................................................... 184
Figure 5.3: Comparison between the SA actual population ages and the study
respondents’ ages .......................................................................................... 184
Figure 5.4: Respondents’ Income. .................................................................................. 185
Figure 5.5: Respondents’ educational level. ................................................................... 186
Figure 5.6: Education levels comparison between the SA actual population and study
respondents. .................................................................................................. 186
Figure 5.7: Respondent's education levels comparison between Male and Female.. ..... 187
Figure 5.8: Respondents’ occupations ............................................................................ 188
Figure 5.9: Respondent's occupation comparison between SA male and female ........... 189
Figure 5.10: Respondent ability to use a computer, comparison between male and female.
....................................................................................................................... 190
Figure 5.11: Respondents’ access to the internet (%). .................................................... 191
Figure 5.12: Respondent's access to the internet, comparison between SA male and
female ............................................................................................................ 192
Figure 5.13: Respondents’ fields of study, comparison between SA male and female. 193
Figure 5.14: Percents of respondents that belong for each bank. ................................... 197
Figure 5.15: Gender percentage distribution among Adption, Use and Success ............ 201
Figure 5.16: Age percentage distribution among Adption, Use and Success ................. 202
Figure 5.17: Yearly incom percentage distribution among Adption, Use and Success . 203
Figure 5.18: Education levels percentage distribution among Adption, Use and Success
....................................................................................................................... 203
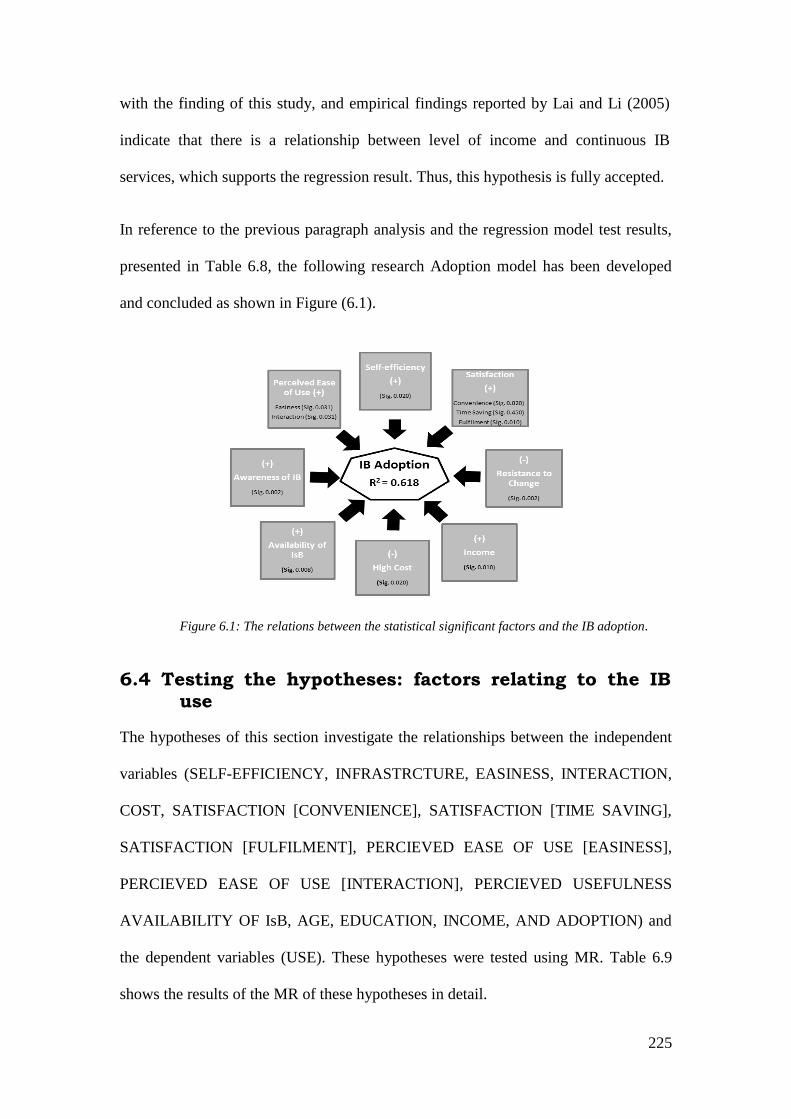
Figure 6.1: The relations between the statistical significant factors and the IB adoption.
....................................................................................................................... 225
Figure 6.2: The relations between the statistical significant factors and the IB use. ..... 237
Figure 6.3: The relations between the statistical significant factors and the IB Success.248
Page 14
XIV
List of Acronyms
ANB: Arab National Bank.
ARBIC: Al Rajhi Banking & Investment Corporation.
ATMs:
AVE:
Automated Teller Machines.
Average Variances Extracted.
AVR: Automated Voice Response.
BI: Behavioral Intention.
BJ: Bank Al-Jazira.
BSF: Banque Saudi Fransi.
CAGR: Compound Annual Growth Rate.
CDSI: Central Department of Statistics and Information.
CIA: Central Intelligence Agency (US).
CITC: Communication and Information Technology Commission (SA).
CMA: Capital Market Authority (SA).
CMV: Common Method Variance.
CRM: Customer Relationship Marketing.
DSL: Digital Subscriber Line.
DW: Durbin-Watson.
EBPP Electronic Bill Presentment and Payment.
EFA: Exploratory Factor Analysis.
ESIS: Electronic Securities and Information System.
FDI: Foreign Direct Investment.
GCC: Gulf Cooperation Council (Bahrain, Kuwait, Oman, Qatar, SA & UAE).
GDP: Gross Domestic Product.
GIH: Global Investment House.
GSM: Global System for Mobile Communications licence.
HSBC: Hong Kong and Shanghai Banking Corporation.
HUBS: Hull University Business School.
IB: Internet Banking.
IBAM: IB Acceptance Model.
ICT: Information and Communication Technology.
IPOs: Initial Purchase Offers.
Page 15
XV
IS: Information System.
IsB: Islamic Banking.
ISPs: Internet Service Providers.
IT: Information Technology.
KACST: King Abdulaziz City for Science and Technology.
KFUPM: King Fahd University of Petroleum and Minerals.
MCIT: Ministry of Communications and Information Technology (SA).
MPTT:
MR:
Ministry of Post, Telegraph and Telephone (SA).
Multiple Regression
MTMM:
NCB:
MultiTrait-Multimethod Matrix
National Commercial Bank (SA).
OB: Online Banking.
PB Per Barrel.
PC: Personal Computer.
PIF: Public Investment Fund (SA).
PPP: Purchasing Power Parity.
RB: Riyad Bank.
SA: Saudi Arabia.
SABB: Saudi British Bank.
SAGIA: Saudi Arabian General Investment Authority.
SAIF: SA Investment Fund.
SAMA: Saudi Arabian Monetary Agency (SA central bank).
SAMBA: Saudi American Bank.
SANCST: Saudi Arabian National Centre for Science and Technology.
SaudiNIC: Saudi Network Information Centre.
SCC: Saudi Communications Commission.
SCF: Survey of Consumers Finances.
SCS: Saudi Computer Society.
SEM: Structured Equation Modelling.
SHB: Saudi Hollandi Bank.
SIB: Saudi Investment Bank.
SN: Subjective Norm.
SR: Saudi Riyal.
Page 16
XVI
SSRC: Saudi Share Registration Company.
STC: Saudi Telecom Company.
SWOT: Strength Weakness Opportunity Threat.
TAM: Technology Acceptance Model.
TPB: Theory of Planned Behaviour.
TRA: Theory of Reasoned Action.
UAE: United Arab Emirates.
UK: United Kingdom.
UN: United Nations.
US: United States.
USA: United States of America.
USD: United States Dollar.
UTAUT: Unified Theory of Acceptance and Use of Technology.
VIF: Variance Inflation Factor.
WTO: World Trade Organization.
WWW: World Wide Web.
Page 17
1
Chapter One
Introduction
1.1 Research Background
In Saudi Arabia (SA), the internet was officially made available in 1998, at which
point the Saudi Arabian government spent two years designing a centralized control
system before offering it for public connection in February 1999. Internet Banking
(IB) has been available in SA since 2001 (Lee & Turban, 2001; Alfuraih, 2002). This
is late compared to other countries in the region, such as Egypt, Kuwait, Bahrain, the
United Arab Emirates (UAE), and Lebanon. Internet technologies necessitated new
laws and regulations, some of which have added new burdens to financial institutions
and the government.
The SA financial services sector has undergone significant changes over the past 30
years. Until the early 1970s, the sector was bound by restrictions imposed by
government regulations (Ramady, 2010). As a consequence, banks in the sector were
severely limited in their capacity to compete both domestically and internationally.
Each organization relied on traditional branch-based networks to deliver financial
services. By the end of the 1990s, most regulations had been changed because the
banking sector had experienced the emergence of faster and cheaper technology. The
convergence of deregulation and information technology (IT) created a highly
competitive environment (Al-Khaldi and Wallace, 1999), and with this, banks in the
sector faced mounting pressure to implement rapid change.
SA is late in IB implementation, as a result a practical need in developing a model for
the best implementation of the IB services in SA. Although various models are
reviewed in Chapter 2; it is necessary to investigate the extent to which gender and
Page 18
2
other demographics or personality traits affect IB adoption behaviours along with
various social, psychological and contextual influences, especially in SA, where such
issues have not previously been addressed (Alsajjan and Dennis, 2010). In addition to
that, the motivation for this research largely came from the need to know how a
unique country (in term of their traditions and social values such as Islamic values) of
SA has adapted to internet technology and particularly to IB.
There are a number of management challenges; government and banks in SA have to
address when implementing IB services in order to encourage the adoption, increase
the use and enhance the success or overcome the problems or failure of IB
implementations. It is important that banks address these issues because the success or
failure of IB ultimately depends on whether customers will utilize this type of banking
channel. The main intention of IB is to be able to provide personalised banking
services to all online customers. In the initial e-banking climate, banks were having
less and less of a relationship with their customers, for example, due to the use of
Automated Teller Machines (ATMs). Hence, IB can be seen as a way of rebuilding
this relationship. As a result, it is very important for banks to develop strategies to
encourage their customers to adopt and use the IB and then to enjoy the success of
their usage of IB. Customers, once they start adopting IB services, need to be
encouraged by banks to re-use the IB service and then they need to be convinced of
the benefits of banking through the internet to enjoy the success of their usage of this
service. Banks also need to identify ways to overcome the barriers, such as the
security concerns of their customers. As IB represents quite a radical change in the
banking industry, banks would need to put in extra effort to encourage customers to
accept it.
Page 19
3
The Saudi Arabian government institutions and banks have realized the importance of
enhancing and developing their IT systems by investigating further in the field of
electronic banking (e-banking) generally and IB in particular. Investigating the
adoption, use and successful implementation of IB and the acceptance of this
technology at the customer’s level offers some significant challenges. For successful
adoption and usage, IB must offer net benefits for users (e.g. how easy or useful it is
to use or how compatible it is with the customer’s lifestyle and their previous
experiences or does it safe their time and money).
In addition, investigating the benefits of IB services alone is insufficient for studying
IB behaviour (Lassar et al., 2005); customer service, efficiency and cost effectiveness
became the sources of competitive advantage in the recent banking and internet
researches. The search for new, lower cost channels of service delivery led banks to
consider different ways of reaching customers. Therefore, understanding and
establishing the factors (Independent Variables) influencing the adoption, use, and
success (Dependent Variables) of IB, from both academic and practical perspectives,
is of paramount importance for all stakeholders involved (i.e. government, banks,
customers), and for the development of appropriate infrastructures, policies, and IB
services. Due to the above reasons, this research has been proposed and sponsored in
order to investigate this new and important area of IB in SA.
1.2 Background of SA
SA is the birthplace of Islam and home to Islam's two holiest shrines, in Mecca and
Medina. Moreover, SA is considered as a leading producer of oil and gas and holds
more than 20% of the world’s proven oil reserves. The government continues to
pursue economic reforms and diversification, particularly since the accession of SA to
Page 20
4
the World Trade Organization (WTO) in December 2005, and promotes foreign
investment in SA. A burgeoning population, aquifer depletion, and an economy
largely dependent on petroleum output and prices are all ongoing governmental
concerns. In the following subsections; the geographic, demographic and economic
background of SA will be discussed.
1.2.1 SA Geographic Background
As this study covers the entire geographical area of SA, so it worth to talk about the
geographical background of SA. In addition to that, this section intends to explain
what are the geographical backgrounds of the main cities and the capital city of SA?
As those cities, get impacted culturally with the nearby countries of SA. The
Kingdom of SA, having an area of approximately 2,240,000 sq km, occupies 80% of
the Arabian Peninsula.
Figure 1.1: SA 13 Provinces.f 1
Source: (Saudi.gov.sa, 2012).
SA’s borders consist of the Red Sea, the Arabian Gulf; and seven countries: Jordan
and Iraq across the Gulf to the north; Kuwait, Qatar, and the UAE to the east
bordering the Gulf; whilst Yemen and Oman occupy the southern reaches of the
peninsula. SA is divided into 13 provinces, as shown in Figure 1.1; each province is
Page 21
5
divided into governorates there being 118 in total. This number includes the
provincial capitals, which have a different status as municipalities headed by mayors.
The Riyadh area, also called Al-Wosta (Central Area), is a province of SA located in
the centre of the country. It is the second largest province in terms of both area (after
the Eastern Province) and population (after Makkah Province). Its capital is the city of
Riyadh, which is also the national capital. More than 75% of the population of Riyadh
province reside within Riyadh city.
The Eastern Province (Ash-Sharqīyah) is the largest province of SA, located in the
east of the country on the Arabian Gulf coast, and has land borders with Kuwait,
Qatar, the UAE, Oman and Yemen. The Makkah Province or Mecca Province
(Makkah al Mukarrama) is the most populous province of SA, because it contains the
Muslims’ holy city. It is located in the west of SA and has an extended coastline. Its
largest city is Jeddah, which is also SA's main port.
1.2.2 SA Demographics Background
Saudi population figures are approximate, taking into account a high, but now
declining birth-rate, and an expatriate population whose numbers reflect the economic
climate of the day. SA is amongst the fastest growing nations in the world in terms of
population (SAMA, 2008). The population of SA grew threefold from 7.3 million in
1975 to 24.8 million in 2008. A census conducted in 2010 by Central Department of
Statistics and Information (CDSI) indicated that the total SA population is
27,136,977; with a 3.2% population growth rate among the population in the 2004 and
2010 census. The high growth rate of the SA population is due to a number of
demographic transformations in the structure of Saudi society. These changes are the
result of great improvements in living, health, and social conditions over the past
Page 22
6
three decades. On the other hand, the overall ratio of males to females is about 55.5%
males to 44.5% females (CDSI, 2007). Although the difference between the two
genders is not excessively high; females face several barriers and obstacles for
participation in public life (listed in Table 1.1).
Barriers Status
Difficult for businesswomen to accomplish
official business in person without using male
intermediary
Government has now allowed women to
submit applications directly without an
intermediary
Lack of training organizations and specialist
women-related business programmes
Chamber of Commerce establishing training
programmes
Difficulty in obtaining required market
information
Special sections of Chamber of Commerce set
up to provide information
Difficulty in qualifying for loans Government lending institutions instructed to
handle female loan applications on equal basis
Limited allowable investment sectors Industrial zones planned and special
investment advisory service from SAGIA1 set
up
Unavailability of female sections in ministries Some progress in this field and some
ministries have established women-only
sections
Unclear legal rights of businesswomen with
government agencies
Steps are being taken to ensure that women
can correspond directly in their own legal
capacity without intermediaries
Limited networking groups for businesswomen Businesswomen associations established to
facilitate networking
No travelling in SA unescorted by male
relatives or spouses
More flexibility and acceptance now to allow
mobility in SA based on written approval
from next of kin without male chaperones
Hiring of trained female staff from abroad Case-by-case submission to ensure that
qualified Saudi females can be employed for
position but within SA, mobility for Saudi
females is still an issue
Table 1.1: Saudi businesswomen barriers in SA.t 1
Source: Adapted from Ramady (2010).
With regards to age groups in SA, CDSI (2007) revealed that the 37.19% out of the
total population belonged to the age group 21-40 years old, 41.65% were younger
than 20 years, whereas 21.16% were older than 40 years. In SA, there is a growing
debate over the role of women in society. Given how deeply the family values and
traditions of the nation are held, SA has been hesitant to embrace fully any
development that appears to threaten the traditional family unit. Because women’s
1 Saudi Arabian General Investment Authority.
Page 23
7
role in Saudi society has traditionally been the domestic one of wife and mother, the
move toward greater female participation in the labour force has been met with
uncertainty, debate, and even hostility (AlMunajjed, 2010). In addition to that,
although the official Saudi employment laws and regulations do not explicitly meant
to minimize the discrimination against women; major regulations regarding
discrimination against women in the labour market are limited.
Saudi businesswomen are still widely required to have an authorized male
representative to manage their businesses and represent them in government agencies.
This practice has led to many cases of fraud and financial loss. On the other hand,
girls’ public-sector education has not met the demands of the labour market, and there
are major gaps between what employers require and what graduates can offer.
Moreover, there are not enough university places for women outside education
colleges. The Saudi Minister for Education has declared that about 90% of the SA’s
educational output is not linked to the needs of the labour market (AlMazroui, 2009).
In addition to that, SA spent $6 billion last year on foreign-study scholarships for
almost 250,000 students and family members, as it seeks to prepare a professional
class to play a larger role in running the economy (Platt, 2012).
Finally, in terms of income levels, the number of Saudi nationals who earn less than
United States Dollar (USD) 2 a day was 1.63% of the population, or approximately
300,000. However 400,000 families (around 19% of the population) were found to be
spending less than SR 3,800 or USD 1,000 a month (Ramady, 2010)1. The average
wages of Saudi Arabian employees are presented in Table 1.2; this shows the average
1 Although these may sound low; SA pay no tax and cost of living is low (e. g. fuel).
Page 24
8
wages in SA from 1994 to 2008. In 2008, the average wage for males was SR 7,650
whereas for females it was SR 3,100.
Saudis Non-Saudis
Males Females Males Females 1994 7,298 3,660 2,153 3,133
1995 7,896 3,864 2,142 3,016
1997 7,570 4,144 2,046 2,716
1998 7,473 3,812 1,934 2,740
2000 6,877 3,217 1,763 2,391
2001 6,684 3,151 1,710 2,403
2002 5,984 2,703 1,543 2,221
2008 7,650 3,100 1,650 2,480
Table 1.2: Average wages, in Saudi Riyal (SR), in SA during the period (1994-2008).t 2
Source: SAMA (2009).
The table also illustrates the gradual decline in wage levels for non-Saudis due to the
tendency from all government and private sectors to employ Saudis, known as
“Saudization”1, which has affected the wage levels of non-Saudis. With regards to
that, it is worth highlighting that non-Saudi employees have been treated as the Saudi
employee, as they receive free education, health insurance and that their wages are
tax-free. Table (1.2) also shows that the average wage levels of non-Saudi females are
higher than those of non-Saudis males; this is because the majority of the females are
skilled and specialized employees due to the shortage of skilled females among
Saudis, whereas there are both skilled and non skilled employees among non-Saudi
male employees. In the following sections, a brief introduction of the e-banking, IB
and their associated benefits is presented. Then, the IB in the SA context is introduced
and discussed
1 Saudi Arabia recognized very early the need to ‘Saudize’ the workface. In 1970, the government
decreed that 75% of workers in all businesses operating in the country should be Saudi, and that they
should receive at least 51% of the company’s total salary payment (Ramady, 2010).
Page 25
9
1.3 E-Banking
The subjectivity in the interpretation of the term “e-commerce” has been noted in the
literature (Banaghan and Bryant, 1998) and is reflected in the widely varying statistics
on current and predicted e-commerce activity. Schneider and Perry (2000) argued that
“e-commerce includes so many activities that it can be difficult for managers to
decide where and how to use it in their businesses”. E-commerce can be defined as
merging the process of buying and selling or the exchange of products, services, and
information via computer networks including the internet (Turban et al., 2000).
Banks define e-commerce, according to Awad (2000), as consisting of procedures that
support commercial activities electronically or via networking between bank-to-bank,
bank-to-customer, or bank-to-vendor. The main concern in this study is bank-to-
customer networking. Moreover, Ahmed et al. (2003) went further and defined e-
banking as the use of the internet as a remote delivery channel for providing services
such as opening a deposit account, transferring funds among different accounts and
electronic bill presentation and payment.
According to the Basel Committee1 report on banking supervision (1998), e-banking
refers to the provision of retail and small value banking products and services through
electronic channels. Thus, in the most encompassing definition, e-banking would
range from direct deposits, ATMs, credit and debit cards, telephone banking, and IB,
to electronic bill payment and web-based banking. Gkoutzinis (2006) defined e-
1 The Basel Committee on Banking Supervision is an institution created by the governors of the central
bank of the group of ten nations. It was created in 1974 and meets regularly four times a year. The
Basel Committee formulates broad supervisory standards and guidelines and recommends statements
of best practice in banking supervision in the expectation that member authorities and other nation's
authorities will take steps to implement them through their own national systems, whether in statutory
form or otherwise (eFinancePortal.com, 2008).
Page 26
10
banking as the provision of banking services and the initiation and performance of
payments through the banking system by electronic means and other advanced
technologies (see Figure 1.2).
Figure 1.2: Communication methods and access devices in e-banking.f 2
Source: Gkoutzinis (2006).
There is no doubt that e-banking is an application of e-commerce in the banking
sector. The consumer’s willingness to buy financial services through e-commerce was
investigated by several studies, such as McKinsey Consulting who conducted a survey
via focus groups consisting of 75 urban consumers in Europe. The survey showed (see
Figure 1.3) that the consumer’s willingness to buy is different for each product
(Kshirsagar et al., 2001). It can be concluded from Kshrsagar’s study that customers
will be less confident with e-banking and IB services; their study indicates that the
financial services products require a high level of human contact, and consumers’
acceptance level for human contact with financial services products is very high.
However, with the IB services products (no human contact), consumers’ acceptance
level for such products is very low. Therefore, studying the customers' acceptance of
Electronic
Banking
Internet
Banking (IB)
Closed-access
Home banking
ATMs
Interactive TV
Mobile Phone
Personal
Computer
Telephone
Banking
Personal
Computer
Audio
Screen-
enabled
Videotext
Page 27
11
the IB is very important, sensitive, and requires further investigation as suggested
earlier.
Figure 1.3: Virtual reality: The need for human contact for financial servicesf 3
Source: Kshirsagar et al. (2001).
1.4 Internet Banking (IB)
Gkoutzinis (2006) defined IB as the provision of e-banking services via the internet,
commonly through a Personal Computer (PC) or other access device with internet
capabilities. The concept of telephone banking refers to services provided via the
ordinary telephone or more advanced screen-enabled terminals. In this research, the
terms ‘online banking’ (OB) and ‘IB’ are often used interchangeably. Home banking
would include any remote delivery channel, including telephone banking. IB gives
customers the ability to access virtually any type of banking service (except cash) in
any place and at any time. From an economic perspective, IT and computer networks
have enhanced the automation, speed and standardization in communications and
internal administration, increasing customer convenience and functionality and
reducing costs in back-office and front-desk banking functions (Allen, 2003). Openly
accessible and globally connected computer networks allow the two-way
Bank
account
transaction Direct
Investments Mutual
Funds
Credit
Cards
Motor
Vehicle
Insurance
Pensions
Customer
Loans
Life
Insurance
Mortgages
Health
Insurance
High
Low High
Level of
Consumer
Acceptance
Need for Advice
Page 28
12
transportation of information between the bank and the customer to occur. In the
context of the bank-customer relationship, the transmission of data from the bank to
the customer and vice versa may result in the establishment, alteration, exercise or
termination of legal rights and obligations in accordance with the contract between
banks and customers. In that respect, the internet allows the initial establishment of
the bank-customer relationship and the electronic delivery and performance of
services thereafter within the boundaries set by available technical and legal
mechanisms of authorization and access.
It has been argued that the main driver for banks to implement the IB solution is to
maintain good relationship with their IB customers, and cut operational costs (Sultan
and Rohm, 2004; Lichtenstein and Williamson, 2006). The attraction of self-service is
formidable in that banks can save on various factors ranging from reduced staff levels
to fewer paper-based bills. It is argued that internet delivery is cheaper than physical
channels. A simple transaction for a non-cash payment at a branch is likely to cost the
bank as much as 11 times more than over the internet (Sultan and Rohm, 2004). The
lower transaction cost expected from IB will translate into cost savings only if
transactions can be migrated from higher cost channels to the online services in a way
that allows the former to reduce their cost (Sultan and Rohm, 2004; Lichtenstein and
Williamson, 2006). Banks also need to be aware that the development, set-up and
especially the marketing cost of the online service must be kept under control to
ensure that it does not negate the lower transaction costs (Mattila et al., 2003). IB can
provide benefits for both banks and their customers. Moreover, some of these benefits
may be interconnected. For example, if IB services open new markets, then customers
in the existing and the new markets are likely to benefit. In Table 1.3, the benefits,
pitfalls, and barriers of IB for both banks and customers are summarised.
Page 29
13
Banks Customers
Benefits
It opens up new markets and new
opportunities for banks, i.e., banking
becomes easier, faster and cheaper
(Sultan and Rohm, 2004; Lichtenstein and
Williamson, 2006).
Costs will be reduced and information
can be delivered directly to target
markets (Nelson and Queenie, 2006).
Banking services can be provided 24
hours a day, 7 days a week with
minimum costs (Moll, 1999).
The need for branch buildings will be
reduced significantly (Walker, 1999),
which will result in an increase in banks'
profit margins. (Shah and Siddiqui, 2006)
It may also reduce other costs, such as
personnel (Jayawardhena and Foley,
2000).
Home Bank users, when compared with
non-users, are more content with the bank
and have higher intentions of repurchase.
Mols (1998), Yiu et al. (2007)
IB can provide convenience:
24 hours a day, 7 days a week via
internet access (Jones, 2000)
Time savings by eliminating the need for
going to the bank and queuing (Johnson
et al., 1995; Nicholas, 1997)
IB can provide customers with a higher
degree of control over their finances
(Daniel, 1999; Kolodinsky et al., 2004).
IB can increase privacy (Nicholas,
1997), (Alsajjan and Dennis, 2010)
IB improves transparency. It makes it
easier for customers to shop around and
find the best deal on offer (Johnson and
Christensen, 2000)
IB is convenient, easy to use, time
saving and appropriate for customers’
transaction needs. Adesina and Ayo
(2010)
IB accessibility, convenience, design and
content (Poon, 2008)
The dimensions of status, personal
finances and investment proved to be U-
shaped (Maenpaa et al., 2007)
Barriers Banks are unsure of the number of people
on the internet and how many people use it;
this uncertainty makes investment decisions
risky (Bellafante, 1995).
Banks face electronic attacks, either
criminal trespass over the internet (cyber
intrusion) or unauthorised access that results
in damaged files, programs, or hardware
(cyber vandalism) or stolen files (Turban et
al., 2003), (Singh, 2004).
Banks consider the availability of IT
infrastructure as an important barrier (Sathye, 1999).
Convenience of access is at the core of the
adoption of any IB application and
determines its ultimate success (Keldon
and Scott, 2006).
The IB barriers are ease of use, price, and
risk, including such factors as privacy and
security (Keldon and Scott, 2006).
Some IB websites may not be available due
to workplace `firewalls' (Francis and
Buckland, 2001). This will reduce
accessibility for the customer.
The main barrier to using e-banking is the
security concerns (Udo, 2001).
Difficult to use IB (Hosein, 2009).
Pitfalls
Providing information about banks and their
services, both barriers to market entry and
customer switching, will fall (Jayawardhena
and Foley, 2000). This scenario will inflame
competition.
When faced with security problems, online
banks have not yet found the best most
secure system (Martin, 1998).
When launching IB, not every person will
want to use the internet for banking nor will
everybody have access to the internet or the
bank’s site (Francis and Buckland, 2001).
IB does not provide face-to-face
communication/contact, which some people
may prefer (Mendonca and Nakache, 1996).
IB can provide many benefits for the
customer. However, it also provides some
risks (Yousafzai et al., 2005).
Table 1.3: Summary of the benefits and problems associated with IB from the literature.t 3
Page 30
14
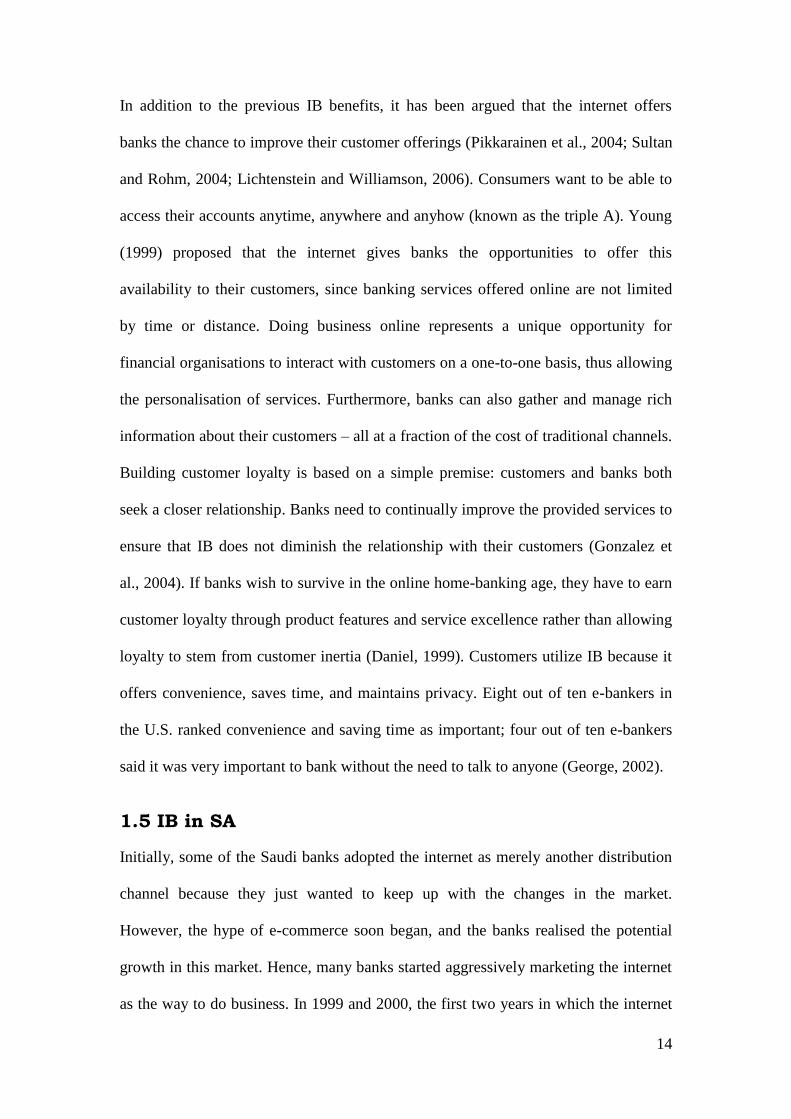
In addition to the previous IB benefits, it has been argued that the internet offers
banks the chance to improve their customer offerings (Pikkarainen et al., 2004; Sultan
and Rohm, 2004; Lichtenstein and Williamson, 2006). Consumers want to be able to
access their accounts anytime, anywhere and anyhow (known as the triple A). Young
(1999) proposed that the internet gives banks the opportunities to offer this
availability to their customers, since banking services offered online are not limited
by time or distance. Doing business online represents a unique opportunity for
financial organisations to interact with customers on a one-to-one basis, thus allowing
the personalisation of services. Furthermore, banks can also gather and manage rich
information about their customers – all at a fraction of the cost of traditional channels.
Building customer loyalty is based on a simple premise: customers and banks both
seek a closer relationship. Banks need to continually improve the provided services to
ensure that IB does not diminish the relationship with their customers (Gonzalez et
al., 2004). If banks wish to survive in the online home-banking age, they have to earn
customer loyalty through product features and service excellence rather than allowing
loyalty to stem from customer inertia (Daniel, 1999). Customers utilize IB because it
offers convenience, saves time, and maintains privacy. Eight out of ten e-bankers in
the U.S. ranked convenience and saving time as important; four out of ten e-bankers
said it was very important to bank without the need to talk to anyone (George, 2002).
1.5 IB in SA
Initially, some of the Saudi banks adopted the internet as merely another distribution
channel because they just wanted to keep up with the changes in the market.
However, the hype of e-commerce soon began, and the banks realised the potential
growth in this market. Hence, many banks started aggressively marketing the internet
as the way to do business. In 1999 and 2000, the first two years in which the internet
Page 31
15
was offered in SA, Saudi banks were seeking to improve their relationship with
customers by delivering information, news, knowledge, and promotions to them
(Lieb, 1999; Jasimuddin, 2001). Internet penetration leading to Online banking (OB)
penetration cannot always be guaranteed. Grealish (2002) investigated the adoption of
OB penetration and found that the rate of adoption of the internet has varied among
different banks in SA. Generally, two classes of internet use in financial institutions
can be identified in two categories: information presentation and transaction banking
(e.g. electronic payments) (Grealish, 2002).
Information may be provided in connection with one- or two-way communication.
Two-way communication allows the customers to send electronic mails (e-mails) to
the server in order to ask for further information or make suggestions with respect to
the internet site (Kolodinsky et al., 2004). The second class is when banks use the
internet for transactional purposes; i.e. as a proper delivery channel. This refers to
when a customer can conduct online every service that they would be able to conduct
offline, whether that is through the branch, ATM, or telephone. At this level,
customers are provided with a range of banking services, such as retrieving account
information, bill payment and money management services 24 hours a day, 7 days a
week. Some banks go for the completely virtual strategy.
In SA, OB has seen only limited adoption compared to most western countries and
other Arab countries, such as Kuwait, the UAE, and Bahrain. These Arab countries
claim adoption rates of 29% in Kuwait, 21% in the UAE, and 17% in Bahrain which
are equal to or even higher than those of western countries (e.g. 17% in the USA) with
approximately 14% of Gulf countries' internet users are having online bank accounts
(Al-Far, 2005). The IB has been available in SA only since 2001 (Al-Furaih, 2002).
Page 32
16
As a result, laws relating to e-commerce and IB in SA are all relatively new. In
addition, banks that offer IB in SA face cultural challenges. The infrastructure support
for internet and IB is also relatively new or in a development process which increases
the challenges. In the Saudi Arabian financial infrastructure, there are often numerous
integrated applications, available across local, wide area, and public networks. The
introduction of the internet has added to the uncertaintiesy of maintaining a secure
environment.
According to a recent study (CITC, 2010) conducted in SA, IB penetration was 31%
among 1,500 internet users and 23% were using internet but not using IB, though they
were intending to use IB services in the future (Figure 2.13). This potential is
beneficial because it implies an increase in the money movement velocity. This, in
turn, results in more money being available in an economy, which can translate to real
economic growth and to increases in the standard of living (Haley, 2003). OB
customers depend on internet technologies for instant access to their financial and
information resources. The security of these resources is currently the subject of
significant focus. To have competitive, efficient, and secure OB, institutions must
adopt policies, standards, and procedures that allow the business to function well and
protect information assets. Saudi banks need to operate at or above the service level of
successful domestic and international competitors (Reuters, 2000). However, without
specific technical and policy restraints, the internet allows unregulated data to flow
across any national border. This runs the risk of abuse from known or anonymous
sources. As a result, Saudi Arabian financial institutions must provide a sufficient
level of protection and enforce a range of regulations and policies (Al-Furaih, 2002).
Page 33
17
1.6 The Importance of the Study
A review of the marketing and IB literature revealed the importance of IB services as
a fundamental element in banking development. IB services also reflect the ability of
banks to control and guide their entire financial operations. Banks are concerned with
using IB to ensure the provision of proper services and guarantee the customer’s
satisfaction. Despite the importance of IB services to banks and customers, this topic
has not been converged in any conclusions; and very little undertaken in the SA
context. This lack of research was criticised by Siu and Mou (2005), Kassim and
Ahmed (2006), and Alsajjan and Dennis (2010). Until recently, the literature of the IB
services could be divided into two main areas: academic studies and technical studies.
Academic studies emphasised two dimensions: the marketing of services per se and
the benefits resulting from services, and the alternative or intermediate technology to
reduce the cost of banking services. The technical studies were related to the
structural, operational and technical issues produced by experts to deal with banking
services with full privacy and high quality.
This led marketing and IB researchers (e.g. Young, 1999; Jayawardhena and Foley,
2000; Kolodinsky et al., 2004; Sarel and Marmorstein, 2004; Sultan and Rohm, 2004;
Gurau, 2006; Yousafzai et al., 2009; Alsajjan and Dennis, 2010) to criticise the
excessive concentration on the marketing of IB services, without taking into account
the importance of the IB service process itself; the factors affecting customer attitudes
towards the adoption of IB services (including socio-economic motives, management
practices and the security of IB services); the factors affecting customer attitudes
towards the use of IB services; and the factors affecting the success of IB services.
The link between these vital issues is a critical one in many developing countries, and
Page 34
18
most commentators support the need to improve the effectiveness of IB services
(Yousafzai et al., 2009).
Kotler and Keller (2009) defined “adoption” as an individual’s decision to become a
regular user of a product/service. This emphasis is in keeping with the works of
Wungwanitchakornm (2002) and Wang et al. (2003), both of whom argued that
understanding IB services requires addressing the adoption process and any
transformations over time that might affect that process. Sathye (1999),
Wungwanitchakornm (2002), Al-Sabbagh and Molla (2004), Chan and Lu (2004),
Cheng et al. (2006) and Alsajjan and Dennis (2010) concluded that in order to
understand IB services, the factors affecting the use of IB services need to be
considered; these include socio-economic motives, management practices, social
values (such as Islamic Banking (IsB)1 in the case of SA), and the security of IB
services.
The consumer decision-making process has been recognized as comprising a series of
different steps, such as the consumer being aware that a need exists, and the
subsequent search for alternatives to satisfy the recognized need. Once alternatives
have been identified, the consumer will be able to compare the possible options in
terms of attributes or other values of importance. From among these evaluated
1 While a basic tenant of Islamic banking - the outlawing of Riba, a term that encompasses not only the
concept of usury but also that of interest - has seldom been recognised as applicable beyond the
Islamic world, many of its guiding principles have. The literal meaning of Riba as it is used in the
Arabic language means to increase or add. Technically, it denotes any increase or addition to
capital obtained by the lender as a condition of the loan. In simple terms, Riba covers any return on
money, whether the interest rate is fixed, floating, simple or compounded and at whatever rate is
guaranteed irrespective of the performance of the investment; all are considered Riba and is are
prohibited. Riba, in all forms, is strictly prohibited in Islamic tradition as it is considered an unjust
return that leads to unjust enrichment. It is commonly understood as "interest" charged or received
on lending though the legal definition goes beyond just interest (Institute of IsB & Insurance, 2009).
Page 35
19
options, the consumer will purchase a suitable product or service. The decision-
making process is generally concluded by a post-purchase evaluation phase that will
result in either satisfaction or dissatisfaction with the chosen alternative (Assael,
1995; Solomon, 2010). Services marketing literature presents an influential discussion
indicating that customers must make changes in their behaviours based on the changes
that may develop in the service distribution system, as successful implementation of
the new systems relies upon customers’ willingness and ability to change (Bateson
and Hoffman, 1999). Apart from understanding the acceptance behaviour of banking
customers towards current technology, additional research is required to understand
how this adoption and re-usage process affects the introduction of the new technology
regarding its implementation success or failure.
Previouse literature has reviewed the customers' attitudes towards technology
acceptance. Such as, Ajzen and Fishbein (1989) who have developed the Theory of
Reasoned Action (TRA), which has been widely validated the intention models that
have been confirmed effective in predicting and explaining the adoption behaviour
across a wide variety of fields. Ajzen (1991) has extended TRA by including another
construct to predict both behavioural intention and behaviour. The extended model
has been called Theory of Planned Behaviour (TPB). TPB has been used by several
studies to various situations in predicting the performance of behaviour and intentions
to adopt the technology (Man, 1998; Cheung et al., 1999). Moreover, Davis (1989)
developed the Technology Acceptance Model (TAM) theory, which is an adaptation
of TRA for predicting the adoption and usage of IS. TAM has been used widely by
several studies to predict user acceptance of information technologies (Venkatesh &
Davis, 1996, 2000; Lee & Turban, 2001; Wang et al., 2003). TAM suggests that
technology adoption decisions are determined by an individual’s affective response
Page 36
20
(attitude) towards the use of the innovation. Other empirical evidence, Davis et al.
(1989) have refined TAM to include attitudes towards using technology rather than
just thinking about technology. This study has extended TAM model by investigating
different factors that might have relationship with the adoption and use of IB which
have not been considered in TAM model. In addition to that, and since the success of
IB has not been found, in the reviewed literature, studied or investigated previously;
this study has introduced the success variable following DeLone and McLean (2003)
IS success model, as the net benefit of using the IS has been used as a measure for IS
success.
Additionally, Brooksbank and Taylor (2002), Al-Sabbagh and Molla (2004) and
Cheng et al. (2006) argued that it is necessary to understand the factors which relation
with the success of IB services, such as people characteristics, use conditions and the
mechanism of adoption, in order to be able to formulate the marketing practices and
strategies of IB services. Therefore, this research has extended the scope of previous
IB studies by adding the success variable to the research model and investigating the
different factors that might affect the success of IB services. Thus, this research is
important in the following two distinct ways:
It addresses how understanding three vital issues when dealing with IB,
specifically, adoption, use, and success, can improve the knowledge of IB
services in order to produce effective marketing strategies.
This research will enhance the ability of the banks and government
institutions in developing countries, especially in SA, to benefit from
empirical findings; therefore, it has the potential to introduce new policies
addressing IB development.
The success of IB is determined not only by banks or government support but also by
customers' acceptance of such type of sensitive services. The customer has a great
Page 37
21
influence on the adoption of IB (Pikkarainen et al., 2004), as they eventually elect on
whether they will use IB based on their individual needs. If the service can clearly
show the benefits and how they address customers’ wants, then customers are more
likely to use IB. Previous IB research has mainly focused on innovation adoption and
use in the context of North America and Europe (Pikkarainen et al., 2004) and to
some degree, other areas in the Middle East such as Turkey (Polatoglu and Ekin,
2001). In addition to that, in most of the developing countries, IB services are
normally accompanied by a lack of infrastructure and slow growth (Sathye, 1999).
There are, therefore, substantial challenges related to economic conditions, and the
resource constraints of these countries will inevitably undermine the ability of their
banking systems and any instruments for developing IB services. The search for
specific, cause-effect and correlational relationships that can aid comprehension of the
current situation of IB services is important, and any findings have the potential to
enhance the ability of such communities to respond better to IB services. The topic of
this research is, therefore, very important and worthy of investigation.
Even though there have been a number of studies relating to IB services, several
factors provoked further research in this area. First, there is a need for more
investigation to address the role of adoption, use, and success, separately, in IB
services (Yousafzai et al., 2009). Second, many of the marketing studies have tended
to be concerned with theoretical arguments (Polatoglu and Ekin, 2001; Pikkarainen et
al., 2004; Yousafzai et al., 2009). Third, very little attention has been given to
research into IB services in SA (Alsajjan and Dennis, 2010). It is; therefore,
appropriate to investigate the application of this approach within the SA environment.
Fourth, only a few empirical studies (e.g. DeLone and McLean, 1992; Lockett and
Littler, 1997; Beckett, 2000; Al-Gahtani, 2001; DeLone and McLean, 2003) have
Page 38
22
investigated IS and e-banking services studies using success standards; whereas no
studies in the reviewed literature investigated the IB success factors. Therefore and
based on the above discussion, they grew to become the research questions and aims
for this PhD thesis as presented next.
1.7 Research Questions
As introduced above this thesis aims to make a novel contribution to knowledge, following
Corley and Gioia's (2011) theoretical contribution model1, concerning the extent to which
different factors impact the customer's attitudes towards the acceptance of IB. This aim
can be translated into the following main research questions:
1. To what extent do different factors have relationship with the adoption, use
and success (Facets) of IB services? And what is the relative importance of
each factor on each facet?
Moreover, given the aforementioned research background it was considered necessary
to complement this main research question with a supplementary one:
2. What is the relationship between the adoption, use and success of IB services?
Obviously in the subsequent chapters of this thesis the main and supplementary
questions will be further clarified, elaborated, restated, and operationalised giving rise
ultimately to several empirically investigated key research questions of this thesis. It
should thus suffice in this introductory chapter to briefly indicate that the pursuit of
answers to these questions was structured in terms of the following research
objectives:
1 We distill existing literature on theoretical contribution into two dimensions, originality (incremental
or revelatory) and utility (scientific or practical). We argue for a revision in the way scholars
approach the utility dimension by calling for a view of theorizing that would enable theories with
more “scope” (both scientific and practical utility). We also argue for an orientation toward
“prescience” as a way of achieving scope and fulfilling our scholarly role of facilitating
organizational and societal adaptiveness (Corley and Gioia, 2011).
Page 39
23
1.8 Research Aims and Objectives
The objectives of this research are as follows:
1. To establish how the SA IB market differs from IB markets in other countries.
2. To investigate the relations between different factors (e. g. demographics) and
IB services, from the customers’ point view, in developed and developing
economies.
3. To capture the most relevant factors that relate, from customers point view,
with the IB market in SA.
4. To understand the main differences between the different facets (adoption, use
and success) of IB services
5. To understand the relations between the customers' attitudes and the a)
adoption, b) use, and c) success of IB services in SA.
6. To establish well developed theoretically and tested empirically models of the
aforementioned facets.
7. To recommend some innovative ideas, solutions and improvements, which can
contribute to the enhancement and development of the adoption, use, and
success of IB services in SA, based on the successful tested models.
1.9 Research Methodology
Methodology can be defined as a system of explicit rules and procedures upon which
research is based and against which claims for knowledge are assessed (Creswell,
2003). The research philosophy of this study is derived from a positivistic paradigm in
which the research problem stems from the literature itself. The researcher seeks to
cover a set of gaps in the literature, which are demonstrated clearly in Chapters 2 and
3. The positivistic paradigm, employing a cross sectional survey methodology, was
considered as the most appropriate approach for conducting this research.
The population of this research is defined as all SA residents that have the right to
hold an IB account in SA and adopted the IB services. A sample size of 1,000
Page 40
24
respondents was selected randomly from a total of 2.9 million names listed in the
Saudi Residential Telephone Directory. The reason for selecting a large sample was to
obtain a sufficient number of representative responses.
A questionnaire was used as the main method of data collection. In addition,
secondary data in the form of statistics and reports were selected to triangulate the
research findings. Pilot work was undertaken prior to the distribution of the final
version of the questionnaire as several drafts were developed and revised in response
to feedback received from referees and panel experts. Despite some obstacles during
the fieldwork, such as harsh weather, the procedures of administering the
questionnaire were implemented well and 1,000 questionnaires were distributed by
post, 228 of which were returned and considered useable. External and internal
validity were established in this research. Reliability was tested through the “alpha”
test and all the scales in the questionnaire were considered reliable. Descriptive
statistics in terms of means and frequencies were used to meet the descriptive
objectives. In addition, Multiple Regression1 (MR) analyses were used to test the
research hypotheses and questions.
1 Multiple regression (MR) is based on correlation, and is a family of multivariate techniques used to
explore the relationship between one continuous dependent variable and a number of independent
variables that must be continuous (interval/ratio) and/or, dichotomous. MR includes three main types:
1) standard or basic MR; 2) hierarchical-MR; and 3) stepwise-MR. Standard MR and hierarchical MR
are commonly used in management and organizational research; whereas, stepwise regressions are
mainly used when there is no initial plan (or no theory exists) and in applied research where the
researchers are interested to find the best prediction variables. MR has a number of assumptions about
the data that need to be carefully considered by any researcher (discussed in chapter four) in order to
avoid violating these assumptions and endanger the value of the study in terms of reliability and
validity (Field, 2005).
Page 41
25
1.10 Thesis Structure
In addition to this chapter, the thesis comprises a further six chapters. A summary of
each chapter is presented in this section. Chapter 2 provides an overview of and
insights into the evolution of the banking industry, and provides critical review of the
international empirical literature and investigate different factors that impact the
customer’s attitudes towards the adoption, use and success of IB. The different
technologys’ models which impct the customers’ attitudes have been discussed. This
chapter concludes by presenting the theoretical model and hypotheses of this research.
In part of this chapter, several models are presented, such as Hoxmeier’s model,
Morgan and Hunt’s theory, the TRA, and the TAM. In general, the model of this
research extends the TAM model in addition to the combined effects of new variables
that have been added to the model from the literature (e.g. Sathye, 1999; Pikkarainen
et al., 2004; Lichtenstein and Williamson, 2006).
Chapter 3 delineates the banking challenges as it provides an overview of the banking
sector and its history, with an evaluation of the factors that relates to the IB services.
It also reports the major infrastructure features relevant to banking and
telecommunications in SA.
Chapter (4) started with an introduction of the research method adopted in this study
as it presented the different types of research methods by providing the advantages
and disadvantages of the features of each method. The research methodology, design
and data collection methods utilised to achieve the research objectives are discussed
and justified, and the discussion shows that the survey method (postal questionnaire
technique) was the most suitable methodology. This is followed by a detailed
discussion of the research population and sample. The chapter continues with a
Page 42
26
description of the stages of the questionnaire construction and pre-testing, features of
the covering letter, and the final content of the questionnaire. The survey
administration and response rate1 are then presented. The chapter also presents the
operational definitions for each variable incorporated in the theoretical model, which
includes the three interrelated dependent variables, namely, the adoption, use, and
success of IB services, and several independent variables. The chapter concludes with
a discussion of the validity and reliability and how the research dealt with the missing
data and ends with the proposed inferential statistics, such as reliability, factor,
correlation, and MR analysis.
Chapter Five provides the detailed results of the descriptive statistical analyses. The
analyses of the sample and demographic characteristics data are discussed. This
chapter also presents the descriptive statistics results.
Chapter 6 focuses on the data analysis inferential analysis, findings, and their
discussion via the statistical methods used in testing the research hypotheses. This
chapter provides answers to the research key questions and considers the effort
undertaken in the previous chapters. The research key questions have answered after
extracting the result from the MR tests. This chapter also provides a general
discussion and concludes with a summary for the chapter.
This thesis concludes in Chapter 7 with a summary of the major findings of this study
followed by discussion. In addition to that, the research contributions to knowledge
have been also presented; listing and summarizing a total of five contributions to
knowledge. This chapter also highlight the research's implications for policy makers,
practitioners and the academic researchers. Finally, the chapter concludes with the
1 Response rate = total number of response / total number in sample – (unreachable + ineligible).
Page 43
27
limitations of the research and recommend some areas for further research. Additional
material follows Chapter 7, such as list of references, and eleven (11) appendices,
located at the end of this thesis which is considered part of this research as
supplementary and complementary material. As applicable a reference has been made
to any one of these appendices within the texts, paragraphs, sections, and chapters of
this research.
Page 44
28
Chapter Two
Literature Review and Hypotheses Development
2.1 Introduction
As introduced in chapter one, this chapter aims to undertake a critical review of the
international empirical literature and investigate different factors that have
relationships with the adoption, use, and success of IB. This study mainly lies at the
intersection of three main facets. The first is the IB adoption decision-making process.
The second is the determinants of IB acceptance and actual use among the IB users.
The third facet is the success of the IB implementation by the IB customers.
Therefore, this chapter presents a review of existing literature on these three main
facets. Literature of several widely validated models/theories is reviewed and linked
to the aforementioned three main IB facets (adoption, use and success), which forms
the theoretical background of this research. Following this introduction, detailed
review of the different models and theories regarding IT and IB adoption, usage and
success will be discussed in order provide a brief description of the research
conceptual model development process. Furthermore, a review of the different aspects
of IB adoption, use and success, will be undertaken in order to provide a better
explanation for each facet, in addition to the different IB customer attitudes that might
affect each aspect.
This chapter also highlights customer attitudes towards IB and the factors that affect
them. From literature, the general and different definitions of “attitudes” are
presented. Moreover, customer attitudes towards IT and IB are highlighted, showing
the different attitudes between SA, developing, and developed countries. Furthermore,
some other additional IT and IB adoption, usage and success theories and models and
customer attitudes are introduced; in order enhance the knowledge and models
Page 45
29
choices which have been used in the field of e-commerce. Finally, the different
factors that affect customer attitudes towards IB will be explored in depth. This
chapter also presents the theoretical background of the proposed models of IB towards
the adoption, use and success. This chapter will be concluded with the proposed
conceptual models and hypotheses of this research.
2.2 Models, theories and customer attitudes towards IT
Several studies have examined consumer perceptions of the variables that delay the
development of online shopping (Rhee and Riggins, 1999). It is essential to
understand and analyse customer attitudes in order to devise appropriate marketing
strategies that will satisfy their needs and demands. According to Klobas (1995),
attitude affects a person’s behaviour when using a particular form of IT. There are a
number of definitions of attitude in the marketing literature1. Some of these
definitions are presented next.
Fishbein and Ajzen (1975) offered a definition of attitude, saying that the “major
characteristics that distinguish attitude from other concepts are its evaluative or
affective nature”, while Allen et al. (1992) defined attitude as “the categorization of
an object on an evaluative continuum”. However, Jeong and Lambert (2001) show
that customer attitudes towards using a website, together with the perceived
usefulness of the website information, and the information quality, are the best
indicators for predicting consumers’ purchasing behaviour. The degree of personal
1 The word ‘attitude’ comes from the Latin aplus, which means “fitness” or “adaptedness”. In
the eighteenth century, attitude generally referred to physical posture, and to this day, the
word can denote a general physical orientation with respect to something else. In the
nineteenth century, Charles Darwin used the word in a biological sense to mean a physical
expression of an emotion. Indeed, well into the twentieth century, researchers linked attitudes
with physiological tendencies to approach or avoid something (Petty and Cacioppo, 1981).
Page 46
30
involvement is the most important factor that shapes consumers’ purchasing
behaviours (Anguelov et al., 2004). Reynolds (2000) noticed that education, income,
and attitude towards purchasing online products were statistically important in
forecasting consumers’ travel purchasing behaviours (Mattila et al., 2003). In the
following sub-sections, the different models and theories regarding IT and IB
adoption, usage and success are presented and reviewed, to provide a solid
background for the research’s conceptual model.
2.2.1 Consumer Behaviour Matrix
Beckett (2000) developed the consumer behaviour matrix as shown in Figure 2.1. He
stated that the customers for financial services would be either rational-active or
relational dependant. Rational-active behaviour represents consumers who are
interested in the product and confident that they are going to purchase the product
with definite outcomes. However, relational-dependent behaviour is when the
consumer is involved with the product, but feels that the choice environment is highly
uncertain and that they lack the skills or knowledge to reduce that uncertainty.
Figure 2.1: Consumer behaviour matrix.f 4
Source: Beckett (2000).
With regards to e-banking and IB, customers’ involvement with the financial services
products is high and the customers’ confidence level is low. Therefore, customers’
behaviour with the IB services products will be relational–dependent, according to
High
Repeat-passive Rational-Active
Consumer
confidence
Involvement
No Purchase Relational-Dependent
High Low
Page 47
31
Beckett’s matrix. Thus, the customers’ skills with and knowledge about the IB
services will be very important factors, and will have an effect on customer behaviour
because of their involvement with the product. Beckett (2000) suggested that financial
services firms can no longer be all things to all people, providing a broad range of
financial instruments to all types of customers through all distribution channels. In
other industries, clear strategic choice and implementation underpin competitive
advantage (Porter, 2009). In the following sections and subsection the customers’
attitudes towards the IT and IB adoption, usage and success will be reviewed and
highlighted, in addition to a comparative study between the developed and
development countries to find out the main difference among the different regions.
2.2.2 Hoxmeier Model
In the US, several factors that influence attitudes towards computer utilisation as well
as user confidence in electronic mail were examined by Hoxmeier et al. (2000). The
data of this study were collected using a questionnaire targeting 194 university
students. The main aim of their study was to understand the relationship between
gender and technology. They developed a model which suggested that “experience,
gender, and technology background influence attitudes about e-mail”. Their study
identified two distinct types of computer experience, namely, general experience
(awareness) and electronic communication skills (self efficiency). The study revealed
that stand-alone experience and electronic communication skills resulting from
education and/or training, such as use of the internet, will characterise the general
experience of the users. Figure 2.2 illustrates Hoxmeier’s model.
Page 48
32
Figure 2.2: Email attitudes and confidence.f 5
Source: (Hoxmeier et al., 2000).
2.2.3 Theory of Reasoned Action (TRA)
The TRA developed by Ajzen and Fishbein (1989), is a model that relates attitude to
behaviour (Figure 2.3). They postulated that attitude, social influence, and intention
form the basis of behaviour. Attitude is defined by Ajzen and Fishbein (1989) as an
individual’s positive or negative feeling associated with performing a specific
behaviour.
Figure 2.3: The Theory of Reasoned Action (TRA).f 6
Source: (Ajzen and Fishbein, 1989).
An individual’s normative beliefs of what others think should or should not be
performed determine the Subjective Norm (SN). The likelihood of performing an
action is known as intention, as illustrated in Figure 2.3. Ajzen and Fishbein (1989)
pointed out that the intention of an individual can accurately reflect the predicted
behaviour under three conditions: “the intention and behaviour measures must
correspond, intentions and behaviour must be in the same time intervals for
assessment, and the behaviour must be voluntary” (p. 44). So, to predict purchase
The individual’s beliefs that the behaviour
leads to a certain outcome and a certain
evaluation of these outcomes.
The person’s belief that specific groups
think the behaviour should be performed.
Intention
Attitude toward the behaviour
Subjective norms
Behaviour
General and Electronic
communication skills
Gender
IT Background
Attitude
Confidence
Page 49
33
behaviour, it is necessary to measure a person’s attitude toward performing that
behaviour, not just the general attitude toward the object around which the adoption
behaviour is.
Different IS studies have recommended intention models from social psychology as a
potential theoretical foundation for research on the determinants of adoption behavior
(Swanson, 1982). In addition to that, Fishbein and Ajzen's (1975) TRA widely
validated the intention models that have been confirmed effective in predicting and
explaining behavior across a wide variety of fields. The determination of consciously
intended behaviors has been concerned TRA (Fishbein and Ajzen, 1975; Ajzen and
Fishbein, 1980) composed of attitudinal, social influence, and intention variables to
predict behavior. TRA assumes that an individual's behavioral Intention (BI) to
perform a behavior is jointly determined by the individual's attitude toward
performing the behavior and SN, which is the whole perception of what relevant
others may think an individual should or should not do. Several studies have
successfully examined different situations to predict the performance of behavior and
intentions, by using TRA (Prestholdt et al., 1987; Timko, 1987).
Regardless the efficiency of the TRA predictability across several researches, it
becomes difficult if the behavior under study is not under full volitional control. As a
result, Ajzen (1985, 1991) extended TRA by including another construct called
perceived behavioral control, which predicts both Behavioral Intention (BI) and
behavior. The extended model is TPB. The border limits of TRA have been extended
by TPB in an effective way to more specific directed actions. TPB has been applied
by several studies to various situations in predicting the performance of behavior and
Page 50
34
intentions and it has been found provides a better predictive power of behavior than
TRA (Man, 1998; Cheung et al., 1999).
2.2.4 Technology Acceptance Model (TAM)
However, Davis (1989) developed a theory, TAM, which claims that “perceived
usefulness is crucial to the attitudes and intentions to use a technology tool” (p.325).
TAM is an adaptation of TRA specifically for modelling user acceptance of IS. It
provides an explanation of the determinants of computer acceptance that is general,
and is capable of explaining user behaviour across a broad range of end-user
computing technologies and user populations. Similar to the finding of the TRA, the
TAM stipulates that the behaviour is voluntary. The TAM is illustrated in Figure 2.4.
Figure 2.4: The Technology Acceptance Model (TAM).f 7
Source: (Davis, 1989).
The TAM shows that two particular beliefs, perceived usefulness and perceived ease
of use, are most relevant to the acceptance behaviours of IS. Davis (1989) defined
perceived usefulness as "the degree to which an individual believes that using a
particular system would enhance his / her job performance" and perceived ease of use
as "the degree to which an individual believes that using a particular system would be
free of physical and mental effort”. The TAM states that the two beliefs determine the
attitude towards using IS. The attitude towards using IS determines the behavioural
intention to use IS. Moreover, the behavioural intention to use ISs leads to the actual
use of IS.
Perceived
usefulness
Attitude
toward use
Intention to use Actual use
Perceived ease
of use
Page 51
35
TAM has been used widely by several studies to predict and make it clear of user
acceptance of information technologies (Venkatesh & Davis, 1996, 2000; Lee &
Turban, 2001; Wang et al., 2003). The importance of using TAM is the ability to
describe how individual customer beliefs and attitudes relate towards using
‘something’, in this case IB, and whether or not the system will be used. TAM, as
illustrated in Figure 2.4, suggests that technology adoption decisions are determined
by an individual’s affective response (attitude) towards the use of the innovation.
Based on empirical evidence, Davis et al. (1989) have refined TAM to include
attitudes towards using technology rather than just thinking about technology. With
regards to that, TAM was considered as a strong tool for investigating and studying
the adoption and usage of IB.
King and He (2006) conduct a statistical Meta-analysis of TAM as applied in various
fields using 88 published studies and his findings revealed that TAM to be a powerful,
highly reliable, valid and robust predictive model that may be used in a variety of
contexts. Many researchers have suggested that external variables may be added to
TAM as a way of improving the model’s predictive power (Davis et al., 1989; Davis,
1993; AlSukkar, 2005). While perceived usefulness and perceived ease of use, that
influence individuals to accept a technology, have been widely investigated in
intention studies, factors that may affect the degree of influence of the two constructs
and other constructs towards the adoption and then usage decision behaviour should
also be investigated separately, as different factors are impacting customers attitudes
during the adoption and also other factors impacting their usage differently.
Therefore, this study extends TAM model by considering different additional external
variables and examining their extent of relation with adoption and usage. In addition
to that, this study has also extended TAM model by adding another main facet which
Page 52
36
is the success, when users enjoy the benefit of their IB usage following DeLone and
McLean (2003) IS success model, which will be presented in detail in the next
subsections.
In this study, it is postulated that the degree of influence different constructs have on
the adoption of IB; is different than factors which have influence on the actual usage
of the IB, and is also different than those factors have influence on the success of IB.
In the context of this study, the different factors which might impact each facet (i.e.
adoption, use and success) may suggest differences in the extent of their influences
when using the IB services in a country such as SA, where you can find different
ethnic groups with different cultures.
2.2.5 DeLone and McLean’s (D & M) Model of IS Success
The success of IS is one of the most researched topics in IS literature. DeLone and
McLean (1992) became aware of the complex reality that surrounds the identification
and definition of the IS success concept. They organized a large number of studies on
IS success and presented a comprehensive and integrative model. In their study, they
identify six main dimensions for categorizing the different measures of IS success:
system quality, information quality, use, user satisfaction, individual impact, and
organizational impact. They developed an IS success model in which these categories
are interrelated, shaping a process construct. Their model proposes that system quality
and information quality singularly and jointly affect both use and user satisfaction.
Additionally, the amount of use can affect the degree of user satisfaction as well as
the reverse being true. Use and user satisfaction are direct antecedents of individual
relation; and, lastly, this relation with individual performance should eventually have
some organizational impact (DeLone & McLean, 1992, pp. 83, 87) (Figure 2.5).
Page 53
37
Figure 2.5: D & M IS Success Model.f 8
Source: (DeLone and McLean, 1992).
DeLone and McLean (1992) stated that their model is “an attempt to reflect the
interdependent, process nature of IS success” (p. 88), undertaking to describe the IS
success concept and the causes for the success. The creation of the D&M IS Success
Model was driven by a process understanding of IS and their relations. This process
model has just three main components: the creation of a system, the use of the system,
and the consequences of this system use (benefit). Each of these steps is a necessary
but not sufficient, condition for the resultant outcome(s). For instance, without system
use, there can be no consequences or benefits. As suggested by D & M IS success
model the research’s model used customer’s satisfaction as one of the measure for
success when customers are enjoining the benefit of using the IB services. In the
following sections a detail review of the different factors that have effect on the
customers’ attitudes towards IT and IB adoption and use in SA and different countries
is presented to provide
2.3 Customer Attitudes towards IT and IB
2.3.1 Attitudes towards IT and IB in SA
Al-Khaldi and Wallace (1999) tested the customers’ attitudes in their studies by using
Triandis’ theory (1980), which suggested that behaviour is determined by attitude,
social norms, habits, and expectations. Their study surveyed 200 “knowledge”
workers in two different countries, SA and Canada, and focused on attitudes and
Page 54
38
technology use in SA. Several differing attitudes towards PCs and their uses were
discovered and reported in their study, such as a lack of knowledge, social values, and
infrastructure availability.
Regarding this issue, belonging to a Muslim country, the Saudi Arabian banks should
provide different IsB products and services (see Chapter 3, section 3.5) to maintain
the relationships with the Muslim customers for a longer period (Archer and Karim,
2002; Faroqui, 2002). Bley and Kuehn (2004) surveyed business students’
knowledge of the financial aspects of Islamic and conventional banks in the UAE.
The sample of their research included a relatively high proportion of students who
were knowledgeable about general financial practice, and comprised students of both
an Arabic and non-Arabic Muslim background. The major finding was that Muslim
students preferred Islamic bank services for religious reasons. As a result, IB services
in SA banks should be satisfactory, and it should be convenient by maintaining IsB
services to improve customer loyalty.
In 2001, Al-Ashban and Burney conducted a study to explore the adoption of tele-
banking among bank customers in SA, focusing primarily on the impact of customer
characteristics on adoption and use. First, it explored the relationship of usage in
relation to time period (i.e. exposure) - a predictor of adoption –, and, second,
examined whether and which, if any, demographic variables determine a person's
usage of tele-banking. It also examined trends across any key characteristics in SA.
The respondents were grouped according to age, education level, occupation, and
income class. The results of this study provided important lessons for the banking
industry, as the findings indicated that, in general, Saudi consumers' income levels
and education positively play a vital role in their adoption of the tele-banking
Page 55
39
services. For individual dimensions of tele-banking, income levels, education, and age
are particularly significant factors, while occupation and age affect the desire for
expansion, and income level and education are related to usage frequency over the
time.
Al-Gahtani et al. (2007) conducted a study about culture and the acceptance and use
of IT in SA. He used the Unified Theory of Acceptance and Use of Technology
(UTAUT) model (Figure 2.6) which is credited with explaining a larger proportion of
the variance of ‘intention to use’ and ‘usage behaviour’ than have preceding models.
He examined the relative power of a modified version of UTAUT in determining
‘intention to use’ and ‘usage behaviour’ by using a sample collected from 722
knowledge workers using desktop computer applications on a voluntary basis in SA.
Al-Gahtani et al. (2007) study used to estimate the Saudi predicted latent constructs,
BI (adoption) items that reflected an individual’s self-assessment of his (or her)
likelihood to continue to use computers for an indefinite period. According to them;
their measure differs from other measures in the literature that have used time-specific
measures. They wanted to capture a self-assessment of likely continuing computer
usage. On the other hand, frequency of using computers and self-reported has been
used to estimate the latent usage construct. They found that the model explained
39.1% of intention to use variance, and 42.1% of usage variance. In addition, he
produced and tested hypotheses regarding the similarities and differences between the
United States (US) and Saudi validations of UTAUT in terms of cultural differences
that affected the organizational acceptance of IT in the two societies.
Page 56
40
Figure 2.6: Unified Theory of Acceptance and Use of Technology (UTAUT).f 9
Source: Al-Gahtani et al. (2007).
Al-Somali et al. (2008) investigated the acceptance of OB in SA by identifying the
factors that encourage customers to adopt OB in SA. The research constructs were
developed based on the TAM and incorporated some particularly important control
variables. The survey method was used, so a sample of 400 people was randomly
chosen from the Saudi community. Then, structural equation modelling was applied
to test the measurement model to determine the internal consistency reliability and
construct validity of the multiple items scales used to operationalise the study
variables. The findings of their study suggest that the quality of the internet
connection, the awareness of OB and its benefits, the social influence, and computer
self-efficacy have significant effects on the perceived usefulness and perceived ease
of use of OB acceptance. Education, trust and resistance to change also have a
significant relation with the attitude towards the likelihood of adopting OB. Also, it is
important to emphasise the high explanatory power (R²) achieved in their study in
which attitudes towards use explain 83% of the variance in adoption intention.
Alsajjan and Dennis (2010) conducted a comparison study between SA and the UK
and proposed the IB Acceptance Model (IBAM), which is a revised TAM, to measure
consumers’ acceptance of IB. Data were collected from 618 questionnaires that were
distributed to university students in the UK and SA. The results suggested the
importance of attitude to the extent that attitude and behavioural intentions emerge as
Page 57
41
a single factor, denoted as attitudinal intentions. Structural equation modelling was
used to confirm the fitness of the model, in which perceived usefulness and trust fully
mediated the impact of SNs and perceived manageability on attitudinal intentions.
The invariance analysis demonstrated the psychometric equivalence of the IBAM
measurements between the two country groups. At the structural level, the influence
of trust and system usefulness on “attitude intention” varied between the two
countries, emphasizing the potential role of cultures in IS adoption. They
recommended, for future research, investigating the extent to which gender and other
demographics or personality traits affect IB adoption behaviours along with various
social, psychological and contextual influences, especially in SA, where such issues
have not been addressed previously.
Figure 2.7: IB Acceptance Model (IBAM).f 10
Source: Alsajjan and Dennis (2010).
Mahdi (2011) examined the trust in and the security of e-banking services in Saudi
commercial banks. The design for the study used a quantitative research
methodology. Data were collected by means of questionnaires, utilizing snowballing
approach; 500 questionnaires were distributed to banks’ including Saudi and non-
Saudi banks’ customers. The findings revealed how Saudi banks’ customers had very
high trust in using the e-banking services and how customers of Saudi banks believed
strongly that, compared with their non-Saudi customers; e-banking services are more
secure.
Page 58
42
2.3.2. Attitudes towards IT and IB in Developing Economies
In Kuwait, Aladwani (2001) suggested that security, regulations, consumer privacy,
and the bank's reputation as being the main future challenges in the adoption of IB by
Kuwaiti banks. However, in Turkey, Polatoglu and Ekin (2001) studied the influence
of the diffusion of IB, and suggested nine factors. These were "relative advantage",
“observability", "trialability", "complexity", "perceived risk", "type of group", "type
of decision", and "marketing effort". The authors found that the more reliable the IB
services were, the more usage there was of the IB services by the customers.
In South Korea, Suh and Han (2002) concluded that trust is one of the most
significant beliefs in explaining a customer's attitude towards using IB. As suggested
by the TAM, customer perception of the usefulness and ease of use of IB also affects
attitudes significantly. At the same time, behavioural intention to use IB is highly
related to customers' attitudes, perceived usefulness, and trust. These results imply
that customers rely on trust in on-line environments that are processing sensitive
information. In Taiwan, Wang et al. (2003) examined the extension of the TAM
model, by investigating the factors that lead to behavioural intention in IB adoption.
They reported that perceived ease of use, and perceived usefulness had a positive
effect on people's intention to adopt IB.
Figure 2.8: Factors that lead to behavioural intention in IB adoption.f 11
Source: (Wang et al., 2003).
Page 59
43
Like most Muslim countries, Malaysia has a dual banking system; that is, it has a
conventional banking system and an IsB system. There are two Islamic banks in
Malaysia: the Bank Islam Malaysia and Bank Muamalat. The early 1990s saw the
emergence of Automated Voice Response (AVR) technology. Using AVR
technology, banks offered tele-banking facilities for financial services. With further
advancements in technology, especially with the introduction of IB services, banks
were able to offer services through PCs owned and operated by customers at their
convenience by using proprietary intranet software (Sadeghi & Farokhian, 2011). A
study was also conducted in Turkey by Akinci et al. (2004). This study attempted to
describe the IB phenomenon primarily by analyzing the attitudes, behaviour, and
preferences of highly educated consumers. The distinguishing demographic,
attitudinal, and behavioural characteristics of IB users and non-users were
investigated in an academic institution. The analyses provided evidence that there
were significant differences between the two groups with respect to demographic
profiles, attitudinal properties, and preferences for service delivery channels. While
the IB users were middle-aged, male, more technology-oriented, and convenience-
minded, non-users were either younger (below 30 years of age), or older, more
traditional-channel oriented, and hesitant consumers, lacking confidence in IB
services compared to the services delivered at bank branches.
Kassim and Ahmed (2006) conducted a study in Qatar investigating the trust-
relationship commitment model1 (MH94) to an IB setting by adding “attraction to use
1 Morgan and Hunt (1994) (MH94) developed a trust-relationship commitment model that strongly
advocated making trust central to rational exchange. The consumer adoption of electronic commerce
will proceed only after the risk perception associated with the use of electronic media is alleviated.
The trust-relationship commitment model discussed some factors that shape customer attitudes
towards the use of e-commerce.
Page 60
44
IB services” as a new factor. The study showed that in testing whether attraction
might be related to belief in and use of IB, this research sampled 276 bank customers'
responses via a cross-sectional survey in Doha, Qatar. It was found that attraction has
a significant positive relation with relationship commitment with their banks. Their
study has serious implications for managers, bankers, and policy makers, as it
suggested that it is the customers' attraction with banks that influences the differences
on actual commitment. The findings of their study suggest that, in order to develop
acceptance and to attract more users to IB, it is not going to be enough to make
interaction with the system easy.
In Malaysia, Poon (2008) explored the determinants of users’ adoption momentum of
e-banking by examining the factors affecting the adoption of e-banking services.
Anonymous questionnaires were randomly administered to a total of 500 respondents
from different states within Peninsular Malaysia. These questionnaires were
administered face to face; thus, the response rate was satisfactorily high. Ten
attributes were tested: convenience of usage, accessibility, features availability, bank
management and image, security, privacy, design, content, speed, and fees and
charges. The results from this study indicated that all elements of the ten identified
factors are significant with respect to the users’ adoption of e-banking services.
Privacy and security are major sources of dissatisfaction, and have significantly
affected users’ satisfaction. Meanwhile, accessibility, convenience, design and content
are sources of satisfaction. Besides, speed, product features availability, and
reasonable service fees and charges, as well as the bank’s operations management
factor are critical to the success of e-banks. The results revealed that privacy; security
and convenience factors play an important role in determining the users’ acceptance
of e-banking services with respect to demographic segmentation of age group,
Page 61
45
education level and income level. Belkhamza and Wafa (2009) confirmed also that
the security issues and system risks of e-commerce are the major determinants of the
adoption behaviour in Algeria.
In India, Safeena et al. (2011), by using regression analysis, they dnuof that
perceived: usefulness, ease of use, and risk are important determinants of OB
adoption. This study met the desired objective but suffered from one setback: the
relatively small size of the sample limited generalization of the outcome of the study.
As a total of 300 questionnaires were distributed by mail to student customers of the
institute who use IB services, from which 116 responses were obtained indicating
38.67 percent rate of return. Their study was conducted to explore the factors
influencing intentions to adopt IB services. They suggested replication their study on
a wider scale with more IB customers and with different national cultures is essential
for the further generalization of the findings.
Masocha et al. (2011) found that the vitality of technology utilisation by banks in
establishing competitiveness in rural areas in South Africa is unarguable. The
computer-mediated environment has profound implications particularly in the banking
sector and it is widely acknowledged that customers increasingly require instant
gratification through the use of new technologies. Their study provides primary
information to guide banks in structuring their marketing strategies, quality
improvements and business processes on the backdrop of rural milieus. A sample of
100 respondents from various banks found in Alice in South Africa was utilised in the
primary research surveys. Importantly, the majority of the respondents indicated that
they were influenced to conduct their banking activities with a bank which uses
Page 62
46
advanced modern banking technologies. However, recent banking methods such as
cell phone and IB reflected very low levels of usage by customers.
Nasri (2011) investigated the factors influencing the adoption of IB in Tunisia. The
purpose of this study was to determine those factors that influence the adoption of IB
services in Tunisia. A theoretical model is provided that conceptualizes and links
different factors influencing the adoption of IB. A total of 253 respondents in Tunisia
were sampled: 95 were internet bank users, and 158 were internet bank non users.
Factor analyses and regression techniques were employed to study the relationship.
The results of the model showed clearly that use of IB in Tunisia is influenced most
strongly by convenience, risk, security and prior internet knowledge. Only
information on OB did not affect intention to use IB service. The results also
suggested that demographic factors, specifically, occupation and education level,
significantly affect intention behaviour toward the adoption of IB. Finally, their paper
suggested that an understanding of the factors affecting intention to use IB is very
important to the practitioners who plan and promote new forms of banking in the
current competitive market.
Figure 2.9: Factors influencing the adoption of IB in Tunisia.f 12
Source: ( Nasri, 2011).
Page 63
47
Mansumitrchai and Chiu (2012) conducted a study in the UAE investigating the
factors affecting the adoption of IB. IB has been utilized for many years in the UAE,
and the number of IB adopters has increased steadily. The main focus of this study
was to identify the characteristics of UAE consumers and their attitudes toward IB.
Factor analysis suggested that seven characteristics are important for IB adoption:
compatibility, difficulty, security, trust, third party concern, status, and human
contact. An analysis of variance showed that adopters and non-adopters differed in
their attitudes toward three factors of adoption, namely, compatibility, trust and
human contact. No significant differences were found between the attitudes of
adopters and of non-adopters toward the issues of security, third party concern and
status. An interesting finding was that human or physical contact and trust were the
most important factors for non-adopters.
In Romania, Moga et al. (2012) conducted a study investigating the effect of trust and
security in e-banking adoption. The consideration given to e-banking by the current
traditional banking customers may be due to changes in the banking consumers’
lifestyle, with this lifestyle becoming compatible with the new way of conducting
banking services online. However, the literature related to e-banking shows that trust
and security are among the central factors that influence banking customers’
acceptance of the service. The purpose of their study was to review measures taken by
the government of Romania and major banks in the country in tackling the issue of
trust and security in e-banking. In particular, the study focused on reviewing legal
provisions instituted by the related ministry regarding e-banking practices and the
strategies taken by banks to address the security concerns about the service. Based on
the review, it was found that Romania has legal frameworks in place and banks have
also adopted measures to address the issue. However, whether or not these measures
Page 64
48
are effective in alleviating banking consumers’ security concerns is as yet uncharted
and needs to be investigated.
2.3.3 Attitudes towards IT and IB in Developed Economies
In the USA, Fram and Grady (1995) conducted a study, using an online survey, which
focused on internet buyers from an online consumer perspective. They found that
most concerns condensed into a collection of transaction issues, such as a lack of
credit card security, vendors not being fully identified, and a lack of payment
alternatives. Likewise, Then and Delong (1999) identified “fear of doing financial
transactions over the Internet” as the most significant barrier that prevents online
browsers from becoming online buyers. Security concerns in this context refer to
consumers’ beliefs that online companies are not able to protect their transaction’s
information from being stolen during transmission or storage (Salisbury et al., 2001;
Belanger et al., 2002), and these concerns have a notable impact on an individual’s
decision to buy online (Yang and Jun, 2002).
There are several models that provide a strong basis of knowledge about attitudes
towards technology and its acceptance. According to Sagi (2003), many recent studies
on attitudes and the acceptance of PCs, the Web and e-commerce, are based on the
technology-acceptance work of Ajzen, Fishbein and Davis (1989). Simon (2001)
focused on his study on culture and gender regarding website perception. His study
found that culture and gender influence perception of using IT, and the influence of
gender differs between cultures. For example, married customers are more likely to
use the internet than are unmarried ones. Moreover, Zhang et al. (2002) surveyed
students in China and the USA and found that prior IT experience and gender are
important factors in forming attitudes about IT in general and e-commerce in
Page 65
49
particular. In the next sections, the popular models and theories in the field of
customer attitudes toward using IB are highlighted. Liao and Cheung (2002)
identified that individual expectations regarding accuracy, security, transaction speed,
user-friendliness, user involvement, and convenience were the most important
attributes in the perceived usefulness of internet-based e-retail banking in China,,
In Australia, Sathye (1999) studied the factors affecting the adoption of IB by
Australian consumers. The sample for his survey was drawn from individual residents
and business firms in Australia, with a sample size of 1,000 users; 1,000
questionnaires were posted, using the Australian telephone directory to obtain
addresses, and the response rate was 59%. His study found that security concerns,
resistance to change and a lack of awareness about IB and its benefits stand out as
being obstacles to the adoption of IB in Australia. Figure (2.10) shows Sathye’s
model, and it focused on six factors: security, ease of use, awareness of service and its
benefits, reasonable price, no resistance to change, and availability of infrastructure.
The Wallis Report (1997) stated that new technology adoption by the majority of the
customers depends, mainly, on these factors.
Figure 2.10: Sathye’s model of IB adoption.f 13
Source: (Sathye, 1999).
No security concerns
Ease of use
Awareness of service and its benefits
Reasonable price
No resistance to change
Availability of infrastructure
Adoption of IB by
Consumers
Page 66
50
In Finland, Karjaluoto et al. (2002) showed that prior experience with computers and
technology, and attitudes towards computers influence both attitudes towards OB and
actual behaviours. Their study revealed that, among these factors, prior computer
experience had a significant relation with OB usage while positive personal banking
experience seemed to have an effect on both attitudes and usage, with satisfied
customers intending to keep with their current delivery channel.
In the UK, Howcroft et al. (2002) studied the consumers’ existing financial services
behaviour and assessed their attitudes towards home-based services, such as Tele-
Banking and IB. Some of the data of this study were collected by questionnaire and
the remainder were collected by conducting focus groups. The questionnaire was sent
to a cross section of 4,000 UK consumers aged 18 years and above. This resulted in
351 responses, of which 286 were usable (usable response rate of 7.5%). The data
were analyzed using frequencies, cross tabulation and chi-square tests of statistical
significance. The findings revealed that younger aged customers were found attracted
with using the IB services than the older customers. Gender factor has been found
encouraging or discouraging utilizing the IB services, as female were found less
encouraged to use IB. In addition to that security has been found also significant
factors for encouraging or discouraging the consumers’ use of IB as customers' fears
of error are discouraging customers' usage of IB services.
Previous studies that looked into IB adoption were based on TAM and the diffusion of
innovations theory. Wungwanitchakornm (2002) identified a different set of variables
to frame a model of IB adoption and other IB customer concerns regarding some other
specific, current and future banking services. In addition to the, cost, service
awareness, convenience, demographic factors such as age and income variables;
Page 67
51
social values and social characteristics have been found impacting the customers’
attitudes towards the adoption of IB. In addition to different factors; this research
utilized the social values to introduce the religious factor to investigate its relation
with the customers’ attitudes toward the IB services in a country such as SA.
Wungwanitchakornm’s (2002) model is presented in Figure 2.11:
Figure 2.11: A model for IB adoption.f 14
Source: (Wungwanitchakornm, 2002).
In Finland, Mattila et al. (2003) found that income and education factors had a
significant effect on the adoption of IB among elder consumers. However, perceived
difficulty in using computers and a lack of personal experience in e-banking were
found to be the main barriers for adoption. The data of this research were collected by
means of a questionnaire sent by post to 3,000 individual bank customers in Finland.
The survey sample consisted of three consumer segments (non-users, new users, old
users) that differed in terms of IB experience. Three questionnaires were partly
Perceived characteristics of
internet banking: Relative advantage
-Economic benefits
-Improves service level
-convenient
Customer learning requirement
-Compatibility
-Complexity
-Trialability
Perceived risk
-Functional risk
-Security risk
Cost
-Purchase cost
-Usage cost
Social value
Personal characteristics: Socioeconomic
-Age
-Income
Personality traits
-inner-directedness
-Attitude toward change
-venturesomeness
Social characteristics
-Opinion leadership
Product category usage
-Electronic banking usage
-Internet usage
-Purchase over the Internet
Intention to
adopt
internet
banking
Adoption
of internet
banking
Specific services
Current services
Future services
Page 68
52
tailored to these groups. After a follow-up round, a total of 1,201 questionnaires were
received, of which 1,167 (response rate 38.9) were analyzed using factor analysis.
Yousafzai et al. (2003) extended an area of IS research into a marketing of financial
services context by looking into the element of trust and risk in e-banking. A
conceptual model of trust in e-banking was proposed with two main antecedents that
influence customers’ trust: perceived security and perceived privacy. The antecedent
variables were moderated by the perceived trustworthiness attributes of the bank,
which includes benevolence, integrity, and competence. Trust was defined as a
function of the degree of risk involved in the e-banking transaction, and the outcome
of trust was proposed to be a reduction in the perceived risk, leading to positive
intentions towards the adoption of e-banking. Their study provided several insights
into the role of perceived security, privacy, and trustworthiness in e-banking. Their
study also highlighted the importance of using security and privacy as two distinct
analytical concepts, even though they may be conceptually related.
In the US, Khan (2004) found that distance to the closest bank branch does not affect
the likelihood of OB use by a household. The results suggested that online channels
may be viewed as a supplement to other, more traditional channels. This study also
found that the relationships of various individual and bank specific characteristics
with the OB use changed from 1998 to 2001, because of the rapid diffusion of the
internet in the late 1990s and the corresponding rise in the availability, acceptance,
and familiarity of the internet as an additional business channel. The data of his study
were analyzed using regression analysis and were collected by interview, using a
secondary data through an existing survey conducted by the Survey of Consumers
Page 69
53
Finances (SCF) from the US Federal Reserve board. The SCF interviewed about
4,309 households in 1998, and about 4,449 households in 2001.
In Finland, Pikkarainen et al. (2004) developed a theoretical model, Figure (2.12),
which was an extension to TAM. This model was developed based on the literature
review and a focus group interview with four business professionals from the banking
sector; it is a model indicating the acceptance of OB. The model consists of six
factors, namely, perceived usefulness, perceived ease of use, perceived enjoyment,
information on OB, security and privacy, and quality of internet connection, which
they posited would have an effect on the acceptance of OB.
Figure 2.12: Pikkarainen et al.’s model of IB use.f 15
Source: (Pikkarainen et al., 2004).
Lichtenstein and Williamson (2006) developed theoretical framework in Australia
from themes identified from the literature review. Some other themes were identified
by participants in focus group interviews when making their banking service delivery
channel choices and these were selected as factors in the model. On the other hand,
the temporal sequence for some factors was suggested by the way participants linked
these factors in the collected data. The framework shows that a bank must first attract
banking customers’ attention to the IB service before the customers will consider IB.
Perceived usefulness
Perceived ease of use
Perceived enjoyment
Information on online banking
Security and privacy
Quality of internet connection
Online Banking
Use
Page 70
54
However, unless the customers have a high level of internet accessibility at home or at
work, they are unlikely to consider using IB.
Figure 2.13: Lichtenstein and Williamson’s model of IB adoption.f 16
Source: (Lichtenstein and Williamson, 2006).
The model (Figure 2.13) also allow customers to assess whether it is convenient to
conduct their banking that way (convenience), how usable the application appears to
be (usability), and their perceived competence at internet use and banking application
use (self-efficiency). The four factors of accessibility, self-efficiency, convenience
and usability are interrelated, as will be shown later. The customers also consider
whether the perceived relative advantages of IB compared with other banking forms
outweigh the perceived risks and costs. In addition, the availability of sufficient
support and in-depth knowledge from the bank and its employees contribute
significantly to the adoption decision.
Corrocher (2006) examined the determinants of IB adoption among Italian retail
banks; his study aimed to investigate the nature of IB in relation to traditional banking
activity. In doing so, his study analysed the role of firm-specific and market-specific
characteristics in affecting the decision to provide financial services via the internet.
Accessibility
Usability
Convenience
Relative
advantage
Risk and cost Internet
Banking
Adoption
Knowledge and support
Self-efficiency
Attention
Page 71
55
The data were gathered from the available dataset that lists all the adopters of IB per
month in Italy between September 1995 and December 2000. In order to analyse the
effect of explanatory variables on the hazard rate, he adopted Cox’s approach1 to the
proportional hazard (Kiefer, 1988; Greene, 1997) for the estimation of the model. His
study found that the adoption of IB depends upon the characteristics of traditional
banking activities, particularly in terms of existing networks of distribution and
existing customers. First, banks with a high branching intensity adopt IB more slowly
than do banks with only a few branches in place. Second, adoption is negatively
affected by the existence of a large customer base, once we control for assets. An
important consequence of this is that the provision of financial services over the
internet is a strategy directed more at attracting new customers than at strengthening
the relationship with existing ones.
In Finland, Maenpaa et al. (2007) found previous knowledge and prior experience of
IB services significantly influence the customers’ perceptions towards the adoption of
IB services. The data for this study were collected using personal, face-to-face,
structured interviews as part of a nation-wide range of consumer study in Finland. The
sample was created using quota sampling so as to be representative of the Finnish
population; 300 active users of IB, aged between 15 and 74, comprised the sample for
this study, and 281 responses were received. A principal components analysis was
carried out on all the chosen dimensions for their study to provide a single measure
for each dimension.
1 In order to analyse the effect of explanatory variables on the hazard rate, researchers adopt
Cox’s approach to the proportional hazard for the estimation of the model. This method is a
semiparametric approach to survival analysis. It does not require the probability distribution
F(t) to be specified and utilises regression parameters in the same way as generalised linear
models.
Page 72
56
Lee (2009) conducted a study to investigate the effect of perceived risk and benefit on
customers’ behavioural intention to use OB and to clarify which factors are more
influential in affecting the decision to use OB. He examined five specific risk facets –
financial, security/privacy, performance, social and time risk -and found that “the
intention to use OB is adversely affected mainly by the security/privacy risk, as well
as financial risk”. These findings have been supported by another recent study
conducted by Hua (2009) regarding OB acceptance in China. Hua (2009) showed that
perceived ease of use is of less importance than privacy and security and clarified that
“security is the most important factor influencing user's adoption”.
Hosein (2009) identified areas in which banks could improve or modify their services
to increase the adoption rate of IB. Data were gathered from the US's non-IB users via
a survey questionnaire. The results from the respondents were analyzed using
Structured Equation Modelling (SEM) from which the hypotheses were tested and
conclusions were drawn. This analysis indicated that the R² for ‘willingness to adopt’
was 0.141 (14.1%), reflecting that the model does not provide a strong explanation of
the variance. This indicates that the model cannot be used as a good method of
explaining what causes these differences and is not useful in predicting ‘willingness to
adopt’, or ‘intent to use’ IB. Also, the R² for ‘perceived usefulness’ was 0.447
(44.7%) and ‘perceived ease of use’ was 0.322 (32.2%), which represent a strong
explanation of the variance of these endogenous variables. His study revealed that
customers find it difficult to use IB, leading to a decrease in the adoption of IB.
Mangin et al. (2011) focused in their study on the importance of the impact of two
external latent variables, ‘price’ and ‘convenience’, on the latent variable ‘perceived
usefulness’ of OB in a Canadian environment; the model highlights the predictive
Page 73
57
importance and the accuracy of the results. The results for the Canadian on-line
banking environment are quite similar to those of previous investigations in Spain and
explain without any ambiguity the level of ‘perceived usefulness’ in the TAM Model
(see section 2.2.4 and Figure 2.4). The model is strongly supported in a Canadian
banking environment, as the influence of the ‘perceived usefulness’ on ‘attitude
towards using’ is very strong as well as the effect of ‘attitude towards using’ on the
‘intention to use’ of banking on line.
Yousafzai et al. (2012) conducted a study in the UK to deepen the understanding of
customers’ actual IB behaviour by combining the construct of technology readiness
with the TAM and demographics, such as age and gender, into one integrated
framework. The results indicated the importance of customer-specific factors in
predicting actual behaviour. Technology readiness, age, and gender moderate strongly
the beliefs-intention relationship. Customers with varying levels of technology-related
views and demographics hold different beliefs about technology. The relationship
between usefulness and behaviour was stronger for younger males with high levels of
optimism and innovativeness (explorers and pioneers), whilst the relationship between
ease of use and behaviour was stronger for older females with a high level of
discomfort. Greater understanding of seemingly established relationships could
improve the design of the service and the development of differential marketing
strategies aimed at driving adoption and allaying rejection. Table (2.1) provides a
summary of the above reviewed international literature with a comparasion of the
main findings of these studies in the developed countries, developing countries and
SA. However, additional list of literature is presented in appendix (A).
Page 74
58
Country Author Factors affecting attitudes towards IT & IB
In SA
Al-Khaldi and
Wallace (1999)
lack of knowledge, social values, and
infrastructure availability.
Al-Ashban and
Burney (2001)
Income levels, education, age and occupation.
Al-Gahtani et al.
(2007)
Gender, age, experience and voluntariness of
use.
Al-Somali et al.
(2008)
Quality of the internet connection, the
awareness of OB and its benefits, the social
influence, computer self-efficacy, Education,
trust and resistance to change.
Alsajjan and Dennis
(2010)
Perceived usefulness and trust fully mediated
the impact of SNs and perceived
manageability on attitudinal intentions.
Mahdi (2011) Security and Trust.
In developing
countries
In Kuwait, Aladwani
(2001)
Security, regulations, consumer privacy and
the bank's reputation.
In Turkey, Polatoglu
and Ekin (2001)
"relative advantage", “observability",
"trialability", "complexity", "perceived risk",
"type of group", "type of decision" and
"marketing effort".
In South Korea, Suh
and Han (2002)
Trust, customer perception of the usefulness
and ease of use of IB.
In Taiwan, Wang et
al. (2003)
Perceived ease of use and perceived
usefulness.
In Malaysia, Poon
(2008)
Convenience of usage, accessibility, features
availability, bank management and image,
security, privacy, design, content, speed and
fees and charges.
In Turkey, Akinci et
al. (2004)
Gender and age.
In Qatar, Kassim and
Ahmed (2006)
Attraction to use IB services.
In Algeria,
Belkhamza and Wafa
(2009)
Security issues and system risks of e-
commerce.
In India, Safeena et
al. (2011)
Perceived: usefulness, ease of use and risk.
In South Africa,
Masocha et al. (2011)
Vitality of technology utilisation by banks.
In Tunisia, Nasri
(2011)
Convenience, risk, security, prior internet
knowledge, occupation and education level.
In UAE,
Mansumitrchai and
chiu (2012)
Compatibility, difficulty, security, trust, third
party concern, status, and human contact.
In Romania, Moga et
al. (2012)
Trust and security.
In developed
countries
In the USA, Fram and
Grady (1995)
Lack of credit card security, vendors not being
fully identified, and a lack of payment
alternatives.
In Australia, Sathye
(1999)
Security concerns, resistance to change and a
lack of awareness about IB and its benefits.
Page 75
59
In Finland, Karjaluoto
et al. (2002)
Prior experience with computers and
technology and attitudes towards computers.
In the UK, Howcroft
et al. (2002)
Gender, age and security.
In Finland, Mattila et
al. (2003)
Income, education, perceived difficulty in
using computers and a lack of personal
experience in e-banking.
In UK, Yousafzai et
al. (2003)
Perceived security, privacy and
trustworthiness.
In the US, Khan
(2004)
Rapid diffusion of the internet in the late
1990s and the corresponding.
In Italy, Corrocher
(2006)
Characteristics of traditional banking
activities, particularly in terms of existing
networks of distribution and existing
customers.
In Finland, Maenpaa
et al. (2007)
Previous knowledge and prior experience of
IB services.
In China, Lee (2009) Security/privacy risk and financial risk.
In China, Hua (2009) Security, privacy and perceived ease of use.
In US, Hosein (2009) Perceived usefulness, perceived ease of use.
In Canada, Mangin et
al. (2011)
Price, convenience and perceived usefulness.
In UK, Yousafzai et
al. (2012)
Technology readiness, age and gender.
Table 2.1: Factors impacting the customer attitudes towards IT and IB in the developing & developed
countries and SA.t 4
2.4 The Research's Conceptual Model and Hypotheses Development
IB is a new distribution channel for the delivery of banking services. From both
academic and practical perspectives, it is interesting to understand and assess
customer attitudes toward the adoption, use, and success of IB services. Previous
research by Al-Qahtani (2007a) investigated the banks’ perspective of IB in SA,
whereas Al-Qahtani (2007b, 2008) reviewed the literature and developed a
preliminary conceptual framework and model of the factors influencing customer
perception of IB; a series of relevant hypotheses for testing along with a survey-
questionnaire was used in the primary data collection.
2.4.1 Research Conceptual Model Development
This research’s conceptual model has extended TAM model by adding new
constructs; in addition, the research model was modified utilizing other well-tested
Page 76
60
models such as but not limited to (Sathye, 1999; Wungwanitchakornm, 2002;
Pikkarainen et al., 2004; Lichtenstein and Williamson, 2006), which is concerning
technology usage, adoption. Several researchers have studied the causal models and
theories from the adoption and diffusion literature that clarify key dependent variables
of interest, that is, behavioural intention to use (adoption), and use. Fishbein and
Azjen (1975, p. 288) defined behavioural intention as “a person’s subjective
probability that he will perform some behaviour”. The role of intention as a predictor
of adoption behaviour has been recognized in IB and IS research (Taylor and Todd,
1995). However, use is measured by the frequency, and intensity of IB usage.
For the successful implementation of new systems, for every change in the service
distribution system, customers should change their behaviour and banks should rely
upon customers’ willingness and ability to change (Bateson and Hoffman, 1999).
Consequently, despite there being a good understanding of the banking customer’s
acceptance behaviour towards current technology, additional research is required to
recognize how this constant adoption and continuance use will influence successfully
the new wave of technology introduction, such as IB. Accordinglly, the research’s
consptual model responded to the previouse researchers calls and has also been
extended by adding a new facet which is success, following DeLone and McLean
(2003) IS success model, see Figure (2.14).
The research’s consptual’s model has also utilized the DeLone and McLean IS
Success Model by using the “Net benefits” as a success measures, but they cannot be
analyzed and understood without “system quality” and “information quality”
measurements, see Figure (2.14). For example, within the e-commerce environment,
the impact of a website design on customer purchases cannot be fully understood
Page 77
61
without an evaluation of the usability of the website and the relevance regarding the
purchasing decisions of the information that is provided to the prospective purchaser.
As per their original formulation of the D&M Model, “use” and “user satisfaction” are
closely interrelated. “Use” must precede “user satisfaction” in a process sense, but a
positive experience with “use” will lead to greater “user satisfaction” in a causal
sense. Similarly, increased “user satisfaction” will lead to increased “intention to use”
and thus to “use”, see Figure (2.14). As a result of this “use” and “user satisfaction,”
certain “net benefits” will occur. If the IS or service is to be continued, it is assumed
that the “net benefits” of the system are positive. The lack of positive benefits is likely
to lead to decreased use and the possible discontinuance of the IS system.
Figure 2.14: Updated D & M IS Success Model.f 17
Source: (DeLone & McLean, 2003).
Based on the previous models and the literature review, ten factors were identified as
having a relation with customer attitudes towards the adoption, use and success of IB
services. These factors are satisfaction, perceived usefulness, perceived ease of use,
availability of IsB, high security, high cost, self-efficiency, awareness of IB services,
resistance to change, demographic factors and the availability of the infrastructure.
The conceptual model has been divided into three main facets (dependent variables),
that is, adoption “initial use”, use “frequent usage” and success “satisfaction”; as the
Page 78
62
aforementioned factors, “independent variables” are expected to have different
relationships with those three facets.
Gatignon and Robertson (1985) recognized that the diffusion of technology,
especially Internet use, can be affected by technological and social accesses. The
technological access refers to infrastructure and person’s capability in field of
computer software and hardware, while the social access refers to the mix of
education, knowledge, gender, religion and economic resources required for the use of
the internet. With regards to that, a new factor has been introduced in this model; this
is “availability of IsB” as a social values factor which has been introduced in
Wungwanitchakornm’s (2002) model and suggested by Al-Khaldi and Wallace
(1999), is expected to have a relation with IB adoption, use, and success. As Saudi
Arabian IB customers live in a Muslim country, they are also expected to be affected
by the availability of IsB services in their IB transactions. As a result, the previous
studies are also being extended by investigating a new set of independent variables
and adding a new dependent variable “IB success” as a third variable in addition to IB
adoption and use. Therefore, the theoretical model of this research is graphically
presented in Figure 2.15.
Figure 2.15 depicts an extended model for IB adoption and usage models. It has been
extended to include success and to include adoption, use and success facets in one
model. The previous IB studies have focused mainly on IB adoption or use, and in
some other few studies they do combine them in one study. This research thus goes
further in explicitly disaggregating and extending the factors that affect IB adoption,
use and have added a new facet (success) to the model.
Page 79
63
Figure 2.15: Conceptual Model of the factors influencing IB adoption, use, and success.f 18
In particular, the model depicted in Figure 2.15 suggests that satisfaction, perceived
usefulness, perceived ease of use, the availability of IsB, demographic factors and the
usage of IB will have a direct effect on the success of IB, whereas IB adoption will
affect success only indirectly via continued use. Conversely, although the availability
of IsB services on via IB services is expected to have a positive and direct affect on
all three IB facets, it is hypothesised that its effects will be stronger on IB success.
That is, individuals may adopt non-Islamic IB services, but those services with the
longer adoption and more frequent use (i.e. successful) will be of the Islamic variety.
In a comparison of the TAM with this research’s model, the key advantage of the
TAM is that it has a technological focus, which can lead to neglect of the influence of
a customer’s social and psychological perceptions regarding the adoption of a
technology. In addition, the TAM has also been criticized for the lack of
acknowledgement of individual differences (Agarwal and Prasad, 1997). Moreover,
the TAM does not consider previous experience, age, gender, and many other
personal traits that may affect customer attitudes towards technology, which in turn
Self-efficiency
(+)
IB
Success
High security
(+)
(+)
Demographic factors
(-) Old age (H11)
(+) Education (H12)
(+) Income (H13)
(-) High cost
IB
Adoption
(+) Satisfaction (H7)
(+) Perceived usefulness (H8)
(+) Perceived ease of use (H9)
(+) Availability of IsB (H10)
IB
Use
H1
H2
H3a H3b
H4a H4b
H5b H5a
H6a H6b
H15b
H15a (+) (+) (+) H14b
H14a
a b
c
c b
a
Awareness of IB (+)
(+) Availability of
Infrastructure
(-) Resistance to
change
Page 80
64
influence customers’ intention to use. Therefore, the model of this research proposed
to investigate IB system adoption, usage and success; it also investigated the different
factors which affect each facet separately and found that different factors affect initial
adoption, use and success of IB differently. In particular, on the basis of the above
conceptual framework and model, a list of hypotheses was devised. These are
discussed under the following respective subsections.
2.4.2 Research Hypotheses
2.4.2.1 Awareness
The adoption or rejection of an innovation begins when “the consumer becomes
aware of the product” (Rogers and Shoemaker, 1971). Howard and Moore (1982)
emphasised that for adoption, “consumers must become aware of the new brand”. The
Wallis Report (1997) stated that “consumers will seek out those financial products
and suppliers which offer the best value for money and they are educated about it”.
Hence, for IB adoption, it is necessary that the banks offering this service make the
consumers aware of the availability of such a product and explain how it adds value
relative to other products of theirs or of their competitors.
Awareness has been defined by Guiltinan and Donnelly (1983) as "information
about the benefits of using a product/service". An important characteristic for the
adoption of any innovative service or product is creating awareness among consumers
about the service/product: “Don't assume good products sell themselves” (Cooper,
1997). According to Sathye (1999), because using IB services is a new experience for
many customers, therefore, a low awareness of IB is a major obstacle (factor) which
may lead the customers to not adopt and thus not use IB (Al-Somali et al., 2008;
Hosein, 2010). This research adopted Pikkarainen et al. (2004) definition of
Page 81
65
awareness which has been defined as “the amount of information consumers have
about OB”. Awareness of the IB services constructs operationalisations have been
adopted from Pikkarainen et al. (2004), as they used a five point Likert scale and
measured, in this research, by a similar scale. Questions from A27 to A28 in the
questionnaire (see Appendix B). In short, awareness is expected to have positive
relationship with IB adoption. Hence:
H1: Awareness has a positive relationship with the adoption of IB services.
2.4.2.2 Resistance to change
Resistance to change is one of the factors that potentially affect the adoption of the
existing mode of service or product delivery to fulfil the customers' needs adequately.
In the context of IB, telephone banking, ATMs, and brick-and-mortar branches are the
existing modes of making banking transactions. Adoption of new technologies often
encounters a certain amount of resistance to change from the current ways of
operating. Commenting about technology adoption, Quinn and Mueller (1982) stated
that “humans being what they are, there tends to be resistance to change'', as
customers do not change their normal behaviour towards technology adoption easily
and quickly. For customers to change their present ways of operating and take up a
new technology, it must “fulfil a specific need'' (Wallis Report, 1997). Daniel (1999)
found “a high level of customer inertia in changing their established banking
arrangements”. Unless such a need is fulfilled, consumers may not be prepared to
change from their current ways of operating.
Akamavi (2005) concluded in his study that the move towards a more innovative firm
is not simple, as employees and customers will find it hard to change. Al-Somali et al.
(2008) found that resistance to change also has significant effects on the attitude
towards the likelihood of adopting OB. Nonusers often complain that OB has no
Page 82
66
social dimension, i.e. they are not served in the same way as in a face-to-face situation
at a branch (Hosein, 2010). This research defined resistance to change as defined by
Daniel (1999) as “a high level of customer inertia in changing their established
banking arrangements”. Resistance to change construct operationalisations has been
adopted from Sathye (1999), which utilizes 5 Likert scale rating 5 items from
"major obstacle" to "No obstacle". In short, resistance to change is expected to have
relationship with IB adoption. Hence:
H2: Resistance to change has negative relationship with the adoption of IB services.
2.4.2.3 Self-efficiency
Bandura (1977) defined self-efficiency as one's belief in or judgement on what one
can do with the skill one possesses within a particular domain. Self-efficiency beliefs
or judgements differ in three interrelated dimensions: “generalisability”, “magnitude”,
and “strength”. Within a computing context, these skills might be what users can do
with such skills, such as using software to analyse data (Compeau and Higgins, 1995).
“Generalisability” shows the degree to which one's belief is limited to a specific
domain of the activity or not (Chan and Lu, 2004).
Thus, individuals with high “generalisability” are expected to be able to use different
computer systems and software packages confidently. The “magnitude” refers to the
level of capability expected. Thus, individuals with high “magnitude” (i.e. self-
efficiency) perceive themselves as more competent to accomplish more difficult tasks
with minimum support and assistance than are those with a lower “magnitude” of
self-efficiency.
The “strength” of self-efficiency refers to the confidence an individual has in his/her
ability to perform tasks, as mentioned earlier. Researchers (Venkatesh and Davis,
Page 83
67
1996; Wang et al., 2003) suggested that individuals with high computer self-
efficiency are expected to be able to use computer systems more regularly because
they feel “comfortable” about computers, in contrast with those with a low “strength”
of self-efficiency. Lassar et al. (2005) studied the relationship between consumer
innovativeness and personal characteristics in the USA, and found that domain-
specific consumer innovation, self efficacy, and utilitarian-based web use affect the
adoption of OB positively. This research utilized Bandura (1977) defention of self-
efficiency as “one's belief or judgement on what he or she can do with the skill he or
she possess within a particular domain”. Self-efficiency construct operationalisation
has been adopted from Wang et al. (2003), as they used 7 Likert scale. In this study,
a 5 Likert scale has been utilized from "strongly disagree" to "strongly agree". The
adapted scale was modified to suite the IB context. Questions from A29 to A31 in the
questionnaire (see Appendix B) represent the variable. In short, self-efficiency is
expected to have positive relationship with IB adoption and use. Hence:
H3: Self-efficiency has a positive relationship with IB services a) adoption and b)
use.
2.4.2.4 The availability of infrastructure
Access to computers/ the internet is required before the adoption of the IB is possible.
O’Connell (1996) identified the lack of access to computers and the internet as
possibly being one of the main reasons for slow adoption of IB. Al-Khaldi and
Wallace (1999), and Daniel (1999), identified customer access to PCs as one of the
main reasons for the low usage of e-banking in the UK and Ireland. The Wallis Report
(1997) stated that “as the Internet becomes more widely accessible … households will
conduct their financial transactions over the Internet''. Sathye (1999) defined the
availability of infrastructure as the accessibility to computers and internet services.
Page 84
68
Hence, if IB is not being adopted in SA, it may be because of a lack of access to
computers and/or the internet. OB offers many benefits to banks as well as to
customers. However, when compared globally, the percentage of online users is not
as high in the USA as in other regions of the world. There can be several reasons for
this, the most obvious being that customers need to have access to the internet in order
to utilize the service (Hosein, 2010). This research defined the availability of
infrastructure as defined by Sathye (1999) “the accessibility to computers and
internet services”. Availability of infrastructure construct operationalisations has
been adopted from Sathye (1999). A 5 Likert scale rating 5 items from "major
obstacle" to "No obstacle" has been adopted in this study. Questions A2B1 and
A2B2 in the questionnaire (see Appendix B) represent the variable. In short, the
availability of infrastructure is expected to have positive relationship with IB
adoption. Hence:
H4: Availability of IB infrastructure has a positive relationship with the a) adoption
and b) use of IB services.
2.4.2.5 Security
Banks need to search for a way to reassure customers about the security and
confidentiality of their transactions online. Security concepts, in general, refer to the
ability to offer protection against potential threats. Several studies revealed that
security, privacy, trust, and risk-related concerns may affect consumer IB choices. In
the first quarter of 2005, it was reported that 80% of global phishing attacks targeted
the financial services sector (IDC, 2005). O'Connell (1996) concluded that “security
concerns” were one of the main reasons for the slow development of IB in Australia.
Moreover, a study on IB in Australia concluded that “security concerns among banks
and customers” were keeping both away from IB (ABF, 1997). In Australia, Sathye’s
Page 85
69
(1999) study highlighted consumer security fears while Ramsay and Smith (1999)
found privacy to be a key consumer concern.
Salisbury et al. (2001) found that perceived security is a much stronger determinant
of intention to purchase online than the perceived ease of use and usefulness of the
website. Likewise, Miyazaki and Fernandez (2001) showed that the rate of online
product purchase is closely related to the perceived security control possessed by a
website. According to Polatoglu and Ekin (2001), security comprises three
dimensions: reliability, safety, and privacy. If an individual believes that the bank
guarantees privacy, keeps their data securely, has a good public reputation, and
provides reliable services, then they are more likely to consider IB adoption and be
strongly motivated to use it to conduct a significant number of their transactions.
Chung and Paynter (2002) reported that consumer fears regarding transaction security
were an inhibitor to the adoption of IB. Perceived security controls describe the
degree to which an e-commerce website is perceived to be secure and able protect
other information from potential threats (Hua, 2009). Therefore, heightened security
concerns could stop potential damage ensuing from insecure transactions, hacking, or
poor access control to important data (Hesson and Alameed, 2007). Security has also
been identified as a key consumer concern in other IB adoption studies (e.g. Black et
al., 2002; Siu and Mou, 2005; Poon, 2008; Adesina and Ayo, 2010). As defined by
Salisbury et al. (2001), this research defiened Security as “the extent to which one
believes that the World Wide Web (WWW) is secure for transmitting sensitive
information”. As the adoption of purchasing products, on the WWW may involve a
greater degree of risk than the adoption of other IT innovations. When one
purchases products online, there may be a perception of risk involved in transmitting
Page 86
70
sensitive information such as credit card numbers across the WWW. Security
construct operationalisations have been adopted from Pikkarainen et al. (2004),
utilizing a five point Likert scale from "strongly disagree" to "strongly agree".
Questions from A22 to A26 in the questionnaire (see Appendix B) represent the
variable. In short, security factors are expected to have positive relationship with IB
adoption. Hence:
H5: High security has a positive relationship with the a) adoption and b) use of IB
services.
2.4.2.6 High Cost
High cost is another factor that affects customer adoption of innovation. In the context
of IB, there are two types of costs. The first is associated with internet activities and
the second with bank costs and charges. Howard (1977) highlighted the importance of
“price factors” in the adoption and diffusion of innovation. Rothwell and Gardiner
(1984) reported that “there are two fundamental sets of factors defining user needs,
namely price factors and non-price factors”. Guadagni and Little (1983), Mazursky et
al. (1987) and Gupta (1988) identified “price” as a major factor in brand switching.
Moreover, Cooper (1997) concluded that innovative products often have superior
"price/performance” characteristics. The Wallis Report (1997) mentioned that for
"consumers to use new technologies, the technologies should be a reasonable priced
relative to alternatives". Customers seem to consider that they could obtain lower cost
services by using the internet than by going to the bank (Sathye, 1999; Karjaluoto et
al., 2002; Gonzalez et al., 2004). This research utilized Sathye (1999) IB services
Cost defention as the normal costs associated with internet activities or charges
when placing a financial transaction via the internet. Cost is measured utilizing 5
Likert scale rating 5 items from "major obstacle" to "No obstacle". Question A2B4
Page 87
71
in the questionnaire (see Appendix B) represents the variable. In short, high cost
factor is expected to have negative relationship with IB adoption and use. Hence:
H6: High cost has a negative relationship with IB services a) adoption and b) use.
2.4.2.7 Satisfaction
Customer’s satisfactions is defined by Solomon (2010), as the overall customer’s
feelings about a product/ service after they bout it. Inline with this diffention; Kotler
and Keller (2009) have also defined customer’s satisfaction as a person’s feelings of a
pleasure or disappointment that result from comparing a product’s perceived
performance to their expectations. Customer satisfaction is a key to success in IB and
banks will use different media to customize products and services to fit customers'
specific needs in the future Mattila (2001). It has been reported that IB saves time and
money and has a positive relation with customer satisfaction towards the usage and
success of IB (Mattila, 2001; Polatoglu and Ekin, 2001; Karjaluoto et al., 2002).
IB offers new value to customer because it makes available a full range of services
that are not offered in branch offices (Karjaluoto et al., 2002). Modern Internet
technology makes it possible to create customized banking services for every
individual customer (Mattila, 2001). According to Daniel (1999), customers' value
features in IB such as convenience, increased choice of access to the bank, improved
control over their banking activities and finances, ease of use, speed, secure, saves
customer’s time and money. Hiltunen et al. (2002) argued that a key factor in this
competition for online customers is the quality of customer service, which includes
the usage of IB services.
Several researchers have identified convenience as an important factor that influences
IB adoption (Ramsay and Smith, 1999; Thornton and White, 2001; Pew, 2003;
Page 88
72
ACNielsen, 2005). Accessibility, which is related to convenience, has also been
reported as an important factor for adoption (Ramsay and Smith, 1999). Interestingly,
Chung and Paynter (2002) found that many people who did not use IB believed they
were not in need of high levels of convenience. In the US, a survey found the main
motivation for using IB to be convenience in terms of 24/7 access and time savings
(Karjaluoto et al., 2002; Pew, 2003; Sarel et al., 2003; Lee et al., 2005; Adesina and
Ayo, 2010; Mangin et al., 2011). Gonzalez et al. (2004) also identified that speed of
access is an important factor, which relates to the customer satisfaction. Hence, banks
shall ensure that their IB offerings were efficiently handled and their online service
brought the benefits to satisfy customers (Pikkarainen et al., 2004).
This research adopted Solomon (2010) Customer’s satisfactions defention as the
overall customer’s feelings about a product/ service after they bought it. Generaly
speeking if IB customers have benefits out of the used service this will be reflected
positively on their attitiudes and behaviours towards their IB services utilization. In
this research, factor analysis was performed on the IB satisfaction variable and was
divided into three dimensions (see Table 6.1). Therefore, items A7, A5, and A4 are
grouped under one dimesion, which measures the convenience of using the IB
services, which is described in terms of lifestyle, workplace use, household use
(Polatoglu and Ekin, 2001; Pew, 2003). The second dimension, which included three
items (A6, A3, A1), measures the time-saving dimension of IB services, which is
described in term of “not having to travel, and not having to wait” (Polatoglu and
Ekin, 2001; Pew, 2003). The third dimension, which includes three items (A9, A2,
A8), measures the fulfilment dimension of IB services, which is described in terms of
the extent to which the customers’ needs are fulfilled (Polatoglu and Ekin, 2001).
Satisfaction construct operationalisation has been adopted from Polatoglu and Ekin
Page 89
73
(2001), as they used a five point Likert scale rating 5 items from "strongly disagree"
to "strongly agree". In this study, respondents were asked to rate their satisfaction on
nine items (A1-A9) (see Appendix B). In short, satisfaction is expected to have
positive relationship with IB adoption, use, and success. Hence:
H7: Satisfaction has a positive relationship with the a) adoption, b) use, and c)
success of IB services.
2.4.2.8 Perceived ease of use
Davis (1989) defined perceived ease of use as the degree to which a person believes
that using a particular system would be free of effort. A significant number of studies
have suggested that perceived ease of use influences customer attitudes towards the
adoption of new technologies (Davis et al., 1989; Agarwal and Prasad, 1997;
Venkatesh, 1999; Venkatesh and Davis, 2000). For example, Cooper (1997) identified
that "ease of adoption" was one of the three most important characteristics from the
customer's perspective for the adoption of innovative services. "The degree to which
an innovation is difficult to understand or use" was one of the reasons for failure of
home banking in the USA (Dover, 1988). Scarbrough and Corbett (1992) reported
"understandings of consumers" to be an important element in the diffusion of
innovative technology. The Wallis Report (1997) identified that technological
innovation "must be easy to use" to ensure customer take-up or acceptance. Customer
skill is related to customer selection, and to the flexibility of the service offered.
Akamavi (2005) highlighted that it is important for the service designer to understand
customers’ needs, in order to design a website that the customer will find easy to use.
Daniel (1999) identified ease of use as one of the factors for customer acceptance in
her study of e-banking in the UK and Ireland. It is a critical factor in the development
and delivery of IB services (Taylor & Todd, 1995; Sathye, 1999; Yiu et al., 2007; Al-
Page 90
74
Hajri & Tatnall, 2008). Perceived ease of use is a person's subjective perception of the
effortlessness of a computer system, which affects the perceived usefulness, and thus
has an indirect effect on a user's technology acceptance (Rigopoulos & Askounis,
2007). Also, the longer an individual has been using IB, the more likely they are to
find it easy to use (Prompattanapakdee, 2009). Similarly, the easier it is for a user to
interact with a system, the more likely it is that he or she will find it useful. There is
substantial empirical support for this view (Chau, 2001; Amin, 2007; Rigopoulos &
Askounis, 2007; Lee, 2009). It affects the consumers' intentions to use IB (Eriksson et
al., 2005; Alsajjan and Dennis, 2010; Al-maghrabi and Dennis, 2010; Al-Majali &
Nik Mat, 2011). This research adopted Davis (1989) parecived ease of use defenetion
as “the degree to which a person believes that using a particular system would be
free of effort”. Perceived ease of use of the IB services constructs operationalisations
have been adopted from Pikkarainen et al. (2004) and was measured by five-point
scale rating 5 items from "strongly disagree" to "strongly agree". In this study,
respondents were asked to rate their IB perceived ease of use in six items (A16 to
A21) (see Appendix B). In short, perceived ease of use is expected to have positive
relationship with IB adoption, use, and success. Hence:
H8: Perceived ease of use has a positive relationship with the a) adoption, b) use,
and c) success of IB services.
2.4.2.9 Perceived usefulness
Perceived usefulness was defined by Davis et al. (1989) as “the degree to which a
person believes that using a particular system would enhance [his/her…]
performance”. Several studies have reported that perceived usefulness is an important
factor for adopting and using technology (Davis et al., 1989; Venkatesh, 1999, 2000;
Venkatesh and Davis, 2000). In the context of IB, it is presumed that the level of
Page 91
75
usefulness that IB offers over and above traditional banking methods could affect
customer attitudes towards adoption and use. For example, IB could be perceived as
useful by customers that find it difficult to visit the bank’s branches.
The users’ performance is expected to be when he or she realise the usefulness of a
technology. According to Amin (2009), Perceived Usefulness is the extent to which a
person believes that using a particular system will enhance his or her performance.
Mathwick et al. (2001) defined perceived usefulness as the extent to which a person
deems a particular system will boost his or her job performance. The importance of
perceived usefulness has been widely recognized in the field of e-banking (Liao &
Cheung, 2002; Jaruwachirathanakul & Fink, 2005; Guriting & Ndubisi, 2006;
Agarwal et al., 2009; Al-Majali & Nik Mat, 2011). It is the primary prerequisite for
mass market technology acceptance, which depends on consumers’ expectations
about how technology can improve and simplify their lives (Al-maghrabi & Dennis,
2010). This research adopted Davis (1989) parecived usefulness defenetion as “the
degree to which a person believes that using a particular system would enhance his
job performance”. Perceived usefulness of the IB services constructs
operationalisations have been adopted from Pikkarainen et al. (2004) and was
measured by five-point scale rating 5 items from "strongly disagree" to "strongly
agree". In this study, respondents were asked to rate their IB perceived usefulness in
six items (A10 to A15) (see Appendix B). In short, perceived usefulness is expected
to have positive relationship with IB adoption, use, and success. Hence:
H9: Perceived usefulness has a positive relationship with the a) adoption, b) use,
and c) success of IB services.
Page 92
76
2.4.2.10 Availability of online IsB
In Kuwait, Al-Sultan (1999) studied the attitudes of several hundred customers
towards the products and services offered by Islamic channels, and like Metwally
(1996), he confirmed that adherence to Islam was the main motivating factor for
Kuwaitis dealing with Islamic banks and channels. Moreover, when Bley and Kuehn
(2004) surveyed business students’ knowledge of the financial aspects of Islamic and
conventional banks in the UAE, the sample of the research included a relatively high
proportion of students who were knowledgeable about general financial practice, and
comprised students with both an Arabic and non-Arabic Muslim background. The
major finding was that Muslim students preferred Islamic bank services because of
religious motivations. The majority of Islamic bank customers responded that religion
was the main motivation in the use of Islamic products and services.
Omer (1992) concluded that religion was the primary factor in the choice of an IsB
institution. In Bahrain, Metawa and Almossawi (1998) concluded that the most
important factor in determining the attitudes of Islamic bank customers was religion.
As mentioned earlier, the tenet of Islam, in SA, was probably responsible for the
delay (until January 1999) in allowing public access of the internet through the PC
(Al-Khaldi and Wallace, 1999). This research adopted Gait and Worthington (2007)
defention of IsB as financial products and services designed to comply with the
central tenets of Shari’ah (Islamic law). Availability of IsB is measured by a Likert
scale rating 5 items from "major obstacle" to "No obstacle". Q. A2B5 in the
questionnaire (see Appendix B) represents the variable. In short, the availability of
IsB is expected to have positive relationship with IB adoption, use, and success.
H10: The availability of IsB has a positive relationship with the IB services a)
adoption, b) use, and c) success.
Page 93
77
2.4.2.11 Demographic factors (Age, Education and Income)
Different demographic factors affect the adoption of IB to different degrees. Those
factors have been found to be associated with the adoption of different banking
channels, especially IB (e.g. Sathye, 1999; Al-Ashban and Burney, 2001; Karjaluoto
et al., 2002).
Akinci et al.’s (2004) findings in Turkey showed that middle-aged consumers are
more likely than younger or older consumers to use IB whereas in Italy, younger
consumers are more likely than older consumers to use ATMs (Filotto et al., 1997). In
SA, the adoption of tele-banking is negatively associated with age (Al-Ashban and
Burney, 2001). In addition to that several studies found that customers who are
younger more likely to use IB (e.g. Sathye, 1999; Karjaluoto et al., 2002; Mattila et
al., 2003). Similarly, those who belong to the upper middle class and have high-level
occupations and income are more likely to use IB (Jayawardhena and Foley, 2000;
Karjaluoto et al., 2002).
According to Polatoglu and Ekin (2001) and Howcroft et al. (2002) one of the
demographic factors that describe typical e-banking customers is high education.
Moreover, different authors found that customers who are educated more likely to use
IB (e.g. Sathye, 1999; Karjaluoto et al., 2002; Mattila et al., 2003). Additionally,
Akinci et al. (2004) found that the IB users in Turkey were well educated, more
technology-oriented and convenience-minded costumers.
Income is another major demographic factor which relates to the usage of IB. In SA,
the adoption of IB has been found positively associated with income level (Al-Ashban
and Burney, 2001). Similarly, different authors found that wealthier customers are
expected to use IB (e.g. Sathye, 1999; Mattila et al., 2003). In addition to that,
Page 94
78
Karjaluoto et al. (2002) found that and have high-level occupations and income are
more likely to use IB. In UK, IB users are typically being in the upper income bracket
of an already affluent and/or educated group (Howcroft et al., 2002). Demographic
constructs operationalisations have been adopted from Almogbil (2005). Therefore,
the following hypotheses are proposed:
H11: Old age has a negative relationship with the a) adoption, b) use and c) success
of IB.
H12: High education level of the IB users has a positive relationship with the a)
adoption, b) use and c) success of IB.
H13: High income level of the users has a positive relationship with the a) adoption,
b) use and c) success of IB.
2.4.2.12 Adoption, Use and Success facets
IB Adoption
Adoption, as defined by Kotler and Keller (2009), refers to “an individual’s decision
to become a regular user of a product/service”. Adoption of IB services is measured
by the intention to use IB services or even usage for short period of time so as to
undergo the experience, which is considered as a predictor for adoption (Al-Ashban
and Burney, 2001; Al-Gahtani et al., 2007).
Adoption (intention to use) only has an effect on actual use. This suggests that an
individual who is motivated to continue to use IB will conduct a significant number of
their transactions using these services. To increase an individual’s intention to use IB,
the services must be made easy to use and trustworthy. As the individual begins to use
the services, they will be motivated to continue their use, but if the individual
continues to place a high value on personal relationships, then this will have a
negative effect on their intention to use the services (Prompattanapakdee, 2009).
Thus, the duration of experience with the technology has been found to capture the
Page 95
79
customer’s intention to use the technology (Al-Gahtani et al., 2007; Safeena et al.,
2011).
The new adopters of the IB service are expected light users and very critical users
where they will stay and become the medium and heavy user or they might leave
adopting IB due to negative reasons. As a result, this research proposes the
implementation of IB quality as integral constituents to maintain and increase the IB
users’ retention to become regular users (Raman et al., 2008). The adoption of IB can
be increased by the attractive incentives and encouragement. Human beings are likely
to be motivated and influenced by incentives. Based on the survey, adoption of IB is
showing a great deal in the bank’s development with 72% of the respondents having
adopted IB (Raman et al., 2008).
As defined by Kotler and Keller (2009), in this research adoption refers to “an
individual’s decision to become a regular user of a product/service”. Adoption of IB
services is measured by the period of using IB services (Al-Ashban and Burney,
2001). Thus, adoption of IB services is measured in this research by the duration (one
year or less) of usage of IB services, as captured in (Q: B13): “How long have you
been using IB?”.
IB Use
Use refers to the user acceptance of an IS often operationalised as frequency of use
(Davis et al., 1989; Davis, 1993). In the technology context of use, the frequency of
use has been found to capture the customer’s use of technology (Safeena et al., 2011).
Therefore, the greater usage of IB (frequency of using the IB) (e.g. Sathye, 1999; Al-
Ashban and Burney, 2001; Al-Gahtani et al., 2007) is considered as a proxy for IB
usage. Frequency of system usage is one of the most frequently proposed methods for
Page 96
80
measuring the usage in IS studies (Zmud, 1979; DeLone and McLean, 1992). On the
other hand, if the objective is to increase the proportion of an individual’s banking
transactions that are conducted via IB, then the most important action is to get them
started in using IB, since the longer an individual uses the services, the larger will be
the proportion of their transactions that they conduct using IB (Prompattanapakdee,
2009).
Both subjective (self-reported) and objective (actual usage or frequency recorded by
the computerized system) measures are common forms of system usage measures
found in the literature (Straub et al., 1995; Chin, 1996; Szajna, 1996; Yousafzai et al.,
2007a). Moreover, to be an effective surrogate, self-reported usage must be a valid
measure of use and must correlate strongly with other methods of measuring usage,
that is, it must exhibit convergent validity (Nunnally, 1978). Davis (1989) and Al-
Gahtani et al. (2007) considered that the behavioural intention (Adoption) leads to the
actual use of IS. As a result, longer adoption will lead to increase the usage of IB.
Agarwal and Prasad (1997) studied both initial system usage and the intentions of
future use and found that different factors affected initial use versus future use of the
WWW. Similarly, Karahanna et al. (1999) found that factors associated with
“intention to use” windows differed between potential adopters and continuing users.
These two empirical studies demonstrate that early use and continued use can differ.
While, too frequent system usage is clearly a key variable in understanding IS success
(DeLone & McLean, 2003). The IB users are expected to be medium users and earlier
adopters of IB services than the light users who already rely and realize the
importance of IB. They are different with light users where incentive should be given
Page 97
81
appropriately to them. The only difference is in the “incentive” variable preference.
The medium and heavy users might not need as much incentive as the light user.
This research adopted Davis (1993) definetion of use which refers to the user
acceptance of an IS. Use often operationalised as frequency of use (Davis et al., 1989;
Davis, 1993). The greater usage of IB (frequency of using the IB) (e.g. Sathye, 1999;
Al-Ashban and Burney, 2001) is considered as a predictor for IB usage. Frequency of
system usage is one of the most frequently proposed methods (DeLone and McLean,
1992). Thus use of IB is also measured in this study as frequency of using IB services
(6-30 times), as captured by (Q: B14): “How frequently do you access IB information
each month?”
IB Success
A number of factors have been suggested by different researchers as being necessary
for the success of new products or services (Solomon, 1996; Lockett and Littler,
1997; Hawkins et al., 1998; DeLone & McLean, 2003). IB Success refers to the extent
to which satisfactory results are obtained (Rockart, 1979). Success also refers to a
number of factors which, if they are satisfactory, will ensure a successful competitive
performance for the organisation (Rockart, 1979). The success of IB is initially
determined by customers' acceptance of the service. If the IB service can clearly show
the benefits and how it addresses customers’ needs, then customers are more likely to
use IB. Previous research into IB has focused mainly on innovation adoption in the
context of North America and Europe (Pikkarainen et al., 2004) and to some degree,
other areas, such as Turkey (Polatoglu and Ekin, 2001).
The “use” factor of IS is widely used as a measure of success in empirical MIS
research (Zmud, 1979). The Wallis report (1997) stated that “as the internet becomes
Page 98
82
more widely accessible … households will conduct the financial transactions over the
Internet”. There are a number of factors that, if results are satisfactory, will ensure a
successful competitive performance for the organisation (Rockart, 1979). In addition,
Beckett (2000) suggested that to succeed in creating and sustaining a competitive
advantage, financial services firms have to understand how consumers vary their
behaviour when interacting with them. In other words, customer satisfaction and
customer retention are increasingly developing into key success factors in e-banking
(Bauer et al., 2005). User satisfaction is one of the most widely used measures of IS
success for three reasons. First, using satisfaction as a success measure makes
common sense. Second, there are reliable tools for measuring satisfaction. Third,
other IS success measures are either conceptually weak or hard to acquire (Delone
and McLean, 1992).
DeLone and McLean (2003) introduced the “net benefits” construct as the most
accurate descriptor of IS success. “Net benefits” are the most important success
measures, as they capture the balance of positive and negative relationships of e-
commerce with customers. For successfully implementation, IB must provide positive
net-benefits for users (e.g. how easy or useful it is to use or how compatible it is with
the customer’s lifestyle and their previous experiences or does it safe their time and
money). In addition, while net benefits are necessary, on their own they are not
sufficient to provide a good understanding of IB behaviour (Lassar et al., 2005).
Customers’ individual differences (demographic characteristics) should also be taken
into account along with different social and contextual influences in identifying final
adoption and usage behaviours. In addition, DeLone and McLean (2003) stated that
system use is clearly a key variable in understanding IS success, but, too frequently,
simple usage variables are used to measure this complex construct. In recent empirical
Page 99
83
studies, information quality has proven to be strongly associated with system use and
net benefits (Weill et al., 1999; Wixom et al., 2001; Rai et al., 2002) and especially in
the context of e-commerce systems (Liu et al., 2000; D’Ambra et al., 2001; Molla and
Licker, 2001; Teo and Choo, 2001; Palmer, 2002). Successful IB users are enjoying
the benefits of their usage and considered heavy users as they are using wide range of
IB services. The performance of most marketing programmes is determined by its
effectiveness and efficiency. Some studies found that heavy users are more deal
prone; differently other studies found that they are innovators or very early adopters
(Morgan 1979; Hackleman and Duker 1980).
Liao & Cheung (2002) stress that the success in IB will be achieved with customized
financial products and services that satisfy customer' needs, preferences and quality
expectations. Mattila (2001) conceded that customer satisfaction is a key to success in
IB and banks will use different media to customize products and services to fit
customers' specific needs in the future. Lindgaard & Dudek (2003) emphasize that
now is an ideal time for human computer interaction researchers to analyse user
satisfaction, because there is growing interest in how to attract and increase the
number of online customers in e-business and e-commerce. Therefore, using wide
range of IB services, in addition to the users satisfactions from the provided IB
services can be considered as predictors for success. A system that satisfies user's
needs reinforces satisfaction with the system and is a perceptual or subjective measure
of system success. Using the system is connected with the effectiveness of the system
– systems that users regard as useless cannot be effective.
Success is defined in this research as the extent to which satisfactory results are
obtained (Rockart, 1979). Different researchers reported that IB saves time and
Page 100
84
money and has a positive relation with customer satisfaction towards the usage and
success of IB (Mattila, 2001; Karjaluoto et al., 2002; DeLone and McLean, 2003).
User satisfaction is one of the most widely used measures of IS success (Delone and
McLean, 1992). Molla and Licker (2001) suggested to extend Delone and McLean’s
(1992) model on web and e-commerce systems researches which have similarities to
traditional IS systems, and therefore Delone and McLean’s model can be applied to e-
commerce systems. Therefore, the users’ satisfactions of the provided IB services and
the use of wide range of IB services have been used as predictors for success in this
research. The success of IB is measured in this study by user satisfaction and number
of used services. User satisfaction is measured by three items, as captured by Qs A2,
A8, A9; time saving is also measured by other three items, as captured by Qs A1, A3,
A6; inaddition to the number of used IB services which measured by 1 item, as
captured by Q B16 (more than 5 services), as the users were also asked to indicate the
type of activities that they undertake via IB services and they have been given the
option to select more than one choice. Hence, the following hypotheses are proposed:
H14: Adoption of IB services has a positive relationship with the use of IB services.
H15: Use of IB services has a positive relationship with IB success.
2.5 Chapter summary
This chapter reviewed the main behaviour and technology models, such as TRA and
TAM, and found that TRA has investigated the attitudes and social influences that
impact the customers’ adoption behaviour, while TAM investigated the different
factors that might impact the customers’ attitudes towards their intention to use the
technology which will lead to actual use. With regards to that, no study from the
reviewed literature has been found investigating the success of the IB; wherease few
studies were found investigated the success of IS. As a result and responding to
Page 101
85
several researchers calls (DeLone and McLean, 1992; Molla and Licker, 2001); this
study has extended TAM model by introducing new additional facet (success),
utilizing the IS success model, and investigating the different factors that might have a
relationship with each facet (adoption and actual use, and success).
DeLone and McLean (1992) introduced the IS success model and mainly measure the
success by customers’ wide usage and satisfaction when they are enjoying the benefit
of their usage of the IS. Molla and Licker (2001) proposed an extension to Delone and
McLean’s (1992) model by studying e-commerce system success by defining an
independent variable labelled Customer E-commerce Satisfaction. They argue that
web and e-commerce systems have similarities to traditional IS systems, and therefore
Delone and McLean’s model can be applied to e-commerce systems.
This chapter also reviewed the literature on IB utilization and found that three main
facets (adoption, use and success) are linked positively, as longer adoption of IB
relates to the usage of IB positively, while frequent usage of IB also relates with the
success of IB positively. These three main facets are affected, in a different extent, by
a set of independent variables: satisfaction, high security, self-efficiency, awareness,
income, education the availability of IsB services and the availability of the
infrastructure were identified as having a positive effect on the adoption, use and
success of IB. However, other independent variables, such as high cost, resistance to
change, and old age, were identified as negatively affecting the adoption, use and
success of IB.
This chapter also presented a historical review of the IB studies which have been
conducted in the developed countries such as Europe, USA, and Australia, in addition
to those in developing countries, and the findings indicated that little IB empirical
Page 102
86
research has been conducted in the Middle East and SA in particular. Thus, this
chapter provided data for a comparison with the results reported in other countries,
and revealed that security factors do not affect IB customers’ attitudes in developing
countries to the same degree as they do in developed countries; that is due to the
period of IB adoption and awareness of the criticality of such a service. Therefore,
after critical review of the international empirical literature relating the customer's
attitudes towards the IB acceptance, it has been found that no significant diferencies
on the type of factors which relates to one region diferent than the other. The
differenceies mainly depends on how mature is the customers usage of the IB services
in a specific region, forexample during the early usage of IB; specific factors, such as
awareness and resistance to change, were found mainly linked to the adoption of the
IB. Wherease other factors were found related to the adotion and use of the IB, such
as satisfaction, high security, self-efficiency, income, education and the availability of
the infrastructure, the availability of the IsB services and cost of the IB services. This
chapter also reviewed and extended previous technology and marketing research by
examining a wide range of variables which have not been found investigated in one
study and especially in SA. Thus, awareness, resistance to change, self-efficiency,
availability of infrastructure, security, cost, satisfaction, ease of use, usefulness, IsB,
age, education and income were taken into account in this study as independent
variables. Based on that, the research conceptual model was proposed and the
research’s’ hypothesis were developed.
This chapter found that few studies have investigated the relationship of the
availability of IsB products and services in the traditional banking services and no
study was found in the reviewed literature had studied the relationship of such factor
with the adoption, use and success of IB, especially in a Muslim country such as SA.
Page 103
87
Therefore and in response to some researchers’ calls (Khaldi and Wallace, 1999;
Wungwanitchakornm’s, 2002; Alsajjan and Dennis, 2010), this research has
inestigated the relationship of the social and cultural values with the new technologies
such as IB. This study is considered to be one of the first studies in the field of IB
which investigates the relationship of the availability of IsB services and IB.
This study extends the previous IB research by examining the extent of several factors
(independent variables) relations might have with customer adoption, use, and success
(Dependent Variables) of IB services separately. Thus, the three dependent variables
considered in the theoretical model of this study are 1) adoption, 2) use, and 3)
success, as one of the first studies in the field of IB among the reviewed literature
which investigate those dependent variables in theoretical models. This chapter
concluds with the research theortical model, hypothesises with the operational
definitions and the measurement of the research variables, which have been adopted
from prior studies to ensure reliability and content validity. In the next chapter, the
banking industry challenges and the IB services introduction issues are explained.
Page 104
88
Chapter Three
Banking Industry and IB Issues
3.1 Introduction
This chapter delineates the context of this research and describes the banking sector
challenges and the general IB factors that impact their utilization. An overview of the
changing nature of the international banking industry is also introduced to enhance the
reader’s knowledge about the different issues that might affect the banking sector and
the different banking channels, such as IB. As introduced in chapter one, this chapter
also study the different the social values of SA residence people and evaluate the
Information and Communication Technology (ICT) status of SA and capture the most
relevant factors that have a relation with their IB utilization and compare them with
the statistical result of this research.
Furthermore, a review of IB and how it is interpreted in SA, the different types of
offerings, the status of current IB usage, and the various concerns and issues
regarding IB are summarised to provide a solid background of the IB field in SA. This
chapter concludes with an overall summary of the major key points of the background
of the IB industry. In the following section, a description of the various environmental
forces affecting the banking sector is presented, highlighting both the external and
internal forces.
Page 105
89
3.2 The Changing Nature of the Banking Sector
The traditional, rather rigid structure of the industry combined with the operation of a
few large ‘cartels’1, meant that customers around the world had to accept both the
form and price of financial instruments and delivery channels. However, today’s
banking sector is subject to both internal and external pressures (Rajan, 1998). The
structure of the global banking sector has undergone considerable change over the
past years; for example, in the 1990s, globalisation and its effects on the global
banking sector meant that, like many other global industries, it entered a state of flux,
with many of its participants. They are unsure as to how the global competitive
environment would look in the future.
Within the traditional structure and operation of the banking industry, customers had
little choice in terms of selecting financial instruments and delivery channels.
Moreover, after SA’s accession to the WTO in 2005, the Saudi banking sector faced
challenges from some new international rivals to the Saudi market. Because of that,
internal pressures to the industry include competition and changing consumer
behaviours, become high and very dynamic. Due to that, the competition were
expected to be high between foreign and domestic banks internally, which then forced
the local banks in SA to refine and improve their services and products, in pricing,
flexibility, delivery, and after-sales services, which in return will affect customer
behaviour. With regards to that, Jayawardhena and Foley (2000) explained the
banking services sector and its interactions with the market forces in Figure 3.1.
1 Defined as an agreement among two or more firms in the same industry to co-operate in fixing prices
and/or carving up the market and restricting the amount of output they produce. It is particularly common
when there is an oligopoly. The aim of such collusion is to increase profit by reducing competition (The
Economist, 2010).
Page 106
90
Figure 3.1: The banking services sector and interaction with forces. f 19
Source: Jayawardhena and Foley (2000).
In the wider business environment, these changes are likely to have the greatest
impact on the banking sector. Such developments are beyond the control of the
businesses themselves. However, success or failure may depend on how well
management is able to anticipate and react to these changes.
3.2.1 External Forces
There has been a marked trend towards deregulation in recent years in many Western
countries, resulting from political and ideological change (Jayawardhena and Foley,
2000). Successive regimes have continued to deregulate industries as a response to
past recessions and to support structural change by improving the efficiency and
competitiveness of both public and private sectors. Developed economies, such as the
United Kingdom (UK), have been at the forefront of such developments
(Jayawardhena and Foley, 2000). Deregulation in the banking industry has created
new competition between banks as well as allowing new entrants to the sector. In SA,
managing the branches of the foreign banks operating in SA post WTO accession has
added to the faced by the SA banks in the medium and long term. As a result, the
relationship between regulators and foreign banks has come under more scrutiny
because of the globalization of the banking services.
Page 107
91
The 2008 financial crises, governments followed different methodologies. In UK, the
government moved quickly to announce the first victim (Northern Rock) in February
of 2008, and other smaller institutions, including Bradford & Bingley, and major
recapitalizations through state ownership of the country's major banks, such as Lloyds
and Royal Bank of Scotland. By contrast, U.S. policymakers involved in a haphazard
series of actions, in part driven by the pressures from the banks themselves and by the
difficulty of selling to the Congress and the public massive government intervention
in the financial sector. In SA, the Saudi Arabian Monetary Agency (SAMA)1 policy
changed and the reserve ratio on current accounts was reduced to 10 and then to 7
percent in the face of the global financial crises in order to stimulate additional
domestic liquidity. Unlike other central banks around the world who have been
reducing or eliminating their reserve requirements (Freedman et al., 2009), SAMA set
to continue using it as a powerful signaling tool and an effective monetary policy
given that some Saudi Riyal (SR)2 328 billion were held in current accounts by the
Saudi banks in February 2008 (SAMA, 2008), which has reflected positively on the
market and public confidence, during the financial crises of 2008. SAMA did not take
this route to support its banking system, feeling that their capitalization level was
more than adequate to support Saudi banks compared with their western counterpart.
1 Saudi Arabian Monetary Agency (SAMA), the central bank of the Kingdom of SA, was established in
1952. The functions of the SAMA include issuing the national currency, the Saudi Riyal; acting as a
banker to the government; supervising commercial banks; managing foreign exchange reserves;
promoting price and exchange rate stability and ensuring the growth and soundness of the financial
system; and operating a number of cross-bank electronic financial systems such as (SPAN, Tadawul,
SARIE, SADAD and MAQASA) (SAMA, 2008).
2 The Saudi Riyal (SR) is fixed against the US Dollar; 1 US dollar = 3.75 Riyals, which translates to
approximately 1 Saudi Riyal = 0.266667 US Dollar. This rate was made official on January 1, 2003
(X-rates.com, 2008).
Page 108
92
Jayawardhena and Foley (2000) further argued that, with the possible exception of
regulatory reform, changes in the technological environment are likely to have the
greatest impact on the banking sector over the next decade. Developments in
technology have dominated the revolution in the banking sector during the past
decade (Gandy, 1998a). The worldwide expansion in technologies for connection has
supported the increasing globalisation of capital flows and financial organisations.
Technology has also facilitated the proliferation of new products and services
supporting new customer demand (Lichtenstein and Williamson, 2006). Lichtenstein
and Williamson (2006) also claimed that banks are able to harness the new
technologies to sustain profitability as well as to improve customer services.
Moreover, they claimed that technology, in particular the internet, will be a key driver
of such changes (Lichtenstein and Williamson, 2006). New technology will 'open the
door' of the banking industry to new entrants. Technology is frequently touted as
having been one of the key elements in the formulae for productivity and profitability
in the 1990s and beyond, and it is likely to be seen as the key facilitator for change
within the banking sector for the foreseeable future. Regarding this issue, Al-Ashban
and Burney (2001) claimed that the combination of technological advancements and
the expansion of the SA economy in the past two decades transformed the banking
system from playing a role mainly of financing trade to one of mobilizing and
channelling financial resources more effectively.
3.2.2 Internal Forces
Deregulation and technological advances have brought about changes within the
banking sector. The banking industry is now faced with two main challenges. Firstly,
banks are facing intense competition from other (domestic and foreign) banks, larger
building societies and insurers offering a whole spectrum of financial services.
Page 109
93
Competitors not directly within banking, such as insurance companies, which see
opportunities in banking, are beginning to enter the banking sector competitively
(Essinger, 1999). Non-financials, such as Yahoo!, Microsoft and Disney, companies
unrelated to the banking industry but which possess unparalleled technical and
operational skills and resources enabling them to compete, are also entering the
market. In addition to that, SA has established credit institutions aimed at
providing concessionary loans to some economic sectors in the country. The soft
terms of these institutions’ lending program pose a challenge to the banking
industry.
The 2008 financial crises has also shown how is the stability of Islamic financing in
overcoming problems such as derivative financing, synthetic products and subprime
loans. This has not gone unnoticed by SAMA and it is probable that the monetary
agencies have been guided to be more receptive to allowing Saudi banks to operate
under Islamic financing modes or convert their operations to Islamic financing. This
was the case with SA’s largest bank, the National Commercial Bank’s decision to
convert all its retail branches to Islamic finance branches (SAMA, 2009).
Automobile financial company is another challenge to the banking industry as they
started playing a role in changing and promoting some new regulations to the
financial industry market. Based on the policy related to automobile finance and
market environment in SA and the experience of the developed countries in
developing automobile financial business, the automobile financial companies has
competed and cooperated with financial banks and became one of the main forces that
impacted the SA financial industry (SAMA, 2009). In USA, the competition from
automobile finance companies became high, such as General Motors Acceptance
Page 110
94
Corporation and Ford Motor Credit. These companies generally finance their lending
by selling short-term commercial paper so that the rate they charge on auto loans
varies with market interest rates. To compete with these lenders, banks have been
forced to adjust rates on new auto loans in line with finance co. and market rates.
Secondly, banks are facing more demanding customers. Over the years, banks have
noticed a change in customer behaviour. It has been argued that customers are
increasingly sophisticated, more demanding, more financially educated and more cost
and price conscious than hitherto. The rise of customer awareness and expectations
regarding financial services has effectively forced providers into offering a wider
range of products with lower margins and higher standards of service (Lichtenstein
and Williamson, 2006). Owing to increased competition, banks, both in SA and
globally, have increased in homogeneity and have come more to compete in an
increasing number of areas, with more banks competing directly in more markets than
has traditionally been the case (Al-Ashban and Burney, 2001). Historically, customers
were rather passive, which allowed banks to dictate the services offered, and when
and where they were available. Today, the customer is more informed, more selective,
and much more willing to change providers to obtain the right service delivered in
their preferred way. Harris and Watkins (1998), for example, argued that the
traditional concept of loyalty based on the old conviction that, if you get a customer
young you keep them for life, has been transformed, because keeping customers has
become a more difficult task due to the stronger competition.
In this section, a more in-depth explanation of one of the main factors that affect the
customers’ attitudes toward the financial services is considered. Customer awareness
of financial services has been raised by the media attention. The media report on
Page 111
95
issues such as poor performance, lack of security, and quality (Lichtenstein and
Williamson, 2006). Legislation has also increased customers’ rights while technology
and competition have increased their choice of services and providers. Jayawardhena
and Foley (2000) claimed that the internet is an important contributor to the changes
in customer behaviour. They also believed that customers would become more
discerning as information became more accessible over the internet. They went on to
say that customers will have access to online 'intelligent agents’ that will give them
the ability to compare products and services for the best terms and conditions.
However, there is a possibility that this could also lead to customers being overloaded
with information. In a situation like this, there is a risk that customers will become
more confused, causing them to lose sight of their original ideas (Roszak, 1994).
3.3 SA Economic Background
The Saudi economy is a free market economy. The country has open liberal policies,
no constraints on capital movements and no exchange restrictions. It has a very liberal
tax system, which means that individuals and companies pay few taxes and those few
taxes are at very low rates. Although the 2008 financial crisis affected the world
economy, the SA economy has been growing rapidly in recent years due the increases
in the oil prices in the world, which has impacted the income by doubling the nominal
terms between 2002 and 2011 with a Gross Domestic Product (GDP) of USD 676.2
billion. Firms in the building and construction industry, including cement producers,
have been among the main beneficiaries, as the government has moved to ease a
housing shortage. The petrochemicals sector, which has access to low-priced inputs,
could see its exports crimped in 2012, however, if the global economy slows (Platt,
2012). Table 3.1 shows a summary of the GDP, inflation and unemployment rates
from 2000 to 2011:
Page 112
96
2000 2001 2002 2003 2004 2005 2006 2007 2008 2009 2010 2011
GDP(%) 4.87 0.55 0.13 7.66 5.27 5.55 3.16 2.02 4.23 0.6 3.74 7.54
Inflation(%) -1.1 -1.14 0.23 0.59 0.36 0.63 2.31 4.11 9.87 5.06 5.35 6.02
Unemployment(%) 8.15 8.34 9.66 10.35 11 11.52 12 11 9.8 10.46 10.48
-2
0
2
4
6
8
10
12
14
Percen
tag
e
GDP growth, inflation and unemployment rates for Saudi Arabia (2000-2011)
Table 3.1: GDP growth, inflation and unemployment rates for SA (2000-2011). t 5
Source: (economywatch.com, 2012).
Table (3.1) shows that SA’s GDP growth in year 2010 was 3.744%; as a result, SA
was no. 97 in the world rankings according to GDP growth. However, in 2011, GDP
growth was 7.54%, which is 101.42% more than the 2010 figure. With regards to the
inflation (Average Consumer Price Change %) for SA in 2010 was 5.354 %, with SA
at no. 61 in the world rankings. In 2011, the inflation rate for SA was at 6.02 %, that
is, 12.36% more than the 2010 figure. On the other hand, the unemployment rate (%
of labour force) for SA in 2010 was 10.48 %, with SA at no. 29 in the world rankings.
In 2009, the unemployment rate was 10.46 %, which was 0.11% less than in 2010.
This concludes that the GDP is in increase, inflation and unemployment are steady in
the last three years in SA.
SA’s government announced a record budget for 2012, with top priority being given
to education and manpower. Total spending for 2012 was budgeted at $184 billion, an
increase of 19% over the budgeted total for 2011 (Platt, 2012). However, the budgeted
spending for 2012 is estimated to be lower than the actual spending in 2011, which
was inflated by an off-budget two-month salary bonus for public workers and
additional spending on social programs in the wake of the Arab Spring uprisings in
the region. The government also raised the minimum public-sector wage and hired an
extra 60,000 staff for the Ministry of the Interior last year (Platt, 2012).
Page 113
97
Figure 3.2 illustrates the oil prices records and abundant liquidity characterized the
period, with oil prices reaching USD 125 per barrel (pb) in mid-2008, but falling back
to an average of USD 55-60 pb in 2009 and an average of USD 68-75 pb in 2010
(SAMA, 2010). On the other hand, there are serious difficulties in the employment
market, as 38% of the population is under the age of 15. The country’s unemployment
rate is 13%, without any proper taxation system, and inflation was above 10% in 2008
(SAMA, 2009). Reference to Figure 3.2 shows that by the 1990s, the spot and futures
oil market accounted for over 60% of oil sales, compared with less than 5% in the
1960s (Oweiss, 1990; Parra, 2004). These new market players were reactive to day-
to-day variations in demand and supply, supported or exaggerated by real events or
rumours in the market.
Figure 3.2: Monthly Crude Oil Prices with the adjusted inflation (1946-2010).f 20
Source: (Platts.com, 2010).
The oil and energy sector is still a significant contributor to the Saudi GDP. The oil
sector contributes on average around 40% of the Saudi GDP, but this rose sharply to
around 55% in 2008 due to exceptionally strong oil prices, as illustrated in Figure 3.2.
What has been noticeable, though, is the increased capacity for refined oil products,
which more than tripled from 222 million barrels in 1972 to over 720 million barrels
in 2008 (SAMA, 2009).
Figure 3.3 maps out a global prosperity index using Purchasing Power Parity (PPP),
adjusted GDP per capita, and growth of real GDP per capita for the period 1998-2007.
Page 114
98
It indicates that SA, although doing better than most Arab and other developing
countries in terms of GDP PPP per capita growth, did not outperform other countries
in the Gulf Cooperation Council (GCC) block. Qatar was the highest at USD 73,000,
ahead of the USA and on a par with Norway, SA average was around USD 22,000.
Figure 3.3: Global prosperity performance growth of real GDP per capita adjusted in PPP terms,
CAGR (1998-2007).f 21
Source: Porter (2009).
3.4 Financial Services History in SA
The SA financial system consists of various types of banks, the government-
controlled SAMA, private commercial banks, specialized credit institutions, and the
stock market, as illustrated in Figure 3.4 (US-Saudi Arabian Business Council, 2002).
3.4.1 SA Monetary Agency (SAMA) “The Central Bank”
The need for a banking system became apparent when pilgrims visiting the holy
places in SA needed to exchange money. The first foreign bank was established in
1926. Prior to 1952, SA had no official monetary system; the people used metallic (or
silver) coins or foreign currencies as an exchange medium in circulation for trading
purposes. Originally, there was resistance from religious people against the
Page 115
99
establishment of a banking system because banking interest is against the Shari'ah1
(Islamic) laws. The 1950s brought an increased need to form foreign and domestic
banks, especially with the revolution in the oil industry which continued to grow
dramatically on an annual basis (Money and Banking, 1992). Saudi banks
circumvented the insurance services outlawed in the Shari'ah by using Takaful2,
which is an acceptable Islamic form of insurance. In 1952, SAMA was established to
stand at the apex of the financial system, as shown in Figure 3.4. It was intended to
serve as a regulatory agency and act as the government's bank. In the 1960s, SAMA
created banking regulations to develop the banking industry further.
Figure 3.4: The SAMA system .f 22
Source: (U.S.-Saudi Arabian Business Council, 2002).
1 Shari’ah literally means ‘way to water’ – the source of all life – and signifies the way to God, as
given by God. It is the Way which encompasses the totality of man’s life (Ghayyur, 2003).
2 Takaful (Insurance Expenses): is simply an Islamic alternative to the conventional insurance system.
The Takaful concept aims to provide services to policyholders by protecting the participants against
an inability to overcome future unwanted events and difficult times through the creation of a defined
pool contributed to out of their common resources (Ben Arab and Elmelki, 2008).
Page 116
100
The Saudi currency, the Riyal, was initially circulated in 1972. Starting in 1980,
SAMA began working as a consultant to the government in managing its public debt,
restructuring the financial market, and regulating and monitoring commercial banks.
SAMA continues to implement the monetary policy of SA. SAMA and commercial
banks have played a significant role in upgrading and developing the Saudi banking
technology, such as electronic clearing, ATMs, stock trading, and the Electronic
Funds Transfer System (Money and Banking, 1992; SAMA, 2002; US-Saudi Arabian
Business Council, 2002). Although SAMA adopted IsB in the financial sector, it
recognised the importance of bringing foreign investment into the country to the
economic development process of SA.
Therefore, SAMA has always supported and encouraged the acceptance of the new
universal banking models for banks in SA. Consequently, the SA domestic banks
have become the primary financial institutions for the provision of all banking and
financial services. The result of this policy was to ensure systemic stability in those
banks. It was also to promote healthy competition, as banks were able to devote
sufficient funds and suitable human resources to providing a broad range of financial
services, including fund management, stock brokerage, investment advice and
interest-free banking. In addition, banks have been distributing life insurance and
other insurance products to their customers and investing in leasing firms. These
initiatives have promoted a very healthy, competitive environment in the domestic
market (SAMA, 2003). The following sections explain the history and the origins of
the Saudi financial services and the evolution of the banking sector in SA.
Page 117
101
3.4.2 The Saudi Stock Market
The Saudi stock market started operating informally in the late 1970s. The
extraordinary growth in the demand for oil in the early 1970s resulted in significant
increases in the income of the government in a relatively short span of time. This led
to the creation of vast wealth, which needed to be channelled into the development of
the infrastructure, industry, agriculture, and commerce in the country as a whole. As
mentioned earlier the market regulation has been announced in 1984. The Saudi Share
Registration Company (SSRC)1 was established in 1985 and ESIS was introduced 5
years later in 1990. The participation in the market was restricted to Saudi citizens;
however, in 1997, the Saudi Finance Minister announced that foreigners could invest
in Saudi stocks through a single closed-end mutual fund2, namely, the SA Investment
Fund (SAIF), traded in London. As it was a "closed-end" fund, the SAIF limited
foreign money in the Saudi market to USD 250 million, the initial size of the fund
(SAMA, 2004).
The main objective of SAGIA is to oversee investment affairs in SA, including
foreign investments. Its functions include the preparation of relevant government
policies, conducting executive plans and criteria, monitoring and evaluating the
performance of local and foreign investments, conducting studies in investment
opportunities and coordinating with the relevant government bodies. Since its creation
in 2000, SAGIA has been an important player and influence in the development of
1 The Saudi Share Registration Company (SSRC) looked after the functions like depository and
registration. Under present regulations, SSRC is allowed to transfer shares from a seller to a buyer
directly at the instruction of the two parties concerned, without going through the banking channels
(Al-Dukheil, 2002).
2 A closed-end mutual fund is a publicly traded investment company that raises a fixed amount of
capital through an initial public offering (IPO). The fund is then structured, listed and traded like
stock on a stock exchange (Wadadekar, 2010).
Page 118
102
new laws and in economic reforms to encourage investments. Since its creation,
hundreds of new investment projects have been approved with billions of dollars in
new investments (SAGIA, 2001).
Until 2001, the Saudi Stock Market had operated through a computerized, order-
driven continuous screen-based trading system, ESIS, which was supervised by
SAMA. In 2000, more than 78 firms were listed on the stock market, and in the fourth
quarter of 2001, ESIS was replaced by a new trading system called "TADAWUL". In
2001, the shares volume had increased to 694 million shares, an increase of 22%, the
value traded had also increased to SR 83.8 billion, an increase of 28.9% compared to
2000 (SAMA, 2002).
In 2003, the “Capital Market Law” was introduced to restructure the capital market in
the country, taking advantage of international stock market standards. The reason for
issuing this law was to protect the investors’ rights and to ensure the reliability and
confidence in the Saudi Stock Market. Figure (3.5) describes the Saudi market index
(TASI) levels and traded values between year ends 2000 and 2011. It can be noticed
the real revolution of the IB and its relation with the Saudi stock market, from ends of
2002 and the beginning of 2003, the rapid boom in the Saudi stock market settled and
the stock price index kept growing steeply, without major breakdowns, to reach its top
level (over 20,600 points) by the end of February 2006, and a decline after that going
down to reach 10,000 points by May 2006, below 8,000 points in the beginning of
2007, and closed at 6,121.8 points at the end of 2009 compared to 4,803 points at the
end of 2008.
Page 119
103
Figure 3.5: Saudi market index (TASI) levels and traded values year ends (2000-2011).f 23
Source: (Capital Market Authority (CMA), 2012).
The increase in listed companies on the Saudi capital market is illustrated in Table 3.2
for the period 1990-2011.
Year Companies listed Total shares issued (million)
1996 70 3,921
1997 70 3,983
2002 68 9,807
2006 86 19,328
2007 111 30,728
2008 127 39,728
2009 134 41,223
2010 146 33,334
2011 149 48,536 Table 3.2: Saudi-listed companies and number of shares issued (1990-2011). t 6
Source: (CMA, 2012).
In terms of the volume of shares traded, the petrochemical industries sector was the
most active sector during 2011; the number of shares traded for the sector reached
9.55 billion shares, representing 19.67% of the total volume traded during the year,
followed by the Insurance sector with a volume of 7.19 billion shares or 14.81% and
the real estate development sector with 5.30 billion shares traded or 10.91% of the
total shares traded during the year 2011(CMA, 2012). Figure (3.5) and Table (3.2)
show the real boom the Saudi stock market, started with the revolution of the IB
starting from 2002.
Page 120
104
3.5 Islamic Banking (IsB)
On 11 December 2005 SA became the 149th member of the WTO (WTO, 2005).
Local banks were forced to refine and improve their services - in pricing, flexibility,
delivery, and after-sales services - to meet the required standards. Therefore, most of
the Saudi banks have been working hard since accession to WTO to capture a good
market share by introducing services to attract the deposits of corporate parties as well
as individual clients. Saudi banks are currently offering a wide range of ‘Islamic
products’ ranging from corporate and consumer loans to credit cards.
With the rise of IsB, e-banking and IB, the government realize the importance and
needs to come up with the appropriate legal, regulatory and accounting infrastructure
for such banks. Shari’ah governance is also a major issue. Saudi consumers have
recently been complaining about the confusion in the market relating to Islamic
financial products, because of a perceived free-for-all in terms of Fatwas1 (legal
opinions) as to what is a Shari’ah-compliant financial product or not. Market sectors
set to offer excellent opportunities include housing finance, education plans,
insurance, small businesses, pensions, credit cards, retail investment products and
remittances. The banks that offer IsB services are similar to a modern western bank in
almost all of functions, which empowers them to mediate any shortcomings or
surpluses that may exist in a monetary exchange economy.
In general, IsB services are services which can be provided by a bank which also
provides non-Islamic services. So, the differentiation between Islamic and
1 A religious decree. A ruling made by a competent Shari'ah scholar on a particular issue, where fiqh
(Islamic jurisprudence) is unclear. It is an opinion, and is not legally binding. It may address either
a specific problem of interest to a particular person or a matter of public concern (Institute of
Islamic Banking and Insurance, 2009).
Page 121
105
conventional banks is in service levels, not in bank levels, as customers are the one
who select between the Islamic or non-Islamic services. However, the main difference
between Islamic and conventional banks lies in the fact that conventional banks
charge and pay interest, whereas Islamic banks do not as they consider interest as
Riba (a prohibition outlined in the Qur’an) (Ghannadian and Goswami, 2004).
Despite such a limitation, Islamic law does not require that the seller of a product be
Muslim (Ghannadian and Goswami, 2004).
National Commercial Bank (NCB) launched a new promotional campaign titled “One
Easy Way to Win” offering its customers an opportunity to win six luxury villas
valued at SR 1 million each. The promotion came with NCB's Islamic credit card.
According to Abdulrazzak Elkhraijy, head of NCB's Islamic Retail Banking Division,
“it is the only credit card in the world which allows its customers to pay the value of
their merchandise in accordance with the principles of Tawarruq1 sales. NCB also has
products that allow customers to receive Islamic personal loans based on the
Murabaha2 concept. It boasts the largest family of Islamic investment funds under its
Al-Ahli brand (NCB, 2006).
As a Muslim country, SA adheres strictly to the IsB principles believing that
paying and receiving interest are considered inappropriate financial practices.
1 “Tawarruq” is reverse “Murabaha”, for the purpose of acquiring cash through trade activities.
Technically, according to the Muslim jurists, Tawarruq can be defined as a person who buys a
commodity at a deferred price, in order to sell it for cash at a lower price. Usually, the sale is to a
third party, with the aim of obtaining cash. This is the classical form of Tawarruq, which is
permissible, provided that it complies with the Shari’ah requirements on sale (bai) (Institute of
Islamic Banking and Insurance, 2009).
2 “Murabaha”, in accordance with its literally meaning, is the sale for mutually agreed profit.
Technically, it is a contract of sale in which the seller declares the purchase cost and profit (Institute
of Islamic Banking and Insurance, 2009).
Page 122
106
Because of this fundamental belief, there are still Saudis who shy away from
depositing money in commercial banks even through non-interest-bearing
accounts (Habib et al., 1 9 8 7). Increasingly, commercial banks in SA face keen
competition from traditional money exchangers, specialized governmental funds,
offshore banking units located in nearby country, Bahrain, and other Islamic
banks. Islamic financing and a rapid increase in both Islamic and “conventional”
institutions offering Islamic products and services, attests to the growing popularity of
this market segment (Abdeen and Shook, 1984; Archer and Karim, 2002; Faroqui,
2002). The Saudi market is no exception, as evidenced by the remarkable market
share that Al Rajhi Bank currently enjoys, and the conversion of a large number of the
branches of the NCB to “Islamic branches” due to the high demand for the IsB
services. Those “Islamic branches” are still offering some non-Islamic services but on
a limited basis (SAMA, 2008).
SAMA (2008) reports indicate that Al Rajhi Bank is going one step further in
identifying new Islamic financing instruments and is considering underwriting a
multi-billion Riyal Saudi government Islamic bond program. This would represent
SA’s first Islamic bond, and such Islamic instruments would undoubtedly add breadth
to the new Saudi capital market and provide Saudi investors with the choice of
participating in Islamic-acceptable products and, in the process, would further deepen
the Saudi financial system. As illustrated in Appendix J, IsB services are the key
strength of Al Rajhi, NCB and Al-Jazira banks, and gave them the first mover
advantage over the other banks. Therefore, the availability of IsB services online in
the Islamic countries, such as SA, is an area of investigation in this study.
Page 123
107
3.6 ICT Evolution in SA
IT infrastructure can be seen as a term used to embrace the collection of computers,
communication equipment, operating software and links that jointly form the platform
for delivering information products and services to the organisation, to its contributors
and to its clients. IT infrastructure, according to Robertson and Sribar (2002), can be
defined as a layer that is shared by a larger audience than the structures it supports and
provides a shared service. Also, its lifecycle (plan, build, run, change, and exit) is
distinct from the structures it supports. IT infrastructure is vital to organisations and is
particularly necessary to those in industries going through active change, and those re-
engineering their business processes (Broadbent and Weill, 1997). The government of
SA has played a major role in introducing IT into the country. It has dynamically
attempted to connect all public offices with the latest technologies to improve the
quality of work and services. Meanwhile, it encourages the private sector to follow in
its footsteps by applying highly developed technology to smooth the progress of their
organisations for competing in a changing business world. In 1977, the Saudi
government formed the Saudi Arabian National Centre for Science and Technology
(SANCST), which in 1985, was renamed the King Abdulaziz City for Science and
Technology (KACST); it is charged with formulating the national science and
technology policies, as well as promoting and co-ordinating research activities among
scientific organisations and research centres. KACST is one of the channels that
provide internet services (KACST, 2005).
SA has also adopted a multi-phase plan to restructure the ICT sector. In the first
phase, the responsibility for the provision of telecom services was transferred from
the Ministry of Post, Telegraph and Telephone (MPTT) to a state-owned company,
incorporated in 1989 as Saudi Telecom Company (STC). In June 2001, the second
Page 124
108
phase started by reforming the policy and regulations. The government enacted the
Telecommunications Act, which established the legal framework for the development
of the telecommunications sector and authorized the creation of a regulatory agency.
An independent regulator, the Saudi Communications Commission (SCC) was
established. However, recognizing the importance of an integrated ICT approach, the
Ministry of Communications and Information Technology (MCIT) was created in
2003 to replace the MPTT (MCIT, 2007). The mandate of the Regulator was extended
to include IT, with its name subsequently being changed to Communication and
Information Technology Commission (CITC ) (CITC, 2007). In the third phase,
partial privatization of the state-owned STC was completed in early 2003, by
divesting a 30% stake in the company to the public (STC, 2004). In Sept. 2003, the
liberalization phase (fourth phase) was considered when the Saudi government
announced a timetable for the liberalization of the telecom sector–licensing a second
mobile operator in the final quarter of 2004 and for fixed telephony services in 2006.
During 2002-2004, CITC introduced competition into the ICT sector (CITC, 2006).
In 2010, SA’s government spending on IT services increased by 10.2%, compared
with 2009, to reach a value of SR 6.2 billion, and it is expected to expand at a
Compound Annual Growth Rate (CAGR) of 15.4% through to 2015 to reach SR 12.6
billion. Project services, which encompass systems integration and application
development, constitute the largest portion of the IT services market in SA. SA
requires continued investment in the automation, modernization, consolidation, and
integration of disparate IT systems. The need to integrate, automate, and streamline
businesses is also expected to stimulate demand for project services, and this segment
therefore continue to dominates the Saudi IT services market (CITC, 2012). Table 3.3
shows a summary of the SA ICT market’s direct and indirect key drivers and barriers:
Page 125
109
Drivers Barriers
Direct Investment in Datacentres: With organizations
across vertical sectors investing in improving their
IT infrastructure, the demand for datacentres in the
SA is at an all-time high, with client organizations
contracting IT service providers to design the
required infrastructure.
Continued Evolution and Growth in Managed
and Shared Services: The outsourcing market in
SA is evolving, primarily driven by the fact that
service providers are increasingly investing in
introducing new services portfolios and educating
their customers. This has led to an increased
adoption of hosting and managed services.
Consumer Sector Demand: SA has a large
population base with a high percentage of young
people. Coupled with the factors of relatively high
disposable incomes and increasing market reach,
the consumer is expected to drive demand across
multiple ICT markets, including PCs, and
consumer mobile voice and data services.
IT Skills Deficit: The Saudi market
faces a shortage in IT skills. While this
situation positively related with the
outsourcing services offered by third-
party service providers, it can also
affect the economy on a broader scale.
Data Security: Data security remains
a key concern for Saudi companies
across all verticals.
Customer Education: On the one
hand, SA has some very innovative
and forward-thinking organizations in
terms of IT usage, but to a large
extent, a lack of customer education
often inhibits the adoption of emerging
technologies and solutions within the
Kingdom.
Indirect Economic Cities: SAGIA, responsible for driving
foreign direct investment (FDI) in the country is
leading several initiatives, including the ongoing
development of economic cities in the country.
SA’s 2011 Benefit Plan: In order to ensure SAs’
facilitates improved public services and
infrastructure; King Abdullah unveiled a benefits
plan for SA worth an estimated SR 138.8 billion
that primarily aims to address the demand for
houses and civil infrastructure in rural areas across
the country.
Investments in Infrastructure Projects: The
Saudi government has launched several large-scale
infrastructure projects based on the long-term
strategies of achieving a sustainable economy and
reducing SA’s dependence on oil revenues.
Regional Developments: Recent
regional events, such as the social
unrest in certain Arab countries, have
the potential to temper market
sentiment and spending, and decrease
the appetite for foreign investment in
the region, including in SA.
Oil Price Volatility: While oil prices
are at a recent high, any fluctuations in
the prices and any negative changes
will indirectly affect IT spending.
Table 3.3: Direct and Indirect IT Market Drivers and Barriers in SA. t 7
Source: CITC (2010).
Page 126
110
3.6.1 ICT (Computer, Telephone and Mobile) Diffusion in SA
In 2001, SA was considered to be the largest ICT market in the GCC with a spending
level of USD 3.9 billion, which corresponded to 60% of total IT spending in the GCC.
SA’s IT spending as a percentage of GDP stands at 1.99%. This means SA is ranked
in second place among GCC nations compared with fifth place in 2000 in ICT
spending per capita. SA invested USD 10.6 billion in IT, according to SAGIA,
suggesting a healthy market for the ICT sector. The cornerstone of all these initiatives
is SA’s National ICT Plan. In 2002, the plan was first announced to the Saudi
Computer Society (SCS) by His Royal Highness King Abdullah bin Abdul Aziz, SA’s
king (SAGIA, 2005). The national ICT plan includes a long-term vision and the first
five-year plan for ICT in SA. The long-term vision is “to transform the country to an
information society, so as to increase effectiveness and efficiency, and provide e-
services for all sectors of the society, and build a solid ICT industry to become a
major source of income for the nation”. The objectives seek to bridge the digital
divide by enabling all societal sectors to reach and access ICT services easily and
utilize them effectively. Other objectives include creating job opportunities, raising
the efficiency of education and training through ICT plus the preparation of qualified
manpower (SAGIA, 2005).
The five-year plan includes projects that cover the main aspects of ICT usage, such as
e-government, e-commerce, tele-work, telemedicine, e-learning, and digital Arabic
and Islamic/cultural content. Further, they cover the regulatory activities, such as
issuing licenses for new voice and data operators, and regulating the ICT market. The
scope also includes ICT industry elements, such as identifying investment
opportunities, research, development, innovation, international cooperation, and
technology transfer. A set of indicators called the Information Society Indicators are
Page 127
111
identified and measured against specific targets by the end of the plan (KACST,
2005).
According to a survey conducted by CITC in 2008, computer ownership among Saudi
individuals was at 68% for 15 to 60 years of the total population. However, at the total
population/household level, ownership stood at 43%. PC ownership in Saudi is
considerably higher among the younger age group with about 73% of the 15-25 year-
old segment owning personal computing devices. The same survey found that laptops
do have good penetration and are owned by close to half the PC owner population
(46%), and the majority of them own a single computing device. However, there are a
few desktop owners who own more than one desktop – less than 10%. Among those
owning a laptop, 16% own more than one laptop. Figure 3.6 shows the evolution of
fixed telephone services in SA from 2001 to 2011 (3Q). The number of fixed
telephone lines stood at 4.52 million by end of the third quarter 2011, of which around
3.34 million or 73% were residential lines. This represents a household teledensity of
around 67%, while the population teledensity is around 1 telephone lines for every 6
inhabitants. This is slightly lower than the world average of 17.8%, but is higher than
the Arab average of 10.5% and developing countries average of 13.5% (CITC, 2012).
Figure 3.6: Telephone line growth in SA (2001-2011 3Q).f 24
Source: (CITC, 2012).
Page 128
112
Competition in the mobile telecommunications market started in 2005, as it had been
a monopoly market before that, and this resulted in major developments in terms of
service offerings, quality of service, customer care, reduced prices, and subscriber
growth. The total number of mobile subscriptions had grown to around 56.1 million
by end of the third quarter of 2011, with penetration at 198%. Prepaid subscriptions
constitute the majority (over 87%) of all mobile subscriptions, in line with the trend in
other similar markets around the world.
Figure 3.7: Mobile Penetration in SA (2001-2011 3Q).f 25
Source: (CITC, 2012).
3.6.2 Internet Service Diffusion in SA
Internet service started in SA in 1998 following the Council of Ministers’ decision no.
163 (on 03/03/97) authorizing the provision (KACST, 2005) of the service, under
certain controls; the aim was to make the service available to customers to enable
them to benefit from the great potential of the internet, while, at the same time,
protecting the values and Islamic beliefs of Saudi society. The Saudi Arabian
government spent two years designing a centralized control system before offering it
for public connection in February 1999.The controls relate to blocking access to
inappropriate content. Internet service is provided through three channels: the internet
services unit at KACST, Saudi Telecom, and internet service providers (ISPs). Table
3.4 highlights the historical development of internet events in SA:
Page 129
113
Year Event
1993 King Fahd University of Petroleum and Minerals (KFUPM) in Dhahran
becomes the first Saudi institution to connect to the internet.
1994 KACST becomes the '.sa' domain manager to coordinate internet services
within the Kingdom.
1999 Internet access begins the move from government and academia into the
mainstream.
2004 Liberalization of the ICT market by introducing new licenses for telecom
services.
2004 SADAD has been introduced.
2005 MCIT establishes the e-Government programme.
2006 The transfer of internet-related responsibilities from KACST to CITC.
2007 Saudi Electronic Transactions Act promulgated – establishing rules for
electronic transactions and digital signatures.
2010 Household broadband penetration reaches 41.6 % in SA.
2010 Saudi Post addressing system certified as complete.
2010 Registration opened for Arabic domain names under (السعودية.). Table 3.4: SA main historical development internet events. t 8
Source: CITC (2010).
The internet unit at KACST manages and operates the international lines through
which the national internet network is connected to the international network; it
supervises the internet gateway and blocks undesirable sites. STC provides, manages
and maintains the telecommunication infrastructure in the country. It provides the
linkage between customers and ISPs, between ISPs and the KACST network, and
between KACST and the international network. Figure 3.8 shows a simple diagram of
the internet infrastructure in SA (KACST, 2005).
Internet Modem Bank
Modem pool
ATM Network
KACST-1
KACST-2
Dialup Clients
PSTN
DDN
Leased-line
customerISP
i
ATM
SDH
SDH
ATM
ATM
Figure 3.8: Internet infrastructure in SA.f 26
Source: KACST (2005).
Page 130
114
There are presently 31 ISPs in SA, of which 26 are reported to be operational.
Between them, the five largest ISPs, which include Saudi Telecom’s own SaudiNet,
control 65% of the subscriber market (KACST, 2005). Accurate statistics are hard to
come by in SA and figures in the public domain may be treated as confidential by the
authorities. When studying the internet services in SA, it is important to evaluate the
estimated extent of the provision of internet services in the Kingdom because the
costs factor is a main factor in adopting the internet services. There are three main
telecommunication companies, namely, STC, Mobily, and Zain, and all of them
provide internet broadband packages. The detailed prices for these services are
presented and discussed in the following paragraphs.
STC was incorporated in 1998, following the Council of Ministers’ Decree No. 213
dated 23/12/1418 H, approving of the establishment of a Saudi Stock Company under
the name of “STC”. STC is the leading national provider of telecommunication
services in SA. The company is working continuously to fulfil and satisfy the market
requirements, keeping pace with the emerging technologies in the telecommunications
sector and satisfying its customers’ needs. In addition to their telephone land lines and
Mobile services; STC has developed different types of internet broadband packages
from SR 299 to SR 546 to meet the needs of the different levels of customers. Table
3.5 shows STC’s different types and pricing scheme of internet broadband packages.
Internet Broadband Cost Estimate (SR pcm)
Broadband Jood + SIM card 1G allowance 299
Broadband Jood + SIM card 5G allowance 349
Broadband Jood Plus + SIM card 1G allowance 449
Broadband Jood Plus + SIM card 5G allowance 499
Xband Jood + SIM card 1G allowance 346
Xband Jood + SIM card 5G allowance 396
Xband Jood Plus + SIM card 1G allowance 496
Xband Jood Plus + SIM card 5G allowance 546 Table 3.5: Different types of STC internet broadband packages with their prices. t 9
Source: (STC, 2011).
Page 131
115
STC provides another service for land lines. This service allows the customer to
benefit from an AFAQ Digital Subscriber Line (DSL) service with a connection to the
internet by means of prepaid cards according to diverted connection speeds and full
post-go-live support for DSL; the modem fees and service charges are shown in
Tables 3.6 and 3.7:
Modem type Modem price Payment option
WiFi with ports SR 220 SR 20 / month over 12 months Table 3.6: STC AFAQ DSL modem fees.t 10
Source: (STC, 2011).
Connection (Kbps) Installation Monthly Charges (SR)
128 SR 300
Fees Once at
Installation
90
256 100
512 120
1 140
2 160 Table 3.7: STC AFAQ DSL service charges. t 11
Source: (STC, 2011).
Mobily is the trade name of SA's second telecommunications company, the Etihad-
Etisalat consortium. The company, as the winning bidder for SA's second Global
System for Mobile Communications licence (GSM), provides mobile telecom services
nationwide, breaking Saudi Telecom's monopoly in the wireless business. The
company launched 3.5G services on the 27 June 2006. Since entering the Saudi
market in 2004, Mobily has adopted a solid expansion strategy, based on direct and
indirect sales channels. This strategy has allowed Mobily to introduce different
pricing strategies to target the different types of customers in SA, as presented in
Table 3.8.
Broadband @ home Mbps 1 Month SR 3 Month SR 6 Month SR 1 Year SR
2 350 950 1525 2520
1 N/A 800 1120 1920
512 N/A 540 1020 1720
256 N/A 485 750 1450 Table 3.8: Different types of Mobily internet broadband packages with their prices. t 12
Source: (Mobily, 2011).
Page 132
116
Zain is the newest player in the mobile telecommunication market of SA. Zain is
striving to become the preferred choice for voice, messaging, multimedia, call
management, data and other services in SA. Zain Group has been introduced to the
SA telecom market by building a trusted and effective telecommunications provider
for the largest country in the Middle East. As part of their strategy, Zain introduced
the following monthly estimated cost for their broadband services in SA, as seen in
Table 3.9.
Monthly Plan Estimated Cost (SR) Pay Per Day 9
Standard Package: 1GB monthly 100
Plus Package: 5GB monthly 200
Unlimited Monthly 350 Table 3.9: Different types of Zain internet broadband packages with their prices.t 13
Source: (Zain, 2011).
CITC (2010) conducted field and online surveys investigated rating the internet
broadband services prices provided to households. The majority (79%) of the field
respondents revealed prices as (moderate to expensive) and majority (80%) of the
online respondents rated the service as expensive to very expensive. On average
across both field and online surveys; respondents rated prices of mobile service as
moderate to expensive.
The number of internet subscribers was estimated at 100,000 at the end of 1999. That
number had increased to 900,000 in 2001, and to 1,500,000 at the end of 2003. In
addition, there are some 3,500 subscriber internet lines and about 2,500 internet-
leased lines. The number of users had reached 4,800,000 or 18% of the population at
the end of 2006. However, in 2008, this had increased to 30.5% of the entire
population of SA and internet penetration had reached 43.6 at the end of 2011, as
illustrated in Table 3.10 and Figure (3.9).
Page 133
117
Country / Region Population Millions Population Penetration
North America 347 78.3%
UAE 5 69%
Qatar 0.85 66.5%
Oceania/Australia 35.4 60.1%
Europe 816.4 58.3%
Bahrain 1.2 53.5%
Oman 3 48.4%
Iran 77.9 46.9%
Turkey 78.8 44.4%
SA 26 43.6%
Kuwait 2.6 42.4%
Middle East 216 33.5%
World Total 6930 30.2%
Jordan 6.5 26.8%
Table 3.10: The internet penetration rate in SA, GCC and other countries, as end of 2010.t 14
Penetration rate = Internet users/ population.
Source: (Internet World Statistics, 2011).
Table 3.10 shows the disparities in internet penetration across GCC countries and
different regions. In comparison with the other GCC countries, SA was found to be
one of the lowest ranking countries in terms of internet penetration, with a rate of 43.6
at the end of 2010, and that might be due to their infrastructure readiness.
According to a study about internet users in SA that was conducted at the end of 2011
by the SA CITC, the number of internet users in SA had grown from around 1 million
in 2001 to an estimated 11.4 million by the end of 2010, and 13 million by the end of
the third quarter of 2011, as shown in Figure 3.9.
Figure 3.9: Internet penetration in SA (2001-2011 3Q).f 27
Source: (CITC, 2012).
Page 134
118
Regarding the reliability of internet services, multiple linkages are used through a
number of international ISPs and fibre-optic lines via different marine cables. Figure
3.10 shows the distribution of domain names registered in the country as of February
2012.
Figure 3.10: Number of the registered domain names in SA as of February 2012.f 28
Source: (Saudi Network Information Centre (SaudiNIC), 2012).
Between 2004 and 2011, the ICT sector grew by a CAGR of 10%, two and a half
times (250%) the overall GDP CAGR of 3.66%. This rapid growth is attributed,
among other factors, to increased public awareness of the internet, growth in
broadband, decreasing cost of both computers and internet access, and enhanced
usefulness of the internet (e.g. more Arabic language sites and an increasing number
of applications, such as IB and e-commerce/government applications).
As is evident from Figure 3.11, most broadband growth was due to a phenomenal
increase in wireless broadband connections. Fixed broadband subscriptions, including
DSL subscriptions, fixed wireless (Wimax) subscriptions and other fixed lines had
grown to around 3.13 millions subscriptions at the end of the third quarter of 2011.
Page 135
119
Figure 3.11: Broadband penetration in SA (2004-2011 3Q).f 29
Source: (CITC, 2012).
The fixed broadband penetration rate stood at around 30.6 % of households at the end
of the 3rd
quarter of 2011. Despite the high growth rates over the last few years, there
is high potential for more growth in broadband services. The broadband market is
significantly underserved in many suburban and rural areas. With the opening up to
competition of the fixed telecommunications market, the intense competition in
mobile broadband offerings, and the increased consumer demand for fast internet
connections, the broadband market is expected to continue to grow at a rapid pace, as
the mobile and fixed service providers continue to roll out their broadband networks
with competitors fulfilling the growing demand.
In 2010, CITC conducted a large-scale survey involving over 1,500 Saudi residents
and more than 400 companies, government entities and other stakeholders of the
internet network. CITC’s research found that usage of the internet is increasing
among all sectors of Saudi society. Although there are still some barriers to the
widespread adoption of cutting-edge services, residential, government, and enterprise
users all indicated that they expected the internet to play an increasingly central role
Page 136
120
in their life and business over the next five years. Enterprises most often use the
internet for interacting with government authorities and for accessing banking and
financial services: more than 75% of the respondents used the internet for these
operations. However, the most frequent use of internet content by government
organizations was interaction with other government authorities, with 90% reporting
such usage. The next most-widely used functions were HR-related activities, banking
and financial services, and training and education. While internet usage in SA still
lags behind among most of the developed countries, CITC’s research confirms that
the internet has become an integral part of Saudi society. Figures 3.12 and 3.13
present the Saudis' attitudes toward the usage of internet and the purpose of their
usage.
Figure 3.12: Saudi attitudes toward internet content.f 30
Source: (CITC, 2010).
Page 137
121
Figure 3.13: Saudi usage of internet content.f 31
Source: (CITC, 2010).
On the other hand, Al-Far (2005) and Almobarraz, (2007) found that "lack of training
in using internet applications as well as the difficulty of dealing with English
language were the most common problems when accessing the internet". CITC (2008)
conducted a study about the internet usage, asking those who did not access the
internet to give their reasons for not doing so. The most frequently occurring reason
(34%) was that they did not know how to use a computer. Almost one in five (19%)
claimed non-affordability (cannot afford to have an internet connection, or probably
the necessary computer to support it). Only 8% of them stated that their family did not
allow an internet connection at home (CITC, 2008).
In addition to that, SA is considered as a country where there is a high risk of being a
victim of e-crime (Al-Hakim, 2012). Al-Hakim (2012) also reported in the Saudi
Gazette that banks in SA have sustained losses of USD1 billion over the past two
years because of electronic crimes. He also reported that the law needed to address the
lack of regulations to fight cyber crime, in addition to dealing with the absence of
proper rules and regulations to combat these crimes which have caused SA’s banks to
Page 138
122
sustain great losses. In a similar vein, Shafi (2002) found that Saudi businesses use the
internet mostly for conservative tasks; therefore, the security concerns did not affect
the customers’ attitudes when adopting or using the IB services. Moreover, Humaidan
reported in an Arab newspaper in 2010 that Saudis generally do not complain when
they fall victims to internet cyber crimes; most of them whose e-mails had been
hacked preferred to open a new e-mail account instead of reporting the matter to the
police. This finding is also supported by the fact that the Saudi government has
established huge filtering system for the internet users which let the users feel that
these filtration systems will keep them secure when using internet or even IB. With
regards to that, Hermida (2002), referenced in a Harvard Law School report, found
that 2,000 sites had been blocked by the Saudi government; according to O’Connell
(2008), which had increased to 400,000 sites in 2008. The majority of these blocked
websites were sexually explicit or had religious content, while the rest were about
women, health, drugs, and pop culture. It is unique for a country to block websites in
order to maintain Islamic values and prevent people's beliefs from being influenced
(Hermida, 2002).
3.7 Chapter Summary
This chapter started by highlighting the nature of the international banking industry
and the different forces that relate with the sector. This showed that the banking
industry is a very dynamic and is continually experiencing rapid change, especially
with the introduction of new technologies, such as IB. Moreover, the economic
background in SA introduced and the main economic indicators were found to be
strong compared with GCC, Arab and world averages, as the GDP, inflation, and
unemployment rate were 7.5%, 6.02% and 10.46% respectively.
Page 139
123
This chapter also revealed that the average wage for males was SR 7,650, and for
females was SR 3,100. The global prosperity index using PPP indicated that the SA
average income per capita was around USD 22,000; Qatar was the highest at USD
73,000 ahead of the USA and on a par with Norway. With regards to that and with the
presence of three main ISPs in SA, namely, STC, Mobily and Zain, and all of them
provide internet broadband packages; the internet service has been found expensive.
This finding supported by Al-Furaih (2002) who found that the cost of internet
services is expensive compared with the income levels and average wages in SA. This
is also in line with the findings by CITC (2010) that almost one in five of those
surveyed (19%) claimed non-affordability (cannot afford to have an internet
connection, or probably, the necessary computer to support it).
This study found also that 11 banks have established their presence on the internet
since 2001, as their websites were bilingual, being designed for both Arabic and
English speaking users, and among those banks, the key strength of Al Rajhi Bank
and NCB was the IsB, as the Islamic values were found to be very important and
significant to Saudi Arabians. Regarding this, and because of the presence of the
internet, managing the branches of foreign banks, post WTO accession, has added to
the challenges faced by the SA banks in the medium- and long- term.
This study also found that internet penetration had reached 43.1% at the end of 2010
and 46% at the third quarter of 2011, which is over the Middle East average (33.5%)
and the world average internet penetration (30.2%). With such an increase of the
internet penetration and unlike other countries; SA is facing a serious internet security
challenge especially given that, as indicated in this chapter, Saudis generally do not
complain when they fall victims to internet cyber crimes. Therefore, the government
Page 140
124
should increase people’s awareness of the security issues, taking into account the
participation of the private sector and their role of minimising such attitudes.
Finally, the IB sector and different issues arising from IB were also evaluated; the aim
of the service initially was to provide two-way communication to ask for further
information or make suggestions. This progressed to banks using the internet for
transactional purposes i.e. as a proper delivery channel. The introduction of internet
technology has offered additional challenges to SA’s government due to the
uncertainty regarding maintenance of the infrastructure. Thus, government agencies
and financial institutions face additional responsibilities to develop and improve the
infrastructure of IB services. In SA, IB has seen only limited adoption compared to
most western countries and other Arab countries. Next chapter will present the
research philosophy, methodology and design which details the data collection
method and conclude with the proposed inferential statistics.
Page 141
125
Chapter Four
Research Methodology
4.1 Introduction
The aim of this chapter is to describe the research methodology that was was
developed as part of this research and to explain the stages undertaken and the
methods employed by the researcher to collect the data. This chapter is structured as
follows. It starts with an overview of the research philosophy, methodology and
design, including the type of research. It is followed by a detailed discussion of the
justifications for the research philosophy and the design adopted in this research
including the population and sample. This chapter also provides a detailed description
of the data collection methods and stages, coding procedure, dealing with the missing
data, the questionnaire design and layout, the pilot work, the question types and
format, the covering letter, the respondents, the contents of the final version of the
questionnaire, administering the questionnaire, and the reliability and validity
evaluation. The operational definitions and the measurement of the research variables
are also presented in this chapter. Last but not the least, this chapter present the
research descriptive methods and the detail descriptive analysis of the research
variable. This chapter concludes with the proposed methods of analyses, such as
inferential statistics, reliability, factor, and MR analysis.
4.2 Research aim and objectives
This thesis aims to investigate the factors that influence customer attitudes towards
the adoption, use, and success of IB services in SA in order to suggest improvements
to the current situation. The pursuit of this aim can be broken down into the following
series of objectives:
Page 142
126
1. To establish how the SA IB market differs from IB markets in other countries.
2. To investigate the relations between different factors (e. g. demographics) and
IB services, from the customers’ point view, in developed and developing
economies.
3. To capture the most relevant factors that relate, from customers point view,
with the IB market in SA.
4. To understand the main differences between the different facets (adoption, use
and success) of IB services
5. To understand the relations between the customers' attitudes and the a)
adoption, b) use, and c) success of IB services in SA.
6. To establish well developed theoretically and tested empirically models of the
aforementioned facets.
7. To recommend some innovative ideas, solutions and improvements, which can
contribute to the enhancement and development of the adoption, use, and
success of IB services in SA, based on the successful tested models.
To satisfy the objectives of this research, the IB literature was reviewed to investigate
the effect of different factors on the adoption, usage, success of IB in SA (Chapter 1
and 3) and the Saudi Arabian banking system and IT infrastructure (Chapter 3). A
field survey method (postal questionnaire) was selected as the data collection method
to enhance the understanding about the different factors that affect the attitudes of
customers in SA towards the adoption, use, and success of IB (Chapter 4). Moreover,
various relevant IB theoretical models were presented and reviewed in order to
establish the model of this research (Chapter 2) which was tested and adjusted, as
discussed in chapters 5 and 6. These will be followed by the suggested improvements
to the IB system in SA, in chapter 7.
4.3 Key research questions
As introduced in chapter one this PhD evolved around one main and another
supplementary research question. Given the surveyed literature and the conceptual
Page 143
127
framework developed in chapter two, these two key research questions can now be
stated more fully in terms of the following operational key research questions that
delimit the scope for this study:
1. To what extent do different factors relate with the customes’ adoption of IB
services? What is the relative importance of each factor?
2. To what extent do different factors relate with the customers’ use of IB
services? What is the relative importance of each factor?
3. What are the relations between different factors and the customers’ success of
using IB services? and which relations are stronger?
4. What is the relationship between the adoption, use and success of the IB
services?
The operationalisation of the constructs involved in answering the above key research
questions (e.g. awareness, resistance to change, satisfaction, high security, self-
efficiency, awareness of IB services, income, education the availability of IsB
services and the availability of the infrastructure) are presented in sections 2.4.2 and
4.13.2.1.
4.4 Research philosophy and methodology
According to Creswell (2003), there are three main approaches to research, namely,
quantitative, qualitative, and mixed methods. The first two approaches have often
been related to a positivistic and a phenomenological philosophy respectively. These
two categories are sometimes described using different terms. The positivistic
philosophy is sometimes referred to as traditional, quantitative, or empiricist; whereas
the phenomenological approach is sometimes referred to as post-positivistic,
subjective, or qualitative (Hussey and Hussey, 1997).
In the same vein, Amaratunga and Baldry (2002) argued that research may be
categorised into two distinct types: qualitative and quantitative. The former
Page 144
128
concentrates on words and observations to express reality and attempts to describe
people in natural settings. In contrast, the quantitative philosophy grows out of a
strong academic tradition that places considerable trust in numbers that represent
opinions or concepts. With regards to that, Easterby-Smith et al. (2002) also pointed
out that there are two contrasting views of how social science research should be
conducted. The two traditions are positivism and social constructionism. The method
of social constructionism research can be contrasted directly with the eight features of
positivist methodology; they are summarised in Table 4.1.
Positivism Social constructionism
The observer Must be independent Is part of what is being observed
Human interests Should be irrelevant Are the main drivers of science
Explanations Must demonstrate causality Aim to increase general
understanding of the situation
Research progress
through Hypotheses and deductions
Gathering rich data from which
ideas are induced
Concepts Need to be operationalised so that
they can be measured
Should incorporate stakeholder
perspectives
Unit of analysis Should be reduced to simplest terms May include the complexity of
whole situations
Generalisation through Statistical probability Theoretical abstraction
Sampling requires Large number selected randomly Small number of cases chosen for
specific reasons
Table 4.1: Contrasting implications of positivism and social constructionism.t 15
Source: Easterby-Smith et al. (2002).
According to Amaratunga and Baldry (2002), logical positivism uses quantitative and
experimental methods to test hypothetical-deductive generalisations. It has been
argued that the positivistic approach seeks causes of social phenomena or objective
knowledge (facts) that can be gained from experience or observation. In this context,
Easterby-Smith et al. (1991) and Remenyi et al. (1998) argued that positivism
searches for causal explanations and fundamental laws, and generally reduces the
whole to the simplest possible elements in order to facilitate analysis.
As highlighted earlier in the key research questions, this research is concerned with
investigating the extent to which customers in SA can use IB. Additionally, the
Page 145
129
research model is aimed at investigating the extent to which some factors contribute
to the use of IB. It seeks the causal relationships between different factors and the use
of IB. Thus, the quantitative approach was adopted based on arguments which place
an emphasis on using it to address the causal relationships of a given set of model
variables. In this context, Eldabi et al. (2002) indicated that quantitative research
typically has a logical and linear structure in which hypotheses take the form of
expectations about likely causal links between the constituent concepts identified in
the hypotheses. Thus the determinations of the causal links specified by the
hypotheses will result in the acceptance or rejection of the theoretical propositions.
Hence, quantitative research places emphasis on methodology, procedure and the
statistical measure of validity. Amaratunga and Baldry (2002) indicated that
quantitative methodologies have the following strengths:
Comparison and replication are allowable.
Independence of the observer from the subject being observed.
Subject under analysis is measured through objective methods rather than being
inferred subjectively through sensation, reflection, or intuition.
Reliability and validity may be determined more objectively than with the use of
qualitative techniques.
Emphasises the need to formulate hypotheses for subsequent verifications and
Helps to search for causal explanations and fundamental laws, and generally
reduces the whole to the simplest possible elements in order to facilitate analysis.
According to Hussey and Hussey (1997, 73) the positivistic paradigm is the most
commonly adopted philosophy in business research. Several empirical studies and
investigations, in the field of marketing, have been conducted using quantitative
research philosophy in their research designs to explore the expected relationships
that might emerge from interaction among a given set of a research variables (e.g.
Page 146
130
Sathye, 1999; Cheng et al., 2006). In the context of investigating the range of the
usage of IB, quantitative research has tended to focus on addressing specific
operational issues and usually concerned with the development and testing of rigorous
causal relationships (Cheng et al., 2006). Generaly speaking, choosing the positivistic
paradigm in this research refers to the following issues:
1. Generalisation. In surveys, a quantitative survey approach seeks to identify
relationships that are common across regions, and hence provide a general
statement, or theory about the phenomenon being researched (Bryman, 1993;
Eldabi et al., 2002).
2. Causality. The quantitative research is concerned with establishing the causal
relationship between concepts (Bryman, 1993; Eldabi et al., 2002).
3. Individualism. A quantitative research instrument focuses on the individual. The
responses are then added together, even though the respondents often do not know
each other (Bryman, 1993; Eldabi et al., 2002).
4. Savings in time and effort. Adopting a cross-sectional survey methodology leads
to savings in time, effort, and the amount of resources required in comparison
with longitudinal and case study methodologies (Creswell, 2003).
The positivist perspective is concerned with the empirical testability of theories,
whether this requires theories to be "verified" or "falsified." This belief, in what is
known as the hypothetic-deductive account of scientific explanation, has two
consequences (Chua, 1986, p. 607):
A search for universal laws or principles from which lower-level hypotheses may
be deduced. Positivist researchers work in a deductive manner to discover
unilateral, causal relationships, that are the basis of generalized knowledge; that is,
that can predict patterns of behaviour across situations (Putnam, 1983, p. 41).
Page 147
131
A tight coupling among explanation, prediction, and control. If an event or action
is only explained when it can be deduced from certain principles and premises,
then knowing the principles and premises beforehand enables prediction and
control of the event or action.
This research, in general, investigated the utilization of IB and its relationship with
the customers’ attitudes. This study implemented a sample survey as a control of this
research investigation which is the primary data collection techniques, and inferential
statistics (MR) is the data analysis method used to "discover" causal laws. This
research examined the validity and reliability of identifying and measuring
instruments, which is considered vital steps of this research, as researcher detachment
from the research process, random assignment of subjects, and control over
confounding influences. The study paid close attention to employing standard
instrumentation with established records of validity and reliability. As participants
were required to express their experiences in terms of the researcher's constructs
through questionnaire items.
The positivist research aim to explain and predict external reality implies that people
are not active makers of their physical and social reality. Positivistic research
techniques encourage deterministic explanations of phenomena, in that these
explanations emerge from interactions between the researcher and his subjects, where
the researcher, by definition, dominates the relationship. In this research, as causal
relations to be examined, the positivist researcher focuses on the validity and control
of the research procedures, and hence adopts a predefined and circumscribed stance
towards the phenomenon being investigated. This study reviewed the literature,
developed the research model and hypothesis and utilized MR analysis to determine
Page 148
132
the relationship between variables and to describe the strength and direction of the
relationship between two variables (Pallant, 2001).
The researchs’ results revealed that adoption, use and success of IB models were
found predicting and explaining 62%, 39.4% and 30%, respectively (as presented in
chapter 6). The three models have shown high, good and fair prediction powers
(R²=62%, 39.4% and 30%, respectively) compared with other IB models, as their
results were found acceptable and satisfactory (e. g. Suh and Han, 2002 R²=75%;
Wang et al., 2003 R²=62%; Pikkarainen et al., 2004 R²=12.4%; Shih and Fang, 2004
R²=66%; Lallmahmood’s, 2007 R²=67%; Hosein, 2009 R²=32.2%). This means that
the use of results explain a large part of the variation of the factors that relates with
adoption and use of IB, whereas results explain a fair part of the variation of the
factors that relates with the success of the IB. This can be acceptable, due to the fact
that investigating factors which relate with the customers’ attitudes toward the success
of IB services is considered one of the pioneer studies that investigate the success of
IB services. Falk and Miller (1992) argue that a minimum of 10% explained variance
is acceptable for scientific advancement. The range of correlations in the published
TAM stream is from 20-60%, and the acceptability of the explanatory power of any of
these models was solely dependent on the judgment of the reviewers (Straub et al.,
2004). Cohen (1988) also argues that since the majority of social science studies
report relationships that correlate significantly at 0.50 or below, then a large effect is
approximately 0.50, a moderate effect is 0.30, and a small effect is 0.10. However, the
unexplained variations might be because of some other factors that mightbe needed to
be included such as loyality factor or omission of some important factors that relates
to the IB customers’ adoption, use and success such as the security factor which has
not been found significant in all the three models. Therefore, the explained variance
Page 149
133
of the research models was found supporting the decision to follow the positivistic
approach. The IB success factors are recommended for future studies to be
investigated further and the research’s model need to be extended to cover wide other
factors which have not been captured in this study.
4.5 Research design
It was argued in the previous section that the adoption of a particular research
philosophy will have implications for the development and implementation of the
research design. Moreover, the extent of research rigour will, in turn, depend on the
implemented research design. According to Sekaran (2003), there are some key
research design choices. These are concerning the purpose of the study, the type of
investigation, and its time horizon. According to Tashakkori and Teddlie (2003, 176-
82), the purposes of the study can be classified as descriptive (who, where, when,
what), exploratory (patterns, relationships), explanatory (model development, testing)
and evaluative (cause/effect, results) to supports hypotheses testing. The essential
difference between these types of studies lies in their objectives (Cooper and
Schindler, 2001). This study seeks to describe IB services users in SA; explores the
patterns and relationships between the adoption, use and success of IB services;
explains the relations through a model and hypotheses; and assesses the relationships
of several contingent variables with the adoption, use, and success of IB by testing a
number of hypotheses.
This research was also necessarily exploratory as gaining access to banks in a
complex environment of a developing country such as SA was a major research
challenge (Al-Ashban and Burney, 2001; Sohail and Shaikh, 2007). Therefore, this
research can be mainly classified as a descriptive study. A study’s survey methods can
Page 150
134
also be classified as longitudinal or cross-sectional. In longitudinal studies, data are
gathered at more than one point in time whereas in cross-sectional studies, data are
gathered once, perhaps over a period of days or weeks. Cross-sectional studies often
employ the survey method (Easterby-Smith et al., 2002). This research was conducted
at one point in time, so it is a cross-sectional or one-shot research.
4.6 Research Population
Sekaran (2003) defines the term “population” as the entire group of people, events, or
things of interest that the researcher wishes to investigate. The targeted population of
this research was all Saudis that could use IB services in SA. The researcher was
aware that access issues pose constraints particularly when seeking information
related to personnel, customers, investors and or financial data (Saunders et al., 2000),
as the policy of banks does not allow them to give a list of names or addresses or
account numbers. Consequently, it was decided, in this research, to rely on the Saudi
Telephone Directory in order to organise the primary data collection. Several studies
reported in the literature (Sathye, 1999; Cheng et al., 2006), has adopted similar
approach. To that effect the SA CITC Annual Report (2007), the total number of fixed
telephone lines approached 4 million at the end of 2007, 73% of which were
residential lines (2.9 million), which represents the population of this research. After
determining the sampling frame, it was necessary to choose the sample method and
the sample size. A random sample method was used because the researcher had
constructed a sampling frame, and because it is more representatives (Sekaran, 2003).
However, a random sample is one of several kinds of probability sample and its
results can be generalized to the population (Sekaran, 2003).
Page 151
135
4.7 Sampling
After defining the population, it is necessary to identify an appropriate sample and a
suitable sampling frame. Selecting a sample is a fundamental element of a positivistic
study (Hussey and Hussey, 1997). The reasons for sampling are the lower cost,
greater accuracy, and greater speed of data collection and the availability of
population elements (Cooper and Schindler, 2001). A representative sample should be
large enough to satisfy the needs of the study, should be chosen at random and should
be unbiased (Hussey and Hussey, 1997). The sampling frame for any sample is a
complete list of all the cases in the population from which the sample will be drawn
(Saunders et al., 2000). Initially, it is necessary to determine the appropriate criteria to
be used to select the sample of the study.
Therefore, a sample size of 1,000 respondents was selected from a total of 2.9 million
names listed in the Saudi Residential Telephone Directory. The larger the sample, the
more sure the researchers can be that their answers truly reflect the opinion of the
population. This indicates that for a given confidence level1, the larger the sample
size, the smaller the confidence interval2. When determining the sample size needed
for a given level of accuracy, researchers must use the “worst-case percentage”
(50%). So, with a confidence level of 95%, a confidence interval of 5% and a
1 The confidence level tells you how sure you can be. It is expressed as a percentage and represents
how often the true percentage of the population who would pick an answer lies within the confidence
interval. The 95% confidence level means you can be 95% certain; the 99% confidence level means
you can be 99% certain. Most researchers use the 95% confidence level (Maccor Research
Solutions, 2011).
2 The confidence interval (also called margin of error) is the plus-or-minus figure usually reported in
newspaper or television opinion poll results. For example, if you use a confidence interval of 4 and
47% percent of your sample picks an answer you can be "sure" that if you had asked the question of
the entire relevant population between 43% (47-4) and 51% (47+4) would have picked that answer
(Maccor Research Solutions, 2011).
Page 152
136
population of 2.9 million, in the case of this research, the sample size had to be at
least 384 (Saunders et al., 2000). The reason for selecting a large sample, in this
study, was to obtain a sufficient response rate so to ensure a representative sample.
This is consistent with Saunders et al. (2000) and Cooper and Schindler (2001), who
stressed that, it is important to choose a large sample size to ensure necessary
confidence with the data. Moreover, Alreck and Settle (1985) stated, “For population
of 10,000 and more, most experienced researchers would probably consider a sample
size between 200 and 1,000 respondents” (p. 45). The confidence interval (also called
the margin of error) for the research sample is plus-or-minus ( ) 3.1%, as calculated
below, by using the calculator of confidence interval (Maccor Research Solutions,
2011). On the basis of this result, it could be argued that any observations made on the
basis of this survey’s usable responses can be generalised across the target population
with relative safety.
To ensure that the research’s sample is random, Microsoft excel sheets was used, with
the support of Al-Wahda Express the official publisher of the Saudi telephone
directory, to generate 1,000 random numbers utilizing the random and sorting
functions in the excel sheets, which then used to select the names from the Saudi
Residential Telephone Directory. The random function generates and assigns random
values (between 0 and 1) to all the records in the excel sheet. After that, the sort
function was also applied for the whole records (sort by random numbers), sorting the
assigned random values from the lowest to the highest, then the first 1000 telephone
Population 2,900,000
Confidence Level 95%
Chances of Error 50%
Sample Size 1000
Confidence Interval 3.1%
Page 153
137
numbers were selected. This method was able to ensure that the sample was unbiased.
This approach is widely adopted by a number of different authors in the field of IB
(Sathye, 1999; Cheng et al., 2006).
The random selection process has been conducted in two steps, because the 2.9
million residential landlines are distributed across the 13 areas (explained in chapter
1, section 1.2). The first random selection was conducted on all areas separately and
generated 100,000 residential landlines, as an intermediate step for another random
selection, from the targeted population (2.9 million landlines). The number of the
selected residential landlines from each area was based on the residential landlines
distribution percentage for each area. The second step of the random selection was
conducted on the selected 100,000 resdential landlines to generate the 1,000
resedential landlines which represent the final sample.
As it will be further discussed in section 4.12 and presented in Table (4.3) the
response rate of this study was 22.8% which compares favourably and is in line with
the other postal surveys, as shown in Table (4.2), where it shows the response rates in
different studies conducted using postal surveys, in different fields, countries, and
some of them are being conducted in SA. Some of the presented response rates are
slightly higher than other response rates in the same table; that is due to the fact that
some of these studies were directed to the corporate sector where there are clear
addresses for the list of those participating professional companies. Cheng et al.
(2006) used this postal survey in their empirical study about the IB usage in Hong
Kong and the response rate was 19%. Similarly, Sathye (1999) employed same
approach in his empirical study of IB usage in Australia and the response rate was
59%. According to Saunders et al. (2000), an examination of recent business surveys
Page 154
138
reveals response rates as low as 15-20% for postal surveys. Bourque and Fielder
(1995) suggested that for postal questionnaires, a response rate no better than 20%
could be expected. This is in contrast to those that are directed at the public.
Table 4.2: Examples of previous studies used postal survey, with different response rates and different
countries. t 16
The selection of respondents depends on the characteristics required by the research
design (Oppenheim, 1992). To meet the research objectives, the responses should be
taken from those people who are able to provide valid responses to the questions.
People who had access to IB were selected as the target group for addressing the
objectives due to the following justifications.
1. Measurements of the research variables were based on the literature of IB
services. Thus, people who had access to IB services were the most qualified
people to provide their responses to the questionnaire.
2. Most of the research variables placed an emphasis on people who were able to
understand and provide valid responses to the questions.
4.8 Data Collection Methods
Data collection methods are an integral part of a research design. These methods have
been widely used in social research (Oppenheim, 1992). The appropriate selection of
data collection methods depends mainly on enhancing the value of the research. In
particular, the selected methods should enable the researchers to achieve the
Study Country Sample Usable
responses
Response
rate %
Sun (2007) China 668 133 19.90
Tsai and Cheng (2004) China 833 188 22.57
Ahmad and Sulaiman (2004) Malaysia 140 53 37.60
Brooksbank and Taylor (2002) New Zealand 5,963 1,313 22.00
Tsai and Cheng (2002) USA 398 105 26.38
Haniffa and Hudaib (2007) SA 350 174 49.70
Al-Barrak (2004) SA 500 145 29.00
Maghrabi (1999) SA 250 153 61.20
Al-Qahtany (1999) SA 411 99 24.00
Page 155
139
objectives of the study. Data can be collected in a variety of ways, in different settings
and from different sources (Sekaran, 2003). Qualitative methods of data collection
include methods of interviews, focus groups, and observations. Quantitative methods
include methods of telephone surveys, structured interviews, and questionnaires.
One method of data collection is to interview respondents to obtain information on the
subject of interest. Interviews can be structured or unstructured, and can be conducted
either face-to-face, by telephone or online. Each of these methods has advantages as
well as disadvantages (Hussey and Hussey, 1997). According to Oppenheim (1992),
the advantage of interviews is that they improve response rates and give a prepared
explanation of the purpose of the study. They also provide the researcher with an
opportunity to contact interviewees and motivate them to provide additional
information and reliable answers (Cooper and Schindler, 2001). The disadvantages of
interviews are that they are expensive and time consuming especially when 1,000
interviews are concerned. There is also the possibility of interviews bias. Therefore,
the choice was self-administrated questionnaires; these have the advantage of
obtaining data more efficiently in terms of time, energy, and costs (Sekaran, 2003).
Moreover, a questionnaire survey is cheaper and less time-consuming than conducting
interviews (Hussey and Hussey, 1997). Several researchers (e.g. Oppenheim, 1992;
Easterby-Smith et al., 2002; Sekaran, 2003) stress that questionnaires are the most
popular method for collecting data and can be self-administered, electronically
distributed or mailed to respondents.
A postal questionnaire was therefore considered to be the most appropriate method of
data collection as providing the large amount of cross-sectional data needed for this
study. Further, an analysis of responses from a large number of respondents, which
Page 156
140
are widely dispersed, would achieve the objectives of this research. Postal
questionnaires are a commonly used method in gathering data in social sciences
(Oppenheim, 1992). Postal questionnaire has been also used heavily in the IB studies
such as Sathye (1999), Cheng et al. (2006) and Safeena et al. (2011). One advantage
of postal questionnaires is that they are most useful especially when large numbers of
respondents are to be reached in different geographical regions (Saunders et al.,
2000). Also, respondents can take their time to respond at their convenience (Sekaran,
2003). Another main advantage of postal questionnaires is the low cost of data
collection and processing (Cooper and Schindler, 2001). Moreover, postal
questionnaires provide respondents with more confidence regarding their anonymity
(Sekaran, 2003).
Postal questionnaires, however, suffer from low response rates (Oppenheim, 1992;
Hussey and Hussey, 1997; Cooper and Schindler, 2001). Another disadvantage is that
any doubts or misleading items cannot be clarified (Sekaran, 2003). In addition, the
researcher cannot be sure that the targeted respondents have completed the
questionnaire. Finally, there is no control over the order in which the questions are
answered or any check on incomplete questions (Oppenheim, 1992).
However, using this method to collect the data of this research added a challenge to
the researcher conducting this research in SA, due to the fact that the SA postal
system is neither very efficient nor reliable. Although there has been an improvement
in the postal system in the past ten years, street addresses are still not completely in
place. As a result, people who live in cities rely on post office boxes for the delivery
of their incoming mail, whereas those who live in rural areas depend on post office
coordinators in their areas to distribute their incoming mail by hand within their
Page 157
141
assigned areas. As a result, the entire process takes much longer in SA as promptness
and punctuality are not valued as highly as they are in western environments (Yavas
and Tuncalp, 1985).
The most significant obstacle to e-commerce in SA, from the perspective of public
and private Saudi organizations, is the lack of individual house addresses to support
the mail communication (Al-Solbi & Mayhew, 2005). Before 2005, individuals had
no uniquely identifying home addresses and the post was not delivered to homes and
offices (Saudi Post, 2008). Nowadays, individual house addresses may not represent a
problem because Saudi Post approved postal delivery to homes and buildings in 2005
(Alfuraih, 2008). Today, every resident in the main cities in SA can contact Saudi
Post and register his building for the free service provided by Saudi Post. However,
while this service is still relatively new, SA is very late in providing individual
addresses. Additional problems with adopting this service might be the citizens' lack
of awareness of this service or the importance of mailboxes, their ignorance of the
direct addresses for their houses with numbers and street names, or their mistrust of
receiving their post in this way. Consequently, more efforts are needed to motivate the
citizens to own house postboxes and solve the problems that they face. Thus, the
above facts would have a negative effect on the response rate of this research. Finally,
even if the potential respondents were intending to respond, they would require
repeated reminders to motivate them to expedite their response.
4.9 Data coding and processing
This study applied a procedure for data coding and processing as suggested by
literature (e.g. Newman 2003; Saunders et al., 2003; Pallant, 2006). Applying this
procedure started before the data collection, and even before the pilot study. The code
Page 158
142
of each data category was created and entered in a codebook (see Appendix E). This
codebook consists of 52 items, which is matched with the questionnaire questions, to
capture all the collected raw data.
Removing any possible typing errors that occurred during the coding and entering of
data part of the cleaning data procedure is the next step of the data coding. As any
errors at this stage could threaten the validity of measures and the study’s results as
advanced statistical parametric tests and in particular the employed MR analyses in
this study that is sensitive to outliers (Newman 2003; Pallant, 2006). Therefore, all
coding categories of data in this study were visually doubled-checked, and an
exploratory data analysis was undertaken in SPSS involving frequencies and other
descriptive statistics, undertaken to identify the missing data; discussed further in this
chapter. It is also worth to highlight that the descriptive statistics for all constructs
participating in the analyses undertaken in this thesis are provided in (see Appendix
G). The missing data analyses was also important in singling out constructs as the
missing values became necessary to be recoded in more aggregate categories. In the
next section, dealing with the missing data is presented.
4.10 Dealing with Missing Data
Missing data is a common problem that researchers often face. Apart from non-
response data (i.e. questionnaires never completed/or returned to the researcher), there
are also item non-response missing data (in returned questionnaires). Item
nonresponse data for individual questions could be missing in whole (i.e. complete
lost item non-responses), or in part (incomplete item non-responses). Missing data are
of concern as they could undermine the methodological assumptions of the statistical
procedures involved in analysing survey data (Forza, 2002; Field, 2005). In particular,
Page 159
143
missing data endanger the reliability and validity of accurate results in terms of
reducing statistical power and generalization (De Leeuw et al., 2003; Croninger and
Douglas, 2005). This problem is also associated with other statistical analyses besides
MR (Field, 2005).
Missing data may also be due to a variety of reasons; e.g. from refusal of respondents
to provide what they consider to private or confidential information for them or their
organizations, due to unavailability or even non-existence of the requested
information. Although one cannot know with any certainty the precise reasons for
missing data, this research recognised one pattern of missing data (Missing
completely at random (MCAR)) which means that the missing values of a variable are
randomly distributed (not correlated with any other variable) across respondents. For
MCAR data there is no bias in any statistical analysis (including regressions); they
yield parameter estimates close to population values (Croninger and Douglas, 2005).
A number of ways of dealing with the problem of missing data have been identified in
the literature. A deletion of the cases or variables that have missing data is the
simplest way, but this may affect the sample size (Hair et al., 1998). Mean
substitution is one of the approaches used for solving the problem of missing data
(Hair et al., 1998). This approach replaces the missing values for a case or variable
with the mean value based on all valid responses. The third method of dealing with
missing values is proposed by Field (2005), who recommends that the researcher
ignores these values by giving them a specific code. In this research, twenty seven
cases were identified as missing data in different items, and the decision was made to
replaces these missing values with the mean values based on the valid responses on
each item.
Page 160
144
4.11 Questionnaire Construction and Pre-Testing
A questionnaire should be designed according to clear criteria in order to achieve the
objectives of the research. The choice of wording and the overall layout in building
the questionnaire are key issues. In this research, the wording, design, layout and pre-
testing were well chosen. Based on suggestions made by Oppenheim (1992),
significant attention was given to the language of the questionnaire. A number of
drafts were developed and evaluated in an iterative manner before the final version of
questionnaire was produced. As a result, two versions of the questionnaire were
generated and posted to the participants of this survey, one in English and the second
in Arabic (see Appendix B).
4.11.1 Question Types and Formats
The questionnaire should translate the research objectives into specific questions;
answers to such questions will provide the data for hypothesis testing. The key
considerations involved in formulating questions are their content, structure, format
and sequence. Therefore, questions should be chosen after substantial testing to
achieve a reliable response from the chosen sample. This type of data collection
method can be used for descriptive or explanatory research (Oppenheim, 1992).
A good questionnaire offers useful data about what the researcher is attempting to
examine. A researcher can use two types of questions for constructing a
questionnaire: the open-ended, and the fixed-response (i.e. closed-ended) types.
Open-ended questions allow participants to craft their own responses in their own
words while closed-ended questions offer a limited set of responses. According to
Sekaran (1992), the appropriateness of using either closed-ended questions or open-
ended questions depends on several considerations:
Page 161
145
The objective of the questionnaire: Closed-ended questions are appropriate when
the study’s objectives require the agreement or disagreement of participants with
an explicit point of view. When the researcher seeks to learn how the respondents
arrived at a particular point of view, an open-ended question is likely to be more
suitable.
The respondent’s level of information about the topic in question.
The extent to which the topic has been thought through by the respondent.
The ease with which respondents can communicate the content of the answer or
the extent to which respondents are motivated to communicate on the topic.
In this research, both types of question were used in building the questionnaire. Some
open questions in the form of “others (please specify)” were used. Moreover, a few
open questions were used to give respondents the opportunity to express their views
in their own words regarding specific issues and to add additional insights or
comments.
Closed-ended questions were used largely in the questionnaire survey. Sekaran (1992)
argued that closed-ended questions are mostly preferable in large surveys. They are
easy to ask and quick to answer. They reduce the variability of response, make fewer
demands on interviewer’s skills, are less costly to administer and are much easier to
analyse as their analysis is straightforward. Two types of closed-ended questions were
used in the questionnaire: category questions and scale questions. Category questions
are designed so that each respondent’s answer can fit only one category. Scale or
rating questions were also used in this questionnaire. This type of question was used
throughout the questionnaire to measure the research variables. Such scales generate
ordinal data and vary in the number of categories in scales; three to five categories are
Page 162
146
often used (David and Sutton, 2004). The most frequently used format is the Likert
style point or numerical scale where statements are provided and respondents are
asked to indicate how strongly they dis/agree (Oppenheim, 1992; Newman, 2003). In
addition to that, different modifications on word response of Likert scales can be
made, for example, good, fair, significant increase (Thomas et al., 2005, p. 207).
There is evidence that Likert scales with five and seven interval points or number of
choices are helping to increase the reliability of the questionnaire (Nunnaly, 1978;
Thomas et al., 2005, p. 207). However, the number of choices should be no more than
nine; after this point the choices are not meaningful and confuse respondents
(Newman, 2003, p. 197). For instance, Nunnaly (1978, p. 521) stated that “as the
number of scale steps is increased from 2 up through 20, the increase in reliability is
very rapid at first. It tends to level off at about 7, and after about 11 steps, there is
little gain in reliability from increasing the number of steps”. In this study, a five-
point Likert scale was used throughout the questionnaire where the respondents were
asked to indicate the degree of agreement or disagreement with each statement
included in the questionnaire, and in another section of the questionnaire, customers
were also asked to indicate if they consider other items obstical or not when using IB,
by rating 5 items from "major obstacle" to "No obstacle".
The questionnaire of this study was initially developed in English and then translated
in the Arabic language for use in SA. In order to enhance reliability and validity
within the targeted population, the researcher ensured that every question and
statement included in the questionnaire was translated effectively into both languages.
This study has employed the back translation technique, as suggested by Newman
Page 163
147
(2003), to promote lexicon or functional equivalence of the items (questions and
statements) included in the questionnaire.
4.11.2 Questionnaire Pre-Testing and Pilot Work
Pre-testing and piloting a survey questionnaire is an important step in research and
has practical benefits (Sekaran, 1992). It removes inconsistencies in the questionnaire
and can resolve doubts about its content, structure, and design. The main idea is to
make sure that the questionnaire is unambiguously understood by the respondents and
that it gathers the full range of the sought data. The first stage in piloting the
questionnaire involved handing the questionnaire to five colleagues undertaking PhDs
in marketing within different universities in the UK. They provided many useful
suggestions in terms of design, sequence, question content, question wording, clarity
and the ability to understand its contents. Attention was given to their suggestions.
In the second stage of pre-testing, the questionnaire was distributed to five professors
in different Universities in SA. All of them held a PhD in marketing from British or
American universities. Each of them received two versions of the questionnaire, one
in English and the second in Arabic. They were asked to check the translation from
English into Arabic and to provide their feedback about the questionnaire in terms of
design, wording, content, and measurement. Useful comments were received from
them which resulted in amendments being made to the wording and scale of the
questions. These suggestions were taken into consideration when generating a new
draft, which was seen and checked again by three of the Saudi professors who had
tested the questionnaire prior to the amendments being made. Furthermore, feedback
from the researcher’s supervisor was also taken into account. In the final stage of pre-
testing, the questionnaire was delivered to 100 individuals selected randomly from the
Page 164
148
sample. The respondents were asked to complete the questionnaire and provide any
comments and suggestions about its contents and wording to decide if it was well
written; 21 questionnaires were completed and returned to the researcher. This reflects
a response rate of 21% of the total sample in the pilot study. After a review of these
comments, some changes were considered in the final version of the questionnaire
and, therefore, some questions were modified accordingly. The changes are as follow:
1. In question B4, the first category was less than 50,000 and the second category
was 51,000-100000. This question was modified to be the first category as equal
or less than 50,000 and the second category as 50,001-100000.
2. In questions B10, B11, B13, and B14, “Never” was one of the provided choices.
Given that all participants should have used the internet and IB at least once, this
choice was deleted and the other choices have been modified accordingly.
3. In questions B12 and B16, “I do not know” was one of the provided choices.
Given that all participants should have used the internet and IB at least one time or
more, this choice was deleted.
4. In question B16, “Check my share’s portfolio account” was added to the choices,
because it is one of the most popular IB activities in SA.
Consequently, the final questionnaire was made after taking into account the
suggestions of the pre-testing stages conducted in the pilot work.
4.11.3 The Covering Letter
A well-designed covering letter is needed to accompany the questionnaire. Most
marketing and business surveys include covering letters to explain the main purpose
of the research. These letters can enhance the response rate (Sekaran, 1992). In this
Page 165
149
research, the covering letter attached with the final copy of the questionnaire (see
Appendix B) was well-designed to ensure that the respondents understood the
objectives of the study. A covering letter should succeed in overcoming any resistance
or prejudice the participant may have against the questionnaire. It should (1) identify
the person(s) or organisation(s) conducting the survey, (2) clarify the purpose of
research, (3) explain the significance of the survey and (4) assure the respondents that
the data provided will be treated in strict confidence (Frankfort-Nachmias and
Nachmias, 1996).
The letter to go with the questionnaire for this research was printed on a single page.
The first paragraph of the letter explained the objective of the research. The second
paragraph illustrated the significance of the research to respondents, banks and the
researcher. The third paragraph confirmed to the respondents that all the information
would be used only for research scientific purposes and would be treated as strictly
confidential. In addition, the respondents were asked to pass the questionnaire to the
appropriate person if they had been incorrectly identified. Also, respondents were
asked to put the questionnaire in the enclosed envelope after filling in it. Moreover,
the respondents were informed they could have a copy of the research results if they
so wished. The last paragraph presented the researcher and his supervisor information.
This research recognises the necessity to protect the confidentiality and anonymity of
participants, who were informed about the nature and purpose of this research in the
cover letter of the questionnaire. In addition to that, and since this study intended to
collect data from individuals (IB users in SA) this research was conducted in line with
the Hull University Business School (HUBS) code of ethics. The primary data
collection method was approved by HUBS Ethics committee prior to the
Page 166
150
commencement of this study survey, the approval for conducting the survey was
received subsequently (see Appendix G). Prior to that, the aaceptance of accessing the
research data and conducting the field study has been received from the Al-Wahda
Express the official publisher of the Saudi telephone directory (see Appendix K).
4.11.4 Content of the Questionnaire
Based on the feedback and suggestions received from the pilot study, the final draft of
the questionnaire was designed. All variables, included in the research model, were
addressed in the questionnaire together with variables relating to the descriptive
objectives. Thus, the questionnaire covered all the research objectives. There were
two main sections of the questionnaire; The first section is concerned with examining
factors influencing the use of IB. It basically covers the first objective of this research.
In this section, the variables that determine the adoption, usage and success of IB are
considered, such as the satisfaction (Q: A1-A9), perceived usefulness (Q: A10-A15),
perceived ease of use (Q: A16-A21), security (Q: A22-A26), awareness (Q: A27-
A28), self-efficiency (Q: A29-A31), availability of the infrastructure (Q: A2B1-
A2B2), resistance to change (Q: A2B3), cost (Q: A2B4), and the availability of IsB
(Q: A2B5) to support the research objective in examining the extent aforementioned
variables on the respondents adoption, use and success in the IB services.
The second section was designed to achieve two purposes. One was to examine the
relationships of some socio-economic variables, including income, age and
educational level, with the adoption, use and success of IB services. These three
variables were considered in the research model under the relationship between socio-
economic motives and IB services. Therefore, these questions will support the other
objective of this study in identifying the demographical characteristics of the IB
Page 167
151
adopters, users and successful ones. This section of the questionnaire includes sixteen
questions to achieve the aforementioned purposes. The final page of the questionnaire
deals with several aspects, such as information about the respondent’s residential
category, name, address, telephone number and e-mail address. It also informs the
respondent that the questions have ended. However, it asks the respondent that if they
would like to obtain a copy of the final findings of this research once completed, to
write their address in the space provided.
4.12 Administrating the Questionnaire and Response Profile
The main survey was posted to 1000 participants in December 2009. Each participant
was sent a covering letter, a copy of the two versions of the questionnaire (Arabic and
English) and a prepaid envelope. The number of usable completed questionnaires
after the first posting was 60, with 2 unusable. After about six weeks, a reminder letter
was sent to the respondents which included information about the importance of the
questionnaire (see Appendix C).
This resulted in 78 usable completed questionnaire and 4 were returned uncompleted
with specific reasons for non-completion. To enhance the response rate, on 15 Feb
2010, a second reminder was sent out to respondents (see Appendix D) asking them to
complete the questionnaire. As a result, another 93 responses were received including
90 usable questionnaires and 3 unusable questionnaires. Consequently, there were 228
usable responses representing a 22.8% response rate. The response profile of the
survey is shown in Table 4.3 According to Saunders et al. (2000), examination of
recent business surveys reveals response rates as low as 15-20 % for postal surveys.
Page 168
152
Response profile Main survey 1
st follow-up
(after 6 weeks)
2nd
follow-up
(after 10 weeks) Total
Usable questionnaires 60 78 90 228
Unreachable 0 0 0 0
Unusable questionnaires 2 4 3 9
Incomplete questionnaires 0 0 0 0
Total 62 82 93 237
Total response rate 23.7%
Usable response rate 22.8%
Table 4.3: Survey response profile.t 17
The following efforts were made to increase the response rate:
1. A covering letter accompanied the questionnaire which explained the research
objectives and assured the respondent that their co-operation was the main
contribution to the success of this study.
2. Encouragement was given to the respondents to answer the questionnaire.
3. The layout of the questionnaire was well designed.
4. The respondents were given the option to receive a copy of the research
findings once the study had been completed.
4.13 Reliability and validity
Reliability and validity are the essential criteria for assessing the accuracy and
precision of the quantitative aspects of this research. They are also essential criteria
for measuring the research quality and especially the procedures used to measure the
constructs of interest. Validity is concerned with the extent to which an instrument
measures the right construct (i.e. the degree that reflects on real differences) among
the respondents, whereas reliability is concerned with consistency and accuracy in the
procedure used to measure constructs; whereas (Oppenheim, 1992; Saunders et al.,
2003). In other words they are the research equivalents of observational
(measurement) efficiency (reliability) and effectiveness (validity).
Page 169
153
However, the errors measurement should be kept at the lowest possible level as these
can influence data analysis and consequently the findings; which in turn could lead to
incorrect inferences and misleading conclusions. Due to the fact that perfect reliability
(Oppenheim, 1992) and validity (Kerlinger, 1992) are not possible to be achieved in
empirical research, and measurement errors are almost inevitable, the extent to which
these errors affect the findings is a function of what particular efforts and what checks
or remedies have been made by the researcher to minimize the potential bias.
4.13.1 Reliability
As mentioned earlier, the reliability of a measure indicates the extent to which it is
without bias (error free) and, hence, ensures consistent measurement across time and
across the various items in the instrument (Punch, 2005). Reliability of a measure is
an indication of the consistency of the instrument. According to Churchill (1979, p.
68) the main statistical indicator of the internal consistency method is the Cronbach’s
coefficient alpha. Therefore, Cronbach’s alpha measurement of internal consistency
was adopted, in this study, to assess the overall reliability of the measurement scale,
where alpha gives an estimate of the proportion of the total variance that is not due to
error (see Appendix H); this represents the reliability of the scale (Oppenheim, 1992).
The recommended minimum acceptable level of reliability “alpha” is 0.60 using the
Hair et al. (1998) criterion, and greater than .50 using the Nunnally (1978) criterion.
The results of Cronbach’s alpha have passed the minimum level requirements, as
reported in Table 4.4. The reliability of the developed scale comprising the provision
of 10 particular initiatives is summarised in Table 4.4. The reported final CRA = 0.80
is acceptable, reliable, and above the minimum or permissible CRA values.
Page 170
154
SN Scale No of items Cronbach’s Alpha
1 Satisfactions 9 0.780
2 Perceived Usefulness 6 0.810
3 Perceived Ease of Use 6 0.755
4 Security 5 0.840
5 Awareness 2 0.790
6 Self-Efficiency 3 0.870
7 Availability of Infrastructure 2 0.780
8 Resistance to change 1 0.796
9 High Cost 1 0.725
10 Availability of IsB 1 0.852
Total 36 0.800
Table 4.4: Cronbach’s alpha values for the research independent variables. t 18
The reliability assessments relating to non-response bias has been also conducted in
this study, as the mail survey has been criticized for non-response bias (Hendricks,
1949; Daniel, 1975). If persons who respond differ substantially from those who do
not, the results do not directly allow one to say how the entire sample would have
responded certainly an important step before the sample is generalized to the
population (Armstrong and Overton, 1977). Non-response bias is another challenge
when conducting a postal survey. In testing the bias that may be associated with non-
responses, a non-response bias survey was conducted. To ensure that sample bias and
nonresponse bias were not present, appropriate comparisons were made between early
and late respondents (Armstrong and Overton, 1977). Early and late respondents were
compared on demographical variables, using traditional t-tests, as shown in Table 4.8,
following Armstrong and Overton’s (1977) recommendations. Unpaired t-tests were
used to compare the group means to each other. Table (4.5) indicate that the
differences between the means were not statistically significant at the 0.05 level,
indicating that there were no differences between the group means of the
demographical variables of early and late respondents. On the basis of the above, it
Page 171
155
should be safe to conclude that non-response bias should not be considered as a
serious threat in this study and its results.
Group Group P.value
Group-1 Group-3
N 60 90
Age 3.4517 3.4398 .665
Income 3.2467 3.2599 .979
Education level 3.1867 2.9333 .078
Occupation 2.2000 2.3556 .488
Table 4.5: T-Test two mean comparison between early and late respondents.t 19
4.13.2 Validity
Validity can be divided into external validity and internal validity (Creswell, 2003).
External validity is the researcher’s ability to draw correct inferences from the sample
regarding other persons, other settings and past or future situations (Creswell, 2003),
i.e. the data’s ability to be generalised to other persons, settings and times. Adopting a
representative sample is a basic consideration for achieving external validity. It is
difficult to generalise the findings unless the drawn sample is representative of the
population which has been concluded earlier, in section 4.7, that survey’s usable
responses can be generalised across the target population. In addition to that, the
response rate was 23.7%, which is a good indication that the sample was
representative of the population. As mentioned earlier; mail questionnaire do not get
high response rates. Denscombe (1998) indicated that it was not uncommon to get a
response rate as low as 15% for postal surveys and Alreck and Settle (1985)
confirmed that ‘‘[mail] surveys with response rates over 30 percent are rare. Response
rates are often only 5 or 10 percent’’ (p. 45).
Internal validity is the researcher’s ability to draw sound inferences from the data in
an experiment (Creswell, 2003). Internal validity comprises two main aspects; content
Page 172
156
and construct validity. Content validity ensures that the measurement scale includes
an adequate and representative set of items that represent the concept (Punch, 2005).
Content validity can be determined by a careful definition of the research topic and
the items included in the measurement scale (Punch, 2005). The methods used in
assessment are judgemental or panel evaluations. To ensure content validity, an
extensive literature review was undertaken to define and clarify the scales and
measures used in this research. As a result, this study has adopted several steps to
ensure and establish content (and face) validity and consequently construct validity.
These steps include an extensive and comprehensive review of the literature which
helped in developing the conceptual model and research key questions.
As mentioned earlier, most of the items and scales used in this research were adopted
from previous empirical studies, as explained in sction 4.13.2.2, which placed an
emphasis on meeting the requirements of validity and reliability, by either using
previous studies with established validity and reliability of their instruments or pre-
testing and pilot work has been conducted for their researches measurements. In
addition to that, the questionnaire items were scrutinised and pre-tested by several
doctoral students and a panel of academic experts to judge the content validity of the
questionnaire after conducting a comprehensive presentation sessions about the
researches objectives, hypothesis, conceptual model, variables and questionnaire. In
addition to that, the questionnaire was initialy developed in English, it was translated
to Arabic and then translated back to English to enhance the content validity of the
questionnaire.
Construct validity testifies how well the results obtained from the use of the measure
fit the theories around which the test is designed (Punch, 2005). The researcher used
Page 173
157
the Pearson correlation coefficients between the items and the total of the scales used
in the study, in order to identify problem that should be excluded from the scale. As
introduced in appendix (H) correlation analysis was undertaken to assess the validity
of the construct. The Pearson correlation results revealed statistically significant at
level 0.01, and indicated a high degree of internal correlation between all items on the
scale. Moreover, the discriminant validity has been also conducted to assess how each
construct discriminate from other constructs (Chin, 1998), the result was satisfactory
as illustrated in the next section (4.13.2.1). Thus, the internal validity of the constructs
and scales, used in this study, has been confirmed.
4.13.2.1 Constructs Discriminant Validity
Discriminant validity is the extent to which latent variable A discriminates from other
latent variables. Discriminant validity means that a latent variable is able to account
for more variance in the observed variables associated with it than a) measurement
error or similar external, unmeasured influences; or b) other constructs within the
conceptual framework. If this is not the case, then the validity of the individual
indicators and of the construct is questionable (Fornell and Larcker, 1981). The
following discriminant validity test methods are presented and discussed in the next
paragraphs.
Paired Constructs Test
MultiTrait-Multimethod Matrix (MTMM)
Average Variance Extracted (AVE) versus Shared Variance Test
Anderson and Gerbing (1988) suggest that the parameter estimate for two factors be
constrained to 1.0 (constrained model) and compared to a model where this parameter
is freely estimated (unconstrained model). This test is then run for every possible
Page 174
158
pairing of constructs in a study. If the unconstrained model, with the drop of one
degree of freedom, returns a chi-square value that is at least 3.84 lower than the
constrained model, then a two factor solution provides a better fit to the data, and
discriminant validity between the two factors is supported. The MTMM is another
method uses more than one measure of constructs (i.e., multitrait) and more than one
method to measure them (i.e., multimethod) in order to assess both convergent and
discriminant validity (Bollen, 1989). By collecting data on constructs using at least
two separate traits and methods, it is easier to identify discriminant validity problems.
The major drawbacks of this method for researchers are that it is cumbersome,
requires more data collection, and suffer from interpretation issues (Bollen, 1989).
Fornell and Larcker (1981) also present a method for assessing the discriminant
validity of two or more factors. Here, a researcher compares the AVE of each
construct with the shared variance between constructs. If the AVE for each construct
is greater than its shared variance with any other construct, discriminant validity is
supported. Bove et al. (2009) noted that “discriminant validity is assessed by
comparing the shared variance (squared correlation) between each pair of constructs
against the average of the AVEs for these constructs.”
In this research Fornell and Larcker (1981) method was utilized, and all constructs
illustrated satisfactory discriminate validity, as the AVE from the constructs should be
greater than the variance shared (squared correlation) between a particular construct
and other constructs in the model (Chin, 1998). Table (4.6) illustrates the discriminant
validity of constructs, with squared correlation among constructs (above diagonal)
and the AVE (on the diagonal). This indicates that all AVE for each construct are
Page 175
159
greater than its shared variance with any other construct, therefore discriminant
validity is supported in this research.
Discriminant Validity of Constructs
Constructs 1 2 3 4 5 6 7 8 9 10
1. Satisfactions .764 .361 .355 .176 .321 .147 .068 .106 .073 .070
2. Perceived Usefulness .601 .585 .381 .194 .297 .227 .032 .094 .066 .061
3. Perceived Ease .596 .617 .734 .206 .353 .288 .031 .099 .048 .063
4. Security .420 .441 .454 .649 .198 .186 .026 .099 .067 .064
5. Awareness .567 .545 .594 .445 .552 .211 .040 .122 .059 .078
6. Self-Efficiency .383 .476 .537 .431 .459 .549 .073 .159 .100 .064
7. Availability of Infrast .260 .179 .177 .161 .200 .271 .819 .125 .111 .148
8. Resistance to Change .325 .307 .302 .314 .349 .399 .354 .621 .176 .108
9. Cost .271 .256 .219 .258 .243 .316 .333 .420 .712 .200
10. Availability of IsB .265 .247 .251 .253 .280 .253 .385 .328 .447 .632
Table 4.6: Constructs Discriminant Validity t 20
Note 1: On diagonal elements (inbold) are the Average Variances Extracted (AVE). The Off diagonal elements
are the correlations among constructs and squared correlations are above the diagonal. For
discriminant validity, diagonal elements should be larger than the above the diagonal elements.
4.13.2.2 Construct Operationalisation and Measurement
As discussed in Chapter 2, research hypothesis development, and part of developing
the questionnaire and the respective scales, measurements, and operationalisation, this
research utilised the following previous studies.
1. Satisfaction construct operationalisation has been adopted from Polatoglu and
Ekin (2001), as they used a five point Likert scale. In this study, respondents
were asked to rate their satisfaction on nine items (A1-A9) on a 5 Likert scale
ranging from (with 1 = strongly disagree, 2 = disagree, 3=neutral, 4=agree, and
5 = strongly agree).
2. Perceived usefulness, perceived ease of use, security, and awareness of the IB
services constructs operationalisations have been adopted from Pikkarainen et
al. (2004), as they used a five point Likert scale. In this study, respondents
were asked to rate these constructs on 19 items (A10-A28) on a 5 Likert scale
ranging from (with 1 = strongly disagree, 2 = disagree, 3=neutral, 4=agree, and
5 = strongly agree).
Page 176
160
3. Self-efficiency construct operationalisation has been adopted from Wang et al.
(2003), as they used 7 Likert scale. In this study, a 5 Likert scale has been
utilized from "strongly disagree" to "strongly agree". The adapted scale were
modified to suite the IB context.
4. Availability of infrastructure, resistance to change, and cost constructs
operationalisations have been adopted from Sathye (1999). A 5 Likert scale
rating 5 items from "major obstacle" to "No obstacle" has been adopted in this
study.
5. Demographic constructs operationalisations have been adopted from Almogbil
(2005).
The items selected for the above constructs were mainly adapted from prior studies to
ensure reliability and content validity. The previous studies had established validity
and reliability of their instruments, and some of the adapted scales were modified, as
explained above, to fit the IB context, using a five-point Likert scale for each item.
Straub et al. (2004) argued that if the adapted measures need to be modified, then it is
important to apply appropriate reliability and validity measures before undertaking
final data collection. In the next sections, a detailed explanation of the reliability and
validity measures which have been undertaken in this research were presented.
4.13.2.3 Common Method Variance (CMV)1
Several studies report that CMV is a potential problem in behavioural research (e.g.
Nunnally, 1978; Podsakoff et al., 2003). CMV is a problem because they are one of
the main sources of measurement error. Measurement error threatens the validity of
1 Method variance refers to variance that is attributable to the measurement method rather than to the
construct of interest. The term method refers to the form of measurement at different levels of
abstraction, such as the content of specific items, scale type, response format, and the general
context (Fiske, 1982, pp. 81–84). At a more abstract level, method effects might be interpreted in
terms of response biases such as halo effects, social desirability, acquiescence, leniency effects, or
yea- and nay-saying. (Fiske, 1982, p. 426)
Page 177
161
the conclusions about the relationships between measures and is widely recognized to
have both a random and a systematic component (Nunnally, 1978; Bagozzi & Yi,
1991). There are several causes of measurement error that have been discussed in the
literature. Out of these causes, error due to non-response bias (discussed earlier), a
badly designed questionnaire, respondent bias and processing error are found to be
most common. The remaining causes of CMV and how they are addressed in the
current survey are discussed in the next subsections.
I. Potential Sources of CMV
Because CMV can have potentially serious effects on research findings, it is
important to understand their sources and when they are especially likely to be a
problem. Therefore, some of the most likely causes of method bias and the research
settings in which they are likely to pose particular problems will be identified in this
section. Common method biases arise from having a common source, a common
measurement context, a common item context, or from the characteristics of the items
themselves. Some methods effects result from the fact that the respondent providing
the measure of the predictor and criterion variable is the same person. This type of
self-report bias may be said to result from any artifactual covariance between the
predictor and criterion variable produced by the fact that the respondent providing the
measure of these variables is the same. There is a substantial amount of theory
(Osgood & Tannenbaum, 1955; Heider, 1958) and research (McGuire, 1966)
suggesting that people try to maintain consistency between their cognitions and
attitudes. Thus, it is likely to be particularly problematic in those situations in which
respondents are asked to provide retrospective accounts of their attitudes, perceptions,
and/or behaviors.
Page 178
162
Item characteristics might be also a source of CMV. It is also possible for the manner
in which items are presented to respondents to produce artifactual covariance in the
observed relationships. Cronbach (1946, 1950) was probably one of the first to report
the possibility that, in addition to its content, an item's form may also influence the
scores obtained on a measure. Some researchers are encouraged to develop items that
are as clear, concise, and specific as possible to measure the constructs they are
interested in (Spector, 1992; Peterson, 2000), but it is not uncommon for some items
to be fairly complex or ambiguous. Thus, the level of item ambiguity and complexity
may also influence the relationships obtained between the variables of interest in a
study and they might be a source of method bias. Another potential source of common
method bias is scale format and anchors. It is not uncommon for researchers to
measure different constructs with similar scale formats using similar scale anchors or
values. Also, some researchers have attempted to reduce the potential effects of
response pattern biases by incorporating negatively worded or reverse-coded items on
their questionnaires (Idaszak & Drasgow, 1987; Hinkin, 1995). Thus, negatively
worded items may be a source of method bias.
CMV may result from the context in which the items on a questionnaire are placed.
Wainer and Keily (1987) have suggested that item context effects “refer to any
influence or interpretation that a subject might ascribe to an item solely because of its
relation to the other items making up an instrument” (p. 187). Salancik (1984) noted
that asking questions about particular features of the work environment may make
other work aspects more salient to respondents than these work aspects would have
been if the questions had not been asked in the first place. Thus, it is possible for such
effects to produce artifactual covariation among variables under some conditions.
Page 179
163
Length of the scale is another potential source of method bias as noted in Harrison et
al. (1996) study that scales which contain fewer items increase respondents'
accessibility to answers to previous scales, thereby increasing the likelihood that these
previous responses influence answers to current scales. Furthermore, Kline et al.
(2000) recommended not intermixing items from different constructs on the same
questionnaire; in order to reduce CMV. This would appear to suggest that intermixing
items on a questionnaire would produce artifactual covariation among the constructs.
II. Remedies and Mitigations to Minimize the CMV
The CMV can be controlled through procedural remedies and one of them is to
identify what the measures of the predictor and criterion variables have in common
and eliminate or minimize it through the design of the study. In this research, attention
has been paid to the wording of questions during questionnaire development and after
the pre-testing phase as explained in the earlier sections. Additionally, Porter (2004)
claimed that survey response rate increases and Reio (2010) claimed that CMV
minimises when the draft of surveys request respondents for assistance or if they need
assistance. For example by including the phrase “it would really help us out”, a study
reported an 18% increase in survey response rate (Porter, 2004). Consequently, in this
study the statement: “If you face any difficulty or have any questions please contact
me on the address below.” was included in the covering letter of the survey (see
Appendix B). Moreover, and in order to minimize the CMV in this research; some of
the variables measures have been obtained from different sources. The advantage of
this procedure is that it makes it impossible for the mind-set of the source to bias the
observed relationship between the predictor and criterion variable.
Another way of minimizing the CMV is to separate the measurement of the predictor
and criterion variables, which can be accomplished in several ways. Create a temporal
Page 180
164
separation by introducing a time lag between the measurement of the predictor and
criterion variables. Another way is to create a psychological separation by using a
cover story to make it appear that the measurement of the predictor variable is not
connected with or related to the measurement of the criterion variable. Another more
technique is to proximally or methodologically separate the measures by having
respondents complete the measurement of the predictor variable under conditions or
circumstances that are different from the ones under which they complete the
measurement of the criterion variable.
There are several additional procedures that can be used to reduce method biases,
especially at the response editing or reporting stage. Allow the respondents' answers
to be anonymous, assure to the respondents that there are no right or wrong answers
and they should answer questions as honestly as possible. In this research, more
attention was placed on protecting respondents’ privacy, answers confidentiality,
integrity and interest while designing the instruments as highlighted in the covering
letter of the survey (see Appendix B). These procedures should reduce people's
evaluation apprehension and make them less likely to edit their responses to be more
socially desirable, lenient, acquiescent, and consistent with how they think the
researcher wants them to respond. Obviously, the primary disadvantage of response
anonymity is that it cannot easily be used in conjunction with the two previously
described procedural remedies. That is, if the researcher separates the source or the
measurement context of the predictor and criterion variables, he or she must have
some method of linking the data together. This compromises anonymity, unless a
linking variable that is not related to the respondent's identity is used.
As suggested by Reio (2010), this study also placed more emphasis on editing
techniques and quality assurance practices at data grooming (preliminary checking
Page 181
165
before entering), data capture, editing and at estimation stages in order to ensure that
there was no data loss, no duplication and no inaccurate weights in the estimation
procedure. Several processes such as checks for duplicate responses, logic edits and
range edits (valid range were entered) were carried out to minimise the error.
Although, the above remedies have been considered in this research, to control the
presence of CMV, it is accepted that this thesis contains a number of measures, which
might lead to CMV; it is therefore considered as alimitation in this study (see Ch. 7).
Harman’s single-factor test was also performed, in section 4.16.3, and result indicates
the absence of CMV.
4.13.2.4 Reflective and Formative measures
In the field of marketing, Churchill (1979), Bagozzi (1980), Peter (1981), and
Anderson and Gerbing (1982), paid attention to construct validity and associated
measurement issues. Peter (1981, p. 133), expressed and noted that “a basic goal of
social science is to provide theoretical explanations of behavior. Therefore, this goal,
in marketing research, includes attempts to explain the behavior of customers, sellers,
and others participants in the related activities. Because construct validity pertains to
the degree of correspondence between constructs and their measures, construct
validity is a necessary condition for theory development and testing. As a result, it is
not clear that marketing researchers have provided little explicit attention to construct
validation”. Therefore, the methodological approaches of marketing studies have been
improved, as the existing measure development guidelines (e.g. Devellis, 1991;
Spector, 1992) focus on scale development, whereby items (e. g. observed variables)
composing a scale are perceived as reflective (effect) indicators of a causal construct
(i.e. latent variable). This view reflects the conventional understanding on
Page 182
166
measurement (see Bollen and Lennox, 1991), is largely based on classical test theory
and, in particular, the domain sampling model (Nunnally and Bernstein, 1994).
Another alternative measurement perspective is the use of formative (cause, causal)
indicators as it involves the creation of an index rather than a scale (Bollen and
Lennox, 1991). As a result, formative indicators “are observed variables that are
assumed to cause a latent variable. For effect indicators the latent variable causes the
observed variables. Most studies in the social sciences assume that indicators are
effect indicators, as cause indicators are neglected despite their appropriateness in
many instances” (Bollen, 1989, p. 65). This is the case in marketing research, as all
measures available are based-implicitly or explicitly- on reflective indicators
(Bearden et al., 1993; Bruner and Hensel (1992, 1996)). The following table (4.7)
shows and distinguishes between the nature of reflective and formative constructs.
Reflective Formative References
1 Effect indicator (Effect
indicators are the more typical
type of indicators that depend on
the latent variable)
Causal indicator (Cause indicators
are ones in which the indicator
affects the latent variable)
Bollen (2007),
Howell et al. (2007)
2 Indicators are manifestations of
the construct
Indicators are defining
characteristics of the construct Jarvis et al. (2003)
3 Instructions forward oriented
(judgment based on hypothetical
actions)
Instructions backward oriented
(judgment based on actual actions) Wilcox et al. (2008)
4 Latent construct exists
independent of the measures
used
Latent constructs is a
combination of its indicators
Borsboom et al.
(2003, 2004),
Coltman et al.
(2008)
5 A process of deductive reasoning A process of inductive reasoning
Baumann et al.
(2010)
Table 4.7: Natures of reflective and formative constructs. t 21
Source: Baumann et al. (2010).
In generally and as highlighted by Baumann et al. (2010); the reflective measurement
has been applied in causal models, as the case of this researchs’ models, as the
observed variables are chosen and measured as they are assumed to be reflective of
Page 183
167
the prior theoretical latent construct (a process of deductive reasoning). However,
formative measurements, in which the meaning of latent constructs is incidental from
the configuration of the observed variables (a process of inductive reasoning).
Additionally Bollen and Lennox (1991) distinguished between the two types of
measurement models that assume a direction of causality from the measures to the
latent construct. One is a principal component model, in which the construct is a
perfect linear combination of its measures, and the other called a composite latent
construct model, which posited that the construct is a linear combination of its
measures, plus error. Bollen and Lennox (1991) draw the attention to the fact that the
used methods for assessing the reliability and validity of a construct are not
appropriate where the direction of causality is posited to flow from the measures to
the constructs. This was investigated by Diamantopoulos and Winklhofer (2001), who
recommended improving the procedures for developing measures and evaluating
these types of constructs.
Considering all these studies were referring to the fact that some potentially serious
consequences of measurement model misspecification exist, and therefore researchers
need to evaluate cautiously the direction of causality between constructs and their
measures. However, it is not recognized how often this type of measurement model
misspecification occurs in the marketing research or about the specific criteria that
should be used to differentiate between formative and reflective indicator constructs.
Although Diamantopoulos and Winklhofer (2001) referred to the fact that they do not
attempt to develop a comprehensive set of criteria that can be used to decide how a
construct should be modeled, nor to determine how prevalent measurement model
misspecification is in the field of marketing. Instead, their objective was to establish
Page 184
168
guidelines for constructing indices based on formative indicators in much the same
way that Churchill (1979) did for reflective indicator constructs.
In this research, all the measures are reflective apart from the satisfaction’s construct
measures which are formative. As the IB’s usage and customer satisfaction are closely
interrelated. Use must precede the user satisfaction in a process sense, but a positive
experience with use will lead to greater user satisfaction in a causal sense. Similarly,
increased user satisfaction will lead to increased IB adoption and use. The IB’s
customers use the system to make buying or selling decisions and to execute online
banking transactions. These IB decisions and transactions will then affect individual
users. The IB’s customers’ satisfaction of using and experience the IB’s services are
extremely important, but they cannot be analysed and understood without the
customers’ satisfaction measurements. For example, within the IB environment, the
relationships of the IB with customer purchases cannot be fully understood without an
evaluation of the usability of the IB’s services and the relevance regarding the using
decisions of the information that is provided to the IB’s customers, such as save the
customer’s time, service cost, reliability, and availability from anywhere and anytime.
As customers once start adopting IB services, they need to be satisfied and then
encouraged by banks to re-use the IB service and then they need to be convinced of
the benefits of banking through the internet to enjoy the success of their usage of this
service.
The 1st part of the questionnaire consisted of questions measuring the satisfaction
level of the customers regarding the IB services, which have been adopted from
Polatoglu and Ekin (2001). Respondents were asked to rate their satisfaction on 9
statements on a Likert scale ranging from 1 = Strongly Disagree to 5 = Strongly
Page 185
169
Agree, including two criterion statements measuring overall satisfaction. This
research treated all variables as reflective constructs considering the following:
The minimum potential impact of the formative measures as only one
construct (viz. satisfaction), out of ten used by the models tested in this
research is quasi-formative. In particular only two measures out of the nine-
item scale used for satisfaction were formative.
The researche constructs have been adopted from reliable and validated
studies (Sathye, 1999; Polatoglu and Ekin, 2001; Wang et al., 2003;
Pikkarainen et al., 2004) that used very similar constructs and measures.
All the reviewed formative literature were found impacting the complex
models such as the multiphase model more than the single phase models such
as the provided models in this study (Diamantopoulos et al., 2008; Baumann et
al., 2011) .
Therefore, although this is accepted as a limitation of this study and thus discussed as
an area of further research (in Ch. 7), it could be argued that the risk this poses to
reliability and validity is not higher than the respective studies reported in the
literature.
4.14 Validity of statistical methods of data analysis
In this section, the main issues concerning the validity of the statistical analysis
undertaken in this study and the procedures used to address them are discussed. As
metioned earlier in this chapter, the decision was made to adopt the positivistic
paradigm based on the nature of this research to meet the objectives of the research
and test its model in the light of the positivistic paradigm, a number of statistical
methods were utilised in analysing the data. Given below are the justifications and
rationale for using the statistical techniques in analysing the data of this study.
Page 186
170
4.14.1 Descriptive statistics: frequencies and means
Descriptive statistics can be defined as those methods involving the collection,
presentation, and characterisation of a set of data in order to describe properly the
various features of that set of data (Berenson and Levine, 1999). Descriptive statistics
using frequencies and means were utilised to achieve the explorative objectives of this
research, to determine the sample characteristic, and to develop the main feeling about
the data distribution, but more specifically, to analyse, the outputs of the descriptive
statistics analysis for each variable included in the research model. The descending
means were used to rank a set of the research variables according to the relative
importance of each variable in the hypothesised relationship in a given sub model.
Descriptive statistics provided this researcher with indications about the distributions
of the population and the sample. They also helped inform the selection of suitable
inferential statistical techniques that were used in the testing of the model and the
hypotheses. Similar descriptive statistics have been used extensively by previous
studies in this area of research (see, for example Cheng et al., 2006; Gonzalez &
Chiagouris, 2006; Kassim and Ahmed, 2006 among others).
4.14.2 Descriptive analysis of research variables
This section describes the variables of study. Table 4.8 presents the descriptive
statistics for the research independent variables relating to the research hypotheses.
Table 4.8 includes the mean and standard deviation, as the mean is a hypothetical
value, and the standard deviation is a measure of how well the mean represents the
data (Field, 2005). Small standard deviations indicate that the data points are close to
the mean; large standard deviations indicate that the data points are distant from the
Page 187
171
mean (Field, 2005). In this context, Table 4.8 shows that all the standard deviations
indicate that the means are an accurate representation of the data.
Research variables (Q #) Mean Std.
Dev Min Max Skewness Kurtosis
Resistance to change A2B3 2.951 1.117 1.00 5.00 -.715 -.703
Awareness A27 - A28 3.741 0.857 1.00 5.00 -.915 .771
Self-efficiency A29 - A31 3.559 .8152 1.00 5.00 -.646 1.297
Avail. of infrastructure A2B1-A2B2 3.611 .9396 1.00 5.00 -.985 .762
Security A22 to A26 2.890 1.0241 1.00 5.00 -.612 -.671
Cost A2B4 3.771 .9007 1.00 5.00 -.212 1.112
Satisfaction (Convenience) A7, A5, A4 3.387 .7412 1.00 5.00 .548 .359
Satisfaction (Time saving) A6, A3, A1 3.529 .9852 1.00 5.00 .652 -.487
Satisfaction (Fulfilment) A9, A2, A8 3.241 .6584 1.00 5.00 .741 1.846
Perc. ease of use (Easiness) A16, A17, A20, A21
3.334 1.021 1.00 5.00 .398 .745
Perc. ease of use (Interaction) A18 - A19 3.568 .9882 1.00 5.00 -.652 1.026
Perceived usefulness A10 –A15 3.124 .7454 1.00 5.00 -.487 -.548
Availability of IsB A2B5 3.689 .6325 1.00 5.00 -.681 -.369
Age B3 3.441 .8450 1.00 5.00 .125 .547
Education B5 3.013 .3698 1.00 5.00 -.658 -954
Income B4 3.259 .5472 1.00 5.00 .412 -1.259
Table 4.8: Descriptive statistics for research variables (N = 228). t 22
Table 4.8 also includes the minimum and maximum values, and the skewness1 and
kurtosis2 values to check for the normality
3 of each variable. According to Hair et al.
(1998), skewness values within the range of –1 to +1 and kurtosis values within the
1 Skewness is a measure of the symmetry of a distribution. A positively skewed distribution has
relatively few large values and tails off to the right, and a negatively skewed distribution has
relatively few small values and tails off to the left (Hair et al., 1998). 2 Kurtosis is a measure of the peakedness or flatness of a distribution when compared with a normal
distribution. A positive value indicates a relatively peaked distribution, and a negative value
indicates a relatively flat distribution (Hair et al., 1998).
3 Normality refers to the degree to which the distribution of the sample data corresponds to a normal
distribution, where normal distribution is a theoretical probability distribution in which the
horizontal axis represents possible values of a variable and the vertical axis represents the
probability of those values occurring. The scores on the variable are clustered around the mean in a
symmetrical, unimodal pattern known as the bell-shaped or normal curve (Hair et al., 1998).
Page 188
172
range of –3 to +3 indicate an acceptable range for normality whereas values falling
outside the range of skewness and kurtosis indicate a substantial departure from a
normal distribution. Thus, Table 4.8 shows that skewness and kurtosis values for all
variables fall within the acceptable range. The remaining research items
charactarastics are attached in Appendix F.
4.14.3 Common Method Bias statistical Test Methods
Researchers have developed a number of statistical techniques to test and control for
the effect of CMV in mono-method research designs. This section presents some
techniques that have been frequently employed in marketing research, such as but not
limited to the Harman single-factor test and the marker variable technique (e. g.
Pavlou et al., 2007; Jarvenpaa and Majchrzak, 2008). Therefore, this section presents
some of the CMV tests and also concludes with the used test method which has been
utilized in this research to examine the presence of the CMV.
1. The extent of common method bias has been utilized in different studies, as
Harman’s one factor test test the presence of the CMV by entering the entire
principal constructs into a principal components factor analysis (Podsakoff
and Organ, 1986). Evidence for common method bias exists when a general
construct account for the covariance among all constructs.
2. The partial highest factor from the principal component factor analysis is
another method. According to Podsakoff and Organ (1986, p. 536), the factor
is assumed to contain the best approximation of the CMV if it is a general
factor on which all variables load. If it does not produce a significant change
in variance explained in any of the dependent variables, this suggests no
substantial common method bias.
Page 189
173
3. Lindell and Whitney’s (2001) employed a theoretically unrelated construct
(maker variable) to adjust the correlation among the principal constructs.
Introducing “MakVar” as a maker variable, and the high correlation among
any of the items of the study’s principal constructs and “MakVar” would be an
indication of common method bias. In contrast with the Harman single-factor
test, the marker variable technique (Lindell and Whitney, 2001) attempts to
control for CMV by including “a measure of the assumed source of method
variance as a covariate in the statistical analysis” (Podsakoff et al., 2003, p.
889).
4. Examining the correlation matrix has been introduced by Bagozzi et al.
(1991), investigating any highly correlated variables are evidence of common
method bias, usually results in extremely high correlations (r>0.90).
In this research, the Harman’s single-factor test was performed to test for the presence
of CMV (Harman, 1967; Podsakoff and Organ, 1986). All the self-reported items
were entered into a principal components factor analysis with varimax rotation.
According to this technique, if a single factor emerges from the factor analysis or one
“general” factor accounts for most of the covariation in the variables, CMV is present.
Therefore and due to the fact that all the items in the questionnaire were completed by
a single respondent, common method bias might exist in this study. To test common
method bias, Harman’s single-factor method was used. Harman’s single-factor test
which assumes that all items should yield a single factor if common method bias
exists was used (Podsakoff et al., 2003). Exploratory factor analysis (EFA) results
showed that eight distinct factors with eigenvalues near or above 1.0 were extracted,
explaining 67.0% of the total variance. The first factor explained 33.65% of the total
Page 190
174
variance, not the majority of the explained total variance (see Appendix I). These
results are consistent with the absence of CMV.
4.14.4 Inferential statistics: reliability, factor, correlation,
and MR analysis
In this study, the exploratory factor analysis (EFA)1 was used to aggregate the
multiple-item question responses in order to determine the overall measure for the
variable. In this context, Hair et al. (1998) indicated that EFA is the appropriate
method for assessing constructs. Similarly, Field (2005) argued that EFA can be used
to understand the structure of a set of variables.
EFA classifies each variable into a set of dimensions. Such a classification can
contribute to a more accurate determination of the relationships and influences
between the variables. Thus, an EFA was performed to operationalise these variables
and to test the degree to which the items are tapping the same concept. In
implementing EFA, SPSS always finds a factor solution to a set of variables (Field,
2005, 640). Finally, to test the internal consistency, Cronbach’s alpha was used to
measure the reliability of the variables resulting from the EFA.
1 To assess the exploratory factor analysis (EFA), five commonly used assumptions were followed
(Hair et al., 1998; Field, 2000): Sampling adequacy (Kaiser-Meyer-Olkin measure greater than
0.5); the minimum eigen value for each factor to be one; considering the sample size, factor loading
of .40 for each item was considered as the threshold for retaining items to ensure greater
confidence; the determinant of the correlation matrix (more than 0.00001); varimax rotation was
used since it is a good general approach that simplifies the interpretations of factors (Field, 2000,
449). Once the number of factors has been determined, the next step is to try to interpret them.
Statistical Package for Social Sciences (SPSS) shows which variables 'clump together'. From your
understanding of the contents of variables (and underlying theory and past research), it is up to you
to propose possible interpretations (Pallant, 2001, 154).
Page 191
175
In addition to the EFA, the MR was used to determine the relationship between
variables and to describe the strength and direction (i.e. whether positive or negative)
of the relationship between two variables (Pallant, 2001). In order to judge the
strength of the relationship between the variables, (i.e. the value of R), Bryman and
Cramer (2001 citing Cohen and Holliday 1982) suggested the following: 0.19 and
below is very low, 0.20 to 0.39 is low, 0.40 to 0.69 is modest, 0.70 to 0.89 is high, and
0.90 to 1 is very high. In contrast, Cohen (1988) suggested that a value of
approximately 0.10 represents a small correlation, 0.30 a medium correlation, and
0.50 or more represents a large correlation. Pikkarainen et al. (2004) conducted a
study about the acceptance of the OB, the MR indicated that the model multiple
correlation coefficient (R) was 0.352 and the coefficient determination (R2) was 0.124
whereas the adjusted R2 was 0.093, and the overall model was considered as
statistically significant. However, the MR of Lallmahmood’s (2007) research about
the intention to use e-commerce indicated that the model was also significant with R
(0.821), R2 (0.674) and adjusted R
2 (0.532). The research’s’ adoption, use and success
of IB models were found explaining 62%, 39.4% and 30%, respectively, of the SA
adopters, users and successful IB customers attitudes. The researches’ models have
shown high, good and fair prediction powers (R²=62%, 39.4% and 30%) compared
with other models (i.e. Suh and Han, 2002 R²=75%; Wang et al., 2003 R²=62%;
Pikkarainen et al., 2004 R²=12.4%; Shih and Fang, 2004 R²=66%; Lallmahmood’s,
2007 R²=67%; Hosein, 2009 R²=32.2%)
Multicollinearity tests were undertaken in this research and were presented in detail in
Chapter 6; they cause a problem for MR since they can affect the parameters of a
regression model (Field, 2005). According to Hair et al. (1998), there are three
recommended methods for assessing multicollinearity: (1) the presence of high
Page 192
176
correlation (generally 0.90 and above), (2) the tolerance values, and (3) the variance
inflation factor (VIF) values. The VIF values should not exceed the generally
accepted maximum level of 10 (an indication of high levels of multicollinearity) and
the tolerance values should not be less than the maximum level of 0.2 (also an
indication of high levels of multicollinearity). Moreover, the Durbin-Watson (DW)
test was performed to test if the residuals were correlated. The test values should be
considered to be between the acceptable levels (less than 1 or greater than 3 are
deemed to be unacceptable) (Field, 2000).
MR analysis is a statistical technique that can be used to analyse the relationship
between a dependent variable and a set of independent variables (Hair et al., 1998).
The main objective of MR analysis is to use independent variables whose values are
known to predict a single dependent value (Hair et al., 1998). Each dependent variable
is weighted by the equation of the MR to ensure maximum prediction from the
independent variables (Hair et al., 1998). The weights denote the ability to quantify
precisely the relative importance of each proposed variable. Thus, MR is used to
investigate the relationships of a set of independent variables with a dependent
variable. On the other hand, MR applications fall into two broad classes of research
problems: prediction and explanation (Hair et al., 1998). MR is used to predict the
dependent variable from independent variables in order to maximise the overall
predictive power of the independent variables (Hair et al., 1998). For example, time
series analysis is often used in prediction. An explanation using MR involves
assessing the degree and the character of the relationship between the dependent and
the independent variables. The independent variables, in addition to their collective
prediction of the dependent variable, may also be considered for their individual
contribution to the variation and its prediction (Hair et al., 1998). In this context, MR
Page 193
177
determines the relative importance of each independent variable. MR provides the
magnitude and the direction (i.e. whether positive or negative) of each independent
variable’s relationship, whether positive or negative. However, it shows the nature of
relationships between the dependent and the independent variables in terms of
linearity. The beta coefficient is a measure to determine the relationship between the
dependent and the independent variables. In statistics, standardized coefficients or
beta coefficients are the estimates resulting from an analysis performed on variables
that have been standardized so that they have variances of 1. This is usually done to
answer the question of which of the independent variables have greater effects on the
dependent variable in a MR analysis.
The flexibility of MR ensures that the researcher examines the true nature of the
relationship based on the linearity of the relationships (Hair et al., 1998). It gives an
insight into the interrelationship between independent variables through the
correlation matrix. In this research, regression analysis was used to test the research
hypotheses. Finally, it should be noted that these statistical techniques have been
frequently used in business research (Hair et al., 1998).
4.15 Chapter Summary
The processes of conducting a research project were explained and discussed in this
chapter. The research philosophy and design were explained and the differences
between research paradigms and methodologies were discussed. The positivistic
paradigm employing a cross-sectional survey methodology was utilised as an
appropriate approach for conducting this research. The research population, sampling
frame and data collection methods were also discussed in this chapter, followed by the
justification for selecting a large sample.
Page 194
178
The study used a random sample of 1000 individuals who had a telephone line
(Population = 2.9 million), chosen from the SA telephone directory, and the postal
questionnaire method was employed as the most appropriate method to collect a large
amount of data. The questionnaire was constructed and pre-tested and a pilot test was
conducted. In addition, and as part of development of the research’s questionnaire, the
scales, measurements, and construct operationalisations for the research’s variables
were presented and identified. Finally, this chapter concluded that this research dealt
with missing data by replaceing these missing values with mean values based on the
valid responses on each item.
Furthermore, specific design methods were used in constructing the questionnaire.
Several steps were employed for evaluating and testing the questionnaire and, in
addition, pilot work was conducted. A total of 228 usable questionnaires were
received, representing a 22.8% response rate. This was considered satisfactory for
conducting the statistical analysis compared with the list of studies in Table 4.4. In
addition, Denscombe (1998) indicated that it was not uncommon to get a response
rate as low as 15% for postal surveys and Alreck and Settle (1985) confirmed that
‘‘[mail] surveys with response rates over 30 percent are rare, response rates are often
only 5 or 10 percent” (p. 45).
This chapter indicated that the scale reliability (internal consistency) is acceptable,
reliable, and above the recommended cut-off values, as the Cronbach’s alpha (CRA)
value = 0.80. In addition to that, the independent sample t-tests of statistical
significance indicated that non-response bias was of no serious concern to this thesis.
This study adopted the (Pearson) correlation analyses to estimate the validity for the
items measuring the construct; the correlation results revealed statistically significant
Page 195
179
at level 0.01, with high degree of internal correlation between all items on the scale,
thus it confirmed the validity of the constructs and scales used in this study. The
discriminant validity has been also conducted to assess how each construct
discriminate from other constructs; the result was found satisfactory as all AVE for
each construct were found greater than its shared variance with any other construct. In
addition to that, to ensure content validity in this study, an extensive literature review
was undertaken to define and clarify the scales and measures used in this research.
Most of the items and scales used were adopted from previous empirical studies
which contributed on meeting the requirements of the validity and reliability. The
potential sources of the CMV were investigated and remedies/mitigations have been
taken in this study to minimize the presence of the CMV. A statistical method has
been also performed, Harman’s single-factor method, to test the presence of the CMV
the results are consistent with the absence of CMV (see Appendix I).
The descriptive statistical analysis indicated that all standard deviations indicated that
the means were accurately representing the data. In addition, the skewness and
kurtosis values show that all variables fell within an acceptable range for normality.
This chapter concluded with by highlighting the number of statistical methods which
were utilised in analysing the data. These methods are descriptive statistics
(frequencies and means), and inferential statistics, such as multicollinearity tests,
factor analysis, correlations and MR. All those analysis methods were explained and
discussed briefly in this chapter and will be presented in greater detail in Chapter 6.
The next chapter will discuss the descriptive statistics and the proposed methods of
analysis of this study.
Page 196
180
Chapter Five
Descriptive Statistics and Discussion
5.1 Introduction
This chapter gives the socio-economic characteristics of respondents who use IB
services in SA. The sample surveyed in this study (228) represented 12 out 13
provinces in SA with a range of respondent characteristics. These characteristics are
presented and reviewed in this chapter, such as respondents’ demographic factors and
their IB usage factors. These results would help in developing a real useful
comparison with the current existing country's demographic statistical data.
Another comparison analysis between the IB adopters, users, and success is presented
at the end of this chapter, in terms of the demographic characteristics of each facet to
enhance the knowledge and provide a more in-depth investigation of the IB adoption,
use and successful implementation.
5.2 Sample Characteristics
The sample characteristics of respondents are a significant variable used by policy
makers when designing marketing schemes and business plans. As mentioned
previously, the research’s questionnaire was distributed randomly using the SA
telephone directory; the respondents were found to be distributed in 12 out of the 13
provinces in SA (see Chapter 1), as presented in Table 5.1.
Page 197
181
No. Area/Province Population
(%)
Respondent
Frequency
Respondent
(%)
1 Makkah 25.5 44 19
2 ArRiyadh 25.0 65 29
3 AsSharqiyah 15.1 49 21
4 Asir 7.0 9 4
5 AlMadinah 6.6 21 9
6 Jazan 5.0 13 6
7 AlQassim 4.5 9 4
8 Tabuk 2.9 4 2
9 Hayil 2.2 5 2
10 Najran 1.9 4 2
11 AlJawf 1.6 - 0
12 AlBahah 1.5 3 1
13 AlHodud AsShamaliyah 1.2 2 1
Total 100% 228 100%
Table 5.1: SA 13 Actual population per provinces and the research’s response rate.tt 23
Source: (Saudi.gov.sa, 2012).
Most of the respondents (69%) were from three main provinces in SA, namely,
ArRiyadh, Makkah, and AsSharqiyah, as the majority of the SA population (65.6%)
lives in these three provinces. These areas contain the four main cities, that is, the
capital city and two other main cities on the east and west coast in addition to the
Muslim world’s holiest city. The sample characteristics are discussed in the next two
main sub-sections, which deal with demographic and IB usage characteristics.
5.2.1 Demographic Characteristics
This part describes socio-economic characteristics, gender composition, age, income,
education level, occupation, ability to use a computer, access to the internet, and field
of study. The following table gives an overall summary of the respondents’
demographic characteristics followed by sub-sections discussing these characteristics
individually.
Page 198
182
Profile Category Frequency (%)
Gender Male 191 83.8
Female 37 16.2
Age 20 or less 28 12.3
21-30 51 22.4
31-40 86 37.7
41-50 39 17.1
51-60 24 10.5
Income ≤ than 50,000 16 7
50,001-100,000 33 14.5
100,001-150,000 94 41.2
150,001-200,000 60 26.3
≥200,001 25 11
Education level High School 29 12.7
Community College 80 35.1
Bachelor 86 37.7
Master 28 12.3
Doctoral 5 2.2
Occupation Public Sector 77 33.8
Private Sector 132 57.9
Self-employed 3 1.3
Military Sector 16 7
Ability to use
computer
Not good 6 2.6
Beginner 46 20.2
Good 161 70.6
Expert 15 6.6
Access to internet Home 79 34.6
Internet café 13 5.7
Work 136 59.6
Field of study Business 42 18.4
Engineering 16 7
Education 32 14
Medical 3 1.3
Islamic studies 10 4.4
Law 9 3.9
Computer science 7 3.1
Not graduated 109 47.8
Table 5.2: Summary of respondents’ demographics. t 24
5.2.1.1 Gender
The survey findings show that the gender structure is generally unbalanced. Table 5.2
explains that 83.8% were male and 16.2% were female. The big gap between these
ratios refers mainly to the obstacle in accessing females, the strict separation between
the genders, and the cultural emphasis on privacy for women in SA; females are
usually difficult to reach for primary data collection purposes. The following Figure
(5.1) presents comparison between the SA actual gender rates and this study
respondents’ gender rates.
Page 199
183
50.90% 49.10%
83.80%
16.20%
0.00%
20.00%
40.00%
60.00%
80.00%
100.00%
Male Female
Perc
ent
Gender
Gender comparison study between SA actual population and study respondents'
SA Actual Population Study Respondents'
Figure 5.1: Comparison between the SA actual gender and the study respondents’ gender. f 32
Figure (5.1) indicate that the SA actual overall ratio of males to females is about
50.9% males to 49.1% females (CDSI, 2010). The difference between both categories
in the research’s survey refers to an increase in the number of males in the community
and due to barriers to female participation in SA, as highlighted in Chapter 1.
However, this result is in line with the findings of other studies (Al-Gahtani et al.,
2007). Al-Gahtani et al. (2007) found in their study that 82% of their study
respondents were male, and 18% of the respondents were females. Thus, these results
are accepted generally.
5.2.1.2 Age
As indicated in Table 5.2, Figure 5.2 summarises the information gathered concerning
the age of the respondents. The majority (37.7%) of the surveyed respondents were in
the age range 31-40 years old. About 89.5% of the respondents were less than 50
years old, which is economiclly active age group and in the early stage of the life
cycle, while 10.5% of the respondents were more than 50 years old. The concentration
of respondents in the age groups between 21-40 years (59.2% of the sample)
demonstrates that many of them use IB services.
Page 200
184
Age
12.30%
22.40%
37.70%
17.10%
10.50%
0.00%
10.00%
20.00%
30.00%
40.00%
20 or less 21-30 31-40 41-50 51-60
Age Group
Per
cen
t
Figure 5.2: Respondents’ age.f 33
Reference to Table 5.2 and according to (CDSI, 2007), the age group of equal or less
than 20 years accounts for 48.2% of the population of SA, whereas 41.22% are in the
aged between 21 years to equal or less than 50 years old. Figure (5.3) present the
variation between the research findings and CDSI findings for the country national
profile, and that is due to the fact that the age group (less than 20) do not have bank
accounts. In addition to that, the younger respondents participate less frequently in
surveys because they have typically limited job opportunities (source of income)
and/or are busy in school.
48.20%
18.90%13.45%
8.87% 5.30%12.30%
22.40%
37.70%
17.10%10.50%
0.00%
20.00%
40.00%
60.00%
20 or less 21-30 31-40 41-50 51-60
Per
cen
t
Age Group
Age group comparison study between SA actual population and study respondents'
SA Actual Population Study Respondents'
Figure 5.3: Comparison between the SA actual population ages and the study respondents’ ages f 34
Source: Research findings and (CDSI, 2007).
5.2.1.3 Respondents’ income
Income can be considered as one of the fundamental socio-economic characteristics
of the sample. Analysing income level could throw light on the behavioural trends of
Page 201
185
respondents and could assist in making recommendations. In assessing respondents'
income, Table 5.2 and Figure 5.4 show that 21.5% of respondents were found to have
low incomes, 67.5% had medium incomes and only 11% of respondents had high
incomes.
However, and as highlighted in chapter 3, the number of Saudi nationals who earn
less than USD 2 a day was 1.63% of the population, or approximately 300,000, and
400,000 families (around 19% of the population) were found spending less than SR
3,800 or USD 1,000 a month (Ramady, 2010), which is considerably low income. In
addition to that and as also illustrated in chapter 3, the SA national’s average income
per capita were found 22,000 USD, which is considered as a medium income level for
the majority of the SA population. As a result, these findings are in parallel with this
research findings as the majority (89%) of the respondent were between low and
medium levels of income.
7%
14.50%
41.20%
26.30%
11%
0%5%
10%15%20%25%30%35%40%45%
Perc
ent
SR
Income
Figure 5.4: Respondents’ Income. f 35
Page 202
186
5.2.1.4 Educational level
Table 5.2 and Figure 5.5 reveal that the majority (37.7%) of the respondents had a
bachelor degree, with 14.5% having post graduate degree, 35.1% having attended
community college, and 12.7% having attended only high school.
Education Level
37.70%35.10%
12.70% 12.30%
2.20%
0.00%
5.00%
10.00%
15.00%
20.00%
25.00%
30.00%
35.00%
40.00%
Bachelor Community
Col lage
High School Master Doctora l
Education Level
Perc
ent
Figure 5.5: Respondents’ educational level. f 36
As illustrated bellow Figure (5.6), CDSI (2007) found that 14.7% of the Saudi
Arabian population have High school, 7.2% have bachelor degrees, 2.6% have a
community college qualification, 0.29% has Master degree and 0.1% of them have
Doctoral degree.
14.70%
2.60%7.20%
0.29% 0.10%
12.70%
35.10% 37.70%
12.30%
2.20%
0.00%
10.00%
20.00%
30.00%
40.00%
High School Community collage
Bachelor Master Doctoral
Perc
ent
Education Level
Education level comparison study between SA actual population and study respondents'
SA Actual Population Study Respondents'
Figure 5.6: Education levels comparison between the SA actual population and study respondents.ff 37
Source: Research findings and (CDSI, 2007).
Page 203
187
Figure (5.6) present a comparison between the research's findings and the CDSI
findings of the country national profile, and it shows a variation between both
findings and that is due to the fact that all the respondents in this research were able to
read and write (educated) to communicate when using IB services, whereas the CDSI
research had been applied to the entire Saudi Arabian population, where the
probability of having non-educated people is high. This suggests that people who use
IB are substantially well educated and this means that if banks, governments and other
agencies want wider adoption of the IB, they need to make it easier, and more fixable.
In SA, the adoption of tele-banking has been found positively associated with
educational level (Al-Ashban and Burney, 2001), and other studies found that
customers who are educated, more likely to use IB (e.g. Sathye, 1999; Karjaluoto et
al., 2002; Mattila et al., 2003).
Moreover, Figure (5.7) illustrate that most respondents had achieved reasonable levels
of education, but it has a high variation between male and female. As mentioned
earlier, this is due to the social and cultural difficulties to reach female for primary
data collection.
30.70% 30.26%
10.95% 10.10%
1.75%4.39% 7.46%1.75% 2.20% 0.44%
0.00%
10.00%
20.00%
30.00%
40.00%
Community collage
Bachelor High School Master Doctoral
Perc
ent
Education level
Respondent's education level comparison study between SA male and female
Male Female
Figure 5.7: Respondent's education levels comparison between Male and Female. f 38
Page 204
188
In general, the research respondents have reasonable levels of education as it should
have equipped them with the ability to discuss their problems and to give clear
opinions about IB services. However, the educational level is important as it tends to
influence perceptions concerning the quality and most significantly the adoption of IB
services.
5.2.1.5 Occupation
Table 5.2 and Figure 5.8 give details of the occupations of respondents. Respondents’
occupations could be divided into four active groups. The first group is represented by
respondents who worked in the government sector (33.8%). They had skills with
various backgrounds and were employed fundamentally within the formal sector of
the economy, such as education, management, accounting and medical services. The
second group is represented by respondents who worked in the private sector (57.9%).
This group was largely professional with high levels of skills and is exposed on the
latest technology more than the other sectors.
Occupation
57.90%
33.80%
7%
1.30%0.00%
10.00%
20.00%
30.00%
40.00%
50.00%
60.00%
70.00%
Private Sector Publ ic Sector Mi l i tary Sector Sel f-employee
Occupation
Perce
nt
Figure 5.8: Respondents’ occupations. f 39
The third group is represented by respondents who were self-employed. It is also
interesting to note that 1.3% of respondents were self-employed, such as traders,
drivers, gardeners, repairers, builders, carpenters, tailors, mechanics, and launderers.
This group is in the informal sector; people in this category are unlikely to have
medical insurance or social security. The fourth group is represented by respondents
Page 205
189
who worked in the military sector (7%). This group was basically professionals with a
high level of skills in certain jobs.
According to the GCC employment statistical reports (2008), 35% of the entire
population of Saudi Arabian workers work in the government sector whereas 65%
work in the private sector. Due to the confidentiality and sensitivity of the military
sector information, the GCC reports did not consider the military information and
therefore the researcher was not able to access the relevant data. The research figures
are almost in line with GCC employment statistic figures. Theses similarities are due
the facts that the majority of employment sector (Government/ Private) in SA, are
having Bank accounts, as their employers deposit their salaries directly in their
account. This has encouraged the SA employees to have IB account with their banks.
Figure 5.9 shows that there are a high variation between male and female in terms of
their occupation, and this is due to the limitation of women participation during the
data collection as illustrated earlier in this chapter. These results and variations are in
line with our findings in chapter one, as we highlighted that there are several barriers
and obstacles in female participation (listed in Table 1.1) in the public life in SA.
52.63%
23.24%
7%0.88%
5.26%10.52%
0% 0.44%0.00%
20.00%
40.00%
60.00%
Private Sector Public Sector Military Sector Self-employed
Perc
ent
Occupation
Respondent's occupation comparison study between SA male and female
Male Female
Figure 5.9: Respondent's occupation comparison between SA male and female. f 40
Page 206
190
5.2.1.6 Ability to use a computer
An investigation into the ability to use a computer requires an understanding of the
levels of individuals’ capabilities regarding computer use. The researches findings
show that many (70.6%) of the respondents had a good ability to use a computer.
Table 5.3 shows that 20.2% of respondents were found to have a moderate ability to
use a computer, 6.6% of respondents had a high ability to use a computer, and 2.6%
of respondents had a limited ability to use a computer. For those respondents who
considered themselves as beginners or had limited ability to use a computer, it is
expected that this will minimise their usage and will impact the frequency of using
computers. In addition to that, this study revealed that most of the respondents
considered themselves able to use a computer, which is expected to reflect positively
on their computer usage.
Abil ity to use computer
6 2.6 2.6 2.6
46 20.2 20.2 22.8
161 70.6 70.6 93.4
15 6.6 6.6 100.0
228 100.0 100.0
Not good
Beginner
Good
Expert
Total
Valid
Frequency Percent Valid Percent
Cumulat iv e
Percent
Table 5.3: Ability of respondents to use a computer. t 25
0.88%
15.79%
62.72%
4.39%1.57% 4.39% 7.89%2.19%
0.00%
10.00%
20.00%
30.00%
40.00%
50.00%
60.00%
70.00%
Not good Beginner Good Expert
Pe
rcen
t
Ability to use computer
Respondent's ability to use computer comparison study between SA male and female
Male
Female
Figure 5.10: Respondent ability to use a computer, comparison between male and female.f 41
Page 207
191
5.2.1.7 Access to the internet
According to Table 5.2 and Figure 5.12, people had access to the internet through
three major modes. The first mode was accessing the internet through their work;
59.6% of respondents accessed the internet through their work, 34.6% through their
homes, and 5.7% through internet cafes. Probably, people prefer to access the internet
through their work because it is free and, thus, they save the cost of monthly or annual
subscriptions. In addition to that, the employees who work in SA spend at least third
of their day time in their work; this also supported the findings of this research.
In 2007, CDSI reported that 46% of the Saudi Arabian families owned a computer
and 41% of them had access to the internet at home which is equivalent to 37% of the
SA population. On the other hand, internet penetration has increased continuously
from 55% in 2007 to 73% in 2009 in the working environment in SA (CITC, 2009).
As it increased in the corporate sector, from 65% in 2007 to 73% in 2009 among
government offices, moved from 37% in 2007 to 63% in 2009 in the health sector,
and reached to 93% of the educational institutions (CITC, 2009). This has increased
the usage of the internet among the employees in their working environment in SA.
These figures support this research finding as the majority (59%) of the study
respondents has been found using the internet from their work.
Access to internet
Home
35%
Internet
Café
6%
Work
59%
Figure 5.11: Respondents’ access to the internet (%). f 42
Page 208
192
In addition to that, Figure (5.12) shows that the majority of the male respondents
access to internet from work, whereas the majority of the female respondents access
to internet from home. This is because of most of the respondents females'
commitments are at home and males' commitments are outside their home. Moreover
and due to the fact that most of the respondents (84%) are male, this explains why the
majority of the respondents of this studies access to internet from their work.
57.89%
20.60%
5.26%1.75%
14%
0.44%0.00%
10.00%
20.00%
30.00%
40.00%
50.00%
60.00%
70.00%
Work Home Internet Café
Perc
ent
Access to internet
Respondent's internet access comparison study between SA male and female
Male
Female
Figure 5.12: Respondent's access to the internet, comparison between SA male and female f 43
5.2.1.8 Field of study
The field of study is considered to be an important feature for the usage of IB; it has a
powerful relation with the expansion of IB services as the usage of IB is influenced by
study fields. Table 5.2 and Figure 5.13 show that the majority of respondents studied
business (18.4%) and education (14.1%). The table also illustrates that 7% of
respondents studied engineering, 3.9% law, 4.4% Islamic studies, 3.1% computer
science, and 47.8% of the respondents did not have a degree.
According to CDSI (2004), out of the Saudi Arabian population (of people older than
17 years), 58% held high school and secondary school degrees. In line with the
findings study; the majority of SA area of study were education and business with
16% studied education, 11.7% business and 2.6% engineering (CDSI, 2004). In SA,
the selection of the field depends basically on the overall percentage of the final
Page 209
193
examination at the high school stage, the availability of job opportunities after
graduation, and socio and cultural factors. These results suggest that people are more
interested in improving their socio-economic conditions and that this influences their
usage of IB.
16.66%
7% 7.46%0.88%
2.63% 3.10% 1.75%
44.30%
1.75% 0%
6.58%
0.44% 1.75% 0.88% 1.32%3.51%
0.00%5.00%
10.00%15.00%20.00%25.00%30.00%35.00%40.00%45.00%50.00%
Perc
ent
Field of study
Respondent's field of study comparison study between SA male and female
Male Female
Figure 5.13: Respondents’ fields of study, comparison between SA male and female. f 44
Figure 5.13 shows that the majority of the respondents (48.8%) are not college
graduates. In addition to that, the majority of the male respondent's fields of study are
business (16.66%) then education (7.46%), whereas the majority of the female
respondent's fields of study are education (6.58%) first and then business and Islamic
studies equally with a percentage of (1.75%) for each of them. These findings are in
parallel to the actual government statistics figures (CDSI, 2004).
5.2.2 Respondents’ IB Usage Characteristics
This section reviews and presents the IB usage characteristics, such as usage periods
of IB, monthly access to the internet and IB, and the most popular banks and will
conclude with the different requested IB services. Table 5.4 shows an overall
summary of respondents’ IB usage characteristics followed by sub-sections presenting
these characteristics individually.
Page 210
194
Profile Category Freq. %
Usage
period of
internet
Less than 1 month 7.0 03.10
1-12 months 20 08.80
1-3 years 30 13.20
3-5 years 61 26.80
More than 5 years 110 48.20
Access to
internet
monthly
1-5 times 4 01.80
6-10 times 17 07.50
11-20 times 38 16.70
21-30 times 126 55.30
More than 31 times 43 18.90
Banks Al-Bank Al-Saudi Al-Fransi 6 02.60
National Commercial Bank 56 24.60
Saudi Investment Bank 9 03.90
Saudi British Bank 10 04.40
Arab National Bank 43 18.90
Bank Al-Bilad 4 01.80
Al-Rajhi Bank 87 38.20
Bank Al-Jazirah 4 01.80
Riyadh Bank 2 00.90
Saudi Hollandi Bank 4 01.80
Saudi American Bank 3 01.30
Usage
period of
IB
Less than 1 month 11 04.80
1-12 months 25 11.00
1-3 years 24 10.50
3-5 years 135 59.20
More than 5 years 33 14.50
Access to
IB
monthly
1-5 times 45 19.70
6-10 times 109 47.80
11-20 times 31 13.60
21-30 times 21 09.20
More than 31 times 22 09.60
Access to
IB in
the future
1-12 months 8 03.50
1-3 years 13 05.70
3-5 years 41 18.00
More than 5 years 166 72.80
Reasons
for using
IB
Check account balances 194 85.10
Transfer money between accounts 125 54.80
View images of your checks 148 64.90
Obtain interest rate on deposit product 169 74.10
Request copies of past statements 202 88.60
Order traveller's, cashier's, and regular
cheques 87 38.20
View transaction history 187 82.00
Payment of bills 128 56.10
Purchase of goods or services 74 32.50
Apply for loan 86 37.70
Check my share's portfolio account 118 51.80
Table 5.4: Respondents’ IB usage characteristics. t 26
Table 5.4 shows a comparison analysis among the internet and IB adopters and users
in terms of period of use (adopters), and frequency of usage (users) and too frequent
users (successful users) who use the IB services widely. In terms of the period of use,
it was found that the majority (48.2%) of the respondents had been using the internet
Page 211
195
for more than 5 years, whereas 74% of them are accessing the internet more or equal
21 times monthly. This study also reveals that users who had been using IB for one
year and less were 15.8%. This group of respondents were found less than 30 years
old, moderate income, educated, the majority of them were male and were using the
internet in the last years. Whereas 75% of the respondents were using the IB for more
than 3 years, and users who had been using IB for more than 5 years accounted for
14.5%. These findings suggested that there is a moderate usage of the internet and IB
in SA. Table (5.4) also reveal that almost 23% of the IB users were using the IB from
11 to 30 times a month. However, 10% of the IB users were found using the IB
services for more than 5 years. The group of respondents who were using the IB
services from 11 to 30 times were found middle aged, educated, receiving moderate
income, the majority of them were male and frequent internet users (21 to 30 times a
month) Moreover, this study also found a wide usage of the Banking services by the
customers, over the internet, as more than 5 services were found used intensively
(65% and above). This study found that the majority (46%) of the IB users were found
using 5 services and more. This group of respondent were found middle aged, high
income, educated, the majority of them were male and have been found using internet
more than 21 times a month. In the next sub section, a detailed explanation of table
(5.4) items will presented and discussed.
5.2.2.1 Usage period of the internet
The results summarised in Table 5.5 show that 48.2% of respondents had been using
the internet for more than 5 years, 26.8% had been using the internet for between 3
and 5 years, 13.2% for between 1 and 3 years, 8.8% for between 1 and 12 months, and
3.1% had been using it for less than one month. It is important to note that many
people considered themselves to be familiar with the internet. The attitudes of these
Page 212
196
people toward length of usage of internet were more or less similar to those of internet
users in other countries.
Usage period of internet
7 3.1 3.1 3.1
20 8.8 8.8 11.8
30 13.2 13.2 25.0
61 26.8 26.8 51.8
110 48.2 48.2 100.0
228 100.0 100.0
Less than 1 month
1-12 months
1-3 years
3-5 years
More than 5 years
Total
Valid
Frequency Percent Valid Percent
Cumulativ e
Percent
Table 5.5: Usage period of internet by respondents. t 27
5.2.2.2 Access to the internet monthly
People access the internet at different times. Table 5.6 indicates that a higher
proportion of respondents (55.3%) were found to be using the internet 21-30 times
monthly. The findings reveal that 18.9% of respondents were using the internet more
than 31 times monthly, 16.7% were using the internet 11-20 times every month, 7.5%
were using the internet 6-10 times monthly, and only 1.4% 1-5 times monthly. These
results suggest that 74.2% of people use the internet more than 20 times monthly,
which means that people are attracted to deal with the internet.
Access to internet monthly
4 1.8 1.8 1.8
17 7.5 7.5 9.2
38 16.7 16.7 25.9
126 55.3 55.3 81.1
43 18.9 18.9 100.0
228 100.0 100.0
1-5 times
6-10 times
11-20 times
21-30 times
More than 31 times
Total
Valid
Frequency Percent Valid Percent
Cumulat iv e
Percent
Table 5.6: Frequency and percent of access to internet monthly by respondents. t 28
5.2.2.3 Banks
In analysing Table 5.7, the results indicate that there are three major banks, Al Rajhi
Bank, NCB, and Arab National Bank, and these had attracted 81.6% of the
respondents.
Page 213
197
Which bank you with
6 2.6 2.6 2.6
56 24.6 24.6 27.2
9 3.9 3.9 31.1
10 4.4 4.4 35.5
43 18.9 18.9 54.4
4 1.8 1.8 56.1
87 38.2 38.2 94.3
4 1.8 1.8 96.1
2 .9 .9 96.9
4 1.8 1.8 98.7
3 1.3 1.3 100.0
228 100.0 100.0
Al-Bank Al-Saudi
Al-Fransi
National Commercial
Bank
Saudi Investment Bank
Saudi British Bank
Arab National Bank
Bank Al-Bilad
Al-Rajhi Bank
Bank Al-Jazirh
Riy adh Bank
Saudi Hollandi Bank
Saudi American Bank
Total
Valid
Frequency Percent Valid Percent
Cumulat iv e
Percent
Table 5.7: Respondent distribution across the 11 banks. t 29
As SA represents the heart of the Islamic world, most people have a preference for
local Islamic banks rather than traditional commercial banks. This is because Islamic
rules forbid dealing with interest (Riba). As defined in Chapter 3, Riba is exchanging
cash with cash, with one party paying back extra either immediately or later. This type
of transaction is forbidden in Islam; the prohibition also applies to putting money in
the bank and receiving interest. Therefore, 81.6% of respondents preferred the Islamic
banks, namely, Al Rajhi Bank, NCB, and Arab National Bank, since these banks are
based on Islamic financial principles.
Which bank you with
38.20%
24.60%
18.90%
4.40% 4% 2.60% 1.80% 1.80% 1.80% 1.30% 0.90%0.00%5.00%
10.00%15.00%20.00%25.00%30.00%35.00%40.00%45.00%
Al-R
ajhi B
ank
Nat
ional C
omm
ercia
l Bank
Ara
b Natio
nal Bank
Saudi Brit
ish B
ank
Saudi Inve
stment B
ank
Al-B
ank
Al-Sau
di Al-F
ransi
Ban
k Al-B
ilad
Ban
k Al-J
azira
h
Saudi Holla
ndi Bank
Saudi Am
erican
Ban
k
Riy
adh B
ank
Bank
Perc
en
t
Figure 5.14: Percents of respondents that belong for each bank. f 45
Page 214
198
5.2.2.4 Usage period of IB (Adoption)
The usage of IB usually occurs over a number of time periods, according to the
availability of different IB services and if they are meeting the customers’ needs. As
presented in the earlier chapters (Chapter 2); the start or initial use of the IB services
which results to a smaller period of experience in using IB is considered a predictor
for adoption (Al-Ashban and Burney, 2001; Al-Gahtani et al., 2007). In this study; the
adoption was measured by the periode of using the IB services of one year or less.
Therefore, the results of this study (Table 5.8) indicate that 16% of the respondents
are adopters as they were adopting the IB services for 1 year or less. In this study, the
majority of respondents (59.2%) had used IB for 3-5 years. Table 5.8 reveals that 14.5
% of respondents had used IB for more than 5 years, and 21.5% for users who use the
IB services from 1 and 3 years.
Usage period of IB
11 4.8 4.8 4.8
25 11.0 11.0 15.8
24 10.5 10.5 26.3
135 59.2 59.2 85.5
33 14.5 14.5 100.0
228 100.0 100.0
Less than 1 month
1-12 months
1-3 years
3-5 years
More than 5 years
Total
Valid
Frequency Percent Valid Percent
Cumulativ e
Percent
Table 5.8: Usage period of IB by respondents. t 30
These results revealed that the usage periods of IB in this study is relatively long
compared to the history of IB in SA. Also, this suggests that numerous financial
transactions are implemented via IB. Overall, and due to the fact that many people
were using the IB services for more than one year, this has contributed to increase the
usage frequency of the IB asdiscussed in the following section.
Page 215
199
5.2.2.5 Access to IB monthly (Use)
IB access in SA can be categorised according to different rates. Table 5.9 indicates
that some of the respondents (19.7%) could be considered as light users, as they were
using IB services from 1-5 times monthly. The findings also reveal that 70.6% of
respondents (moderate users) were using IB services 6-30 times every month and 10%
of them (heavy users) were using IB services more than 31 times every month. As
highlighted in chapter 4, this subsection has been suggested to be a measure for IB
usage. In this study, results (Table 5.9) indicate that the frequency of using IB
services from 6 to 31 times a month which predicts the use of IB. Thus, Table 5.9
indicates that 71% of the respondents are considered as IB users.
Access to IB monthly
45 19.7 19.7 19.7
109 47.8 47.8 67.5
31 13.6 13.6 81.1
21 9.2 9.2 90.4
22 9.6 9.6 100.0
228 100.0 100.0
1-5 times
6-10 times
11-20 times
21-30 times
More than 31 times
Total
Valid
Frequency Percent Valid Percent
Cumulat iv e
Percent
Table 5.9: Respondents’ access to IB monthly. t 31
5.2.2.6 Access to IB in the future
It is almost impossible to specify the extent of the future usage of IB as it depends on
individuals' behaviour and the security of information within the banks. The results
reveal that 72.8% of the respondents who were using IB services intended to use IB in
the future for a period of more than 5 years. Table 5.10 also shows that 18% of
respondents aimed to use IB services in the future for a period of 3 to 5 years, while
5.7% of the IB users intended using the service in the future for a period of 1 to 3
years, with 3.5% of them aiming to use it for the next year only. These findings
indicate that the respondents were satisfied with the IB services provided by SA
banks.
Page 216
200
Table 5.10: Thinking of using IB in the next period. t 32
Regarding this, IB was perceived by the users as quite a useful tool for managing their
financial matters. Ease of use and other quality factors were some of the factors
considered acceptable by the IB users. Most of the respondents demanded faster
download access to IB. Improvements should be made in terms of providing better
accessibility and then satisfying the IB users’ needs for the successful implementation
of IB services in SA.
5.2.2.7 Reasons for using IB (Success)
To understand the reasons that contribute to IB use, respondents were asked about
these reasons. All of them gave more than one reason and, thus, the frequencies in
Table 5.11 are greater than the size of sample.
Reasons Frequency Percentage (%)
Request copies of past statements 202 88.6
Check account balances 194 85.1
View transaction history 187 82.0
Obtain interest rate on deposit product 169 74.1
View images of your cheques 148 64.9
Payment of bills 128 56.1
Transfer money between accounts 125 54.8
Check my share's portfolio account 118 51.8
Order traveller's, cashier's, and regular cheques 87 38.2
Apply for loan 86 37.7
Purchase of goods or services 74 32.5
Table 5.11: Reasons for using IB. t 33
Page 217
201
A suggested in chapter 4, the customer's satisfaction (agree and strongly agree) and
the number of the used IB services (more than 5 services) are measures for the
success of the IB services. The following crosstabulation, Table (5.12) indicate that
customers who are using more than 5 IB services and are satisfied (satisfy and
strongly satisfy) from the provided IB service represents 10% of the respondents. This
type of users is enjoying the success of their IB implementation.
No. of IB account services * Satisfaction of the IB services? Crosstabulation
Count
No. of IB
account
services
Satisfaction of the IB Services? Total
Strongly
disagree
Disagree Uncertain Agree Strongly
Agree
Use IB Account to do number of Services
1 - 2 4 3 5 9 3 24
3 - 5 19 25 39 65 25 173
5 < 0 2 7 13 9 31
Total 23 30 51 87 37 228
Table 5.12: Crosstabulation between number of the used IB services and Satisfaction.t 34
5.2.3 Demographic Characteristics of Adoption, Use & Success
In the following paragraphs, Figure 5.15, a comparasion analysis between the
different research facets; Adoption, Use and Success based on the demographics
charactaristics of the respondents are presented.
Figure 5.15: Gender percentage distribution among Adption, Use and Success f 46
Page 218
202
In term of the rspondents gender, this study indicated that 83.8% were male and
16.2% were female, and Figure 5.15 revealed that the percentage of the females is
decreasing when moving gradually from adoption to use and then success as the
percentage of the female IB adopters is 20%, 15.5% for the female IB users and
13.6% of them are enjoing the success of their IB implementation. On the other hand,
Male percentages distribution was the opposite as the percentage of the male IB
adopters is 80%, 84.5% for the users and 86.4 for those male who are enjoing their IB
success. This means that males IB customers in SA are more satisfied and frequent
users more than females.
0.00%
10.00%
20.00%
30.00%
40.00%
50.00%
20 or less 21-30 31-40 41-50 51-60
22.2
0%
22.2
0%
33.3
0%
11.1
0%
11.1
0%
9.90
%
22.4
0%
38.5
0%
18.6
0%
10.6
0%
9.10
%
22.7
0%
40.9
0%
18.2
0%
9.10
%
Years
AgeAdoption Use Success
Figure 5.16: Age percentage distribution among Adption, Use and Success f 47
In term of the rspondents Age distribution, this study indicated that the majority of the
respondents (59.2%) were middle aged, focusing between 21-40 years. Figure 5.16
did not indicate any significant differences from the overall age percentage
distribution findings as the IB adoption; use and success customers were
consentrating between 21-40 years.
Page 219
203
0.00%5.00%
10.00%15.00%20.00%25.00%30.00%35.00%40.00%45.00%50.00%
8.90
%
15.6
0%
31.1
0%
24.2
0%
20.0
0%
6.80
% 14.3
0%
46.6
0%
27.3
0%
5.00
%
4.50
% 13.6
0% 22.7
0%
22.7
0% 36.4
0%
SR
Yearly income in SR
Adoption
Use
Success
Figure 5.17: Yearly incom percentage distribution among Adption, Use and Success f 48
Although this study identified that that the majority (41.2%) of the respondents were
having yearly income between SR 100,001 to 150,000, but Figure 5.17 revealed that
income levels were having an important relationship with the success of the IB in SA.
Table (5.17) showed clearly that there is increase in the percentage of the success of
the IB when there is increase of the income levels. This section concludes that the
higher income levels of the IB customers; the higer the percentage of the IB success
will be. On the other hand, the adoption and use of IB did not show significant
differencies with the overall income levels in this study as showen in Figure (5.17), as
both IB adoption and use customers were found having midel income levels.
Figure 5.18: Education levels percentage distribution among Adption, Use and Success f 49
As illustrated in Table 5.2 and Figure 5.5 of this chapter, this study found that the
more than half (52.2%) of the respondents had bachelor degree or post graduate
Page 220
204
degree. This group of respondents are divided between adopters, users and successful
IB customers. Figure 5.18 indicated that 54.5 % of the successful IB customers in this
study were found having bachelor degree or postgraduate degree; whreas 50.9%
among the IB users were having either bachelor degree or postgraduate degree, and
adopters were found having 55.6% among them having the sme degrees. Although,
these figures indicated that the sample of this study was showing high education
levels of the respondents, but the education levels were not found an important factor
in indicating the adopters, from users or even the successful IB customers, as all of
them were highly educated.
5.3 Chapter Summary
This chapter presented the sample characteristics of respondents (228) who were
using IB services in SA. The descriptive analysis of the respondents found that the
majority of the respondents were male (84%), as due to the limited participation of the
females in the public life in SA has also impacted their participation in this study. The
variation between both categories in the research’s survey refers to an increase in the
number of males in the community and due to barriers to female participation in SA,
as highlighted in Chapter 1.
Different than the country national profile; the result of this research found that 12.3%
of the respondents were found to be younger than 20 years old and 32.35% for age
group between 21 to 40 years, whereas the country national profile indicate 48.2% for
20 years or less and 60.1 for age group between 21 to 40 years of the total population
of SA. This variation is due to the fact that age group (less than 20) of the country
population do not normally have bank accounts and also they limited job
opportunities (source of income) and/or are busy in school.
Page 221
205
Different than the country national profile, the descriptive analysis of this study also
found that the majority of the respondents were highly educated, as more than 50% of
the respondents had either a bachelor degree or a postgraduate degree, which
contradict with the national profile as 7.5% of the population were having bachelor
degree, 4.3% having community college, and 2.2% were having master degrees. In
addition to that, more than 75% of the respondents were found considering
themselves good or expert at using a computer. The high variation between the
respondent educations level and SA population education level is due to the fact due
to the fact that all the respondents in this research were able to read and write
(educated) to communicate when using IB services, however the Saudi Arabian
population, where the probability of having non-educated people is high. In adtion to
that the higher icome levels were found having a positive relation with the success of
the IB in SA.
Finally, the majority of the respondents (more than 80%) had a bank account with
either AlRajhi Bank, NCB, or Arab National out of a selection of 11 Saudi banks, as
those banks main strength is in providing IsB services as highlighted in chapter two.
The result of the descriptive analysis found that around 75% of the respondents had
been using IB services for more than 3 years, and 33% of them were accessing their
IB account more than 11 times monthly, which indicate a good usage level of the IB
in SA. In addition to that, 72.8% of the respondents are intending to use IB in the
future for a period of more than 5 years, which also indicate that the provided IB
services in SA are satisfactory.
Page 222
206
Chapter Six
Inferential Statistics and Discussion
6.1 Introduction
The main purpose of this chapter is to cover the research’s inferential statistics
analysis and the testing of the research’s hypotheses. In addition, the results of the
factor analysis of the research variables are presented and discussed. This chapter also
presents the findings relating to the testing of the hypotheses relating to the
relationship between the contingent variables and the adoption, use and success of IB
services. This chapter concludes by presenting the research’s adjusted models and by
highlighting the main findings and providing a detailed description of each one.
6.2 Testing of Research Hypotheses
6.2.1 Factor Analysis
As mentioned in the previous chapter, factors analysis is used for classifying and
identifying groups of variables. It has been stated that multiple-item questions (based
on 5-point scales) were extensively used in this research to measure the contingent
variables which may influence the adoption, use, and success of IB services. A
detailed discussion of the results of the factor analysis and the reliability of the
variables used in this research is presented in the next sub-sections.
6.2.1.1 Satisfaction of IB Services
Based on the results of factor analysis (see Table 6.1), the variable of satisfaction of
IB services was divided into three dimensions. Therefore, it was decided to separate
items A7, A5, and A4 into one group, which measured the convenience of using the
IB services. The second dimension, which included three items (A6, A3, A1),
measured the time-saving dimension of IB services. The third dimension, which also
Page 223
207
include three items (A9, A2, A8), measured the fulfilment dimension of IB services.
All loadings were greater than .70. In addition, Cronbach’s alpha for convenience,
time saving, and fulfilment were 0.78, 0.73 and 0.82 respectively indicating
acceptable levels of reliability (Hair et al., 1998).
Table 6.1: Exploratory factor analysis for satisfaction of IB services.t 35
Items Convenience Time
Saving Fulfilment
A7. IB services offer self-services .908 A5. IB services are reliable effective strongly .873 A4. The transactions have low or no cost .852 A6. The transactions are done quickly .929 A3. IB services provide time saving .965 A1. Available 7 days and 24 hours .810 A9. Satisfied all my Islamic banking needs .889 A2. I can access my IB account from anywhere .863 A8. Satisfied all my banking needs .762
Extraction Method: Principal Component Analysis.
Rotation Method: Varimax with Kaiser Normalisation.
Rotation converged in 2 iterations.
6.2.1.2 Perceived usefulness of IB services
Table 6.2 illustrates the results of the factor analysis; these results confirm that the
variable of perceived usefulness of IB services was gathered in one dimension. In
addition, the Cronbach’s alpha for the perceived usefulness of IB services was 0.81,
indicating an acceptable level of reliability (Hair et al., 1998).
Table 6.2: Exploratory factor analysis for perceived usefulness of the IB services.t 36
Items Component 1
A10. Using IB services enables me to utilize banking services more quickly .827 A12. Using IB services for my banking services increases my productivity .819 A14. Using IB services makes it easier for me to utilise banking services .778 A13. Using IB services enhances my effectiveness of utilising banking services .736 A11. Using IB services improves my performance utilisation banking services .719 A15. Overall, IB is useful for me to utilise banking services .702
Extraction Method: Principal Component Analysis.
Rotation Method: Varimax with Kaiser Normalisation.
Rotation converged in 3 iterations.
6.2.1.3 Perceived ease of use of IB services
Based on the results of the factor analysis (see Table 6.3), the variable of perceived
ease of use of IB services was divided into two dimensions. Therefore, it was decided
Page 224
208
to separate items A16, A17, A20, and A21 into one type of perceived ease of use of
IB services, which measured the ease of use of IB services. The second dimension,
which included two items (A18 and A19), attempted to measure the interaction with
IB services. The Cronbach’s alpha for easiness and interaction was 0.76 and 0.75
respectively, indicating acceptable levels of reliability (Hair et al., 1998).
Table 6.3: Exploratory factor analysis for perceived ease of use of the IB services.t 37
Items Easiness Interaction
A17. I find it easy to do what I want to do in IB. .941 A21. Overall, I find IB services easy to use. .911 A20. It is easy for me to become skilful in the use of IB services. .838 A16. Learning to use IB services is easy for me .698 A18. My interaction with the use of IB services clear and
understandable. .982
A19 I find IB services to be flexible to interact with .730
Extraction Method: Principal Component Analysis.
Rotation Method: Varimax with Kaiser Normalisation.
Rotation converged in 2 iterations.
6.2.1.4 Security of IB services
The results of the factor analysis in Table 6.4 indicate that the variable of security of
IB services was gathered in one dimension. The Cronbach’s alpha for the security of
IB services was 0.84, indicating an acceptable level of reliability (Hair et al., 1998).
Table 6.4: Exploratory factor analysis for security of the IB services.t 38
Items Component 1
A22. Using IB services is financially secure .758
A23. I trust the ability of IB services to protect my privacy .680
A25. I trust in IB services as a bank .680
A 24. I trust in the technology that IB services .664
A26. Matters of security have no influence on using IB services .462
Extraction Method: Principal Component Analysis.
Rotation Method: Varimax with Kaiser Normalisation.
1 component extracted.
6.2.1.5 Awareness
The results of factor analysis shown in Table 6.5 indicate that the variable of
awareness of IB services was gathered in one dimension. In addition, the Cronbach’s
Page 225
209
alpha for awareness of IB services was 0.79, indicating an acceptable level of
reliability (Hair et al., 1998).
Table 6.5: Exploratory factor analysis for awareness.t 39
Items Component 1
A28. I have received enough information about the benefits of IB services. .743
A27. I have generally received enough information about IB. .743
Extraction Method: Principal Component Analysis.
Rotation Method: Varimax with Kaiser Normalisation.
1 component extracted.
6.2.1.6 Self-efficiency
In Table 6.6, the findings of the factor analysis show that the variable of self-
efficiency in using IB services was gathered in one dimension. The Cronbach’s alpha
for the Self-effeciency of IB services was 0.87, indicating an acceptable level of
reliability (Hair et al., 1998).
Table 6.6: Exploratory factor analysis for self-efficiency. t 40
Items Component 1
A29. I can use IB even if there is no one around to show me how to do it .463 A30. I can use IB with only the online help function for assistance .491
A31. I could use IB even if the system were changed .482
Extraction Method: Principal Component Analysis.
Rotation Method: Varimax with Kaiser Normalisation.
1 component extracted.
6.2.1.7 Availability of infrastructure
In Table 6.7, the findings of the factor analysis show that the variable of availability
of infrastructure of IB services was gathered in one dimension. Moreover, the
Cronbach’s alpha for the availability of infrastructure of IB services was 0.78,
indicating an acceptable level of reliability (Hair et al., 1998).
Table 6.7: Exploratory factor analysis for availability of infrastructure.t 41
Items Component 1
A2B1. Access to computer .905
A2B2. Access to internet .905
Extraction Method: Principal Component Analysis.
Rotation Method: Varimax with Kaiser Normalisation.
1 component extracted.
Page 226
210
6.3 Testing the hypotheses: factors relating to IB adoption
The hypotheses of this section investigate the relationships between the independent
variables (AWARENESS, RESISTANCE TO CHANGE, SELF-EFFICIENCY,
INFRASTRCTURE, EASINESS, INTERACTION, COST, SATISFACTION
[CONVENIENCE], SATISFACTION [TIME SAVING], SATISFACTION
[FULFILMENT], PERCIEVED EASE OF USE [EASINESS], PERCIEVED EASE
OF USE [INTERACTION], PERCIEVED USEFULNESS AVAILABILITY OF IsB,
AGE, EDUCATION and INCOME) and (ADOPTION). These hypotheses were
tested using MR. MR analysis was conducted in order to test the research hypotheses.
It identifies how much of the variance in the dependent variable will be explained
when several independent variables are theorised to influence it simultaneously. Thus,
a MR analysis is conducted, by which the independent (predictor) variables are jointly
regressed against the dependent (outcome) variable in an effort to explain the variance
in it.
In Table 6.8, the value of R for this model is 0.786, which is an indication that the
model provides a good explanation of the observed values of the outcome variable. R2
is 0.618, which means that the 2 variables included as predictors in the model account
for 61.8% of the variation in the adoption of IB services. The adjusted R2 gives an
idea of how well the model generalises and, ideally, it is better if the value of adjusted
R2 is close to the value of R
2. In the case of this model, the value of adjusted R
2 is
0.595, which is very close to R2.
Page 227
211
Table 6.8: Factors influencing adoption of IB services.t 42
Independent
variables
Unstandardised
coefficients
Standardised
coefficients t-value Sig.
Tolerance VIF
B Std. E Beta
(Constant: ADOPTION) 0.645 0.212 - 3.290 0.012 - -
AWARENESS 0.385 0.075 0.590 9.877 0.002 0.849 1.177
RESISTANCE -0.236 0.057 -0.225 -3.978 0.002 0.849 1.177
SELF-EFFICIENCY 0.365 0.122 0.280 3.455 0.020 0.399 2.509
INFRASTRCTURE 0.039 0.101 0.034 0.404 0.740 0.439 2.277
SECURITY -0.014 0.064 -0.014 -0.443 0.840 0.902 1.108
COST -0.298 0.083 -0.265 -3.961 0.020 0.699 1.430
SATISFACTION
(CONVENIENCE) 0.002 0.000 0.218 8.022 0.020 0.882 1.134
SATISFACTION
(TIME SAVING) 0.033 0.040 0.037 1.102 0.450 0.381 2.627
SATISFACTION
(FULFILMENT) 0.117 0.042 0.099 3.030 0.010 0.597 1.674
PERCIEVED EASE OF
USE (EASINESS) 0.196 0.052 0.170 4.090 0.031 0.348 2.876
PERCIEVED EASE OF
USE (INTERACTION) 0.199 0.046 0.146 4.770 0.031 0.629 1.590
USEFULNESS 0.088 0.037 0.054 1.002 0.319 0.566 1.766
IsB AVAILABILITY 0.097 0.031 0.113 3.440 0.008 0.891 1.122
AGE 0.081 0.073 0.049 1.015 0.340 0.701 2.638
EDUCATION 0.072 0.055 0.046 0.980 0.546 0.453 1.985
INCOME 0.111 0.050 0.093 3.155 0.010 0.601 2.359
R = 0.786 R2 = 0.618 Adjusted R2 = 0.595 [F = 75.508 Sig. 0.000] Durbin-Watson = 1.433
It can be seen from Table 6.8 that the F-ratio is 75.508, which is significant (P< 0.05).
This indicates that the improvement due to fitting the regression model is much
greater than the inaccuracy within the model (Field, 2000).
Reference to the three tests for multicollinearity (see Table 6.8) showed no high
correlation values; the VIF showed no values that exceed the generally accepted
maximum level of 10 (an indication of high levels of multicollinearity) and the
Page 228
212
tolerance values showed no values less than the maximum level of 0.2 (also an
indication of high levels of multicollinearity). Thus, no support was found for the
existence of a multicollinearity problem.
Finally, the DW test was performed to test if the residuals were correlated. The test
indicated a value of 1.433, which is considered to be between the acceptable levels
(less than 1 or greater than 3 are deemed to be unacceptable) (Field, 2000). In
reference to the regression model test results, Table (6.8), the following hypothesises
have been analysed, discussed and presented.
H1: Awareness of IB services will have a positive relationship with adoption of
IB services.
The model has confirmed the significant contribution of awareness in explaining IB
services adoption. It was shown in Table 6.8 that the results of MR in relation to
hypothesis 1 reveal that awareness (AWARENESS) has a significant relation with the
IB service adoption (ADOPTION) with a beta of 0.590 (t-value = 9.877). Thus, the
findings of the regression model indicate that research hypothesis 1, which predicts a
positive direct relationship between the awareness and IB service adoption, is
supported at the 0.05 significance level. Therefore, this hypothesis is fully accepted.
Awareness basically refers to the degree of familiarity people have with IB. In
hypothesis 1, it has been shown that the awareness level has a positive relationship
with IB service adoption. Sathye (1999) found that the degree of IB service adoption
is influenced by levels of awareness. The study conducted by Singer et al. (2001)
confirmed these regression results in which IB service adoption in western countries
resulted from high levels of awareness.
Page 229
213
The earlier results, however, agree with the empirical findings provided by
Rotchanakitumnuai and Speece (2003), in which IB service adoption was found to be
influenced largely by awareness, implying that recent media coverage has had an
important role to play in raising awareness in western countries. The empirical work
provided by Maenpaa et al. (2007), in which they examined the relationship of the
users’ knowledge with the IB service adoption, found that IB service adoption is
related to awareness.
The aforementioned results also agree with the argument of Laforet and Li (2005), in
which lack of adoption of IB services is often related to the amount of available
information and knowledge. As a result, it can be concluded that awareness has a
relationship with the extent of IB service adoption within the study area.
H2: Resistance to change in banking channels will have a negative relationship
with IB adoption.
The statistics relating to research hypothesis 2 reveal that resistance to change
(RESISTANCE) has a significant relationship with IB service adoption
(ADOPTION), with a beta of -0.225 (t-value = -3.978). Thus, the findings of the
regression model indicate that research hypothesis 2, which predicts a negative direct
relationship between resistance to change and IB service adoption, is supported at the
0.05 significance level. Therefore, the hypothesis is fully accepted.
The above result indicates that resistance to change in banking channels has a
negative relation with the IB service adoption. It has been argued that today’s global
competitive banks require an improved quality of banking channels with a focus on
the customers. These conditions require a banking enterprise to concentrate more on
continuous improvements in terms of their activities. An important issue relating to
Page 230
214
improvements is banking channels, which are considered to be an important
component of banking practices in the quest to simplify the acceptance of IB services,
and interaction with the continuous upkeep of the quality of IB services (Polatoglu
and Ekin, 2001).
Resistance to change in banking channels is a prominent issue that many banks are
confronting (Alagheband, 2006). It has been argued that improvement initiatives have
influenced the inclusion of banking performance. In this context, Sathye (1999)
provided evidence from Australia that the adoption of IB services was matched with
the resistance to change. As part of his study in developed countries, Al-Somali et al.
(2008) also found that resistance to any change in the normal banking channels
affected the adoption of IB services negatively. In the empirical work by Daniel
(1999), it was found that the new banking applications were strongly associated with
resistance to change in the UK. Based on the above arguments and findings, it can be
concluded that resistance to change the banking channels plays a major role in the
adoption of IB services.
H3a: Self-efficiency will have a positive relationship with the adoption of IB
services.
As shown in Table 6.8, the statistics relating to hypothesis 3a reveal that self-
efficiency in using IB services has a significant positive relation with IB service
adoption, with a beta of 0.280 (t-value = 3.455) at the 0.05 significance level. Thus,
the findings of the regression model indicate that research hypothesis 3a, which
predicts a positive direct relationship between self-efficiency and the adoption of IB
service, is supported at the 0.05 significance level. Therefore, the hypothesis is fully
accepted.
Page 231
215
The above direct results imply that self-efficiency in using IB services has a positive
relation with adoption of IB services. Bandura (1977) defined self-efficiency as one's
belief or judgement in what one can do with the skill one possesses within a particular
domain. The result indicates that the respondents’ self-efficiency in adopting IB
services should be complemented by banks' efficiency in order to increase the usage
of IB services (Pituch and Lee, 2006). This result may be justified based on the idea
that self-efficiency is expected to increase banks’ flexibility to do what they deem
appropriate to meet the specified goals, and in turn, increase their capacities (Wang et
al., 2003).
H4a: Availability of IB infrastructure will have a positive relationship with the
adoption of IB services.
As shown in Table 6.8, the statistics relating to hypothesis 4a reveal that the
availability of infrastructure has no significant effect on IB service adoption, with a
beta of 0.034 (t-value = 0.404). Thus, the findings of the regression model indicate
that hypothesis 4a, which predicts a direct positive relationship between the
availability of infrastructure and the adoption and use of IB services, were not
supported at the 0.05 significance level. Therefore, hypothesis 4a is fully rejected.
The above direct results do not support the direct relationship between the availability
of infrastructure and IB service adoption in SA. Interpretation of this contradictory
result is not easy, taking into consideration that previous empirical studies (Daniel,
1999; Sathye, 1999) have confirmed the positive relationship between the availability
of infrastructure and IB service adoption. In contrast, other empirical studies
(Pikkarainen et al., 2004) have found a relationship between the availability of
infrastructure and IB service adoption.
Page 232
216
H5a: High security will have a positive relationship with the adoption of IB
services.
As shown in Table 6.8, the statistics relating to hypothesis 5a reveal that the security
of IB services has no significant effect on IB service adoption, with a beta of -.014 (t-
value = -0.443). Thus, the findings of the regression model indicate that hypothesis
5a, which predicts a direct negative relationship between the security of IB services
and IB service adoption was not supported at the 0.05 significance level. Therefore,
hypothesis is fully rejected.
The research findings do not support the direct relationship between high security and
IB service adoption. Similarly, Karjaluoto et al. (2002) showed that security concerns
are not among the greatest obstacles to adopting IB. In contrast with the research's'
findings, Lee (2009) found that adopting the OB is adversely affected mainly by the
security/privacy risk, as well as financial risk”. This contradiction has been supported
by another recent study conducted by Hua (2009) regarding OB acceptance in China.
Hua (2009) showed that security is the most important factor influencing user's
adoption.
The positive and non-significant result that emerged may be justified based on the fact
that today, security differs from one country to another and from one bank to another.
This may create differences in people's perspectives from one country to another. In
SA, the government has established a very restricted internet law and legislation with
a filtering system in order to protect the culture and financial systems of Saudi
Arabian customers and the different Islamic values. With regards to that, Hermida
(2002), reported that there were 2,000 blocked sites by the Saudi government and,
Page 233
217
according to O’Connell (2008), this reached 400,000 sites in 2008, and this might
resulted to minimize the customer's security fears when adopting the IB.
H6a: High costs will have a negative relationship with the adoption of IB.
Table 6.8 shows the statistics relating to hypothesis 6a. The results reveal that the high
cost of IB services has a significant negative relation with IB service adoption, with a
beta of -0.265 (t-value = -3.961) at the 0.05 significance level. Thus, the findings of
the regression model indicate that research hypothesis 6a, which predicts a negative
direct relationship between the high cost of IB services and IB service adoption is
supported at the 0.05 significance level. Therefore, the hypothesis is fully accepted.
The regression result suggests that cost has a negative relation with IB service
adoption. The literature on the cost of IB service adoption and IB use supports these
results in which the adoption of IB services is associated with cost strategy (Sathye,
1999). It has been argued that cost choices negatively affect the adoption of IB
services (Daniel, 1999). On the other hand, the above result confirms that a low cost
strategy attracts people to the adoption of IB services. Therefore, IB service adoption
should complement the cost of activities (Sathye, 1999).
H7a: Satisfaction will have a positive relationship with the adoption of IB.
Customer satisfaction is defined by Solomon (2010), as the overall customer’s
feelings about a product/ service after they bought it. Kotler and Keller (2009) have
also defined customer satisfaction as a person’s feelings of pleasure or disappointment
that result from comparing a product’s perceived performance to their expectations.
The user satisfaction can be seen sum of user’s feeling and attitudes toward several
factors that affect the usage situation (Bailey et al., 1983). From the customer’s
perspective, IB facilities represent an effective approach to managing personal
Page 234
218
finances, as they are accessible 24 hours a day and 365 days a year from any location
and without the need to visit the bank (Rotchanakitumnuai and Speece, 2003). Based
on the results of the factor analysis (see Table 6.1), the variable of satisfaction of IB
services is divided into three components: the first is the convenience of IB services,
second is time saving when using IB services and the third is fulfilment of customer’s
needs with IB services. Therefore, this hypothesis is divided into three sub-
hypotheses: 7.1a, 7.2a and 7.3a.
H7.1a: Convenience will have a positive relationship with the adoption of IB.
Table 6.8 shows the statistics relating to hypothesis 7.1a. The results reveal that the
convenience of IB services has a significant positive relation with IB service
adoption, with a beta of 0.218 (t-value = 8.022) at the 0.05 significance level. Thus,
the findings of the regression model indicate that research hypothesis 7.1a, which
predicts a positive direct relationship between the convenience of IB services with IB
service adoption is supported at the 0.05 significance level. Thus, the hypothesis is
accepted.
Pew (2003) defined convenience in terms of lifestyle, workplace/housebound use, not
having to travel, personal safety, and not having to wait. Depending on the context,
studies demonstrate different approaches to end-user satisfaction research. Szymanski
and Hise (2000) supported the research findings and revealed that convenience, site
design and product information have the most important relationship with satisfaction
respectively when adopting IB.
H7.2a: Time saving will have a positive relationship with the adoption of IB.
Table 6.8 shows the statistics relating to hypothesis 7.2a. The results reveal that
saving time by using IB services has no a significant positive relation with IB service
Page 235
219
adoption, with a beta of 0.037 (t-value = 1.102). Thus, the findings of the regression
model indicate that research hypothesis H7.2a, which predicts a positive direct
relationship between saving time and IB service adoption is not supported at the 0.05
significance level. Therefore, the sub-hypothesis is rejected.
Interpreting the contradictory results is somewhat difficult, taking into consideration
that earlier studies confirmed the positive relationship between time saving in IB
services and the adoption of IB services (Polatoglu and Ekin, 2001). In parallel with
findings of this study, an empirical study conducted by (Khan, 2004) revealed that
time saving in IB services has no relation with the adoption of IB services.
H7.3a: Fulfilment will have a positive relationship with the adoption of IB.
Table 6.8 shows the statistics relating to hypothesis 7.3a. The results reveal that
fulfilment with IB services has a significant positive relation with IB service adoption,
with a beta of 0.099 (t-value = 3.030) at the 0.05 significance level. Thus, the findings
of the regression model indicate that research hypothesis H7.3a, which predicts a
positive direct relationship between customers' needs fulfilment with IB services
adoption, is supported at 0.05 significance level. Thus, the sub-hypothesis is accepted.
The above results indicate that customers’ needs fulfilment with IB services has a
positive effect on the IB adoption. Customer’s needs fulfilment with IB services
involves a philosophy emphasising excellence through continuous improvements in
IB services (Polatoglu and Ekin, 2001). It has been argued in the literature that
banking systems should be designed according to the characteristics of clients to fulfil
his needs when adopting the IB (Amin, 2007; Lee, 2009).
Page 236
220
From the previous results of sub-hypotheses (7.1b, 7.2b, and 7.3b), it can be generally
concluded that the satisfaction of IB services has a positive effect on the IB services
adoption. Therefore, hypothesis 7a is partially accepted.
H8a: Perceived ease of use will have a positive relationship with the adoption of
IB.
Perceived ease of use was defined by Davis (1989) as the degree to which a person
believes that using a particular system would be free of effort. Due to that and based
on the results of the factor analysis (see Table 6.3), the variable of perceived ease of
use of IB services is divided into two components: the first is ease of use of IB
services, and the second is interaction with IB. Therefore, this hypothesis should be
divided into two sub-hypotheses: H8.1a and H8.2a.
H8.1a: Ease of use of IB services will have a positive relationship with the
adoption of IB.
According to Table 6.8, the statistics relating to hypothesis 8.1a reveal that ease of
use of IB services has a significant positive effect on IB service adoption, with a beta
of 0.170 (t-value = 4.090) at the 0.05 significance level. Thus, the findings of the
regression model indicate that research hypothesis 8.1a, which predicts a positive
direct relationship between ease of use of IB services and IB service adoption is
supported at the 0.05 significance level. Therefore, the sub-hypothesis is accepted.
In line with this study finding, Cooper (1997) revealed that "ease of adoption" as one
of the three important characteristics from the customer's perspective for adoption of
innovative service. Daniel (1999) identifies "ease of use" as one of the factors for
customer acceptance in her study of e-banking in the UK and Ireland. In Australia, if
customers are not adopting IB, it could be because the Internet sites are not easy to
Page 237
221
operate (Sathye, 1999). In addition to that, Wang et al. (2003) in Taiwan extended
TAM model and found evidence that perceived ease of use had a significant positive
effect on people's intention to adopt IB.
H8.2a: Interaction will have a positive relationship with the adoption of IB.
Table 6.8 shows the statistics relating to hypothesis 8.2a. The results reveal that
interaction with IB services has a significant positive relation with IB service
adoption, with a beta of 0.146 (t-value = 4.770) at the 0.05 significance level. Thus,
the findings of the regression model indicate that research hypothesis 8.2b, which
predicts a positive direct relationship between interaction with IB services and IB
service adoption, is supported at the 0.05 significance level. Therefore, the sub-
hypothesis is accepted.
The literature supports the idea that interaction with IB services is associated with a
greater adoption of IB services. Interaction with IB services relates to the ability to
achieve and sustain a continuous improvement through customer satisfaction
(Guozheng et al., 2007). Empirical work by Polatoglu and Ekin (2001) supported the
proposition that, one of the important initiatives that encourages the adoption of IB
services; is interaction with IB services. Moreover, Casalo et al. (2008) found that IB
customers are more likely to adopt an IB if prior web site interactions were
satisfactory. From the regression results of the two sub-hypotheses (8.1a and 8.2a), it
can be generally concluded that perceived ease of use IB services has a positive effect
on the adoption of IB services. Therefore, hypothesis 8a is fully accepted.
Page 238
222
H9a: Perceived usefulness will have a positive relationship with the adoption of
IB.
According to Table 6.8, which relate to hypothesis 9a, the findings show that
perceived usefulness of IB services has no significant positive relation with IB service
adoption, with a beta of 0.054 (t-value = 1.002). Thus, the findings of the regression
model indicate that research hypothesis 9a, which predicts a positive direct
relationship between perceived usefulness of IB services with IB service adoption is
not supported at the 0.05 significance level. Therefore, the hypothesis is fully rejected.
The literature on IB services contradicts the regression result. A possible explanation
for the non-significant relationship is that the investment in IB systems might be more
costly when it cannot be clearly demonstrated to the customers. With regards to that,
the aforementioned results contradict with the findings that emerged in the study of
Al-Somali et al. (2008), in which the intensity of the perceived usefulness dimensions
were found to affect the extent of the adoption of IB services.
H10a: The availability of IsB will have a positive relationship with the adoption
of IB services.
Table 6.8 illustrate the statistics relating to hypothesis 10a. The results show that the
availability of IsB of IB services has a significant positive relation with IB service
adoption, with a beta of 0.113 (t-value = 3.440) at the 0.05 significance level. Thus,
the findings of the regression model indicate that research hypothesis 10a, which
predicts a positive direct relationship between the availability of IsB of IB services
and IB service adoption, IB use, and IB success, is supported at the 0.05 significance
level. Therefore, the hypothesis is fully accepted.
Page 239
223
The literature on IB supports the above result in which the adoption of IB services are
significantly associated with larger Islamic banks in SA. It has been argued that the
possible reason for the positive relationship between the availability of IsB in IB
services and IB adoption is the larger Islamic banks have relatively more resources to
use IB systems (Zainuddin et al., 2004).
H11a: Old age will have a negative positive relationship with the adoption of IB.
According to Table 6.8, which relate to hypothesis 11a, the findings show that age has
no significant relation with IB service adoption, with a beta of 0.049 (t-value =
1.015). Thus, the findings of the regression model indicate that research hypothesis
11a, which predicts a negative direct relationship between age and IB service
adoption is not supported at the 0.05 significance level. Therefore, the hypothesis is
rejected.
The findings of the regression model imply that age has no significant relation with IB
service adoption. It was argued in the literature that the extent of adoption of IB is
relatively different from one age group to another (Akinci et al., 2004). The result in
of this study is supported by Al-Somali et al. (2008), who found also that age has no
effect on the adoption of IB. Therefore, it can be concluded that the adoption of IB
services in Saudi banks is not related to age groups therefore this hypothesis is
rejected.
H12a: High educational level will have a positive relationship with the adoption
of IB services.
According to Table 6.8, which relate to hypothesis 12a, the findings show that
education has no significant relation with IB service adoption, with a beta of 0.046 (t-
value = 0.980). Thus, the findings of the regression model indicate that research
Page 240
224
hypothesis 12a, which predicts a positive direct relationship between education and IB
service adoption is not supported at the 0.05 significance level. Therefore, the
hypothesis is rejected.
The literature on IB services contradicts the above results in which the level of
education is necessary for coping with the adoption of IB. Empirically, Alagheband
(2006) found educational level had a positive relation with the adoption of IB
services. It has been argued that education is crucial not only to track the banking
performance but that education increases a customer's satisfaction and innovation,
which is essential to achieve an increase in the adoption of IB services (Al-Somali et
al., 2008). In addition to that, other researchers revealed that customers’ education
levels were found positively play a vital role in their adoption of the other channels of
the e-banking services (Al-Ashban and Burney, 2001; Poon, 2008). Therefore, the
hypothesis is rejected.
H13a: High income of the users will have a positive relationship with the
adoption IB services.
According to Table 6.8 which relate to hypothesis 13a, the findings show that income
has a significant relation with IB service adoption, with a beta of 0.093 (t-value =
3.155). Thus, the finding of the regression model indicate that research hypothesis
13a, which predicts a positive direct relationship between income and IB service
adoption is supported at the 0.05 significance level. Therefore, the hypothesis is
accepted.
These results imply that income level in SA leads to high degrees of IB service
adoption. The literature on income supports these results in which the adoption of IB
services are often associated with the level of income (Alagheband, 2006). In line
Page 241
225
with the finding of this study, and empirical findings reported by Lai and Li (2005)
indicate that there is a relationship between level of income and continuous IB
services, which supports the regression result. Thus, this hypothesis is fully accepted.
In reference to the previous paragraph analysis and the regression model test results,
presented in Table 6.8, the following research Adoption model has been developed
and concluded as shown in Figure (6.1).
Figure 6.1: The relations between the statistical significant factors and the IB adoption.f 50
6.4 Testing the hypotheses: factors relating to the IB use
The hypotheses of this section investigate the relationships between the independent
variables (SELF-EFFICIENCY, INFRASTRCTURE, EASINESS, INTERACTION,
COST, SATISFACTION [CONVENIENCE], SATISFACTION [TIME SAVING],
SATISFACTION [FULFILMENT], PERCIEVED EASE OF USE [EASINESS],
PERCIEVED EASE OF USE [INTERACTION], PERCIEVED USEFULNESS
AVAILABILITY OF IsB, AGE, EDUCATION, INCOME, AND ADOPTION) and
the dependent variables (USE). These hypotheses were tested using MR. Table 6.9
shows the results of the MR of these hypotheses in detail.
Page 242
226
Independent
variables
Unstandardised
coefficients
Standardised
coefficients
t-value Sig. Tolerance VIF
B Std. E Beta
(Constant: USE) 0.555 0.157 - 3.372 0.015 - -
SELF-EFFICIENCY 0.453 0.156 0.268 3.309 0.031 .399 2.509
INFRASTRCTURE 0.097 0.129 0.065 1.065 0.687 .439 2.277
SECURITY -0.131 0.083 -0.011 -1.887 0.216 .902 1.108
COST -0.248 0.107 -0.172 -2.554 0.031 .699 1.430
SATISFACTION
(CONVENIENCE) 0.057 0.058 0.230 6.780 0.001 0.882 1.134
SATISFACTION
(TIME SAVING) 0.081 0.030 0.111 4.455 0.020 0.381 2.627
SATISFACTION
(FULFILMENT) 0.116 0.037 0.106 3.155 0.031 0.597 1.674
PERCIEVED EASE OF
USE (EASINESS) 0.177 0.022 0.095 3.280 0.031 0.348 2.876
PERCIEVED EASE OF
USE (INTERACTION) 0.169 0.043 0.157 4.227 0.000 0.629 1.590
USEFULNESS 0.131 0.029 0.044 0.713 0.910 0.566 1.766
IsB AVAILABILITY 0.091 0.039 0.141 4.409 0.001 0.891 1.122
AGE 0.107 0.037 0.047 0.780 0.840 0.701 2.638
EDUCATION 0.122 0.044 0.055 0.980 0.550 0.453 1.985
INCOME 0.160 0.039 0.145 3.854 0.010 0.601 2.359
ADOPTION 0.350 0.057 0.264 7.475 0.001 0.382 1.076
R = 0.628 R2 = 0.394 Adjusted R2 = 0.387 [F = 65.252 Sig. 0.000] Durbin-Watson = 1.653
Table 6.9: Factors influencing IB services use.t 43
In Table 6.9, the value of R for this model is 0.628, which is an indication that the
model provides a good explanation of the observed values of the outcome variable. As
the value of R2 means that the 4 variables included as predictors in the model account
for 39.4% of the variation in the adoption of IB services. The adjusted R2, which is
0.387, is close to the value R2.
It can be seen from Table 6.9 that the F-ratio, which is 65.252, is significant (P<
0.05). According to the tolerance values and VIC values, no support was found for the
existence of any multicollinearity problem. Finally, the DW test indicated a value of
Page 243
227
1.653, which is considered to be between the acceptable levels. Therefore, this study’s
sample appears to conform what is expected for a fairly accurate model. In the
following, the tested hypothesises have been analysed, discussed and presented in the
next paragraphs.
H3b: Self-efficiency will have a positive relationship with the use of IB services.
As shown in Table 6.9 the statistics relating to hypothesis 3b show that self-efficiency
in using IB services has a significant positive relation with IB use with a beta of 0.268
(t-value = 3.309) at the 0.05 significance level. Thus, the findings of the regression
model indicate that research hypothesis 3b, which predicts a positive direct
relationship between self-efficiency in using IB services and the IB use, is supported
at the 0.05 significance level. Therefore, the hypothesis is fully accepted.
This finding suggests that self-efficiency in using IB services has a positive relation
with IB use. Users generally expressed confidence in their ability to use the internet -
a confidence acquired from multiple positive experiences and acquired familiarity
with the internet channel (Lichtenstein and Williamson, 2006). Other researchers
(Venkatesh and Davis, 1996; Wang et al., 2003; Lassar et al., 2005) supported this
finding and suggested that individuals with high computer self-efficiency are expected
to be able to use computer systems more regularly because they feel “comfortable”
about computers, in contrast with those with a low “strength” of self-efficiency.
H4b: Availability of IB infrastructure will have a positive relationship with the
use of IB services.
As shown in Table 6.9, the statistics relating to hypothesis 4b show that the
availability of infrastructure has no significant relation with IB use, with a beta of
0.065 (t-value = 1.065). Thus, the findings of the regression model indicate that
Page 244
228
hypothesis 4b, which predicts a direct positive relationship between the availability of
infrastructure and the adoption and use of IB services, were not supported at the 0.05
significance level. Therefore, this hypothesis is fully rejected.
This finding does not support the direct relationship between the availability of
infrastructure and IB service use. This result was not expected since it contradicts the
literature, which places an emphasis on the relationship between the availability of
infrastructure and IB service use (Sathye, 1999). However, the above result may be
justified based on Nath et al.’s (2001) argument that not all infrastructure
measurements are applicable to IB services use. In general, the results that emerged
from testing the hypothesis has shown unexpected findings; thus, it can be noted that
this result is consistent with Sathye’s (1999) argument that the effect of the
availability of infrastructure on IB service use is controversial and unclear.
H5b: High security will have a positive relationship with the use of IB services.
As shown in Table 6.9, the statistics relating to hypothesis 5b shows that the security
of IB services has no a significant relation with IB use, with a beta of -0.011 (t-value
= -1.887). Thus, the findings of the regression model indicate that hypothesis 5b,
which predicts a direct negative relationship between the security of IB services and
both IB service adoption and IB use, were not supported at the 0.05 significance level.
Therefore, the hypothesis is fully rejected.
This result does not support the direct relationship between high security and the IB
use. In contradiction with the finding of this study, Yousafzai et al. (2003) highlighted
the positive importance of security and privacy as two distinct analytical concepts,
when using the IB services. Moreover, the e-commerce usage has been found
significantly influenced by customer's perception about the level of security control
Page 245
229
that website has. Salisbury et al. (2001) also found that perceived security is a much
stronger determinant when using the online purchasing than the perceived ease of use
and usefulness of the website. Likewise, Miyazaki and Fernandez (2001) showed that
the rate of using the online product purchase is closely related to the perceived
security control possessed by a website.
Interpreting this contradiction; it might be due to the fact that Saudi customers' use the
internet mostly for conservative tasks such as communication; therefore, the security
concerns do not affect the customers’ attitudes when using IB services (Shafi, 2002).
In addition to that, Mahdi (2011) revealed how Saudi banks’ customers had very high
trust in using the e-banking services and strongly believed that e-banking services are
more secure.
H6b: High costs will have a negative relationship with the use of IB services.
Table 6.9 shows the statistics relating to hypothesis 6b. The result shows that high
cost of IB services has a significant negative relation with IB use, with a beta of -
0.172 (t-value = -2.554) at the 0.05 significance level. Thus, the findings of the
regression model indicate that research hypothesis 6b, which predicts a negative direct
relationship between the high cost of IB services and IB use is supported at the 0.05
significance level. Therefore, the hypothesis is fully accepted.
The above direct results imply that cost has a negative relation with IB service use.
The literature on the cost of IB service use supports this result and agrees with the
view of Polatoglu and Ekin (2001) that the cost strategy has to be adjusted to the
business strategy, and a low cost strategy also encourages people to use IB services.
In this context, the Wallis Report (1997) concluded that customers use new
technology if it is reasonably priced. It has also been argued that many banks monitor
Page 246
230
the efficiency and effectiveness of IB service use as a means of advancing
competitiveness and managing cost (Cooper, 1997).
H7b: Satisfaction will have a positive relationship with the use of IB services.
Based on the results of the factor analysis (see Table 6.1), the variable of satisfaction
of IB services is divided into three components: the first is the convenience of IB
services, second is time saving when using IB services and the third is fulfilment of
customer’s needs with IB services. Therefore, this hypothesis is divided into three
sub-hypotheses: H7.1b, H7.2b and H7.3b.
H7.1b: Convenience will have a positive relationship with the use of IB services.
Table 6.9 shows the statistics relating to hypothesis 7.1b. The result indicates that the
convenience of IB services has a significant positive relation with IB use, with a beta
of 0.230 (t-value = 6.780) at the 0.05 significance level. Thus, the findings of the
regression model indicate that research sub-hypothesis 7.1b, which predicts a positive
direct relationship between the convenience of IB services with the use of IB service,
is supported at the 0.05 significance level. Therefore, the sub-hypothesis is accepted.
The results of this study show that the convenience of IB services contributes to the
use of IB services. This finding is consistent with Polatoglu and Ekin’s (2001)
argument that the convenience of IB services contributes to the use of IB services, and
with the findings of the study by Pikkarainen et al. (2004), in which he indicated that
the convenience of IB services contributes to the usage and success of IB services.
H7.2b: Time saving will have a positive relationship with the use of IB services.
Table 6.9 shows the statistics relating to hypothesis 7.2b. The findings reveal that time
saving in IB services has a significant positive relation with IB use, with a beta of
Page 247
231
0.111 (t-value = 4.455) at the 0.05 significance level. Thus, the findings of the
regression model indicate that research sub-hypothesis 7.2b, which predicts a positive
direct relationship between saving time by using IB services with the use IB service,
is supported at the 0.05 significance level. Therefore, the sub-hypothesis is accepted.
Surprisingly, the regression results showed inverse and non-significant results for
time saving in IB services regarding the adoption of IB services, while time saving in
IB services was found to have a positive and significant relation with the extent of the
usage of IB services. Thus, sub-hypothesis 7.2b was supported for the effect of time
saving in the use of IB services. The regression results imply that time saving in IB
services has a positive relation with the usage of the IB services. In common with this
study, previous empirical studies have found that time saving in IB services was a
significant variable. For instance, Kassim (2006) reported that time saving in IB
services is positively associated with the use of IB services. In addition to that, recent
literature supported the research findings that time saving in IB services increases the
usage rates of IB services (Adesina and Ayo, 2010).
H7.3b: Fulfilment will have a positive relationship with the use of IB services.
Table 6.9 shows the statistics relating to hypothesis 7.3b. The results reveal that
customers' needs fulfilment with IB services has a significant positive effect on IB
use, with a beta of 0.106 (t-value = 3.155) at the 0.05 significance level. Thus, the
findings of the regression model indicate that research hypothesis 7.3b, which predicts
a positive direct relationship between customers' needs fulfilment with IB services
and IB service use is supported at the 0.05 significance level. Therefore, the sub-
hypothesis is accepted.
Page 248
232
The regression results indicate that customers’ needs fulfilment with IB services has a
positive relation with the extent of the IB usage. In the empirical work by Pikkarainen
et al. (2004), customer’s needs fulfilment with IB services was strongly associated
with the use and success of IB services. Thus, it can be concluded that customer’s
needs fulfilment with IB services plays a major role in using more IB services
(DeLone & McLean, 2003).
From the previous results of sub-hypotheses (H7.1b, H7.2b, and H7.3b), it can be
generally concluded that the satisfaction of IB services has a positive effect on the use
of IB services. Therefore, hypothesis 7b can be considered fully accepted.
H8b: Perceived ease of use will have a positive relationship with the use of IB.
As highlighted earlier and based on the results of the factor analysis (see Table 6.3),
the variable of perceived ease of use of IB services is divided into two components:
the first is ease of use of IB services, and the second is interaction with IB. Therefore,
this hypothesis should be divided into two sub-hypotheses: H8.1b and H8.2b.
H8.1b: Easiness of IB services will have a positive relationship with the use of IB.
According to Table 6.9, the statistics relating to hypothesis 8.1b show that easiness of
IB services has a significant positive effect on IB use, with a beta of 0.095 (t-value =
3.280) at the 0.05 significance level. Thus, the findings of the regression model
indicate that research hypothesis 8.1b, which predicts a positive direct relationship
between ease of use of IB services and IB use is supported at the 0.05 significance
level. Therefore, the sub-hypothesis is accepted.
In the empirical work, conducted by Agarwal and Karahanna (2000) argued that the
easiness of IB services associated with the use and success of IB services. Also, the
Page 249
233
longer an individual has been using IB, the more likely he is to find it easy to use and
then will lead to the IB services success (Prompattanapakdee, 2009). Similarly, the
easier it is for a user to interact with a system, the more likely it is that he or she will
find it useful.
H8.2b: Interaction will have a positive relationship with the use of IB services.
Table 6.9 shows the statistics relating to hypothesis 8.2b. The regression results reveal
that interaction with IB services has a significant positive effect on IB use with a beta
of 0.157 (t-value = 4.227) at the 0.05 significance level. Thus, the findings of the
regression model indicate that research hypothesis 8.2b, which predicts a positive
direct relationship between interaction with IB services and the use of IB service is
supported at the 0.05 significance level. Therefore, the sub-hypothesis is accepted.
The literature on IB supports the above result, in which interaction with IB services
has a positive relation with the extent of IB service adoption. It has been argued that
today’s banking environment can be characterised by intensified competition, market
changes and high customer demand. These conditions require a bank to focus more on
customers' continuous interaction with IB services (Kassim, 2006). The interaction
with IB services concept is consistent with the increasing use of IB services
(Guozheng et al., 2007). In general, it can be concluded from the two sub-hypothesis
(H8.1b and H8.2b) that perceived ease of use IB services has a positive effect on the
usage of IB services and therefore hypothesis H8b is fully accepted.
H9b: Perceived usefulness will have a positive relationship with the use of IB.
According to Table 6.9, which relate to hypothesis 9b, the findings show that
perceived usefulness of IB services has no significant positive effect on IB use, with a
beta of 0.044 (t-value = 0.713) at the 0.05 significance level. Thus, the findings of the
Page 250
234
regression model indicate that research hypothesis 9b, which predicts a positive direct
relationship between perceived usefulness of IB services with IB service use is not
supported at the 0.05 significance level. Therefore, this hypothesis is rejected.
Surprisingly, the literature on IB services contradicts the above result. In this context,
Pikkarainen et al. (2004) argued that IB services are used more when the level of
perceived usefulness of IB services is high. Furthermore, this result is not consistent
with the empirical work by Lai and Li (2005), who found that banks implementing the
IB services as they perceived the usefulness of the service. Interpreting this
contradictory result is not an easy task, given that earlier studies confirmed the
relationship between perceived usefulness of IB services and use of IB services
(Agarwal and Karahanna, 2000; Venkatesh and Davis, 2000).
H10b: The availability of IsB will have a positive relationship with the use of IB.
Table 6.9 illustrates the statistics relating to hypothesis 10b. The result reveals that the
availability of IsB of IB services has a significant positive relation with IB use, with a
beta of 0.141 (t-value = 4.409) at the 0.05 significance level. Thus, the findings of the
regression model indicate that research hypothesis 10b, which predicts a positive
direct relationship between the availability of IsB of IB services and IB service use is
supported at the 0.05 significance level. Therefore, the hypothesis is accepted.
As this result is significant with a positive direction, it can be concluded that Islamic
banks have more abilities and capabilities to deal with IB services in SA. Thus, it can
be concluded that Islamic banks are likely to make more use of IB services. With
regards to that, the aforementioned result is similar to the findings that emerged in the
study of Metwally (1996) and that of Al-Sultan (1999).
Page 251
235
H11b: Old age will have a negative relationship with the use of IB services.
According to Table 6.9, which is related to hypothesis 11b, the findings show that age
has no significant effect on IB use, with a beta of 0.047 (t-value = 0.780) at the 0.05
significance level. Thus, the findings of the regression model indicate that research
hypothesis 11b, which predicts a negative direct relationship between age and IB
service IB use is not supported at the 0.05 significance level. Therefore, the
hypothesis is rejected.
The findings of the regression result found that the age of the IB customers have no
significant relation with the extent of IB usage. This finding is in a conflict with the
literature as the use of IB services is associated with the age of customers. Therefore,
it can be concluded that the extent of use of IB services in Saudi banks is also not
related to age. The aforementioned result is in line with Akinci et al.’s (2004) findings
in Turkey which shows that middle-aged consumers are more likely than younger or
older consumers to use IB. Moreover, it should be noted that the aforementioned
results partially contradict the findings that emerged in the other e-banking studies of
Al-Ashban and Burney (2001) and Karjaluoto et al. (2002) in which different age
groups were found to affect the extent of the use of IB services.
H12b: High educational level will have a positive relationship with the use of IB.
According to Table 6.9 which is related to hypothesis 12b, the finding show that
education has no significant effect on IB use, with a beta of 0.055 (t-value = 0.980) at
the 0.05 significance level. Thus, the findings of the regression model indicate that
research hypothesis 12b, which predicts a positive direct relationship between
education and IB service use is not supported at the 0.05 significance level. Therefore,
the hypothesis is rejected.
Page 252
236
The literature on IB services contradicts with the regression result of this study as
Polatoglu and Ekin (2001) and Howcroft et al. (2002) higher educated customers are
positively related to the usage of the e-banking. Moreover, other literature found that
customers who are educated are more likely to use IB (e.g. Sathye, 1999; Mattila et
al., 2003).
H13b: High income of the users will have a positive relationship with the use IB.
According to Table 6.9 finding, which is related to hypothesis 13b, shows that
income has a significant effect on IB use, with a beta of 0.145 (t-value = 3.854) at the
0.05 significance level. Thus, the findings of the regression model indicate that
research hypothesis 13b, which predicts a positive direct relationship between income
and IB service adoption, IB use, and IB success, is supported at the 0.05 significance
level. Therefore, the hypothesis is fully accepted.
These results imply that individuals’ decisions with respect to IB services usage are
significantly influenced by the level of income. Eastin (2002) confirms that income
has a large relation with people’s decision to use or not to use of the IB services.
According to Al-Somali et al. (2008), as a result of a lack of income, people in
developing countries encounter problems in accessing the internet. Based on these
results and this argument, it can be concluded that high income has led to the high
degree of IB services use in SA, which support this regression result.
H14: Adoption of IB services will have a positive relationship with the use of IB.
According to Table 6.9, which relate to hypothesis 14, the findings show that the
adoption of IB services has a significant relation with the use IB, with a beta of 0.264
(t-value = 7.475). Thus, the findings of the simple regression model indicate that
research hypothesis H14, which predicts a positive direct relationship between the
Page 253
237
adoption of IB services and the use of IB is supported at the 0.05 significance level.
Therefore, the hypothesis is accepted.
The regression result is supported by literature as customers’ experience when
adopting the IB is positively associated with usage of the IB (Al-Ashban and Burney,
2001; Al-Gahtani et al., 2007). The greater adoption of IB leads to a more usage of IB
(e.g. Sathye, 1999; Al-Gahtani et al., 2007). Literature was found supporting the
regression findings and therefore the hypothesis can be accepted.
From the previous paragraphs and in reference to the Use regression model test
results, presented in Table (6.9), the following research Use model has been
concluded as shown in Figure (6.2).
Figure 6.2: The relations between the statistical significant factors and the IB use. f 51
6.5 Testing the hypotheses: factors relating to IB success
The hypotheses of this section investigate the relationships between the independent
variables (SATISFACTION [CONVENIENCE], SATISFACTION [TIME SAVING],
SATISFACTION [FULFILMENT], PERCIEVED EASE OF USE [EASINESS],
PERCIEVED EASE OF USE [INTERACTION], PERCIEVED USEFULNESS
Page 254
238
AVAILABILITY OF IsB, AGE, EDUCATION, INCOME and USE) and dependent
variables (SUCCESS). These hypotheses were tested using MR. Table 6.10 shows the
results of the MR of these hypotheses in detail.
Independent
variables
Unstandardised
coefficients
Standardised
coefficients
t-value Sig. Tolerance VIF
B Std. E Beta
(Constant: SUCCESS) 0.501 0.101 - 3.207 0.020 - -
SATISFACTION
(CONVENIENCE) 0.065 0.093 0.277 8.450 0.002 0.882 1.134
SATISFACTION
(TIME SAVING) 0.077 0.069 0.131 3.870 0.020 0.381 2.627
SATISFACTION
(FULFILMENT) 0.121 0.029 0.108 2.990 0.010 0.597 1.674
PERCIEVED EASE OF
USE (EASINESS) 0.184 0.041 0.047 0.855 0.910 0.348 2.876
PERCIEVED EASE OF
USE (INTERACTION) 0.178 0.031 0.154 4.550 0.002 0.629 1.590
USEFULNESS 0.126 0.057 0.040 0.122 0.891 0.566 1.766
IsB AVAILABILITY 0.077 0.027 0.133 4.208 0.008 0.891 1.122
AGE 0.117 0.058 0.035 0.115 0.740 0.701 2.638
EDUCATION 0.109 0.031 0.029 1.110 0.698 0.453 1.985
INCOME 0.186 0.020 0.163 4.561 0.008 0.601 2.359
Use 0.374 0.045 0.291 8.934 0.015 0.780 1.283
R = 0.546 R2 = 0.298 Adjusted R2 = 0.294 [F = 37.472 Sig. 0.000] Durbin-Watson = 1.706
Table 6.10: Factors influencing IB service success.t 44
Table 6.10 indicates that the value of R for this model is 0.546, which is an indication
that the model provides a good explanation of the observed values of the outcome
variable. R2 means that the 10 variables included as predictors in the model account
for 29.8% of the variation in the adoption of IB services. The adjusted R2, which is
0.294, is close to the value R2.
Page 255
239
It can be noted from Table 6.10 that the F-ratio, which is 37.472, is significant (P<
0.05). According to the tolerance values and the VIC values, no support was found for
the existence of any multicollinearity problems. Finally, the DW test indicated a value
of 1.706, which is considered to be between the acceptable levels. Thus, this study’s
sample appears to conform what is expected for a fairly accurate model. Therefore,
the following research tested hypotheses have been analysed, discussed and presented
in the next paragraphs.
H7c: Satisfaction will have a positive relationship with the success of IB services.
Based on the results of the factor analysis (see Table 6.1), the variable of satisfaction
of IB services is divided into three components: the first is the convenience of IB
services, second is time saving when using IB services and the third is fulfillment of
customer’s needs with IB services. Therefore, this hypothesis is divided into three
sub-hypotheses: H7.1c, H7.2c and H7.3c.
H7.1c: Convenience will have a positive relationship with the success of IB
services.
Table 6.10 shows the statistics relating to hypothesis 7.1c. The results reveal that the
convenience of IB services has a significant positive relation with IB success, with a
beta of 0.277 (t-value = 8.450) at the 0.05 significance level. Thus, the findings of the
regression model indicate that research hypothesis 7.1c, which predicts a positive
direct relationship between the convenience of IB services with IB service success is
supported at the 0.05 significance level. Therefore, the hypothesis is accepted.
The results of this study show that the convenience of IB services contributes to the
success of IB services. This finding is consistent with literature (Pikkarainen et al.,
2004; Al-Gahtani et al., 2007) argument that the convenience of IB services
Page 256
240
contributes to a more usage and success of IB services. It has been argued that today’s
globally competitive banks require an improvement in their service quality with a
focus on the customers. These conditions require a banking enterprise to concentrate
more on continuous improvements in terms of their activities to be convenient to their
IB customers’ to be competitive and successful (Guozheng et al., 2007).
H7.2c: Time saving will have a positive relationship with the success of IB.
Table 6.10 shows the statistics relating to hypothesis H7.2c. The result shows that
time saving in IB services has a significant positive effect on IB success, with a beta
of 0.131 (t-value = 3.870) at the 0.05 significance level. Thus, the findings of the
regression model indicate that research hypothesis H7.2c, which predicts a positive
direct relationship between saving time by using IB services with IB service success
is supported at the 0.05 significance level. Therefore, the sub-hypothesis is accepted.
The regression result found that time saving in IB services has a positive effect on the
success of IB services. In line with the findings of this study, previous literature have
found that time saving in IB services was a significant variable. Other researchers
supported this research finding (Nicholas, 1997; Karjaluoto et al., 2002; Lee et al.,
2005; Mangin et al., 2011), and reported that time saving in e-banking services is
positively associated with the success of IB services. It has been also argued in the
literature that time saving when use IS increases the success of that system (DeLone
& McLean, 2003).
H7.3c: Fulfilment will have a positive relationship with the success of IB services.
Table 6.10 shows the statistics relating to hypothesis 7.3c. The results reveal that
fulfilment with IB services has a significant positive relation with IB success, with a
beta of 0.108 (t-value = 2.990) at the 0.05 significance level. Thus, the findings of the
Page 257
241
regression model indicate that research hypothesis H7.3c, which predicts a positive
direct relationship between customers needs fulfilment with IB services and IB
service success, is supported at the 0.05 significance level. Therefore, the sub-
hypothesis is fully accepted.
The regression model indicates that customers’ needs fulfilment with IB services has
a positive relation with the success of IB services. This is consistent with literature
findings (Weill et al., 1999; Wixom et al., 2001; Rai et al., 2002). Another research
conducted by Pikkarainen et al. (2004), found that IB services fulfilment was strongly
associated with the use and success of IB services. Therefore, this suggests that IB
services fulfilment has major role in the success of the IB services (DeLone &
McLean, 2003).
From the previous results of sub-hypotheses (H7.1c, H7.2c, and H7.3c), it can be
generally concluded that the satisfaction of IB services has a positive effect on the
success of IB services. With regards to that, DeLone and McLean (2003) revealed
that “Use” must precede “user satisfaction”, as positive experience with “use” will
lead to greater “user satisfaction” which will then lead to the success of IB services.
In another word, users’ satisfactions will be impacted after frequent usage, not
initial adoption, by positive feelings towards the success or negative feelings
towards failure. So, it can be concluded that customers’ satisfactions is expected to
have a positive relation with IB usage and success.
H8c: Perceived ease of use will have a positive relationship with the success of IB.
Based on the results of the factor analysis (see Table 6.3), the variable of perceived
ease of use of IB services is divided into two components: the first is ease of use of IB
Page 258
242
services, and the second is interaction with IB. Therefore, this hypothesis should be
divided into two sub-hypotheses: H8.1c and H8.2c.
H8.1c: Easiness of IB services will have a positive effects on the success of IB.
According to Table 6.10, the statistics relating to hypothesis 8.1c reveal that
satisfaction with IB services has no significant positive relation with IB success, with
a beta of 0.047 (t-value = .855). Thus, the findings of the regression model indicate
that research hypothesis H8.1, which predicts a positive direct relationship between
ease of use of IB services and IB service adoption, IB use, and IB success, is partly
supported at the 0.05 significance level. Therefore, the sub-hypothesis is rejected.
The regression model found that there are no results to indicate that ease of use of IB
services has no significant relation with the success of IB services. In this context,
Agarwal and Karahanna (2000) argued that the ease of use of IB services can
systemise the management control system to cope with the changes in activities that
relate to customer needs. Probably, the reason behind this is that the experience of
Saudi banks in IB services is a new and there is a need for additional time to evaluate
the relationship between ease of use of IB services and success. Literature contradict
with the regression result of this study, as Prompattanapakdee (2009) found that the
longer an individual has been using IB, the more likely they are to find it easy to use.
Similarly, the easier it is for a user to interact with a system, the more likely it is that
he or she will find it useful and will lead to success (DeLone & McLean, 2003).
H8.2c: Interaction will have a positive relationship with the success of IB.
Table 6.10 shows the statistics relating to hypothesis 8.2c. The results reveal that
satisfaction with IB services has a significant positive relation with IB success, with a
beta of 0.154 (t-value = 4.550) at the 0.05 significance level. Thus, the findings of the
Page 259
243
regression model indicate that research hypothesis 8c, which predicts a positive direct
relationship between interaction with IB services and IB service success is supported
at the 0.05 significance level. Therefore, the sub-hypothesis is accepted.
The literature is consistent with the idea that interaction with IB services is associated
with a greater use and success of IB services. Interaction with IB services relates to
the ability to achieve and sustain a continuous improvement through customer
satisfaction (Guozheng et al., 2007). The literature on IB supports the above result, in
which interaction with IB services has a positive relation with the extent of IB service
use. It has been argued that today’s banking environment can be characterised by
intensified competition, market changes and high customer demand. These conditions
require a bank to focus more on customers' continuous interaction with IB services
(Kassim, 2006).
The interaction with IB services concept is consistent with the increasing use and
success of IB services (Guozheng et al., 2007). Empirical work by Polatoglu and Ekin
(2001) supported the proposition that one of the important initiatives that encourage
the usage of IB services is interaction with IB services. From the regression model
results of the sub-hypotheses (8.1c and 8.2c), hypothesis 8c is considered partially
accepted. It can be concluded that perceived ease of use of IB services has a positive
effect on the success of IB services.
H9c: Perceived usefulness will have a positive relationship with the success of IB.
According to Table 6.10, which relate to hypothesis 9c, the findings show that
perceived usefulness of IB services has no significant positive relation with IB
success, with a beta of 0.040 (t-value = 1.022) at the 0.05 significance level. Thus, the
findings of the regression model indicate that research hypothesis 9c, which predicts a
Page 260
244
positive direct relationship between perceived usefulness of IB services with IB
service success, is not supported at the 0.05 significance level. Therefore, the
hypothesis is fully rejected.
The literature on IB services contradicts with the model regression result. In this
context, perceived usefulness has a very important relation with customer interactions,
as it is an-other key success factor of e-bank, because e-bank is built for the provision
and extension of banking services (Guozheng et al., 2007). Explaining this
contradictory result is quite difficult, given that previous studies confirmed the
relationship between perceived usefulness of IB services and the success of IB
services (Venkatesh and Davis, 2000; Suh and Han, 2002; DeLone & McLean,
2003). In addition to that, Mangin et al. (2011) found that the influence of the
‘perceived usefulness’ on IB customers towards the successful implementation of IB.
A possible explanation for the non-significant relationship is that the investment in IB
systems in SA might be because of the lack of awareness of IB services, lack of
communication between Banks and IB customers or because the internet and IB
services charges are expensive for the Saudi IB customers.
H10c: The availability of IsB will have a positive relationship with the success of
IB services.
Table 6.10 illustrates the statistics relating to hypothesis 10c. The result shows that
the availability of IsB of IB services has a significant positive relation with IB
success, with a beta of 0.133 (t-value = 4.208) at the 0.05 significance level. Thus, the
findings of the regression model indicate that research hypothesis 10, which predicts a
positive direct relationship between the availability of IsB of IB services and IB
Page 261
245
service success, is supported at the 0.05 significance level. Therefore, the hypothesis
is fully accepted.
The literature supports the regression model result in which the success of IB services
are significantly associated with the availability of IsB services, as customers prefer
IsB services (Elbeck et al., 2010). Other studies concluded that customers' preference
for IsB services is remarkably culturally sensitive and shall be related to the success
of banks marketing strategy (Naser et al., 1999; Arasly et al., 2005; Jabnoun and
Khalifa, 2005; Amin and Isa, 2008). The model regression result is consistent with the
findings that emerged in the study of Metwally (1996) and that of Al-Sultan (1999).
As this result is significant with a positive direction, it can be concluded that the
availability of the IsB services are likely to make more use of IB services. Therefore,
the hypothesis is accepted.
H11c: Old age will have a negative relationship with the success of IB services.
According to Table 6.10, which relate to hypothesis 11c, the findings show that age
has no significant positive relation with IB success, with a beta of 0.035 (t-value =
0.115) at the 0.05 significance level. Thus, the findings of the regression model
indicate that research hypothesis 11c, which predicts a negative direct relationship
between age and IB service success, is not supported at the 0.05 significance level.
Therefore, the hypothesis is rejected.
The regression model results found that age has no significant relation with the
success of the IB services. Similarly, Akinci et al.’s (2004) found that middle-aged
consumers are more likely than younger or older consumers to use IB. The finding of
this study is in a conflict with the other literature who found that the usage and
success of the IB services is associated negatively with the age of customers (Al-
Page 262
246
Gahtani et al., 2007). Tele-banking usage is negatively associated with age (Al-
Ashban and Burney, 2001). In addition to that several studies found that customers
who are younger more likely to use IB (e.g. Sathye, 1999; Karjaluoto et al., 2002;
Mattila et al., 2003). As a result, the findings of the regression model also revealed
that age has no significant relation, thus it can be concluded that the success of IB
services is not associated with age groups. Therefore, the hypothesis is fully rejected.
H12c: High educational level will have a positive relationship with the success of
IB services.
According to Table 6.10, which relate to hypothesis 12c, the findings show that
education has no significant relation with IB success, with a beta of 0.029 (t-value =
0.110) at the 0.05 significance level. Thus, the findings of the regression model
indicate that research hypothesis 12c, which predicts a positive direct relationship
between education and IB service success is not supported at the 0.05 significance
level. Therefore, the hypothesis is fully rejected.
The literature is not consistent with the regression results in which the level of
education is necessary for coping with the success of IB. Liao & Cheung (2002)
found that the educational levels of customers’ financial performance is associated
with success of IB services. Thus, the educational level of customers is a necessary
step for IB to succeed in coping with the intensity of banking competition (Karjaluoto
et al., 2002).
H13c: High income of the users will have a positive relationship with the success
IB services.
According to Table 6.10, which relate to hypothesis 13c, the findings show that
income has a significant relation with IB success, with a beta of 0.163 (t-value =
Page 263
247
4.561) at the 0.05 significance level. Thus, the findings of the regression model
indicate that research hypothesis 13c, which predicts a positive direct relationship
between income and IB service success is supported at the 0.05 significance level.
Therefore, the hypothesis is accepted.
These results imply that individuals’ decisions with respect to IB services success are
significantly influenced by the level of income. Eastin (2002) confirms that income
has a strong relation with people’s decision to use or not to use of the IB services. Al-
Somali et al. (2008), found that the lack of income, people in developing countries
face difficulties in accessing the internet. As the more customers' interact with a
system, the more likely he or she will find it beneficial and will lead to success
(DeLone & McLean, 2003). Based on these results and this argument, it can be
concluded that high income has led to the high degree of IB services use in SA, which
support this regression result. Therefore, this hypothesis is fully accepted.
H15: Use of IB services will have a positive relationship with on IB success.
According to Table 6.10, which relates to hypothesis 15, the findings show that the
use of IB services has a significant relation with the success of IB services, with a
beta of 0.291 (t-value = 8.934). Thus, the findings of the MR model indicate that
research hypothesis 15, which predicts a positive direct relationship between the use
of IB services and the adoption of IB services, is supported at the 0.05 significance
level. Therefore, the hypothesis is accepted.
Literature support the regression result, as it has been argued that the greater usage of
IB services has influenced the inclusion of more performance measures within
banking systems. In this context, Eriksson et al. (2005) provided evidence from banks
in Estonia that the frequency of use of IB services was matched with the efficiency of
Page 264
248
IB services. In the empirical work by Emmanouilides and Hammond (2000) and by
Al-Gahtani (2001), the frequency of use of internet services was strongly associated
with the success of using internet services. Gerrard and Cunningham (2003)
commented in their study that the relative success of IB is derived from the frequency
of IB usage. Thus, it can be concluded that the use of IB services plays a major role in
the success of IB services. Therefore, the hypothesis is fully accepted.
From the previous paragraphs and in reference to the Success regression model test
results, presented in Table (6.10), the following research IB Success model has been
concluded as shown in Figure (6.3).
Figure 6.3: The relations between the statistical significant factors and the IB Success.f 52
Page 265
249
6.6 Findings and Discussion
In this sub-section, the research analysis findings are highlighted and discussed. The
conceptual model that is used to guide this research is shown in Chapter 2, Figure
2.15. The research’s conceptual model proposed three main facets and several
linkages with different independent variables, which were represented by several
hypotheses in Chapter 2. This chapter tested these hypotheses, used MR analysis, and
the results of these tests are summarised in the following Table 6.11.
H# IB Facets
Result Adoption Use Success
1 Awareness (+) Accepted
2 Resistance to change (-) Accepted
3 Self-efficiency (+) Accepted
4 Availability of IB infrastructure (+) Rejected
5 High security (+) Rejected
6 High costs (-) Accepted
7 Satisfaction (+) Accepted
8 Perceived ease of use (+) Accepted
9 Perceived usefulness (+) Rejected
10 Availability of IsB (+) Accepted
11 Old Age (-) Rejected
12 High Education (+) Rejected
13 High Income (+) Accepted
14 Adoption of IB services has a positive relationship with the use of IB. Accepted
15 Usage of IB services has a positive relationship with IB success. Accepted
Table 6.11: Results of the research hypotheses test. t 45
Table 6.11 shows that 5 out of the 15 research hypotheses are rejected, and 10 of them
are accepted, as discussed in the previous sub-sections of this chapter. The research
models addressed three main areas: adoption, use, and success of IB services. To meet
the research objectives and to answer the research's' questions; this section
summarises the factors which have a relation with the customers’ attitudes towards
the adoption, the usage and the success of IB services in SA, relying upon the results
of the hypotheses, since not all factors were found to influence the three facets and
Page 266
250
some factors were found to affect each facet differently. Hence, Figures 6.1, 6.2 and
6.3 show the adjusted models developed by this research based on the model
regression results and the analyses of the primary data.
Table 6.12: Variables Sig. and Beta values, comparision between IB adoption, use & success. t 46
This study contributed to the marketing research by advancing the knowledge and
extending, scientifically, previous model and theories, such as the TAM model theory
and DeLone and McLean (2003) IS success theory, by examining a wide range of
variables which have not been investigated before (e. g. Availability of IsB). This
study also responds to calls from several recent studies, e.g. by Brooksbank and
Taylor (2002), Al-Sabbagh and Molla (2004), Akamavi (2005), Cheng et al. (2006),
and Alsajjan and Dennis (2010), to examine the extent to which these variables are
Independent Variables Adoption Use Success
Sig. Beta Sig. Beta Sig. Beta
AWARENESS 0.002 0.590
RESISTANCE 0.002 -0.225 - - - -
SELF-EFFICIENCY 0.020 0.280 0.031 0.268 - -
INFRASTRCTURE - - - - - -
SECURITY - - - - - -
COST 0.020 -0.265 0.031 -0.172
SATISFACTION (CONVENIENCE) 0.020 0.218 0.001 0.230 0.002 0.277
SATISFACTION (TIME SAVING) 0.020 0.111 0.020 0.131
SATISFACTION (FULFILMENT) 0.010 0.099 0.031 0.106 0.010 0.108
PERCIEVED EASE OF USE (EASINESS) 0.031 0.170 0.031 0.095
PERCIEVED EASE OF USE (INTERACTION) 0.031 0.146 0.000 0.157 0.002 0.154
USEFULNESS - - -
IsB AVAILABILITY 0.008 0.113 0.001 0.141 0.008 0.133
AGE - -
EDUCATION - -
INCOME 0.010 0.093 0.010 0.145 0.008 0.163
ADOPTION 0.001 0.264
Use - 0.015 0.291
R2 0.618 0.394 0.298
Page 267
251
significant to the initial (Adoption), moderate (use) and long-term use (Success) of IB
services.
Results confirm that the different factors relate to IB adoption, use, and success, as
they are varied and have different levels of relationships. The research’s’ adoption,
use, and success of IB models were found explaining 62%, 39.4% and 30%,
respectively, of the SA adopters, users and successful IB customers attitudes. IB
acceptance studies should employ the researchers’ models to predict users'
behaviours, as applicable during adoption, use or success, because of the
comprehensiveness of these models as they have examined a good number of the
behavioural factors, and due to the fact that its parsimonious form capturing techno
and social beliefs. In addition to that, the researches’ models have shown high, good
and faire prediction powers (R²=62%, 39.4% and 30%,) compared with other models
(i.e. Suh and Han, 2002 R²=75%; Wang et al., 2003 R²=62%; Pikkarainen et al., 2004
R²=12.4%; Shih and Fang, 2004 R²=66%; Lallmahmood’s, 2007 R²=67%; Hosein,
2009 R²=32.2%;). In the following paragraphs, the research's findings of the different
factors relations with the three main facets (adoption, use and success) of IB are
presented below.
In this research, the attempts to use IB services or even the experience of using them
is considered a predictor for adoption (Al-Ashban and Burney, 2001), whereas greater
usage of IB (frequency of using IB) (e.g. Sathye, 1999; Al-Ashban and Burney, 2001)
is considered a predictor for IB usage. A number of factors have been suggested by
different researchers as being necessary for the success of new products or services
(Solomon, 1996; Lockett and Littler, 1997; Hawkins et al., 1998; DeLone and
Page 268
252
McLean, 2003). There are a number of factors which, if they are satisfactory, will
ensure a successful competitive performance for the organisation (Rockart, 1979).
Table (6.12) indicates that the adoption of IB services is strongly related to the
awareness level of people in the Saudi community. This finding is in line with Kotler
and Keller (2009), who suggested that new products and services go through a five-
stage adoption process: awareness, interest, evaluation, trial, and finally, adoption. In
addition to that, Table (6.12) also shows that resistance to change in the banking
channels has a direct negative effect on IB service adoption. Strong resistance to
change has led to a decreased demand for IB services. Thus, people prefer not to
adopt IB services. Resistance to change is part of social norms that effect on intention
to adopt IB. The result is confirmed with the study by Taylor and Todd (1995),
Venkatesh and Morris (2000) and Amin et al. (2007), found social norms to be an
important factor for adoption of IB.
This study found that self-efficiency is an essential principle used in the adoption and
use of IB services. As the relationship between self-efficiency and the adoption as
well as the usage of IB services suggests that self-efficiency contributes to an increase
in the adoption and use of IB services. Several studies are consistent with the research
findings, as different researchers (Venkatesh and Davis, 1996; Wang et al., 2003)
suggested that individuals with high computer self-efficiency are expected to be able
to use computer systems more regularly because they feel “comfortable” about using
computers, in contrast with those with a low “strength” of self-efficiency. The levels
of self-efficiency of people when using IB services represent a challenge for banks.
However, the challenge oscillates between attempts to secure the financial system and
efforts to make the usage and adoption of IB services easier in order to maintain the
Page 269
253
special interests of banks. In this research, many of the respondents were educated
and they had the skills to deal with computers. Such skills provide the potential for the
adoption and usage of IB services with high levels of self-efficiency. The logic behind
this is consistent with the results, which confirmed that self-efficiency has a positive
relation with the adoption and use of IB services. This suggests that current levels of
self-efficiency will increase the usage of IB services.
This study also found that cost is considered as an important factor which relates with
the adoption and use of IB services. High cost leads to a lack of adoption and usage of
IB services. Thus, cost has an important role in influencing the extent of the adoption
and usage of IB services (Sathye, 1999; Karjaluoto et al., 2002; Gonzalez et al.,
2004). The increase in cost leads to a decrease in the levels of adoption and usage of
IB services. Therefore, the findings point out that high cost has a negative relation
with the adoption and use of IB services. CITC (2010) conducted field and online
surveys investigated rating the internet broadband services prices provided to
households. The majority (79%) of the respondents rated the service as expensive to
very expensive, which is expected to have negative relationship.
This study also revealed that satisfaction of IB services is closely related to their
adoption, use, and success (Polatoglu and Ekin, 2001; Pikkarainen et al., 2004). From
the customer’s perspective, IB facilities provide a convenient and effective approach
to the management of personal finances, because, as mentioned previously, they are
accessible 24 hours a day and 365 days a year from any location and without the need
to visit the bank (Rotchanakitumnuai and Speece, 2003). The concept of convenience
refers to an effective banking system, saving time and increasing people's satisfaction
with IB services. Thus, an effective system of IB services will save the customer’s
Page 270
254
time and money, increase the customers satisfaction and should result in more
adoption, use and high success. “Use” must precede “user satisfaction”, as positive
experience with “use” will lead to greater “user satisfaction” which will then lead to
the success of IB services (DeLone and McLean, 2003). Similarly, increased “user
satisfaction” will lead to increased “intention to use” and thus to “use”. An effective
system often leads to people's satisfaction with IB services’ IS. The customer
satisfaction of IB services in SA depends on several elements, including the
availability of infrastructure, information and skilled human resources in using a
computer. Hence, the satisfaction of IB services relates positively to their adoption,
use and success. This relationship was shown in the results, as the satisfaction of IB
services has a positive relation with their adoption, use, and success.
Perceived ease of use of IB services also has a relationship with the adoption, use and
success of IB services. In SA, banks have the ability to make their services easier to
use. Perceived ease of use of IB services leads to an increase in use of IB services.
Therefore, it is reasonable to consider that perceived ease of use of IB services is
positively related to the level of adoption, usage and success of IB services. This
research revealed that the longer an individual is using IB, the more likely he or she is
to find it easy to use (Prompattanapakdee, 2009). Similarly, the easier it is for a user
to interact with a system, the more likely it is that he or she will find it useful. There is
substantial empirical support for this view (Chau, 2001; Amin, 2007; Rigopoulos &
Askounis, 2007; Lee, 2009). It affects the consumers' intentions to use IB.
A high quality service is one that is easy for the customers to adopt and use. Ease of
use will depend on the web content and web design of the bank’s website; this will
determine the usability or the user friendliness. Also, researchers (Eriksson et al.,
Page 271
255
2005; Al-maghrabi & Dennis, 2010; Alsajjan & Dennis, 2010; Al-Majali & Nik Mat,
2011) found that the usability and accessibility of IB will determine the bank’s
success. Banks need to ensure that their online services are easy for customers to use
to encourage their acceptance. Customers need to feel comfortable with the
technology before being able to adopt it. Thus, this relationship, which was shown in
the results as perceived ease of use of IB services, has a positive relation with the
adoption, use and success of IB services.
One of the main contribution to knowledge, this research found that there are a
significant relationship between the availability of IsB and the adoption, use, and
success of IB services. The adoption, use, and success of IB services are expected to
be high when the Islamic banks are available online in SA, because the other
commercial and investment banks are not enough for people. Hence, Islamic banks
can enable people to adopt and use IB services. In other words, the availability of IsB
has a function to enable people to respond effectively to IB services. This relationship
is consistent with the findings of other studies (Metwally, 1996; Al-Sultan, 1999;
Zainuddin et al., 2004), since the availability of IsB and applying its standards has a
positive relation with the adoption, use, and success of IB services.
This study also found that income affects most of the components that contribute to
the adoption, use, and success of IB services, such as computer ownership, connection
to the internet and quality of services (Jayawardhena and Foley, 2000; Karjaluoto et
al., 2002). In SA, incomes are often between medium and high. Therefore, this study
found that the level of income is positively related to the adoption, use, and success of
IB services. Hence, the results show that income has a positive relation with the
adoption, use and success of IB services.
Page 272
256
A longer adoption of IB services indicates the need for IB services. Under this need,
the adoption of IB services creates more frequency of use and the use of a wide range
of services (e.g. Sathye, 1999; Al-Ashban and Burney, 2001). The frequent use of an
IS has been understood in many studies as signifying user acceptance of the IS (Davis
et al., 1989; Davis, 1993). Therefore, this study suggested that the continuous
adoption of IB services remains an easy matter due to the wide range of services used
which, in turn, allows more frequency of use of IB services; thus, the adoption of IB
services remains high. Moreover, with the revolution of the SA stock market and e-
payment system and e-government, the possibility of the frequent usage of IB has
become greater than before. Therefore, this relationship was shown in the results as
adoption having a positive relation with the frequency of use and range of IB services.
Surprisingly, the research’s findings show that the security of IB services has no
significant relation with IB adoption and use. Thus, the findings of the regression
model indicated a direct negative relationship between the security of IB services, and
IB service adoption and IB use. This finding is in contrast with other studies as
security has been identified as a key customer concern in other IB adoption studies
(e.g. Black et al., 2002; Siu and Mou, 2005; Poon, 2008; Adesina and Ayo, 2010).
The research findings revealed, after investigating the Saudi environment, that the
familiarity and awareness of the IB risks and dangers were not enough to mitigate
them. As a result, Saudis generally do not complain when they fall victim to internet
cybercrimes (Humaidan, 2010). In addition, Shafi (2002) found that Saudi businesses
use the internet mostly for conservative tasks.
Page 273
257
6.7 Chapter Summary
In summary, this chapter presented the results of inferential statistics, such as
multicollinearity tests, factor analysis, correlations and MR. All those methods of
analysing the findings were explained and discussed briefly and a comparative
argument from the literature was presented.
Factor analysis was used in this research to classify each variable into a set of
dimensions. Such classification can contribute to a more accurate determination of the
relationships and influences between the variables (Field, 2005). The Cronbach’s
alpha was used in this research to test the internal consistency and to measure the
reliability of the variables resulting from the factor analysis. The results of
Cronbach’s alpha test were presented in this chapter and all loadings were greater
than .70, which indicates acceptable levels of reliability (Hair et al., 1998).
Multicollinearity tests were undertaken also, and the results were presented in detail,
as they might cause a problem for MR since it can affect the parameters of a
regression model (Field, 2005). In addition, the DW test was performed to test if the
residuals were correlated. The test values were found to be between acceptable levels
(less than 1 or greater than 3 are deemed to be unacceptable) (Field, 2000).
MR analysis was used in this research to test the research hypotheses. This type of
analysis was used to analyse the relationship between a dependent variable and a set
of independent variables (Hair et al., 1998). The main objective of MR analysis is to
use independent variables whose values are known to predict the single dependent
value (Hair et al., 1998). The results of the analysis were presented in this chapter and
revealed that 5 out of the 15 research hypotheses were rejected, and 10 of them were
accepted.
Page 274
258
Finally, this chapter concluded that awareness of and resistance to change are
affecting only the adoption of IB services, whereas self-efficiency and high cost are
affecting the adoption and use of IB services. It was also concluded that perceived
ease of use, satisfaction, availability of IsB services and income were very important
factors as they affect all facets (adoption, use and success) of IB services. In the
following chapter, the main conclusion and research findings will be discussed; in
addition, the different implications will be highlighted and finally recommendations
for future research will be made.
Page 275
259
Chapter Seven
Conclusion and Implications
7.1 Introduction
IB is clearly and attractively and potentially rich research context (see Sathye, 1999;
Shanmugam & Guru, 2000; Al-Ashbin & Burney, 2001; Jun & Cai, 2001; Polatoglu
& Ekin, 2001; Black et al., 2002; Gerrard & Cunningham, 2003; Ndubisi & Sinti,
2005; Lam & Burton, 2006), but there is limited empirical work which captures the
nature and essence of Internet adoption, use and success, especially in the banking
sector in SA, nor analyse of success factors to help form a strategic agenda. The
upshot of this thesis deemed to provide a theoretical contribution rests in a scholar’s
ability to produce thinking that is original in its insight and useful in its application.
Therefore and in order to facilitate the discussion in this chapter, Corley and Gioia's
(2011) theoretical contribution model has been utilized to characterise the research's
contribution, as introduced in Chapter 1. In their view, the originality1 and utility
2
dimensions usually are treated as working together to produce varying levels of
theoretical contribution.
This research contriputed to knowledge in several aspects and mainly its key strength
is extending the marketing literature by investigating the factors that have relations
with the IB utilizations. This research also sought to provide a better understanding of
the adoption, use, and success of IB services. In particular, an effort has been made to
provide a better understanding of how IB services are provided by banks. In addition,
this study utilised marketing theory to develop a theoretical framework to examine the
1 Originality can be categorized as either (1) advancing understanding incrementally or (2) advancing
understanding in a way that provides some form of revelation (Corley and Gioia, 2011).
2 Utility parses into (1) practically useful and (2) scientifically useful (Corley and Gioia, 2011).
Page 276
260
contingent relationships between the adoption, the use, and the success of IB services
and a set of different factors, such as awareness, resistance to change, self-efficiency,
perceived ease of use, perceived usefulness, security, cost, availability of
infrastructure, availability of IsB, income, age, and education.
In addition, this study utilised, redefined, and expanded the previous research and
literature in the marketing of IB services. In particular, the examination of the
literature indicated that the determinants of the adoption of IB services varied across
studies. For example, Chung and Paynter (2002) and Pikkarainen et al. (2004)
measured the extent of IB service use through a self-rating questionnaire about the
elements of IB service. Other studies (e.g. Sathye, 1999; Wungwanitchakornm, 2002;
Al-Sabbagh and Molla, 2004; Chan and Lu, 2004; Cheng et al., 2006) defined the
extent of IB service use as multi-perspective sets of both adoption and use measures.
The reliability of the statements in the literature that were based on such research was
found to be rather limited. Thus, developing a valid comprehensive theoretical model
that is empirically tested should be of benefit to practitioners, academics, and
researchers wishing to investigate these areas further.
This study builds on the works of the aforementioned studies in terms of developing a
wider, more accurate, and more comprehensive models of IB adoption, use and
success. In particular, three facets have been utilised to determine the actual extent of
IB service use, as a new service in the SA market. The first facet was used to identify
the concept of the adoption of IB service and the factors influencing it. The second
facet was designed to determine the actual usage of IB service, which was influenced
by several factors. The third facet was utilised to ensure that the success perspectives
are really used in banks. Finally, this study is one of the first to incorporate several
Page 277
261
contingent variables in one model and investigate their effect on the adoption, use,
and success of IB services. Therefore, it could be argued that this study has
successfully met its three main research objectives (introduced in Ch. 1):
1. To establish how the SA IB market differs from IB markets in other countries.
2. To investigate the relations between different factors (e. g. demographics) and
IB services, from the customers’ point view, in developed and developing
economies.
3. To capture the most relevant factors that relate, from customers point view,
with the IB market in SA.
4. To understand the main differences between the different facets (adoption, use
and success) of IB services
5. To understand the relations between the customers' attitudes and the a)
adoption, b) use, and c) success of IB services in SA.
6. To establish well developed theoretically and tested empirically models of the
aforementioned facets.
7. To recommend some innovative ideas, solutions and improvements, which can
contribute to the enhancement and development of the adoption, use, and
success of IB services in SA, based on the successful tested models.
In order to meet the above research objectives, the study utilised, redefined and then
expanded the previous work presented in fields of IB and marketing by several
authors (e. g. Sathye, 1999; Chung and Paynter, 2002; Wungwanitchakornm, 2002;
Al-Sabbagh and Molla, 2004; Chan and Lu, 2004; Pikkarainen et al., 2004; Cheng et
al., 2006). A questionnaire survey was conducted to quantify the factors of interest
and to test the hypothesised relationships between the independent variables and the
dependent variables, as depicted in the research model.
The study utilised descriptive and advanced multivariate statistical techniques. MR
analysis, correlation analysis and factor analysis were used, enabling SPSS software
Page 278
262
version 17 to test the research hypotheses. A summary of the major findings emerging
from the descriptive statistics and advanced multivariate analysis is presented and the
major implications of this research for both academic and planning practices are
presented in this chapter. The limitations of this research are outlined followed by
suggested future research directions. Having discussed the regression results in the
chapter 6; it is of benefit for the research to discuss the internal and external validity.
7.2 Discussion and summary of main findings
7.2.1 Market status of IB services in SA
There is considerable variation among SA banks in the adoption, use, and success of
IB services. The empirical findings reveal that the range of IB services is moderate in
SA. Significantly, the level of use of IB service differs across customers. The
empirical findings also reveal that this variation can be linked to factors related to the
respondents (e.g. awareness, income, skills, perceived ease of use and cost). Thus, it
can be concluded that there are differences among banks’ marketing strategies of IB
services which affect their customers’ attitudes differently. The empirical findings
also show that people preferred the banks offering IsB services. The Islamic rules
which forbid dealing with commercial banks have contributed to the success of IB
services for the banks offering IsB more than for conventional banks. Therefore, the
extent of IB service use in conventional banks is quite low compared with those banks
which offer IsB services. This result indicated that three major banks, namely, Al
Rajhi Bank, NCB, and Arab National Bank, have attracted 81.6% of the respondents
because of the availability of IsB services at those banks.
It can be concluded that IB in SA continues to be an important aspect of the banks
evaluation. However, the type of IB service used by customers depends on banks’
Page 279
263
marketing strategies, which may also need continuous evaluation, as the types of IB
services selected by customers with a high level of income will differ from those
selected by customers with a lower income. The findings of this study indicate that
income is a common factor that would affect customers’ attitudes towards the
adoption, use and success of IB services. This supports the notion that the evaluation
of IB services is linked to banks’ strategies. However, it should be noted that in this
study, respondents were not asked how their banks actually link their strategies to
people's perspective or how they establish the connections between the needs of banks
and people. Therefore, these two results shall be treated with some caution.
7.2.2 IB adoption: The Key Relations
The findings of this study established that among all the factors investigated, there are
eight factors affecting the adoption of IB services. It should be noted that all the
results presented in Chapter 6 were confirmed through the direct relationships
between the independent variables, including awareness of IB services, resistance to
change, self-efficiency, perceived of ease of use, high cost, availability of IsB,
income, and the dependent variable (i.e. the adoption of IB services) as presented in
Figure (6.1).
Resistance to change has been found to have a relationship with the adoption as it
maybe related to dissatisfy with the information and guidance offered by the bank
and/or only psychological resistance to IB. Facing this need should be associated with
preparing to change from the present ways of operating. In addition to that awareness
has been found to have a relationship with the adoption of IB, as banks should
increase the awareness, decrease the resistance to change, and lower the cost of IB
services, as these factors were found to affect the new adopters of IB services
Page 280
264
significantly (Sathye, 1999). Regarding this, high income was found to affect the
adoption of IB services positively; therefore, the banks should target customers with a
higher income by motivating them to utilize IB services and giving them special IB
accounts, where they can adopt IB services with a high level of support. Satisfaction,
ease of use of IB services, the availability of IsB services and self-efficiency were
found to affect the adoption of IB services positively. Therefore, bankers shall
enhance their IB services to meet customer needs.
7.2.3 IB Use: The Key Relations
As illustrated in Figure 6.2, the major findings indicate that greater self-efficiency in
using IB services contributes to the use of IB services in Saudi banks. However, one
of the main challenges facing the use of IB services is the higher cost of the internet
and IB services in SA as highlighted in chapter 3. The regression analysis results also
indicate the same findings, as a strong negative relation with the usage of the IB
services might be resulted if no attention been given to the cost factor. Satisfaction,
perceived ease of use, the availability of IsB and the income were found having a
positive relationship with the usage of the IB services. Bankers should improve their
relationships with their IB customers by improving their services and provide
satisfactory services, and then maintain customer loyalty.
Banks need to continually improve the provided services to ensure that IB does not
diminish the relationship with their customers (Gonzalez et al., 2004). If banks wish
to survive in the online home-banking age, they have to earn customer loyalty through
product features and service excellence rather than allowing loyalty to stem from
customer inertia (Daniel, 1999). Customers utilize IB because it offers convenience,
saves time, and maintains privacy. In addition to that, eight out of ten e-bankers in the
Page 281
265
U.S. ranked satisfaction and saving time as important; four out of ten e-bankers said it
was very important to bank without the need to talk to anyone (George, 2002).
Adoption has been also found in chapter 6 as one of the strongest factors that relates
with the customers’ attitudes towards the usage of IB services. When an individual
begins to adopt the IB services, they will be motivated to continue their use, but if the
individual continues to place a high value on personal relationships, then this will
have a negative effect on their intention to use the services (Prompattanapakdee,
2009). Thus, the duration of the experience with the technology has been found to
capture the customer’s intention to use the technology (Safeena et al., 2011).
The new adopters of the IB service are expected to be light users and very critical
users where they will stay and become the medium and heavy user or they might
leave adopting IB due to negative feelings. Pre-emptive actions should be taken by the
banking sector in order to increase the retention of IB users. For the new users who
are expected to be light user, incentives should also be emphasized. The light user can
become a non-user when they are no longer using the IB. As a result, this research
proposes the implementation of IB quality as integral constituents to maintain and
increase the IB users’ retention to become regular users (Raman et al., 2008). The
adoption of IB can be increased by the attractive incentives and encouragement.
Human beings are likely to be motivated and influenced by incentives. Based on the
survey, adoption of IB is showing a great deal in the development with 72% of the
respondents having adopted IB (Raman et al., 2008).
Figure (6.2) shows that one of the most important factors contributing to the use of IB
is the current adoption of IB services. It was argued that the frequency of services
used in most banks is related to the adoption of IB services. The research model
Page 282
266
suggests that the adoption process is influenced by several factors, such as increasing
the customers’ awareness, decreasing the resistance to change, convenience with the
provided service and the ability to deal easily with the service. These factors were
found to provide opportunities for maximizing the frequency and range of services
used by customers. Agarwal and Prasad (1997) studied both initial system usage and
the intentions of future use and found that different factors affected initial use versus
future use of the WWW. Similarly, Karahanna et al. (1999) found that factors
associated with “intention to use” windows differed between potential adopters and
continuing users. These two empirical studies demonstrate that early use and
continued use can differ.
7.2.4 IB Success: The Key Relations
The research results reveal that the satisfaction (convenience) of IB services has a
significant positive effect on the success of IB services. The satisfaction
(convenience) of IB services stems from the quality of the services. High standards in
the quality of service in Saudi banks are indicative of the satisfaction (convenience) of
IB services. This suggests that the proper Internet connection, in particular speed, in
SA had encouraged people to adopt and use of IB services. In addition to that, the
type of IB services is consistent with the local socio-cultural context, since the SA is
controlled Internet by the government through blocking access material that violates
religion or encroaches on local culture. Figure (6.3) shows the different factors
affecting the success of IB services.
The findings of this research reveal that the perceived ease of use of IB services
affects positively the success of IB services. These results align with several studies
(Eriksson et al., 2005; Al-maghrabi and Dennis, 2010; Alsajjan and Dennis, 2010; Al-
Page 283
267
Majali & Nik Mat, 2011). This suggests that IB services should be simplified when
people try to use them. However, IB services are a changeable process and this, in
turn, leads to the reassessment and amendment of the services to make them easier to
use. Banks were found to be more flexible and better able to utilise the technological
changes in order to make IB services easier to use in Saudi. Mattila (2001) concedes
that customer satisfaction is a key to success in IB and banks will use different media
to customize products and services to fit customers' specific needs in the future. Thus,
the perceived ease of use of IB services has had a strong relation with the IB success.
Many people who live in SA are Muslim, and Islamic rules forbid dealing with
commercial banks due to the interest (Riba). Such a religious principle helps the
Islamic banks be more competitive in providing their services. However, the
availability of the IsB of IB services reflects the fact that the Islamic banks provide
high standards in their IB services. Therefore, the availability of the IsB services
within the IB services was found to have a significant positive effect on the success of
IB services. The findings also show that income level has a significant relation with
the success of IB services. In general, the level of income in SA is high compared
with the other developing and Arab countries. Medium and high incomes have led to
a rising demand for IB services. This result suggests that people are able to afford a
computer and to have an internet service. As a result, income level plays an important
role in the success of IB services.
In a study about IB in Islamic countries, Guru et al. (2003) showed that the majority
of Islamic countries are still in the early stages of developing IB. Only some Islamic
banks in the Middle East have well-developed IB websites for the satisfaction of their
customers. Bailey et al. (1983) state that several factors affect the user satisfaction and
Page 284
268
it can be seen as a bi-dimensional attitude. The user satisfaction can be seen sum of
user’s feeling and attitudes toward several factors that affect the usage situation
(Bailey et al., 1983). In general, it has been reported that IB saves time and money
and has a positive relation with customer satisfaction towards the usage and success
of IB (Mattila, 2001; Karjaluoto et al., 2002).
The research findings revealed that IB success was supported by increasing the
customers’ satisfactions, and the frequency of using of IB services. Figure 6.3 show
that the use of IB services has a significant positive relation with the success of IB
services. The results suggest that the IB system is effective. These is because of
customers’ satisfaction from the IB services, such as saving the customer’s time and
fulfil their needs, in addition to the availability of technical capabilities, information
and databases, and easy-to-use IB services. These elements would contribute in
increasing the frequency of the use the IB services, which will be reflected in
maximising the success of the IB services. As a result, the frequency of using the IB
services was found having a significant relation with the success of the IB services.
DeLone and McLean (2003) stated that system usage is clearly a key variable in
understanding IS success. Information quality and customers high satisfactions have
proven to be strongly associated with system use and success (Weill et al., 1999;
Wixom et al., 2001 and Rai et al., 2002) and especially in the context of e-commerce
systems (Liu et al., 2000; D’Ambra et al., 2001; Molla et al., 2001; Teo and Choo,
2001; Palmer, 2002).
Despite the dissimilarity between the factors which relate with the adoption, use and
success of IB services in SA and western countries such as Australia and the UK in
terms of availability of IB infrastructure, security level, perceived usefulness, cost,
Page 285
269
age of user and education levels, they are similar to each other in terms of the
awareness, self-efficiency, satisfaction, perceived ease of use of IB services and
income levels. Both of these areas have succeeded in managing IB services, where
they able to develop real IB services. However, despite this similarity, there are
variations between them regarding the management of IB services. This is because of
the differences in the socio-economic and cultural context. In SA, the management of
IB services is largely linked to the Islamic banks, and therefore, the Islamic model
focuses on the development of IB services more than do other banks, while in western
countries, the management of IB services is basically linked to the commercial banks.
Having thus sufficiently discussed the MR results as far as the relationships between
the independent variables with the dependent variables are concerned (including their
temporal variation and signs) attention can now be focused on Table 7.1 which is
discussed next. In particular the answers the results suggest and how these measure up
to the literature. That is, the external validity. However, before proceeding to discuss
issues of external validity it may be of benefit to briefly summarise the track record of
this research in terms of internal validity. As further to the discussed validity matters
which have been presented in Chapter 4, internal validity acts as the hallmark of the
quality of the produced results.
7.3 Internal validity
The internal validity refers to the extent to which the results of a study can be
attributed to the variables rather than the research design (Jackman, 1985; Bergh et
al., 2004). In order to assess that internal validity is high; one needs to demonstrate
that a number of well-known threats to internal validity (e.g. selection,
instrumentation, history, causal) did not create a flaw that is producing the reported
Page 286
270
results. The relevant threats are discussed below along with the ways they have been
addressed in this research. Selection threats stem from respondents being selected
randomly on the basis of one or more characteristics influencing the results. Before
proceeding examining the way this threat was addressed in this research, it needs to
be made explicit, that the research results are not claimed to be transferable outside its
targeted population; the IB users in SA. Although the results may still be valid
elsewhere no effort has been placed in this research to measure the error or limits to
such a generalisation; this is thus suggested as an area of further research.
Instrumentation threats stem from changes in the data sources, metrics, or coders. In
this research the same instrument was used with all respondents. The quality of the
language translation into Arabic was checked and found satisfactory, as a courtesy
both the English and the Arabic translation were posted to all respondents in SA.
Local metrics (e.g. for currency) were used to gather the ‘raw’ data which were
subsequently recoded on the same scale (i.e. instrumentation threats controlled by
adapting to measure differences) by this research in the manner discussed in section
4.13. A codebook (see Appendix E) was developed to minimize variation during data
entry/coding and the same single coder was used for all data. As discussed in section
4.14, the EFA was undertaken in SPSS to aggregate the multiple-item question
responses in order to determine the overall measure for the variable classifies each
variable into a set of dimensions. Such a classification can contribute to a more
accurate determination of the relationships and influences between the variables.
Thus, EFA was performed to operationalise these variables and to test the degree to
which the items are tapping the same concept. Harman’s single-factor test was also
performed to test for the presence of CMV. All the self-reported items were entered
into a principal components factor analysis with varimax rotation. According to EFA
Page 287
271
results; eight distinct factors with eigenvalues near or above 1.0 were extracted,
explaining 67.0% of the total variance. The first factor explained 33.65% of the total
variance, not the majority of the explained total variance (see Appendix I). These
results are consistent with the absence of CMV. The discriminant validity test of all
constructs has been also conducted and found satisfactory. It revealed that the
measures correlations between the measures of each two construct are very low and
the two sets of measures each are related to different constructs, and as such
discriminated from each other. Finally the diagnostic univariate tests of normality (KS
and SW non-significant results with value of more than 0.05) indicated a normal
distribution of scores for all the independent and dependent variables; that is, the
assumptions of normality were not violated. Similarly the four diagnostic tests for the
MR analyses [of a) normality b) multicollinearity (VIF above 3.3 or so), and c)
autocorrelation (DW above 2)] indicated there was no violation of its assumptions.
History threats can be briefly defined as events that occur between measurement
periods that influence the results. These were addressed by collecting data from all
respondents in one go. Although there were early and late respondents the amount of
time that could lapse between responding to the main survey and its last wave was a
maximum of 10 weeks. This 10 week window is unlikely to have affected the data
gathered as of the data referred to previous years (see Table 4.5). Nonetheless, to
dispel any concerns quantitative analysis of the early and late respondents was
undertaken (discussed in section 4.13.1). The analysis did not indicate any major
concerns. This can be taken to suggest that any additional event influences (i.e. not
controlled for) are unlikely to be statistically significant.
Page 288
272
Causal threats briefly defined as stemming from the temporality of the dependent and
independent variables. Before proceeding to examine the way this threat was
addressed in this research it needs to be made explicit that this research is a one-
direction investigation. That is, the investigated effects are limited to those from the
independent to the dependent variable direction. This is not to claim that there are or
there are no any effects in the opposite direction but to clarify that they were not
investigated; appearing thus as an area of further research. Nonetheless, the research
results are claimed to be valid for this single direction of causality (hence the one-
tailed test significance tests for the models).
7.4 External Validity
This section answers the key research questions based on the empirical material
presented in the findings chapter (Ch. 6) along with how they measure up to the
evidence reported in the literature. The evidence reported in the literature was
reviewed in chapter two and three; which also identified its gaps and grey areas that
will be re-encountered in this section. Unavoidably for some of the answers of this
research there will be no comparable evidence in the current literature. These answers
should thus be construed as original contributions to the literature, filling the
aforementioned gaps, and illuminating the grey areas. Moreover, some of the
evidence reported in the literature is comparable only nominally due to its sampling,
operationalisation differences/difficulties, and analytical shortcomings. Nonetheless it
provides a sufficient external referent for positioning the answers to the questions of
this research. It should also be reminded that the answers to the key research
questions include both ‘positive’ and ‘negative’ parts (summarised in Table 6.12);
both of which figure in the discussion below.
Page 289
273
Different factors are at play in the adoption, use and success of IB services. Factors
contributing to the adoption, use and success of IB services were formulated as
hypotheses, which were tested using MR analysis. These results suggest that these
independent variables have different effects on the extent of the adoption, use and
success of IB services. Table 7.1 indicates the adoption of IB service is influenced by
eight variables including awareness, resistance to change, self efficiency, high cost,
perceived ease of use, convenience, availability of IsB services and income. The table
also presents that the use of IB services is influenced by seven variables comprising
self efficiency, high cost, perceived ease of use, satisfaction, availability of IsB
services income and adoption. However, the table shows that the success of IB
services is influenced by five variables including perceived ease of use, satisfaction,
availability of IsB services income and use.
Facets
Factors Adoption Use Success
Awareness X
Resistance to change X (-)
Self efficiency X X
High cost X (-) X (-)
Perceived ease of use X X X
satisfaction X X X
Availability of IsB X X X
Income X X X
Adoption X
Use X
Table 7.1: Factors affecting the adoption, use and success of IB services.t 47
In addition to the above, it worth to highlight that perceived ease of use, satisfaction,
availability of IsB services and income factors were found in this study to be
important and significant factor because they relate to all of the main facets “adoption,
use and success”. In addition to that, the satisfaction (convenience) has been also
found having relation with the three main facets starting from the adoption through
usage to the success. Whereas satisfaction (time saving and customers’ needs
fulfilment) were found significantly having a relationship with the success after
Page 290
274
frequent usage, as “use” and “user satisfaction” are closely interrelated. “Use” must
precede “user satisfaction” in a process sense, but a positive experience with “use”
will lead to greater “user satisfaction” then to success (DeLone & McLean, 2003). In
the following sub-section the key research questions will be answered.
7.4.1 Relationships with the IB services adoption. What is
the relative importance of each factor?
The first facet of the model concerns the “adoption” of IB services. Adoption is the
acceptance and continued use of a product, services or idea. According to Rogers and
Shoemaker (1971), consumers go through a process of knowledge, persuasion,
decision and confirmation before they are ready to adopt a product or service. The
researches’ adoption model has shown high prediction powers (R²=62%), as this
model explains 62% of the overall factors that might relate to the customers attitudes
during the IB adoption in SA. The research’s findings identified the range of factors
which relate with the adoption of IB services, organised according to the strength of
the impact (beta coefficient) (Table 6.12): awareness, self-efficiency, high cost,
satisfaction, of IB services; resistance to change; the availability of IsB; and high
income.
The relative importance of each factor during the adoption has been identified by the
beta values (Table 6.12). The research findings indicated that awareness of IB
services was found to be the most important and strongest factor, with a beta of 0.590,
which positively relate to the adoption of IB services in SA, whereas self-efficiency of
IB services has the second strongest positive relation on IB service adoption, with a
beta of 0.280, and high cost of IB services has the third strongest relation (negative)
on IB service adoption, with a beta of 0.265. The research findings are consistent with
other studies’ findings, such as Sathye (1999), Al-Ashban and Burney (2001) and
Page 291
275
Raman et al. (2008). Table (6.12) highlights the different factors based on their
strength (beta) of relation with the customers’ attitudes towards the adoption of IB.
These factors were numbered from 1 to 11 based on their strength (beta) as shown in
Table (6.12).
7.4.2 Relationships with the IB services use. What is the
relative importance of each factor?
The second facet of the model concerns the use of IB services. Table (6.12) shows the
researches’ usage model, which indicates good prediction powers (R²=39.4%), as this
model explains 39.4% of the overall factors that might relate to the customers
attitudes during the use of IB in SA. The results identified the range of factors which
relate to the use of IB services (organised according to their strength of relationship
(beta coefficient)) as highlighted in Table (6.12): self-efficiency, satisfaction, high
cost, perceived ease of use of IB services, income, and availability of IsB.
The relative impotane of the different use factors; the research findings revealed that
the strongest factor affecting the use of IB services is self-efficiency, which has a
significant positive relation with IB use, with a beta of 0.268. The second strongest
factor affecting positively the use of IB services is the adoption of the IB with a beta
of 264, and the third factor is satisfaction “convenience”, with a beta of 0.230. High
cost was found to be the fourth strongest factor which affects the use of IB services
negatively, with a beta of 0.172. The research’s findings are consistent with the
findings of other research, e.g. Sathye (1999), Al-Ashban and Burney (2001) and Al-
Somali et al. (2008). Table (6.12) shows the different factors with beta values based
on their strength of relation with the customers’ attitudes towards the adoption of IB.
These factors were numbered from 1 to 10 based on their strength (beta) as shown in
Table (6.12).
Page 292
276
7.4.3 Relationships with the IB services success. What is the
relative importance of each factor?
The third facet of this research is the success of IB services. Figure (6.3) shows the
researches’ success model, which shows a faire prediction power (R²=30%), as this
model explains 30% of the overall factors that relates with the customers attitudes
towards the success of IB in SA. The customer’s success of the IB is influenced by a
variety of factors, (organised according to the strength of their relationship (beta
coefficient)), as indicated in Table 6.12, including the use factor, satisfaction
(convenience, time saving and fulfilment), income, perceived ease of use of IB
services, and availability of IsB.
The use of IB were found the most relevant strongest factor which relates with the
success of IB services, with a beta of 0.291, whereas the Satisfaction “convenience”
of IB services is the second strongest factor affecting the success of IB, with a beta of
0.277. This is consistent with the findings of Weill et al. (1999), Wixom et al. (2001),
Rai et al. (2002) and Pikkarainen et al. (2004). The research findings revealed that
income has the third strongest relationship with the IB success, with a beta of 0.168,
and then customer’s interaction factor with a beta of 0.154. The fifth significant factor
is the availability of IsB services which is positively relating with IB success, with a
beta of 0.133.
7.4.4 What is the relationship between the adoption, use and
the extent of the success of these factors on IB
services?
The model regression result found that there are a very strong relationship between IB
adoption and IB use, as adoption relates with the customers' usage of IB in SA
significantly (P< 0.05). IB adoption is the second strongest factor in term of its
positive relation with the usage of IB, with a beta of 0.276. In addition to that, the
Page 293
277
usage of IB is significantly (P< 0.05) having positive relation with the success of the
IB in SA. With a beta of 0.291, the usage factor was found the strongest factor in term
of its relation with the IB success.
The three main IB facets of this research (adoption, use and success) were discussed
in detail in the literature review (Chapter 2). The literature support the regression
model result, as if a customer adopts IB frequently, he or she will become a regular
user (Al-Ashban and Burney, 2001), and if a customer increases his usage and uses a
wide range of services, he or she will become a successful user as he is enjoying the
benefit of using the IB services because of his high level of satisfaction (DeLone and
McLean, 1992). Thus, ccustomers can receive benefits from IB; the benefits to
customers are convenience, time saving and fulfill the customers’ needs, which
encourage customers to increase their usage of IB services too frequently. Banks
also benefit from IB by reducing costs in accessing and using the banking services
(Gurau, 2 0 0 2 ).
The model confirms that the frequency of use refers to the ability of people to deal
with IB services. Such as ability can enable people to adopt, use and, at the same time,
contribute to the success of IB services. The increase in the frequency of use results to
increase the success of the used technology (Solomon, 1996; Lockett and Littler,
1997; Hawkins et al., 1998; DeLone and McLean, 2003). The positive aspects of
frequency of use are represented by adopting and using IB services that tend to
interact with the success of IB services due to social conditions (i.e. levels of income
and education) and the availability of choices such as Islamic, commercial, and
investment banks.
Page 294
278
Thus, the success of IB services would increase over time. In the literature, there is a
strong relationship between the adoption and frequency of use IB services, but the
relationship between frequency of use and the success of IB services is still unclear. It
is worthwhile, therefore, testing this relationship, which is shown as frequency of use
having a positive relation with the success of IB services. In addition, using wide
range of IB services often provides opportunities for people to continue dealing with
IB services, such services would be satisfactory and of high quality. Clearly, the
literature indicates that banks are competing regarding the diversity and quality of
their services. Therefore, using wide range of IB services influences positively the
success. This relationship was shown in the findings, as a wide range of IB services
has a positive relation with the success of IB services.
7.5 Research Contribution
In general, the contribution of this study is mainly to marketing research and practitce,
in particular, IB research and bankers as introduced in chapter 1. Following Corley
and Gioia's (2011) theoretical contribution model on what they believe “the time is
right to turn a reflective lens on itself and try to establish more clearly not only what
currently constitutes a theoretical contribution but also what should constitute a
theoretical contribution in the future”; this research contributed to the practice of
making a contribution to theory and to theory of theoretical contribution— to build
theory about theory building (Corley and Gioia, 2011). With regards to that, it is
suitable at this point to have some additional discussion about the major contributions
of this research, and how the research objectives were met and the findings filled the
following summarised gaps.
Page 295
279
First, this study advanced the marketing research and extended, scientifically,
previous model and theories, such as the TAM model theory and DeLone and
McLean (2003) IS success theory, by examining a wide range of variables which have
not been investigated before (e. g. Availability of IsB). This study also responds to
calls from several recent studies, e.g. by Brooksbank and Taylor (2002), Al-Sabbagh
and Molla (2004), Akamavi (2005), Cheng et al. (2006), and Alsajjan and Dennis
(2010), to examine the extent to which these variables are significant to the long-term
use of IB services. In addition, the IB theories (reviewed in Chapter 2) indicated that
the empirical studies conducted to date have examined the role of relatively few
variables. However, additional insights can be gained by considering additional
variables. Thus, awareness, resistance to change, self-efficiency, availability of
infrastructure, security, cost, satisfaction, ease of use, usefulness, the availability IsB,
age, education and income are taken into account in this study as independent
variables. The research’s theoretical insights came from demonstrating how the
addition of new variables significantly alters our understanding of the phenomena.
Therefore, this provided incremental originality of the theoretical contribution to
science.
Second, many studies have focused on issues of adoption and use with respect to IB
services and have tended to search for new policies to deal with such phenomena.
This study focuses on a set of different variables that lead to the adoption, use and
success of IB services. Therefore, this study responds to many calls from marketing
and IB researchers (e.g. DeLone and McLean, 1992; Sathye, 1999; Al-Ashban and
Burney, 2001; Karjaluoto et al., 2002; DeLone and McLean, 2003; Cheng et al.,
2006) to investigate factors which affect the success of IB services. The reviewed
literature investigated factors that influence the adoption or use of IB, whereas no
Page 296
280
study in the reviewed literature had investigated the factors that relate to the success
of IB services. Therefore, this study extends previous IB research by examining the
relations of these different variables have on the customer’s adoption and use of IB
services, and their success. Thus, the three dependent variables considered in the
conceptual theoretical model of this study are 1) adoption, 2) use, and 3) success, and
as a result three related models (i. e. part of the same family/ sunset of variables) have
been developed; one for each facet. In addition to that, this study is considered first
study in the field of IB among the reviewed literature which investigated those
dependent variables on the basis of a common dataset. This transformed our thenking
and revealed a new way of understanding the basis for determining new relationships
towards the success of IB. This provided a revelatory originality theoretical
contribution to science. The inclusion of these variables in the research theoretical
model (see Chapter 2) resulted in the need to use inferential statistical techniques,
such as MR analysis. MR analysis and correlation were considered the most
appropriate techniques for testing the model (a detailed review of MR and correlation
is presented in Chapter 4). Moreover, marketing studies (e.g. Sathye, 1999; Cheng et
al., 2006) have called for the use of more rigorous statistical techniques, such as MR
analysis, in order to have reliable findings and more confidence in the results.
Third, most of the IB studies reviewed in Chapters 2 and 3 were conducted in Europe,
the USA, and Australia, while very little empirical research has been conducted in the
Middle East and SA in particular. Thus, this study examined IB services in a new
context in SA; as a result this research provides data for a comparison with results
reported in other countries. Accordingly, it provides an original contribution as it
represents an incremental advancement to science.
Page 297
281
Fourth, as part of the study findings, security has not been found to affect the
customers’ adoption and use of IB services in SA and their success. This may be due
to the level of customer awareness of IB security, or may be due to the fact that the
SA IB market is relatively new. This might be also explained in different reasons such
as the internet filtration systems that government established to protect the users from
internet crimes, to protect the society culture and Islamic values and it might be for
political reasons. This finding can be categorised as original revelatory contributions
to practice. This area has been suggested and recommended as an area of further
research in section 7.6.3.
Finally, SA is an Islamic society with a culture that manifests high power distance,
uncertainty avoidant, collectivist, and masculinity characteristics, as categorized by
Al-Gahtani et al. (2007) according to the Hofstede's theory of cultural dimensions.
Although the potential importance of the use of PCs in the social and economic
development of SA is recognized by the Saudi authorities (Basaddiq et al., 1986), the
need to uphold the tenets of Islam was probably responsible for the delay (until
January 1999) in allowing public access to the internet through PCs within SA (Al-
Khaldi and Wallace, 1999). The Arab countries are unique because they consist of a
group of nations that have a common ideology, Islam, and a common language. They
can vary, however, in their policies and government due to loyalty to separate Islamic
traditions and sects (Lieb, 1999). Guru et al. (2003) showed that the development of
the IB in the Islamic countries is very low. Only some Islamic banks in the Middle
East have well-developed IB websites for the convenience of their customers.
However, since they are still in the infancy stage, there is a room for improvement.
Evidence shows that Islamic countries are moving steadily towards IB. Given time,
Islamic banks may one day stand alongside their conventional counterparts in the field
Page 298
282
of IB. This study also responds to calls from different researchers, e.g. (Guru et al.,
2003; Elbeck et al., 2010). Other studies have investigated the relationship of the
availability of IsB products and services with the traditional banking services (e.g.
Metawa and Almossawi, 1998; Al-Sultan, 1999; Bley and Kuehn, 2004) and no
research in the reviewed literature studied the relationship of the availability of the
IsB services on the IB services. The findings of this study reveal that the availability
of IsB products and services has a significant and positive relation with the adoption,
use, and success of IB services in SA. Therefore, this finding is classified as original
revelatory contribution to science and ptactice.
7.6 Implications of research findings for knowledge
This research has three major implications for knowledge relating to IB services and
marketing theory. It advanced the field not only through theory development, but also
through empirical work using best practices.These are discussed here; the first is a
discussion of the implications for policy makers. The second illustrates some of the
implications for banks’ practices. Finally, the implications for academic researchers
will be discussed.
7.6.1 Implications for Policy Makers
As stated earlier, the customers’ awareness of and their resistance to change in the IB
services relates positively with the adoption customer attitudes regarding the adoption
of IB services. As new adopters, governments should establish IB rules and
regulations; they should also supervise (monitor) local banks and bank-customer
relations and should maintain them on a regular basis. Governments should also hold
discussions with individual institutions who wish to embark on IB to allow them to
Page 299
283
demonstrate how they have properly addressed the security risks before starting to
provide such services.
Self-efficiency has been found to affect the adoption and use of IB services especially
in the developing countries. This is consistent with the findings of previous studies
Tan & Teo (2000), Nor and Pearson (2008) and Nasri (2011) found that there is a
positive relationship between self efficiency and the adoption and the use of IB
services. This implies that customers are familiar with the Internet and e-mail. This
suggests that people have the capabilities to adopt and use of IB services, as well as,
the pattern of IB services in banks is not complex. Therefore, the decession makers
should formulate a strategic plan to achieve a new and high quality infrastructure and
raise nationwide awareness of IB services and the likely benefits to be attained
through adoption and use. This is not easy task, as it requires the support from the
corporate sector and other governmental organizations, to motivate individuals to
utilize IB services. Those organizations, with the help of the ISPs and banks, should
conduct some orientation sessions, which will need to be coordinated by the
government agancies. Government should also enhance internet quality by increasing
investment in the ICT infrastructure.
This research also found that the high cost of IB services would discourage customers
from adopting and using the IB services. Therefore, governments should open the
market for more competitors and issue more licenses for public communications
network operators and/or ISPs. This would be reflected positively in the IB market; it
would also increase the competitive business environment and raise the quality and
lower the costs of the offered banking services. Providing affordable, high quality
Page 300
284
internet access at reasonable speeds will positively influence IB adoption and use,
which will have a positive effect on the success of IB.
Satisfaction “convenience” and the perceived ease of use of IB services have been
found to affect the adoption, use and then the success of IB services. Therefore,
governments should maintain an Internal Audit review (by internal and external
experts) of IB facilities, systems and processes to enhance the quality of the IB
services; this will help in making the IB services convenient for both customers and
banks. Moreover, government agencies should ensure, with the help of ISPs, banks
and the corporate sector, an increase in the performance of the IB services by
introducing some other tools to make the services easy to use, such as increasing
society’s awareness of the IB services.
The legal framework for IB services in addressing the issue of security is not well-
covered in numerous normative acts in most of the developing countries?
Governments must identify them clearly and both parties (bankers and users) must be
more familiar with them. Moreover, this study revealed that all the investigated banks
offer IB services. However, the provided security features by those banks are different
and need to be developed. Furthermore, many rules and regulations are provided by
government and banks. The effectiveness of those rules and their functions in
mitigating banking consumers’ security concerns still need more investigations.
Finally, government should establish a set of comprehensive IB laws, policies and
procedures to deal with the major aspects of conflicts and violations between
customers, banks and even government agancies. Moreover and in order to develop
IB’s integration system, government should keep the banks, corporate sector,
individuals and government agancies well informed of the best internet security
Page 301
285
practice internationally to assist them in maintaining the safety and privacy of IB.
However, it is the responsibility of the banks and the other organisations to maintain
effective internal and technical controls in keeping with these guidelines. Establishing
IB laws, policies and procedures in the developing countries will help in developing
the required integration of the IB system.
7.6.2 Implications for Practice
As IB is still in its early stage especially in the developing countries, there are still
considerable development opportunities. The implications of the aforementioned
findings for the bank sector are significant, whereas banks need to move away from
traditional bases to encourage consumers to adopt IB services more and more through
appropriate strategies. Such strategies should decrease resistance to change and lower
cost. As per the findings of this study, customers’ awareness of and their resistance to
change in the IB services relates customer attitudes when adopting these services.
These services are used by people, and when they start adopting IB services, banks
should encourage them to use these services increasingly through appropriate
strategies in order to meet their needs. Moreover, banks should guarantee that
customers are using the latest and most up-to-date IB information.
Banks should continually analyse the external environment in terms of resistance to
change. In particular, banks’ strategies may lead to more emphasis being placed on
using different types of policies to cope with the resistance to change. As a result,
banks should develop new strategies in getting their customers involved in trial
sessions of their IB services to increase their awareness, experience and confidence in
using the IB services without resistance to change in the traditional banking channels.
Banks can motivate their customers tp adopt and encourage tp use their IB services by
Page 302
286
providing them with limited internet access to their IB services with the help of some
ISPs. Banks also are recommended to provide their new IB adopters with a virtual IB
account in order to educate them and to increase their experience in using IB services,
which will help to transform them from being IB adopters to being regular IB users.
It is also very important to highlight that the convenience of IB services was found to
be a very important factor in motivating the new adopters of IB services to use IB
services frequently, which will satisfy the banks’ customers and then will ensure the
SA banks provide a successful competitive performance. Therefore, it can be
suggested that the internal consistent and concurrent efforts by the Saudi banks to (1)
enhance their strategic orientation, (2) formalise their structures, (3) use total quality
management, (4) use a diversity of financial services and (5) provide managers with
relevant information will make a potential contribution to a higher performance and
higher level of customer satisfaction with IB services. Therefore, it is recommended
that SA banks invest in some new technologies, such as QuickStreem and Webrend
software, which will enable the banks to gather and analyse extensive customer
information; this will help them to understand their customers and then satisfy their
customers’ needs.
As stated in Chapter 3, there are three main ISPs in SA, each with a different pricing
strategy. This study, in alignment with the literature, found that willingness to buy is a
key factor affecting customer attitudes towards the usage of IB services. The
customers’ level of income was a very important factor in the adoption and use of IB
services, which would result in a successful competitive advantage for banks.
Consequently, banks need to analyse the size of the usage of IB services and their
financial impact on a regular basis in order to build a future perspective to sustain the
Page 303
287
required enhancement of the IB services by conducting further analysis, such as
Strength Weakness Opportunity Threat (SWOT) analysis, and cost-and-benefit
analysis. Thus, banks should review the internet market and link their services to the
economic environment. Therefore, banks should spend more time selecting an
appropriate pricing strategy, which is the most challenging job confronting banks;
failure to adopt the correct IB pricing strategy, and a lack of in-depth research into the
intricacies of pricing will affect the banks’ IB performance.
It was anticipated that banks should find answers to the following questions from a
technological perspective (Gates, 1999, 1-2): what do customers think about their
services; what problems do they want them to fix; what new features do they want
added; in which areas are competitors winning business from them; will changing
customers’ demands/needs require banks to develop new capabilities?; and what new
markets are emerging that banks can enter. With regards to that, the research findings
revealed that the majority of customers agree that IB and the associated technologies
increase customer satisfaction and always provide a high degree of customer
satisfaction with high time and cost savings. Consistently, for customer loyalty, IB
does not diminish the belongingness of most customers to the bank, their propensity
to advocate for their banks to others as well as their willingness for long-term
relationships.
It is also recommended that banks use the revolution of the new social media as
Facebook or Twitter, which is extensively used in the developed countries to inform
customers, to chat with bank representatives or to lodge a formal complaint, this
avenue should be explored by the financial institutions to improve communication
and enhance their relationships with customers. In another word, to attract customers,
Page 304
288
banks should develop usefulness completing financial products’ offer on internet at a
very close level they offer at the branch. This is good for the customer and for
controlling bank costs (Wang et al., 2003).
This study also revealed that the availability of IsB is a key factor in the adoption, use
and success of IB services in the Muslim countries and other countries that have
Muslim comunities. Because they are operating in a Muslim country, the conventional
banks should reassess their marketing strategies of IB services to be more competitive
with Islamic banks. Additional emphasis is required for them to gain recognition by
Islamic organizations/societies regarding no paid interest and the availability of a
religious Fatwa document for every bank transaction. These issues will demonstrate a
balance between Shari'ah requirements and the overriding importance of
transparency.
The high cost of IB services was found to relate positively with the use and adoption
of IB services. Therefore, banks should emphasise more the cost of IB service
transactions for clients in order to encourage them to utilize the IB services and thus
increase the demand for IB services. To do this, banks should pay more attention to
analysing their IB infrastructure system and linking them to their marketing strategy
by enhancing the technical performance of the banks activities. They should also
optimise their operational activities in order to increase and enhance their ability to
achieve the required objectives. This can help in achieving competitive advantage in
the highly intensive competition among banks.
The ease of use of IB services has been found to play a vital role in the adoption, use
and then success of IB services. Therefore, this research suggests that banks work in
parallel with the ISPs by facilitating some training sessions for those who have
Page 305
289
difficulties using IB services, providing customers with a 24-hour free customer
support line and providing some promotions for those customers who are considered
active users. There was also some slight inconsistency between Saudi banks in
applying IB service systems. This inconsistency included type of banks (i.e. Islamic
vs. conventional banks) and number of clients. However, the importance of IB
services can vary from one bank to another. Thus, managers should rethink and show
a better understanding of how IB services should function in tandem with the other
services provided by Saudi banks.
The early adopters (pioneers), commanding the highest degree of opinion leadership,
are a more integrated part of the local system than explorers (Rogers, 2002). This is
crucial, as according to Rogers (2002) potential adopters (sceptics, paranoids and
laggards) look to early adopters for advice and information. Consequently, bank
managers should focus on retaining these early adopters (pioneers) of IB, by
continuously ensuring. They are being provided with easy to use and secure IB
services. This finding is in line with previous studies on IB, which also found that it is
crucial to inspire trust by making customers feel secure. (for example, by keeping
them informed, in a simple to understand language, of how their interests and privacy
are safeguarded) (Yousafzai et al., 2005).
Finally, the main strengths of this research are its derivation of its factors from
previous conceptual and empirical research by focusing on those factors that have the
most significant relationship on IB area. Future studies could investigate other factors
which have not been included in this research (e. g. loyalty, risks). It could also
extend to include other region or countries operating in similar conditions to see if
comparable results could be obtained. The research model was based on an extension
Page 306
290
of the TAM and D&M IS Success Model with incorporating constructs of social
influence. The findings provide useful insight for bank management in developing
appropriate marketing strategies to meet customers’ demands, and further to retain
and expand their customer base.
7.6.3 Implications for Academic Research
As discussed in the previous section, this research has investigated the IB services
across three vital different facets: adoption, use and success. Addressing these three
facets can improve the knowledge and understanding of IB services, which is believed
to be important for the development of more effective IB marketing strategies.
This research addresses the relationship between different factors which affect the
extent of the adoption, use and success of IB services SA. It also examines the
relationship between the adoption and the usage of IB services and between the usage
and the success of IB services. The rationale for addressing these relationships is that
management practices of IB are surrounded by a set of factors including awareness,
self-efficiency, availability of IB infrastructure, cost, satisfaction, perceived ease of
use, perceived usefulness, availability of IsB, age, and education. Emphasis is placed
on the importance of these elements in dealing with IB services. For academics, it is
important to test these relationships as any territories as possible; and this research
adds support to this effort.
This study is one of the first to investigate empirically the relation of the
aforementioned factors on the extent of the adoption, use and success of IB services
and to examine the relationships between adoption and use and between use and
success. This research employed only existing IB customers. Future research could
include current non-users of the service to determine their propensity to adopt in the
Page 307
291
future. A customer’s adoption of IB cannot be inferred solely by his or her
perceptions of and behaviour towards that channel of distribution without considering
other competitive options. A further consideration for investigation can include
context-specific perceptions of customers, for example comparing IB versus physical
banking. Academics should also focus on the relationship of non-adopters and non-
users on several issues such as cost, performance etc. Such studies will enhance
management practices, wide their knowledge and offer new strategies for managing
IB services.
The research findings indicate that security is not contributing significantly towards
the adoption, use and success of IB service in SA. This is an implication that the
customers feel that security is not an important factor when dealing with IB, and that
due to the fact that government agencies, bankers and the services providers fail in
providing the required awareness and importance of such dimension towards the
usage and successful implementation of IB services. This might also be due to the
level of confidence that customers have on IB services. IB is going to be very crucial
for SA, having increasing percentage of younger generation population with computer
literacy. Since research on IB is still in its infancy and the relevant literature is scarce,
therefore the insight gained in this research may offer a foundation for future research
on self-service technology and provide useful recommendations to the bankers for
improving the IB services.
This Research was conducted to explore the factors influencing intentions to adopt IB
services and then actual usage for successful implementation of IB services. As such,
there is still room for further investigation into the replication of this study on a wider
scale with more IB customers and with different national cultures, as it is essential for
Page 308
292
the further generalization of the findings. By using a longitudinal study in the future,
we could investigate our research model in different time, periods and regions and
make comparisons, thus providing more insight into the phenomenon of IB adoption
would be beneficial.
This research did not emphasize the demographic variables in detail by providing a
comparison analysis between the different segments in order to identify their
characteristics, which may play a key role for the adoption, use and successful
implementation of IB. Further investigations and observations of the effect of the
different segments of the demographic variables on the adoption and successful
implementation of IB is also an opportunity for future research.
This study extends the research conducted in the field of IB services and marketing
(e.g. Sathye, 1999; Chung and Paynter, 2002; Wungwanitchakornm, 2002; Al-
Sabbagh and Molla, 2004; Chan and Lu, 2004; Pikkarainen et al., 2004; Cheng et al.,
2006). While previous authors have contributed to knowledge in specific fields, this
study has empirically investigated several factors combined from the literature which
affect in different ways the adoption, usage and success of IB. Therefore, this study
has developed models demonstrating the adoption, use and success processes for the
IB services. In this context, more links with future IB studies should take into account
the promotion and competition dimensions within the identified fields.
7.7 Limitations and further research agenda
The aim of this research was to identify the factors that encourage customers to adopt,
use and re-use the IB in SA which can be useful for e-commerce practitioners in
general and IB practitioners in particular. This study represents a contribution towards
Page 309
293
extending TAM in predicting the factors that influence the banks’ customers to
accept, use and re-use IB services.
The applied measures used in this study were developed through an extensive review
of the literature. In addition, the research variables, which have been used in many
previous technology and IB adoption studies, were found to have adequate reliability
and validity. The models of adoption, use and success have shown high, good and fair
predictivs powers, respectively, (R²=62%, 39.4% and 30%) which is comparable to
other models in business and marketing studies. The unexplained variations indicate
that there might be omission of some important factors that relates to the IB
customers’ adoption, use and success. Therefore, future studies could further extend
the models to include other variables which have not been investigated in this
research. Additionally, future studies are also recommended to reoperationalize the
variables that have not been found significant in this study, such as security.
This research was conducted in SA, therefore, caution needs to be issued against
attempts to generalise the current findings to users in other different geographical
locations. Future research needs to be extended to the other Gulf States in order to
generalise the results. However, an interesting area of research would be to examine
IB services in other Arab countries, since they have similar cultures; this might lead to
very interesting results and it would be worth comparing their results with the
findings of this study. Additionally, this study conducted in all over the country of
SA; future study might focus in specific areas or cities such as the central, western or
eastern region in SA as the adoption and acceptance in the other parts of the country,
especially in rural areas may vary. Future comparative research could target these
areas to gain comparative national results.
Page 310
294
The qualitative approach was limited in this research due to banking policies not
allowing in-depth interviews. Also, the time constraints, interview accessibility, the
availability of interviewees for a significant amount of time, and transportation
difficulties constrained the researcher from undertaking a qualitative approach. More
research is required to investigate the professionals’ perspectives in the corporate
sector of IB services in SA and other regions, since this study did not investigate the
corporate sector and it is expected that professionals at different levels will have
perceptions of IB services that differ from those of public IB users. This would
provide the viewpoints of other IB users.
Although this research has examined the presense of the CVM, and considering the
fact that this research investigates larg number of measures in one study, future
researchers, therefore, are recommended to have additional precautions to mitigate the
risk of having CVM and continuasly conduct more test to examin the presence of the
CVM. Additionally, this research addressed the CMV at a later stage of the study, and
some other researchers when it appears to suffer from common method bias as the
issue has been ignored from the beginning of the research processes. Therefore,
addressing CMV only after desk rejection is not the ideal strategy, of course. The
right way is to prevent potential CMV at the research design stage using suitable
remedies, such as, collecting data from multiple sources. Ex ante, before running any
analyses, the collection of key information from other sources should be planned,
using where possible archival data and multiple respondents. Alternatively, additional
information can be collected afterwards. In addition, it is also recommend that the
survey questionnaire be carefully designed; applying all or a large subset of the
procedural remedies listed is section 4.13.2.3. Depending upon the nature of the
questionnaire, tailor-made CMV measures can be included, a well-known example
Page 311
295
being social desirability scales. Ex post, in the empirical stage, options are to run
Harman’s single-factor test, specify a complex model and explicitly control for or
partial out CMV statistically (see section 4.14.3).
Additionaly, all the measures of this research are reflective measures except
Satisfaction measure which is formative measure; this research treated all the
researches’ measures, as reflective measure. This might lead to some potential
consequences of measurement model misspecification, and therefore future
researchers need to evaluate cautiously the direction of causality between constructs
and their measures.
With respect to marketing research, much of the research on IB has focused on
explaining how IB development should be understood; using IS as part of the
marketing and management innovation research. However, this study has not taken
into consideration the motives for implementing IS to emphasise IB services’
development. As a result, this study has not focused in depth on how IB services are
actually developed over time in SA. In addition, little attention was given in this study
to examining how the level of use of IB services could vary from one time to another.
In addition, future research to examine the improvement in performance within local
banks before and after the implementation of IB services is also considered to be
appropriate. The continual periodical evaluation of the IB implementation will
provide us with an indication of a positive or negative change.
Due to female’s small participation in this research, the research did not show a great
difference between males and females attitudes towards the adoption, use and success.
This is due to the fact that the SA females are kept separate from men in public due to
legal and cultural restrictions. The little number of females participated in the survey
Page 312
296
demonstrates an access problem and difficulties in reaching females to collect primary
data in a conservative environment such as SA. Saudi law does not allow direct
contact and or interaction between male and females in general, and or between
foreign males and Saudi females in particular. As a result, further researches could
investigate the factor that might relate only with the female customers’ attitudes, in
SA, towards the adoption, usage and successful implementation of IB.
This study has not incorporated the benefits of IB services to assess their relation with
the adoption, use, and success of IB. Thus, future research may assess the customer
advantages and disadvantages associated with the use of IB services. Such
assessments would provide results that were either similar to or conflicting with this
research. This study also investigated the different factors relationship with the
adoption, use and success of the IB services in SA, from the customers’ viewpoint.
However, this study did not cover such relationship from the viewpoint of the
corporate sector. This will result in more participation in this research since there are
more educated and worker participants in the corporate sector, and such research
might lead to similar or different results, making it worthwhile to compare them with
the results of this research.
It has been argued that multivariate data analysis (e.g. MR) actually signifies causality
between the independent and dependent variables (e.g. Hoyle, 1995). Despite the
advantages of using these approaches, the causal relationships between variables
should be treated with caution due to the cross-sectional methodology of this study.
Thus, it may be preferable not to draw any fixed conclusions about the directions of
relationships being applicable in SA because, in reality, multivariate data analysis
does nothing more than test the relations between the aggregation of the variables.
Page 313
297
Therefore, these methods cannot overcome the limitations associated with non-
experimental data gathered in a single session (Hoyle, 1995). As mentioned earlier;
this research utilized the MR statistical method to test three models (adoption, use and
success), where they have a direct relationships between independent variables and
dependent variables in separate models. Future research might utilize the SEM to
combine these three models in one model to examine all the independent and
dependent variables in one model with direct and indirect relationships.
Page 314
298
References
Abdeen, A., & Shock, D. (1984). The Saudi Financial System in the Context of
Western and Islamic Finance. New York: John Wiley & Sons.
Abdul Ghafour, P. (2003). Government to sell 50% of its stake in NCB. Arab News.
Abdullatife, A. (2002). Future Role of Banking Sector. Paper presented at the Shoura
Council, Future Vision of Saudi Arabia, Riyadh.
ABF. (1997). Banks approach market with caution. Australian Banking and Finance,
6(13), 9-11.
Achour, H., & Bensedrine, N. (March 2005). An evaluation of internet banking and
outline Brokerage in Tunisia. Paper presented at the 1st International
Conference on EBusiness and E-learning (EBEL), Amman, Jordan.
ACNielsen. (2005). Online banking continues despite security concerns. Retrieved
Nov 7, 2007, from http://www.acnielsen.au/news.asp?newsID=301
Adesina, A. A., & Ayo, C. K. (2010). An Empirical Investigation of the Level of
Users’ Acceptance of Ebanking in Nigeria. Journal of Internet Banking and
Commerce, 15(1), 1-13.
Agarwal, R., & Karahanna, E. (2000). Time flies when you're having fun: cognitive
absorption and beliefs about information technology usage. MIS Quarterly,
24(4), 665-694.
Agarwal, R., & Prasad, J. (1997). The Role of Innovation Characteristics and
Perceived Voluntariness in the Acceptance of Information Technologies.
Decision sciences, 28(3), 557-583.
Agarwal, R., Rastogi, S., & Mehrotra, A. (2009). Customers ’perspectives regarding
e-banking in an emerging economy. Journal of Retailing and Consumer
Services, 16, 340–351.
Ahmed, A. M., Zairi, M., & Alwabel, S. A. (2003). Global benchmarking for internet
and e-commerce applications, Working Paper Series. University of Bradford,
School of Management (United Kingdom).
Ajzen, I. (1985). From intentions to actions: A theory of planned behavior (In J. Kuhl,
& J. Beckmann (Eds.) ed.). Berlin: Springer.
Ajzen, I. (1991). The theory of planned behavior. Organizational Behavior and
Human Decision Processes, 50(2), 179-211.
Ajzen, I., & Fishbein, M. (1980). Understanding attitudes and predicting social
behavior. Englewood Cliffs, NJ: Prentice-Hal
Page 315
299
Ajzen, I., & Fishbein, M. (1989). Understanding attitudes and predicting social
behaviour. New Jersey: Prentice-Hall.
Akamavi, R. K. (2005). Re-engineering service quality process mapping: e-banking
process. The International Journal of Bank Marketing, 23(1), 28-53.
Akinci, S., Aksoy, S., & Atilgan, E. (2004). Adoption of Internet banking among
sophisticated consumer segments in an advanced developing country. The
International Journal of Bank Marketing, 22(3), 212-232.
Aladwani, A. M. (2001). Online banking: a field study of drivers, development
challenges, and expectations. International Journal of Information
Management., 21(3), 213-225.
Alagheband , P. (2006). Adoption of electronic banking Services by Iranian
Customers. Master thesis, Luleå University of technology, Sweden.
Al-Ashban, A. A., & Burney, M. A. (2001). Customer adoption of tele-banking
technology:the case of Saudi Arabia. The International Journal of Bank
Marketing, 19(5), 191-201.
Al-Barrak, A. (2004). Going Public in Saudi Arabia: Motivations and Barriers. Paper
presented at the Second Conference on Administrative Sciences, Dhahran,
Saudi Arabia, King Fahad University of Petroleum and Minerals.
Al-Dukheil, A. M. (2002). Saudi Stock Market. Paper presented at the "Future Vision
for the Saudi Economy”, Ministry of Planning, Kingdom of Saudi Arabia.
Al-Far, Q. (2005). Extent of teachers college faculty use of the Internet for research
and teaching. Doctoral dissertation, Umm Al-Qura University, Makkah, Saudi
Arabia.
Al-Furaih, I. S. (2002, June 18-21). Internet regulations: the Saudi Arabian
experience. Paper presented at the Internet Society's 12th Annual INET
Conference, Washington, D.C. USA.
Al-Gahtani, S. (2001). The applicability of TAM outside North America: An
empirical test in the United Kingdom. Information Resources Management
Journal, July-September, 37-46.
Al-Gahtani, S. S., Hubona, G. S., & Wang, J. (2007). Information Technology (IT) in
Saudi Arabia: Culture and the acceptance and use of IT. Information &
Managemement, 44, 681-691.
AlGhamdi, R., Drew, S., & Al-Ghaith, W. (2011). Factors Influencing E-Commerce
Adoption by Retailers in Saudi Arabia: A Qualitative Analysis. The Electronic
Journal of Information Systems in Developing Countries, 47(7), 1-23.
Page 316
300
Al-Hajri, S., & Tatnall, A. (2008). Technological Innovation and the Adoption of
Internet Banking in Oman. The Electronic Journal for Virtual Organizations
and Networks, 10, 59-83.
Al-Hakim, N. T. (2012, February 10). $1b loss to Saudi banks in 2 years from e-
crimes. saudigazette.
Al-Khaldi, M. A., & Olusegun Wallace, R. S. (1999). The influence of attitudes on
personal computer utilization among knowledge workers: the case of Saudi
Arabia. Information & Management, 36(4), 185-204.
Allen, C. T., Machleit, K. A., & Kleine, S. S. (1992). A Comparison of Attitudes and
Emotions as Predictors of Behavior at Diverse Levels of Behavioral
Experience. Journal of Consumer Research, 18(4), 493-504.
Allen, N. B. (May 2003). The institutional memory hypothesis and the procyclicality
of bank lending behavior. Proceedings, Federal Reserve Bank of Chicago,
151-169.
Al-maghrabi, T., & Dennis, C. (2010). Driving online shopping: Spending and
behavioral differences among women in Saudi Arabia. International Journal
of Business Science and Applied Management Science, 5(1), 30-47.
AL-Majali, M., & Nik Mat, N. K. (2011). Modeling the antecedents of internet
banking service adoption (IBSA) in Jordan: A Structural Equation Modeling
(SEM)Approach. Journal of Internet Banking and Commerce, 16(1).
AlMazroui, F. (2009, January 21). Higher Ministry of Education: College structure
reconsederation. Al Eqtisadiah.
Almobarraz, A. (2007). Perceived attributes of diffusion of innovation theory as
predictors of Internet adoption among the faculty members of Imam
Mohammed Bin Saud University. Ph.D. dissertation, University of North
Texas, United States-Texas.
Almogbil, A. M. A. (2005). Security, perceptions, and practices: challenges facing
adoption of online banking in Saudi Arabia. Ph.D. thesis, George Washington
University. Dept. of Engineering Management and Applied, Science.
AlMunajjed, M. (2010). Women’s Employment in Saudi Arabia: A Major Challenge
[Electronic Version]. Booz & Company Ideation Center. Retrieved January 10,
2012 from http://freedownload.is/pdf/womens-employment-in-saudi-arabia-a-
major-challenge-1175793.html.
Al-Qahtani, M. E. (2007a). Factors Affecting the Customers attitudes towards the
uses of Internet Banking (IB) in Saudi Arabia. Master of Research, Hull
University.
Page 317
301
Al-Qahtani, M. E. (2007b). Factors Affecting the Customers attitudes towards the
uses of Internet Banking (IB) in Saudi Arabia. Paper presented at the PhD
Doctorate Consortium, Hull University, Scarborough Campus.
Al-Qahtani, M. E. (2008, 9th April). Customers’ attitudes towards the adoption of
Internet Banking (IB) services in Saudi Arabia. Paper presented at the PhD &
Professional Doctorate Consortium, UK Academy for Information System
(UKAIS), Bournemouth University, UK.
Al-Qahtany, M. D. (1999). Obstacles Facing Saudi Exporters of Non-Oil Products.
The Lahore Journal of Economics, 6(1), 129-143.
Alreck, P. L., & Settle, R. B. (1985). The survey research handbook. Homewood, IL:
Irwin.
Al-Sabbagh, I., & Molla, A. (2004). Adoption and Use of Internet Banking in the
Sultanate of Oman: An Exploratory Study. Journal of Internet Banking and
Commerce, 9(2), 1-12.
Alsajjan, B., & Dennis, C. (2010). Internet banking acceptance model: a cross-market
examination. Journal of Business Research, 63(9-10), 957–963.
Al-Solbi, A., & Mayhew, P. (2005, 10-12 July). Measuring E-Readiness Assessment
in Saudi Organisations: Pre- liminary Results From A Survey Study. Paper
presented at the Proceeding of the First European Conference on Mobile
Government, University of Sussex, Brighton, UK.
Al-Somali, S., Gholami, R., & Clegg B. (2008). Banking Acceptance in the Context
of Developing Countries. ABS Working Paper.
AlSukkar, A. (2005). The Application of Information System in the Jordanian
Banking Sector: A study of the Acceptance of the Internet. (PhD Thesis),
University of Wollongong, New South Wales, Australia.
Al-Sultan, W. (1999). Financial Characteristics of Interest-Free Banks and
Conventional Banks. Ph.D. thesis, Accounting and finance, The University of
Wollongong, Wollongong.
Amaratunga, D., & Baldry, D. (2002). The Debate about Quantitative and Qualitative
Research in Built Environment: A Question of Method or Epistemology? Paper
presented at the Bizarre Fruit International Postgraduate Conference, The
University of Salford, Salford, UK.
Amin, H. (2007). Internet Banking Adoption among Young Intellectuals. Journal of
Internet Banking and Commerce, 12(3).
Amin, H. (2009). An Analysis of Online Banking Usage Intentions: An Extension of
the Technology Acceptance Model. International Journal of Business and
Society, 10(1), 27-40.
Page 318
302
Amin, M., & Isa, Z. (2008). An Examination of the Relationship between Service
Quality Perception and Customer Satisfaction: A SEM Approach towards
Malaysian Islamic Banking. International Journal of Islamic and Middle
Eastern Finance and Management, 1(3), 191-209.
Anderson, J. C., & Gerbing, D. W. (1982). Some methods for respecifying
measurement models to obtain unidimensional construct measurement.
Journal of Marketing Research, 19, 453–460.
Anderson, J. C., & Gerbing, D. W. (1988). Structural equation modeling in practice: a
review and recommended two-step approach. Psych Bull, 103(3), 411–23.
Anguelov, C. E., Hilgert, M. A., & Hogarth, J. M. (2004). U.S. Consumers and
Electronic Banking, 1995-2003. Federal Reserve Bulletin, 90(1), 1-18.
AP. (2001, April 30). Saudi Arabia says it will ban 200,000 Internet sites. The China
Post Retrieved March 12, 2007, from
http://www.chinapost.com.tw/tecology/detail.asp?ID=163&G=a
Arasly, H., Katircioglu, S. T., & Mehtap-Smadi, S. (2005). A comparison of service
quality in the banking industry. International Journal of Bank Marketing,
23(7), 508-526.
Archer, S., & Karim, R. A. (2002). Islamic Finance: Growth and Innovation. London:
Euromoney books and AAOIFI.
Armstrong, S., & Overton, T. S. (1977). Estimating Nonresponse Bias in Mail
Surveys. Journal of Marketing Research, 14, 396-402.
Assael, H. (1995). Consumer Behaviour and Marketing Action. Cincinnati, Ohio:
South-Western College Pub.
Awad, E. M. (2000). The Structure of E-Commerce in the Banking Industry: An
Empirical Investigation. Paper presented at the Proceedings of the 2000 ACM
SIGCPR conference, Illinois USA.
Awamleh, R., & Fernandes, C. (2005). Internet Banking: An empirical investigation
into the extent of adoption by banks and the determinants of customer
satisfaction in the United Arab Emirates. Journal of Internet Banking and
Commerce, 10(1).
Ayub, M. (2007). Understanding Islamic finance. West Sussex, England: John Wiley
& Sons Ltd.
Bagozzi, R. P. (1980). Causal Models in Marketing. New York: John Wiley.
Bagozzi, R. P., & Yi, Y. (1991). Multitrait–multimethod matrices in consumer
research. Journal of Consumer Research, 17, 426-439.
Page 319
303
Bagozzi, R. P., Yi, Y., & Phillips, L. W. (1991). Assessing Construct Validity in
Organizational Research. Administrative Science Quarterly, 36(3), 421-458.
Bailey, J., & Pearson, S. (1983). Development of a Tool for Measuring and Analyzing
Computer User Satisfaction. Management Science, 29(5), 530-545.
Banaghan, M., & Bryant, G. (1998). Electronic Commerce Streamlines The Supply
Chain. Business Review Weekly, 56-67.
Bandura, A. (1977). Self-efficacy: Toward a unifying theory of behavioral change.
Psychological Review, 84(2), 191-215.
Barczak, G., Ellen, P. S., & Pilling, B. K. (1997). Developing Typologies of
Consumer Motives for Use of Technologically Based Banking Services.
Journal of business research., 38(2), 131-139.
Basaddiq, U. (October 19,1986). Computer Seen Playing Vital Role in Saudi Life.
Arab News, p. 19.
Basel Committee reports on banking supervision. (1998). Risk management for
electronic banking and electronic money activities. Bank of International
Settlements, Basel.
Bateson, J. E. G., & Hoffman, D. K. (1999). Managing Services Marketing: Text and
Reading. New York: The Dryden Press.
Bauer, H., Barnes, S., Reichardt, T., & Neumann, M. (2005). Driving Consumer
Acceptance of Mobile Marketing: A Theoretical Framework and Empirical
Study. Journal of Electronic Commerce & Research, 6(3).
Baumann, C., Elliott, G., & Hamin, H. (2010). Modelling customer loyalty infinancial
services, A hybrid of formative and reflective constructs. International
Journal of Bank Marketing, 29(3), 247-267.
Bearden, W. O., Netmeyer, R. G., & Mobley, M. F. (1993). Handbook of Marketing
Scales: Multi-Item Measures for Marketing and Consumer Behavior
Research. Sage Publishing: Newbury Park, CA.
Beckett, A. (2000). Strategic and Marketing Implications of Consumer Behaviour in
Financial Services. The Service Industries Journal., 20(3), 191-208.
Belanger, F., Hiller, J. S. & Smith, W. J. (2002). Trustworthiness in electronic
commerce: the role of privacy, security, and site attributes. Journal of
Strategic Information Systems, 11, 245-270.
Belkhamza, Z., & Wafa, S. A. (2009). The Effect of Perceived Risk on the Intention
to Use E-commerce: The Case of Algeria. Journal of Internet Banking and
Commerce, 14(1).
Page 320
304
Bellafante, G. (1995). Strange sounds and sights. Time [Special issue: Welcome to
cyberspace], 145, 14-16.
Ben Arab, M., & Elmelki, A. (2008). Managing Risks and Liquidity in an Interest
Free Banking Framework: The Case of the Islamic Banks. International
Journal of Business and Management, 3(9), 80-95.
Berenson, M. L., & Levine, D. M. (1999). Basic business statistics : concepts and
applications. Englewood Cliffs, NJ: Prentice Hall.
Bergh, D. D., Hanke, R., Balkundi, P., Brown, M., & Chen, X. (2004). An assessment
of research designs in strategic management research: the frequency of threats
to internal validity. Research Methodology in Strategy and Management, 1,
349-371.
Black, N. J., Lockett, A., Ennew, C., Winklhofer, H., & McKechnie, S. (2002).
Modelling consumer choice of distribution channels: an illustration from
financial services. International Journal of Bank Marketing, 20(4), 161 - 173.
Bley, J., & Kuehn, K. (2004). Conventional versus Islamic Finance: Student
Knowledge and Perception in the United Arab Emirates. International Journal
of Islamic Financial Services 5(4).
Bollen, K. A. (1989). Structural Equations with Latent Variables. New York: John
Wiley.
Bollen, K. A., & Lennox, R. (1991). Conventional Wisdom on Measurement: A
Structural Equation Perspective. Psychological Bulletin, 110(2), 305-314.
Borsboom, D., Mellenbergh, G., & Heerden, J. (2003). The theoretical status of latent
variables. Psychological Review, 110(2), 203-219.
Borsboom, D., Mellenbergh, G., & Heerden, J. (2004). The concept of validity.
Psychological Review, 111(4), 1061-1071.
Bouchard, T. J., & Jr. (1976). Field research methods: Interviewing, questionnaires,
participant observation, systematic observation, unobtrusive measures (M.
D.Dunnette ed.). New York: Wiley.
Bourque, L. B., & Fielder, E. P. (1995). How to conduct self-administered and mail
surveys. London: Sage Publications.
Bove, L. L., Pervan, S. J., Beatty, S. E., & Shiu, E. (2009). Service worker role in
encouraging customer organizational citizenship behaviors. J Bus Res, 62(7),
698–705.
Broadbent, M., & Weill, P. (1997). Management by Maxim: How Business and IT
Managers Can Create IT Infrastructures. Sloan management review, 38(3), 77.
Page 321
305
Brooksbank, R., & Taylor, D. (2002). The adoption of strategic marketing and its
contribution to the competitive success of New Zealand companies. Marketing
Intelligence and Planning, 20(7), 452-461.
Bruner, I., Gordon, C., & Hensel, P. J. (1992). Marketing Scales Handbook - V. I.
Chicago: American Marketing Association.
Bruner, I., Gordon, C., & Hensel, P. J. (1996). Marketing Scales Handbook - V. II.
Chicago: American Marketing Association.
Bryman, A. (1993). Quantity and quality in social research. London: Routledge.
Bryman, A., & Cramer, D. (2001). Quantitative data analysis with SPSS. Release10
for Windows: A guide for social scientists. London: Routledge.
Capital Market Authority (CMA). (2012a). Saudi listed companies and number of
shares issued (1990-2011). Retrieved February 25, 2012, from
http://www.cma.net/
Capital Market Authority (CMA). (2012b). Saudi market index year ends,
TADAWUL TASI. Retrieved February 25, 2012, from http://www.cma.net/
Casalo, L. V., Flavián, C., & Guinalíu, M. (2008). The role of satisfaction and website
usability in developing customer loyalty and positive word-of-mouth in the e
banking services. The international Journal of Bank Marketing, 26(6), 399-
417 .
Central Department of Statistics and Information (CDSI). (2004). General Census of
Population and Housing 2004. Retrieved May 15, 2010, from
http://www.cdsi.gov.sa/english/index.php?option=com_docman&task=cat_vie
w&gid=31&Itemid=113
Central Department of Statistics and Information (CDSI). (2007). Demographic
Research Bulletin 2007. Retrieved May 18, 2010, from
http://www.cdsi.gov.sa/english/index.php?option=com_docman&task=cat_vie
w&gid=77&Itemid=113
Central Department of Statistics and Information (CDSI). (2010). Recent Key
Indicators. Retrieved Dec. 23, 2010, from http://www.cdsi.gov.sa/english/
Central Intelligence Agency (CIA). (2002). The Worldfact Book Retrieved February
12, 2007, from http://www.cia.gov/cia/publications/factbook/index.html
Chan, S. C., & Lu, M. t. (2004). Understanding Internet Banking Adoption and Use
Behavior: A Hong Kong Perspective. Journal of Global Information
Management, 12(3), 21-43.
Chau, P. (2001). Influence of Computer Attitude and Self-Efficacy on It Usage
Behavior. Journal of End User Computing, 13(1), 26-33.
Page 322
306
Cheng, T. C. E., Lam, D. Y. C., & Yeung, A. C. L. (2006). Adoption of internet
banking: An empirical study in Hong Kong. Decision Support Systems, 42(3),
1558-1572.
Cheung, S. F., Chan, D. K.-S., & Wong, Z. S.-Y. (1999). Reexamining the theory of
planned behavior in understanding wastepaper recycling. Environment and
Behavior, 31, 587.
Chin, W. W. (1996). The measurement and measuring of IT usage: reconciling recent
discrepancies between self-reported and computer recorded usage. Paper
presented at the IS Proceedings of the 24th Conference of Administrative
Science Association of Canada, Montreal.
Chin, W. W. (1998). Issues and opinion on structural equation modeling. MIS
Quarterly 22 (1), 7–16.
Chua, W. F. (1986). Radical Developments in Accounting Thought. The Accounting
Review, 61, 601-632.
Chung, W., & Paynter, J. (2002, January). An Evaluation of Internet Banking in New
Zealand. Paper presented at the 35th Annual Hawaii International Conference
on System Science, HICSS -35.
Churchill, G. (1979). A Paradigm for Developing Better Measures of Marketing
Constructs. Journal of Marketing Research, 16(1), 68.
Cohen, J. (1988) Statistical Power Analysis for the Behavioral Sciences, 2nd edition.
Hillsdale, NJ: L. Erlbaum Associates.
Cohen, L., & Holliday, M. (1982). Statistics for Social Scientist. London: Harper &
Row.
Cohen, S. S. (1988). Practical statistics. London; Baltimore: E. Arnold.
Collins, W. (1970). Interviewers' verbal idiosyncrasies as a source of bias. Public
Opinion Quarterly, 34, 416– 422.
Coltman, T., Devinney, T. M., Midgley, D. F., & Venaik, S. (2008). Formative versus
reflective measurement models: two applications of formative measurement.
Journal of Business Research 61(12), 1250-1262.
Communication and Information Technology Commission (CITC). (2006). 2006
Annual Report: ICT Sector in the Kingdom of Saudi Arabia. Retrieved May
10, 2008, from http://www.citc.gov.sa
Communication and Information Technology Commission (CITC). (2007). 2007
Annual Report: Internet Growth. Retrieved May 27, 2008, from
http://www.citc.gov.sa
Page 323
307
Communication and Information Technology Commission (CITC). (2008). Internet
Usage in the Kingdom of Saudi Arabia. Retrieved June 10, 2008, from
http://www.citc.gov.sa
Communication and Information Technology Commission (CITC). (2010). IT Report
2010: On the Internet Ecosystem in Saudi Arabia. Retrieved November 14,
2010, from http:// www.citc.gov.sa
Communication and Information Technology Commission (CITC). (2012). ICT
Indicators in K.S.A (End of 9M - 2011). Retrieved January 10, 2012, from
http:// www.citc.gov.sa
Compeau, D. R., & Higgins, C. A. (1995). Computer Self-Efficacy: Development of a
Measure and Initial Test. MIS Quarterly, 19(2), 189-211.
Cooper, D. R., & Schindler, P. S. (2001). Business research methods. Singapore:
McGraw-Hill.
Cooper, R. G. (1997). Examining some myths about new product winners (in Katz, R.
ed.). Oxford: The Human Side of Managing Technological Innovation.
Corley, K. G., & Gioia, D. A. (2011). Building theory about theory building: what
constitutes a theoretical contribution? Academy of Management Review, 36(1),
12–32.
Corrocher, N. (2006). Internet adoption in Italian banks: An empirical investigation.
Research Policy, 35(4), 533-544 .
Creswell, J. W. (2003). Research design : qualitative, quantitative, and mixed
methods approaches. Thousand Oaks, Calif. [u.a.]: Sage Publ.
Cronbach, L. J. (1946). Response sets and test validity. Educational and
Psychological Measurement, 6, 475– 494.
Cronbach, L. J. (1950). Further evidence on response sets and test validity.
Educational and Psychological Measurement, 10, 3– 31.
Croninger, R. G., & Douglas, K. M. (2005). Missing data and institutional research,
New directions for institutional research (Umbach, P. D. (Ed.), Survey
research ed.). San Francisco: Jossey-Bass.
D’Ambra, J., & Rice, R. E. (2001). Emerging factors in user evaluation of the World
Wide Web. Information & Management, 38(6), 373–384.
Daniel, E. (1999). Provision of electronic banking in the UK and the Republic of
Ireland. International Journal of Bank Marketing, 17(2), 72-83.
Daniel, W. W. (1975). Nonresponse in Sociological Surveys: A Review of Some
Methods for Handling the Problem. Sociological Methods and Research, 3,
291-307.
Page 324
308
David, M., & Sutton, C. (2004). Social Research. The Basics: London, Thousand
Oaks, New Delhi: Sage.
Davis, F. D. (1989). Perceived Usefulness, Perceived Ease of Use, and User
Acceptance of Information Technology. MIS Quarterly, 13(3), 319-339.
Davis, F. D. (1993). User acceptance of information technology: system
characteristics, user perceptions and behavioral impacts. International Journal
of Man-Machine Studies, 38, 475-487.
Davis, L. D., Bagozzi, R. P., & Warshaw, P. R. (1989). User acceptance of computer
technology: A comparison of two theoretical models. Management Science,
35(8), 982-1003.
De Leeuw, E. D., Hox, J., & Huisman, M. (2003). Prevention and Treatment of Item
Nonrespone. Journal of Official Statistics, 19(2), 153-176.
DeLone, W. H., & McLean, E. R. (1992). Information Systems Success: The Quest
for the Dependent Variable. Information Systems Research, 3(1), 60-95.
DeLone, W. H., & McLean, E. R. (2003). The DeLone and McLean Model of
Information Systems Success: A Ten-Year Update. Journal of Management
Information Systems, 19(4), 9-30.
Denscombe, M. (1998). The good research guide. Buckingham: Open University
Press.
DeVillis, R. (1991). Scale Development: Theories and Applications. Newbury Park,
California: Sage.
Diamantopoulos, A., & Winklhofer, H. M. (2001). Index construction with formative
indicators: an alternative to scale development. Journal of Marketing
Research, 38(2), 269-277.
Diamantopoulos, A., Riefler, P., & Roth, K. P. (2008). Advancing formative
measurement models. Journal of business research, 61, 1203-1218.
Dillman, D. A. (2000). Mail and Internet Surveys: the tailored design method New
York: John Wiley & sons, Inc.
Diniz, E. (1998). Web Banking in the USA. Journal of Internet Banking and finance
3(2), 1-7.
Dover, P. A. (1988). The Effect of Technology Selection on Consumer Adoption of
In-home Computerised Banking. International Journal of Bank Marketing,
6(2), 31 - 37.
Easterby-Smith, M., Lowe, A., & Thorpe, R. (2002). Management research : [an
introduction]. London: SAGE.
Page 325
309
Easterby-Smith, M., Thorpe, R., & Lowe, A. (1991). Management research. London:
Sage Publications.
Eastin, M. S. (2002). Diffusion of E-commerce: An analysis of the adoption of four e-
commerce activities. Telematics and Informatics, 19(3), 251-267.
economywatch.com. (2012). GDP growth, Inflation and Unemployment rates for
Saudi Arabia (2000-2011). Retrieved January 13, 2012, from
http://www.economywatch.com
eFinancePortal.com. (2008). Basel Committee on Banking Supervision Retrieved
March 23, 2008, from
http://efinanceportal.com/efp/viewCategoryDetail.do?categoryId=3193&indus
tryId=18
Eldabi, T., Robinson, S., Taylor, S. J. E., & Wilcox, P. A. (2002). Paper presented at
the Proceedings of the Simulation Study Group Two-Day Workshop, The
Operational Research Society, Birmingham, UK.
Emmanouilides, C., & Hammond, K. (2000). Internet usage: Predictors of active users
and frequency of use. Journal of Interactive Marketing, 14(2), 17-32.
ePaynews.com. (2003). Epayment resource center - statistics for online banking.
Retrieved January 1, 2008, from
http://www.epaynews.com/statistics/bankstats.html
Eriksson, K., Kerem, K., & Nilsson, D. (2005). Customer acceptance of Internet
banking in Estonia. International Journal of Bank Marketing, 23(2), 200-216.
Essinger, J. (1999). The virtual banking revolution : the customer, the bank and the
future. London: International Thomson Business Press.
Falk, R. F. and N. B. Miller (1992) A Primer for Soft Modeling. Akron, OH:
University of Akron Press.
Faroqui, M. (2002). Islamic Banking and Investment. New York: Kegan Paul
International.
Field, A. (2000). Discovering statistics using SPSS for Windows : advanced
techniques for the beginner. London: Sage Publications.
Field, A. (2005). Discovering statistics using SPSS (2nd ed.). London: Sage.
Filotto, U., Tanzi, P. M., & Saita, F. (1997). Customer needs and front-office
technology adoption. International Journal of Bank Marketing 15(1), 13–21.
Fishbein, M., & Ajzen, I. (1975). Belief, Attitudes, Attention and Behaviour, An
Introduction to theory and Research. UK: Addison Wesley Publishing Co.
Page 326
310
Fiske, D. W. (1982). Convergent–discriminant validation in measurements and
research strategies, Forms of validity in research (D. Brinbirg & L. H. Kidder
ed.). San Francisco: Jossey-Bass.
Fornell, C., Larcker, DF. (1981). Evaluating structural equation models with
unobservable variables and measurement error. J Mark Res, 18(1), 39-50.
Forza, C. (2002). Survey research in operations management: a process-based
perspective. Journal of Operations & Production Management, 22(2), 152-
1194.
Fram, E. H., & Grady, D. B. (1995). Internet buyers: will the surfers become buyers?
Direct Marketing, 58(6), 63-65.
Francis, C., & Buckland, I. (2001, March 11). The Great Net Stand-off. The
Independent.
Frankfort-Nachmias, C., & Nachmias, D. (1996). Research Methods in the Social
Sciences (5th ed.). London: Arnold.
Freedman, C., Kumhof, M., Laxton, D., & Lee, J. (2009, March, 6). The case for a
global fiscal stimulus. IMF Staff Position Note 09/03.
Furst, K., Lang, W. W., & Nolle, D. E. (2002). Internet Banking: Developments and
Prospects. Working Paper, Centre for Information Policy Research at
Harvard University, Cambridge, MA.
Gait, A. H., & Worthington, A. C. (2007). An Empirical Survey of Individual
Consumer, Business Firm and Financial Institution Attitudes towards Islamic
Methods. School of Accounting & Finance, University of Wollongong,
Working Paper 8, 2007 Retrieved November 10, 2010, from
http://ro.uow.edu.au/accfinwp/8/
Gandy, A. (1998a). How the internet will shape global banking. Chartered Banker,
4(4), 32-33.
Ganster, D. C., Hennessey, H. W., & Luthans, F. (1983). Social desirability response
effects: Three alternative models. Academy of Management Journal, 26, 321–
331.
Gates, B. (1999). Business @ the speed of thought. England: Harmondsworth:
Penguin book Ltd.
Gatignon, H., & Robertson, T. S. (1985). A propositional inventory for new diffusion
research. Journal of Consumer Research, 11, 849-867.
George, T. (2002). Online Banking Blooming, Finally. Information week Retrieved
March 05, 2007, from http://www.informationweek.com
Page 327
311
Gerrard, P., & Cunningham, J. B. (2003). The diffusion of Internet banking among
Singapore consumers. The International Journal of Bank Marketing, 21(1),
16-28.
Ghannadian, F. F., & Goswami, G. (2004). Developing economy banking: The case
of Islamic banks. International Journal of Social Economics, 31(8), 740-752.
Ghayyur, T. (2003). Understanding Punishment in Shari’ah [I]: Its Role & Principles
at a Glance. Retrieved November 2, 2009, from
http://articles.youngmuslims.ca/islamic-history-and-
civilization/understanding-punishment-in-shariah-i-its-role-principles-at-a-
glance/
Gkoutzinis, A. A. (2006). Internet banking and the law in Europe : regulation,
financial integration and electronic commerce. Cambridge, UK: Cambridge
university press.
Gonzalez, J., & Chiagouris, L. (2006). Internet Support Companies: The Impact of
Marketing Orientation. Journal of Internet Banking and Commerce, 11(1).
Gonzalez, M. E., Quesada, G., Picado, F., & Eckelman, C. A. (2004). Customer
satisfaction using QFD: an e-banking case. Managing Service Quality, 14(4),
317-330.
Grealish, A. (2002). Online Banking Adoption: Beyond the Tip of the Iceberg. Celent
November 14. Retrieved Aug. 20, 2007, from http://www.celent.com
Greene, W. H. (1997). Econometric Analysis (3rd ed.): Prentice-Hall International.
Greenspan, R. (2002). Users Bank on Internet. CyberAtlas, Jupitermedia Corporation
December 16, 2002. Retrieved March 9, 2007, from
http://cyberatlas.internet.com/markets/finance/article.html
Guadagni, P. M., & Little, J. D. C. (1983). A Logit Model of Brand Choice Calibrated
on Scanner Data. Marketing Science, 2(3), 203-238.
Guiltinan, J. P., & Donnelly, J. H. (1983). The use of product portfolio analysis in
bank marketing planning. in Shanmugam and Burke (Eds), Management
Issues for Financial Institutions, 50.
Gulf Cooperation Council (GCC). (2008). employment statistical reports (2008).
Retrieved June 20, 2010, from http://www.gccsg.org/eng/index.php
Guozheng, Z., Faming, Z., & Jian, L. (2007). Factors Affecting Customer’s
Interactions with E-Bank: An Empirical Analysis in china. Business School of
Hunan Agricultural University, Changsha, 410128, China Retrieved
November 23, 2010, from
http://www.seiofbluemountain.com/upload/product/200911/2008scyxhy01a6.
pdf
Gupta, S. (1988). Impact of Sales Promotions on When, What, and How Much to
Buy. Journal of Marketing Research, 25(4), 342-355.
Page 328
312
Gurau, C. (2002). E-banking intransition economies: the case of Romania. Journal of
Financial Services Marketing, 6(4), 362-378.
Gurau, C. (2006). Multi-channel banking in Romania. International Journal of
Financial Services Management, 1(4), 381-399.
Guriting, P., & Ndubisi, N. (2006). Borneo online banking: evaluating customer
perceptions and behavioural intention. Management Research News, 29(1/2),
6-15.
Guru, B. K., Shanmugam, B., Alam, N., & J.Perera, C. (2003). An Evaluation Of
Internet Banking Sites In Islamic Countries. Journal of Internet Banking and
Commerce, 8(2).
Habib, G., Yavas, U., Kassem, S., & Al-Modaifer, K. (1987). The bank marketing
scene in Saudi Arabia. International Journal of Bank Marketing, 5(2), 20-32.
Hackleman, E. C., & Duker, J. M. (1980). Deal Proneness and Heavy Usage: Merging
Two Market Segmentation Criteria. Journal of the Academy of Marketing
Science, 8, 332-344.
Hair, J. F., Anderson, R. E., Tatham, R. L., & Black, W. C. (1998). Multivariate data
analysis (5th
ed.). Englewood Cliffs, N.J. and London: Prentice Hall
International.
Haley, C. (2003). Interest in Online Banking Grows. CyberAtlas, Jupitermedia
Corporation December 30, 2003. Retrieved January 13, 2007, from
http://cyberatlas.internet.com/markets/finance/article.html
Handricks, W. A. (1949). Adjustment for Bias by Non-Response in Mail Surveys.
Agricultural Economics Research, 1, 52.
Haniffa, R., & Hudaib, M. (2007). Locating audit expectations gap within a cultural
context: The case of Saudi Arabia. Journal of international accounting,
auditing & taxation., 16(2), 1-28.
Harman, H. H. (1976). Modern factor analysis. Chicago: University of Chicago Press.
Harris, L. C., & Watkins, P. (1998). The impediments to developing a market
orientation: an exploratory study of small UK hotels. International Journal of
Contemporary Hospitality Management, 10(6), 221-226.
Harrison, D. A., McLaughlin, M. E., & Coalter, T. M. (1996). Context, cognition, and
common method variance: Psychometric and verbal protocol evidence.
Organizational Behavior and Human Decision Processes, 68(3), 246–261.
Hawkins, D. I., Best, R. J., & Coney, K. A. (1998). Consumer Behaviour: Building
Marketing Strategy (7th ed.). London: McGraw Hill.
Heider, F. (1958). The psychology of interpersonal relations. New York: Wiley.
Page 329
313
Hendricks, W. A. (1949). Adjustment for bias by nonresponse in mailed surveys.
Agricultural Economics Research, 1, 52-56.
Hermida, A. (2002). Saudis block 2,000 websites. BBC News July 31, 2002. Retrieved
April 12, 2007, from http://news.bbc.co.uk/2/hi/technology/2153312.html
Hesson, M., & Al-Ameed, H. (2007). Online security evaluation process for new e-
services. Business Process Management Journal, 13(2), 223-246.
Hiltunen, M., Laukka, M., & Luomala, J. (2002). Mobile User Experience: Helsinki:
IT Press.
Hinkin, T. R. (1995). A Review of Scale Development Practices in the Study of
Organizations. Journal of Management, 21(5), 967-988.
Hoffman, D. L., & Novak, T. P. (1996). Marketing in Hypermedia Computer-
Mediated Environments: Conceptual Foundations. The Journal of Marketing,
60(3), 50-68.
Hofstede, G. (1984). Culture's Consequences. London: Sage.
Hosein, N. (2010). Internet banking: Understanding consumer adoption rates among
community banks [Electronic Version]. Retrieved December 20, 2011 from
http://www.aabri.com/LV2010Manuscripts/LV10038.pdf.
Hosein, N. Z. (2009). Internet Banking: An Empirical Study Of Adoption Rates
Among Midwest Community Banks. Journal of Business & Economics
Research, 7(11).
Howard, J. A. (1977). Consumer behavior : application of theory. New York:
McGraw-Hill.
Howard, J., & Moore, W. (1982). Changes in consumer behaviour over the product
life cycle. in Tushman and Moore (Eds), Readings in the Management of
Innovation, Pitman, 128.
Howcroft, B., Hamilton, R., & Hewer, P. (2002). Consumer attitude and the usage and
adoption of home-based banking in the United Kingdom. The International
Journal of Bank Marketing, 20(3), 111-121.
Howell, R., Breivik, E., & Wilcox, J. (2007). Is formative measurement really
measurement? Psychological Methods, 12(2), 238-245.
Hoxmeier, J. A., Nie, W., & Purvis, G. T. (2000). The Impact of Gender and
Experience on User Confidence in Electronic Mail. Journal of End User
Computing, 12(4), 11-20.
Hoyle, R. H. (1995). Structural Equation Modeling. Thousand Oaks, CA: SAGE
Publications, Inc.
Page 330
314
Hua, G. (2009). An Experimental Investigation of Online Banking Adoption in China.
Journal of Internet Banking and Commerce, 14(1), 1-12.
Humaidan, M. (2010). Many Saudis do not report cyber crimes In Saudi Arabia. Arab
News January 31, 2010. from
http://www.menafn.com/qn_news_story_s.asp?StoryId=1093300575&src=M
OEN
Hussey, J., & Hussey, R. (1997). Business research : a practical guide for
undergraduate and postgraduate students. London: Macmillan Press Ltd.
Idaszak, J. R., & Drasgow, F. (1987). A revision of the Job Diagnostic Survey:
Elimination of a measurement artifact. Journal of Applied Psychology, 72, 69-
74.
Institute of Islamic Banking and Insurance. (2009). Glossary of Financial Terms.
Retrieved June 17, 2009, from http://www.islamic-
banking.com/glossary_R.aspx
Institute of Islamic Banking and Insurance. (2009). What is Islamic Banking?
Retrieved June 17, 2009, from http://www.islamic-
banking.com/ibanking/whatib.php
International Data Corporation (IDC). (2005). 2005 Global Information Security
Workforce Study, A. Carey.
Internet World Statistics. (2005). World Internet Penetration rate. Retrieved Feb 25,
2009, from http://www.internetworldstats.com/pr/edi010.htm
Internet World Statistics. (2011). Internet Penetration rate in SA, GCC and other
countries. Retrieved Feb 25, 2012, from http://www.internetworldstats.com
Iqbal, Z., & Mirakhor, A. (2007). An Introduction to Islamic Finance: Theory and
Practice. Singapore: John Wiley and Sons (Asia) Pte. Ltd.
Jackman, R. W. (1985). Cross-National Statistical Research and the Study of
Comparative Politics. American Journal of Political Science, 29(1), 161-182.
Jabnoun, N., & Khalifa, A. (2005). A customized measure of service quality in the
UAE. Managing Service Quality, 15(4), 374-388.
Jaruwachirathanakul, B., & Fink, D. (2005). Internet Banking Adoption Strategies for
a Developing Country: The Case of Thailand. Internet Research, 15(3), 295-
311.
Jarvenpaa, S. L., & Majchrzak, A. (2008). Knowledge Collaboration among
Professionals’ Protecting National Security: Role of Transactive Memories in
Ego-Centric Knowledge Networks. Organization Science, 19(2), 260-276.
Page 331
315
Jarvis, C. B., Mackenzie, S. B., & Podsakoff, P. M. (2003). A critical review of
construct indicators and measurement model misspecification in marketing
and consumer research. Journal of Consumer Research, 30(2), 199-218.
Jasimuddin, S. M. (2001). Saudi Arabian Banks on the Web. Journal of Internet
Banking and Commerce, 6(1), 1-7.
Jayawardhena, C., & Foley, P. (2000). Changes in the banking sector - the case of
Internet banking in the UK. Internet Research, 10(1), 19-30.
Jeong, M., & Lambert, C. U. (2001). Adaptation of an information quality framework
to measure customers' behavioral intentions to use lodging Web sites.
International Journal of Hospitality Management, 20(2), 129-146.
Johany, A. D., Berne, m., & Mixon, W. (1986). The Saudi Arabian Economy.
Baltimore: MD: John Hopkins University Press.
Johnson, B. A., Ott, J. H., Stephenson, J. M., & Weberg, P. K. (1995). Banking on
multimedia. The McKinsey quarterly(2), 94-106.
Johnson, B., & Christensen, L. (2000). Educational Research: Quantitative and
Qualitative Approach. Boston, MA, US: Allyn & Bacon.
Jones, H. (2000). Convenience is the key. The Independent Retrieved December 20,
2006, from http://www.independent.co.uk/story.jsp?story=44196
Jun, M., & Cai, S. (2001). The key determinants of Internet banking service quality: A
content analysis. The International Journal of Bank Marketing, 19(7), 276-
291.
Kalakota, R., & Whinston, A. (1997). Electronic commerce: A manager’s guide.
Reading, Mass.: Addison Wesley.
Karahanna, E., Straub, D. W., & Chervany, N. L. (1999). IT Adoption across Time.
MIS Quarterly, 23(2), 183-213.
Karjaluoto, H., Mattila, M., & Pento, T. (2002). Factors underlying attitude formation
towards online banking in Finland. The International Journal of Bank
Marketing, 20(6), 261-272.
Kassim, N. M. (2006). Telecommunications industry in Malaysia: demographics
effect on customer expectations, performance, satisfaction and retention. Asia-
Pacific Business Review, 12(4), 437-363.
Kassim, N. M., & Ahmed, A. M. (2006). The influence of attraction on internet
banking: an extension to the trust-relationship commitment model.
International Journal of Bank Marketing, 24(6), 424-442.
Page 332
316
Keldon, B., & Scott, E. H. (2006). The effect of heterogeneous risk on the early
adoption of Internet banking technologies. Journal of Banking & Finance,
30(6), 1713.
Kerlinger, F. N. (1992). Foundations of Behavioral Research (3 ed.): Harcount Brace.
Khan, B. S. (2004). Consumer Adoption of Online Banking: Does Distance Matter?
UC Berkeley: Department of Economics, UCB Retrieved September, 12, 2008,
from http://www.escholarship.org/uc/item/2bt1d76s
Kiefer, N. M. (1988). Economic duration data and hazard functions. Journal of
Economic Literature, 25, 646–679.
King Abdulaziz City for Science and Technology (KACST). (2005). The IT
infrastructure in Saudi Arabia. Retrieved November 17, 2007, from
http://www.kacst.edu.sa
King, W. R., & He, J. (2006). A meta-analysis of the technology acceptance model.
Information & Managemement, 43, 740-755.
Kline, T. J. B., Sulsky, L. M., & Rever-Moriyama, S. D. (2000). Common method
variance and specification errors: A practical approach to detection. The
Journal of Psychology, 134, 401– 421.
Klobas, J. E. (1995). Beyond Information Quality: Fitness for Purpose and Electronic
Information Resource Use. Journal of Information Science, 21(2), 95.
Kolodinsky, J. M., Hogarth, J. M., & Hilgert, M. A. (2004). The adoption of
electronic banking technologies by US consumers. The International Journal
of Bank Marketing, 22(4), 238-259.
Kotler, P., & Keller, K. L. (2009). Marketing Management (13th ed.). Upper Saddle
River, New Jersey: Pearson Prentice Hall.
Kshirsagar, A. E., McNamara, P. G., & Weir, J. (2001). A Broadband Future for
Financial Advice. The McKinsey Quarterly 2001(2).
Kuwaiti Global Investment House (GIH). (2008). Performance of Saudi banks in Q3
affected by global credit crisis. Emirates Business 24/7.
Laforet, S., & Li, X. (2005). Consumers´ Attitudes Towards Online and Mobile
Banking in China. International Journal of Bank Marketing, 23(5), 362-380.
Lai, V. S., & Li, H. (2005). Technology acceptance model for internet banking: an
invariance analysis. Information & Management, 42(2), 373-386.
Lallmahamood, M. (2007). An Examination of Individual’s Perceived Security and
Privacy of the Internet in Malaysia and the Influence of This on Their
Intention to Use E-Commerce: Using An Extension of the Technology
Acceptance Model. Journal of Internet Banking and Commerce, 12(3).
Page 333
317
Lam, R., & Burton, S. (2006). SME banking loyalty:A qualitative study in Hong
Kong. International Journal of Bank Marketing 24(1), 37-52.
Lassar, W., Manolis, C., & Lassar, S. (2005). The relationship between consumer
innovativeness, personal characteristics, and online banking adoption.
International Journal of Bank Marketing, 23, 176-199.
Lee, E. J., Kwon, K. N., Lee, D. W. S. J., Kwon, K.-N., & Schumann, D. W. (2005).
Segmenting the non-adopter category in the diffusion of internet banking. The
International Journal of Bank Marketing, 23(5), 414-437.
Lee, M. (2009). Factors influencing the adoption of internet banking: an integration of
TAM and TPB with perceived risk and perceived benefit. Electronic
Commerce Research and Applications, 8(3), 130.
Lee, M., & Turban, E. (2001). A Trust Model for Consumer Internet Shopping.
International Journal of Electronic Commerce, 6(1), 75-91.
Liao, S; Shao, Y. P.; Wang, H.; Chen, A. (1999). The adoption of virtual banking: an
empirical study. International Journal of Information Management, 19(1), 63-
74.
Liao, Z., & Cheung, M. T. (2002). Internet-based e-banking and consumer attitudes:
an empirical study. Information and management., 39(4), 283-295.
Lichtenstein, S., & Williamson, K. (2006). Understanding consumer adoption of
Internet banking: an interpretive study in the Australian banking context.
Journal of Economic Commerce Research, 7(2), 50-66.
Lieb, J. (1999). Worldwide Population: Middle East/Arab Nations. CommerceNet,
1(7).
Lindell, M. K., & Whitney, D. J. (2001). Accounting for common method variance in
cross-sectional research designs. Journal of Applied Psychology, 86(1), 114–
121.
Lindgaard, G., & Dudek, C. (2003). What is this evasive beast we call user
satisfaction. Interacting with Computers, 15, 429-452.
Liu, C., & Arnett, K. P. (2000). Exploring the factors associated with Web site
success in the context of electronic commerce. Information and Management,
38(1), 23–33.
Lockett, A., & Littler, D. (1997). The adoption of direct banking services. Journal of
Marketing Management., 13(8), 791-811.
Maccor Research Solutions. (2011). Sample Size Methodology and Optimization.
Retrieved January 17, 2011, from
http://www.macorr.com/ss_methodology.htm
Page 334
318
Maenpaa, K., Kale, S. H., Kuusela, H., & Mesiranta, N. (2007). Consumer
perceptions of Internet banking in Finland: The moderating role of familiarity.
Journal of Retailing and Consumer Services, 15(4), 266-276.
Maghrabi, A. S. (1999). Assessing the Effect of Job Satisfaction on Managers.
International Journal of Value-Based Management, 12(1), 1-12.
Mahdi, M. O. S. (2011). Trust and security of electronic banking services in Saudi
commercial banks: Saudis versus Non Saudis Opinions. African Journal of
Business Management, 5(14), 5524-5535.
Mangin, J.-P. L., Bourgault, N., & Guerrero, M. M. (2011). Modeling perceived
usefulness on adopting on line banking through the tam model in a Canadian
banking environment. Journal of Internet Banking and Commerce, 16(1).
Mansumitrchai, S., & Chiu, C. (2012). Adoptation of internet banking in UAE:
Factors underlying adoption characteristics. International Journal of
Management and Marketing Research, 5(1).
Martin, J. (1998). Say Goodbye to Bankers' Hours. Management review, 87(1), 33-37.
Masocha, R., Chiliya, N., & Zindiye, S. (2011). E-banking adoption by customers in
the rural milieus of South Africa: A case of Alice, Eastern Cape, South Africa.
African Journal of Business Management, 5(5), 1857-1863.
Mathwick, C., Malhotra, N., & Rigdon, E. E. (2001). The Effect of Dynamic Retail
Experiences on Experiential Perceptions of Value:an Internet and Catalog
Comparison. Journal of Retailing, 78(1), 51–60.
Matt Elbeck, & Evangellos-VagelisDedoussis. (2010). Arabian Gulf innovator
attitudes for online Islamic bank marketing strategy. Journal of Islamic
Marketing, 1(3), 268-285.
Mattila, M. (2001). Essays on Customers in the Dawn of Interactive Banking.
Unpublished Doctoral dissertion, University of Jyväskylä, Jyväskylä.
Mattila, M., Karjaluoto, H., & Pento, T. (2003). Internet banking adoption among
mature customers: early majority or laggards? Journal of Services Marketing,
17(5), 514-526.
Mazursky, D., LaBarbera, P., & Aiello, A. (1987). When Consumers Switch Brands.
Psychology & Marketing (1986-1998), 4(1), 17-30.
McGuire, W. J. (1966). The current status of cognitive consistency theories
(S.Feldman ed.). New York: Academic Press.
Mendonca, L., & Nakache, P. (1996). Branch banking is not a dinosaur. The
McKinsey quarterly(1), 136-147.
Page 335
319
Metawa, S. A., & Almossawi, M. (1998). Banking Behaviour of Islamic Bank
Customers: Perspectives and Implications. International Journal of Bank
Marketing, 16(7), 299-313.
Metwally, M. (1996). Attitudes of Muslims Towards Islamic Banks in a Dual-
Banking System. American Journal of Islamic Finance, 6, 11-17.
Mingers, J., & Brocklesby, J. (1997). Multimethodology: Towards a Framework for
Mixing Methodologies. Omega, 25(5), 489.
Ministry of Communications and Information Technology (MCIT). (2007). The
development of ICT sector. Retrieved May 10, 2007, from
http://www.mitc.gov.sa
Miyazaki, A. D., & Fernandez, A. N. A. (2001). Consumer Perceptions of Privacy and
Security Risks for Online Shopping. Journal of Consumer Affairs, 35(1), 27-
44.
Mobily Telecom. (2011). Broadband @ home. Retrieved January 13, 2011, from
http://www.mobily.com.sa/wps/portal
Moga, L. M., Nor, K. M., Neculita, M., & Khani, N. (2012). Trust and Security in E-
banking Adoption in Romania. IBIMA Publishing, 2012, 10 Pages.
Moll, P. G. (1999). Money, Interest Rates, Income and Inflation in South Africa. The
South African Journal of Economics, 67(1), 34-64.
Molla, A., & Licker, P. S. (2001). E-commerce systems success: An attempt to extend
and respecify the DeLone and McLean model of IS success. Journal of
Electronic Commerce Success, 2(4), 1–11.
Mols, N. P. (1998). The behavioral consequences of PC banking. International
Journal of Bank Marketing, 16(5), 195-201.
Mols, N. P. (1999). The Internet and the banks’ strategic distribution channel
decisions. International Journal of Bank Marketing, 17(6), 295 - 300.
Mols, N. P. (2001). Organizing for the effective introduction of new distribution
channels in retail banking. European Journal of Marketing, 35(5-6), 661-686.
Money and Banking. (1992). Country Study & Country Guide for Saudi Arabia.
December 1992. Retrieved November 22, 2007, from
http://www.lupinfo.com/countrv-guide¬study/s audi-arabia/saudi-
arabia77.html
Morgan, F. W. (1979). Are Early Triers Heavy Users? Journal of Business, 52(3),
429-434.
Morgan, R. M., & Hunt, S. D. (1994). The Commitment-Trust Theory of Relationship
Marketing. The Journal of Marketing, 58(3), 20-38.
Page 336
320
MsMoney.com. (2002). What is Internet Banking? Retrieved January 5, 2008, from
http://www.msmoney.com/mm/banking/onlinebk/what is.htm
Naser, K., Jamal, A., & Al-Khatib, K. (1999). Islamic banking: a study of customer
satisfaction and preferences in Jordan. International Journal of Bank
Marketing, 17(3), 130-135 .
Nasri, W. (2011). Factors Influencing the Adoption of Internet Banking in Tunisia.
International Journal of Business and Management, 6(8).
Nath, R., Shrick, P., & Parzinger, M. (2001). Bankers' Perspectives on Internet
Banking. e-Service Journal, 1(1), 21-36.
Nelson, O. N., & Queenie, S. (2006). Consumer attitudes, system's characteristics and
internet banking adoption in Malaysia. Management Research News, 29(1-2),
16-27.
Newman, L. W. (2003). Social Research Methods: Qualitative and Quantitative
Approaches (5 ed.). Boston: Pearson Education.
Nicholas, M. (1997). More go online to skip queues at the bank. The European,
357(March 13), 9-10.
Nik Ahmad , N. A., & Sulaiman, M. (2004). Environment disclosure in Malaysia
annual reports: A legitimacy theory perspective. International Journal of
Commerce and Management, 14(1), 44-58.
Nor, K. M., & Pearson, J. M. (2007). The Influence of Trust on Internet Banking
Acceptance. Journal of Internet Banking and Commerce, 12(2). Nor, M., & Pearson, J. M. ( 2008). An Exploratory Study Into The Adoption of
Internet Banking in A Developing Country: Malaysia. Journal of Internet
Commerce, 7(1), 29-73.
Nunnally, J. (1978). Psychometric theory. New York: McGraw-Hill.
Nunnally, J. C., & Bernstein, I. H. (1994). Psychometric Theory. New York:
McGraw-Hill.
O'Connell, B. (1996). Australian Banking on the Internet - Fact or Fiction. Australian
Banker, 110(6), 212-214.
O'Connell, K. (2008). Saudis Censor Blogger, Highlighting Lack of Online Rights.
Retrieved September 27, 2010, from
http://www.ibls.com/internet_law_news_portal_view.aspx?s=latestnews&id=1
953
Omer, H. (1992). The Implication of Islamic Beliefs and Practice on Islamic
Financial Institutions in the UK. Ph.D Dissertation, Loughborough University.
Oppenheim, A. N. (1992). Questionnaire design, interviewing and attitude
measurement. London, UK: Pinter Publishers.
Page 337
321
Osgood, C. E., & Tannenbaum, P. H. (1955). The principle of congruity in the
prediction of attitude change. Psychological Review, 62, 42– 55.
Oweiss, I. M. (1990). Economics of Petrodollars,The Economic Dimensions of
Middle Eastern History (In Haleh and Esfandiari and A.L. Udovitch ed.).
Princeton: NJ: Darwin Press.
Pallant, J. (2001). SPSS survival manual : a step by step guide to data analysis using
SPSS for Windows (versions 10). Buckingham: Open University Press.
Pallant, J. (2006). SPSS survival manual. A step by step guide to data analysis using
SPSS version 12 (2 ed.). Buckingham: Open University Press.
Palmer, J. W. (2002). Web site usability, design, and performance metrics.
Information Systems Research, 13(2), 151–167.
Parra, F. (2004). Oil Politics: A Modern History of Petroleum: IB Tauris.
Pastore, M. (1999d). Saudi Arabia Gets Wired. July 21, 1999. Retrieved May 2, 2007,
from http://www.clickz.com/showPage.html?page=151061
Pavlou, P. A., Liang, H., & Xue, Y. (2007). Understanding and Mitigating
Uncertainty in Online Exchange Relationships: A Principal-Agent Perspective.
MIS Quarterly, 31(1), 105-136.
Peter, J. P. (1981). Construct validity: a review of basis issues and marketing
practices. Journal of Marketing Research, 18(May), 133-145.
Peterson, R. A. (2000). Constructing Effective Questionnaires. Thousand Oaks: CA:
Sage Publications.
Petty, R. E., & Cacioppo, J. T. (1981). Attitudes and persuasion--classic and
contemporary approaches. Dubuque, Iowa: W.C. Brown Co. Publishers.
Pew. (2003). convenience is king. Pew Internet and American Life Project Retrieved
Oct. 15, 2007, from http://www.pewInternet.org/reports.asp?
Pikkarainen, T., Pikkarainen, K., Karjaluoto, H., & Pahnila, S. (2004). Consumer
acceptance of online banking: an extension of the technology acceptance
model. Internet Research: Electronic Networking Applications and Policy,
14(3), 224-235.
Pituch, K. A., & Lee, Y. (2006). The Influence of System Characteristics on E-
learning use. Computer & Education, 47(2), 222-244.
Platt, G. (2012). Saudi Arabia is preparing to open its stock markets to foreign
investment, and it has reinforced its financial management team in preparation
for this and broader economic reforms. Global Finance.
Platts.com. (2010). Monthly Crude Oil Prices with the adjusted inflation (1946-2010).
Retrieved June 17, 2010, from http://www.platts.com/
Page 338
322
Podsakoff, P. M., & Organ, D. W. (1986). Self-reports in organizational research:
Problems and prospects. Journal of Management, 12(4), 531–544.
Podsakoff, P. M., Mackenzie, S.B., Lee, J., & Podsakoff, N. P. (2003). Common
method biases in behavioral research: a critical review of the literature and
recommended remedies. Journal of Applied Psychology, 88(5), 879-903.
Polatoglu, V. N., & Ekin, S. (2001). An empirical investigation of the Turkish
consumers' acceptance of Internet banking services. The International Journal
of Bank Marketing, 19(4), 156-165.
Porter, M. E. (2009). Competitiveness and the State of Entrepreneurship in Saudi
Arabia. Retrieved January 5, 2011, from
http://www.isc.hbs.edu/pdf/20090127_Saudi_Arabia_Competitiveness_and_E
ntrepreneurship.pdf
Porter, R. S. (2004). New direction for institutional research. Wiley Periodicals Inc.,
121, 5-21.
Poon, W. C. (2008). User's adoption of e-banking services: the Malaysian perspective.
Journal of Business and Industrial Marketing, 23(1), 59-69.
Prestholdt, P. H., Lane, I. M., & Mathews, R. C. (1987). Nurse Turnover as Reasoned
Action: Development of Process Model. Journal of Applied Psychology,
72(2), 221-227.
Prompattanapakdee, S. (2009). The Adoption and Use of Personal Internet Banking
Services in Thailand. The Electronic Journal on Information Systems in
Developing Countries, 37(6), 1-31.
Punch, K. F. (2005). Introduction to Social Research–Quantitative & Qualitative
Approaches (2nd ed.). London: Sage.
Putnam, L. L. (1983). The Interpretive Perspective: An Alternative to Functionalism
(In L. L. Putnam and M. E. Pacanowsky (Eds.) ed.). CA: Sage, 31-54.
Quinn, R. B., & Mueller, J. A. (1982). Transferring research results to operations. in
Tushman and Moore (Eds), Readings in the Management of Innovation,
Pitman, MA, 62.
Rai, A., Lang, S. S., & Welker, R. B. (2002). Assessing the validity of IS success
models: An empirical test and theoretical analysis. Information Systems
Research, 13(1), 50–69.
Rajan, R. G. (1998). The Past and Future of Commercial Banking Viewed through an
Incomplete Contract Lens. Journal of Money, Credit, and Banking, 30(3),
524-550.
Ramady, M. A. (2005). The Saudi Arabian Economy. New York: Springer
Science+Business Media, Inc.
Page 339
323
Ramady, M. A. (2010). The Saudi Arabian Economy (2nd ed.). New York: Springer
Science+Business Media, Inc.
Ramady, M., & Sahlawi, M. (2005). Education as a force for economic change in an
oil based economy: a case study of Saudi Arabia. Journal of Energy and
Development, 30(2).
Raman, M., Stephenaus, R., Alam, N., & Kuppusamy, M. (2008). Information
Technology in Malaysia: E-service quality and Uptake of Internet banking.
Journal of Internet Banking and Commerce, 13(2).
Ramsay, J., & Smith, M. (1999). Managing customer channel usage in the Australian
banking sector. Managerial Auditing Journal, 14(7), 329 - 338.
Reio, T. G. (2010). The Threat of Common Method Variance Bias to Theory
Building. Human Resource Development Review, 9(4), 405-411.
Remenyi, D., Swartz, E., Money, A. R., & Williams, B. (1998). Doing research in
business and management : an introduction to process and method. London:
SAGE Publications.
Reuters. (2000). Saudi banks embark on Internet race. Arabia.com, Dubai August 23,
2000. Retrieved April 23, 2007, from
http://www.arabialink.com/Archive/GWDigests/GWD2000/GWD_2000_08_2
8.htm
Reynolds, J. (2000). e-Commerce: a critical review. International Journal of Retail &
Distribution Management, 28(10), 417-444.
Rhee, S., & Riggins, F. (1999). Internet user's perception of world wide web vendors
and their support of consumer mercantile activities. Centre for Electronic
Commerce at the DuPree College of Management at Georgia Tech.
Rigopoulos, G., & Askounis, D. (2007). A TAM Framework to Evaluate Users’
Perception towards Online Electronic Payments. Journal of Internet Banking
and Commerce, 12(3).
Robertson, B., & Sribar, V. (2002). The adaptive enterprise : IT infrastructure
strategies to manage change and enable growth. Hillsboro, OR; Boston: Intel
Press ; Addison-Wesley.
Rockart, J. (1979). Chief Executives Define Their Own Information Needs. Harvard
Business Review, 81-92.
Rogers, E. M. (2002). Diffusion of preventive innovations. Addictive Behaviors,
27(6), 989-993.
Rogers, E. M., & Shoemaker, F. (1971). Communications in Innovation. New York:
Free Press.
Page 340
324
Rombel, A. (2005). World's Best Internet Banks. Global finance, 19(11), 29-34.
Roszak, T. (1994). The cult of information : a neo-luddite treatise on high tech,
artificial intelligence and the true art of thinking. Berkeley; Los Angeles;
London: University of California Press.
Rotchanakitumnuai, S., & Speece, M. (2003). Barriers to Internet banking adoption: a
qualitative study among corporate customers in Thailand. International
Journal of Bank Marketing, 21(6/7), 312-323.
Rothwell, R., & Gardiner, P. (1984). Design and competition in engineering. Long
Range Planning, 17(3), 78-91.
Sadeghi, T., & Farokhian, S. (2011). Services quality model for online banking
services by behavioral adoption theories and comparative study. African
Journal of Business Management, 5(11), 4490-4499.
Safeena, R., Date, H., & Kammani, A. (2011). Internet Banking Adoption in an
Emerging Economy: Indian Consumer’s Perspective. International Arab
Journal of e-Technology, 2(1).
Sagi, J. P. (2003). Information technology and business in the New Economy: The
dimensions of culture, gender, and experience, and attitudes about
eCommerce. Ph.D. dissertation, The George Washington University, United
States -- District of Columbia.
Salancik, G. R. (1984). On priming, consistency, and order effects in job attitude
assessment: With a note on current research. Journal of Management, 10,
250– 254.
Salisbury, W. D., Pearson, R. A., & Harrison, A. W. (1998, August 14-16). Who's
Afraid of the World Wide Web? An Initial Investigation into the Relative
Impact of Two Salient Beliefs on Web Shopping Intent. Paper presented at the
Proceedings of the Fourth Americas Conference on Information Systems,
Baltimore.
Salisbury, W. D., Pearson, R. A., Pearson, A. W., & Miller, D. W. (2001). Perceived
security and World Wide Web purchase intention. Industrial Management &
Data Systems, 101(4), 165-177.
Sarel, D., & Marmorstein, H. (2004). Marketing online banking to the indifferent
consumer: A longicudinal analysis of banks actions. Journal of Financial
Services Marketing, 8(3), 231-243.
Sathye, M. (1999). Adoption of Internet banking by Australian consumers: an
empirical investigation. The International Journal of Bank Marketing, 17(7),
324-334.
Page 341
325
Saudi American Bank (SAMBA). (2003). SAMBA Annual report Retrieved Dec. 19,
2007, from http://www.samba.com.sa/eng_index.htm
Saudi Arabian General Investment Authority (SAGIA). (2001). The Tax System for
the foreign companies and investors. Retrieved January 5, 2007, from
http://www.sagia.gov.sa/homepage.asp?Lang=en
Saudi Arabian General Investment Authority (SAGIA). (2005). The Saudi’s National
IT Plan. Retrieved May 5, 2007, from
http://www.sagia.gov.sa/homepage.asp?Lang=en
Saudi Arabian Monetary Agency (SAMA). (2002). The Institute of Banking. Annual
reports Retrieved July 27, 2007, from http://www.sama-ksa.org/en/about
Saudi Arabian Monetary Agency (SAMA). (2003). Globalisation: the Role of
Institution Building in the Financial Sector. Retrieved January 11, 2007, from
http://www.sama-ksa.org/en/about
Saudi Arabian Monetary Agency (SAMA). (2004). Globalisation and the Role of
Institution Building in the Financial Sector in Saudi Arabia. Retrieved January
11, 2007, from http://www.sama-ksa.org/en/about
Saudi Arabian Monetary Agency (SAMA). (2005). History. Retrieved May 20, 2007,
from http://www.sama.gov.sa/english/aboutsama/history.htm
Saudi Arabian Monetary Agency (SAMA). (2008). Islamic Banking. Retrieved June
11, 2008, from http://www.sama-ksa.org/en/about
Saudi Arabian Monetary Agency (SAMA). (2009). Forty Fifth Annual Report, 2009.
Retrieved June 20, 2010, from http://www.sama.gov.sa/Pages/Home.aspx
Saudi Arabian Monetary Agency (SAMA). (2010). Forty Sixth Annual Report.
Retrieved December 20, 2010, from
http://www.sama.gov.sa/Pages/Home.aspx
Saudi Arabian Monetary Agency (SAMA). (2011). SAMA 2011 Annual Report.
Retrieved December 20, 2011, from
http://www.sama.gov.sa/sites/samaen/ReportsStatistics/ReportsStatisticsLib/6
500_R_Annual_En_47_2011_10_27.pdf
Saudi Network Information Centre (SaudiNIC). (2012). Number of the registered
domain names in Saudi Arabia as of February 2012. Retrieved February 18,
2012, from http://www.saudinic.net.sa/page.php?page=9&lang=0
Saudi Telecommunications Company (STC). (2004). History and overview. Retrieved
January 11, 2008, from http://www.stc.com.sa
Saudi Telecommunications Company (STC). (2011). Internet At Home. Retrieved
January 13, 2011, from http://www.stc.com.sa
Page 342
326
Saudi.gov.sa. (2012). Saudi Provinces map. Retrieved March 14, 2012, from
http://www.saudi.gov.sa/wps/portal/
Saunders, M. N. K., Lewis, P., & Thornhill, A. (2000). Research methods for business
students. Harlow: Financial Times/Prentice Hall.
Saunders, M., Lewis, P., & Thornhill, A. (2003). Research Methods for Business
Students (3 ed.). Italy: FT, Prentice Hall, Pearson Education.
Scarbrough, H., & Corbett, J. M. (1992). Technology and Organisation: Power,
Meaning and design. London: Routledge.
Scheaffer, R. L., Mendenhall, W., and Ott, L. (1990). Elementary Survey Sampling
(4th ed.). California: Duxbury Press.
Schneider, G. P., & perry, J. T. (2000). Electronic Commerce. Cambridge, MA:
Course Technology.
Sekaran, U. (1992). Research Methods for Business: A Skill Building Approach (2nd
ed.). New York: John Wiley.
Sekaran, U. (2003). Research methods for business : A skill-Building Approach (4th
ed.). New York: John Wiley & Sons.
Shafi, I. M. (2002). Assessment of the impact of Internet technology use among Saudi
business organizations. Ph.D. dissertation, Mississippi State University,
United States-Mississippi.
Shah, M. H., & Siddiqui, F. A. (2006). Organizational Success Factors in E-Banking
at The Woolwich. International Journal of Information Management, 26, 442-
456.
Shanmugam, B., & Guru, K. (2000). E-banking Developments in Malaysia: Prospect
and Problems. Journal of International Banking Law, 15(10), 250-256.
Shapiro, M. J. (1970). Discovering interviewer bias in open-ended survey responses.
Public Opinion Quarterly, 34, 412– 415.
Shneiderman, B. (2000). Universal Usabiltiy. Communications of the ACM, 43(5), 84-
91.
Simon, S. (2001). The impact of Culture and Gender on Websites: An empirical
study. The database for advances information systems, 32(1), 18-37.
Singer, D., Ross, D., & Avery, A. (2001). Successful Web Portals in Retail Banking.
New Hope, PA: Fabozzi Associates.
Singh, A. (2004). Trends in South African Internet Banking. Aslib Proceeding: New
Information Perspectives, 56(3), 187-196.
Page 343
327
Siu, N., & Mou, J. (2005). Measuring Service Quality in Internet Banking The Case
of Hong Kong. Journal of International Consumer Marketing, 17(4), 99-116.
Sohail, S. M., & Shaikh, N. (2007). Internet banking and quality of service,
perspectives from a developing nation in the Middle East. Online Info. Rev.,
32(1), 58-72.
Solomon, M. R. (1996). Consumer Behavior (3rd ed.). Englewood Cliffs, NJ:
Prentice-Hall.
Solomon, M. R. (2010). Consumer Behavior (9th ed.). One Lake Street, Upper Saddle
River, New Jersey: Prentice Hall.
Spector, P. E., & (1992). Summated rating scales construction: An introduction
(Quantitative Applications in the Social Sciences. Newbury Park, CA: Sage
Publications.
Straub, D., Boudreau, M.-C., & Gefen, D. (2004). Validation Guidelines for IS
Positivist Research. Communications of the Association for Information
Systems, 14, 380-426.
Straub, D., Limayem, M., & Karahanna, E. (1995). Measuring system usage:
implications for IS theory testing. Management Science, 41(8), 1328-1342.
Suh, B., & Han, I. (2002). Effect of trust on customer acceptance of Internet banking.
Electronic Commerce Research and Applications, 1(3-4), 247-263.
Sultan, F., & Rohm, A. J. (2004). The evolving role of the Internet in marketing
strategy: An exploratory study. Journal of Interactive Marketing, 18(2), 6-19.
Sun, P. C. (2007). The correlations among domain knowledge specificity, joint new
product development and relationship performance. International Journal of
Commerce and Management, 17(1/2), 44-55.
Swanson, R. A. (1982). Industrial training (H. E. Mitzal ed.). New York: Macmillan.
Szajna, B. (1996). Empirical evaluation of the revised technology acceptance model.
Management Science, 42(1), 85-92.
Szymanski, D. M., & Hise, R. T. (2000). E-satisfaction: An initial examination.
Journal of Retailing, 76(3), 309–322.
Tadawul’s report. (2004). The Saudi Arabian stock market Retrieved November 10,
2008, from
http://www.tadawul.com.sa/wps/portal/!ut/p/_s.7_0_A/7_0_49I/.cmd/Change
Language/.l/en
Tan, M., & Teo, T. (2000). Factors Influencing the Adoption of Internet banking.
Journal of the Association for InformationSystems, 1(15), 1-42.
Tashakkori, A., & Teddlie, C. (2003). Handbook of Mixed Methods in Social &
Behavioral Research: Thousand Oaks: Sage.
Page 344
328
Taylor, S., & Todd, P. (1995). Assessing IT Usage the Role of Prior Experience. MIS
Quarterly, 19(4), 561-570.
TELC. (2002). TELC. Telecommunication: Mutually Exclusive Retrieved April 21,
2007, from http://www.insight-publications.com/saudi/saudi/saudi-sl2.html
Teo, T. S. H., & Choo, W. Y. (2001). Assessing the impact of using the Internet for
competitive intelligence. Information & Management, 39(1), 67–83.
The Economist. (2010). Economics A-Z. Retrieved July 22, 2010, from
http://www.economist.com/research/Economics/alphabetic.cfm?TERM=CAPI
TALISM
The National Commercial Bank (NCB). (2006). Press report Dec. 2003 Retrieved
March 15, 2007, from http://www.alahli.com/en-
US/Pages/NCBHomePage.aspx
Then, N. K., & Delong, M. R. (1999). Apparel shopping on the web. Journal of
Family and Consumer Sciences, 91(3), 65-68.
Thomas, J. R., Nelson, J. K., & Silverman, S. J. (2005). Research Methods in Physical
Activity (5 ed.). Leeds, UK: Human Kinetics.
Thornton, J., & White, L. (2001). Customer orientations and usage of financial
distribution channels. Journal of Services Marketing, 15(3), 168-185.
Timko, C. (1987). Seeking medical care for a breast cancer symptom: determinants of
intentions to engage in prompt or delay behavior. Health psychology, 6, 305-
328.
Triandis, H. C. (1980). Values, attitudes, and interpersonal behavior. In H. Howe &
M. Page (Eds.), Nebraska symposium on motivation 1979, 195-295.
Tsai, M. T., & Cheng, Y. M. (2002). The decision criteria for the ownership control
entry mode for Taiwanese manufacturing firms in the United States: an
application of the logit model and AHP. International Journal of Commerce
and Management, 12(2), 45-71.
Tsai, M. T., & Cheng, Y. M. (2004). Asset specificity, culture, experience, firm Size
and entry mode strategy: Taiwanese manufacturing firms in China, South-East
Asia and Western Europe. International Journal of Commerce and
Management, 14(3/4), 1-27.
Turban, E., King, D., Lee, J. K., & Viehland, D. (2003). Introduction to E-Commerce.
New Jersey: Pearson Education.
Turban, E., Lee, J., King, D., & Chung, H. (2000). Electronic commerce: A
Managerial perspectives. New jersey: Prentice Hall.
Page 345
329
U.S.-Saudi Arabian Business Council. (2000). Telecommunications sector in the
kingdom of Saudi Arabia Retrieved January 11, 2007, from http://www.us-
saudi-business.org/telecompdfsample.pdf
U.S.-Saudi Arabian Business Council. (2002). The Saudi Arabian Economy Retrieved
January 11, 2007, from http://www.us-saudi-business.org/015-
052Chapter%202.pdf
Udo, G. J. (2001). Privacy and security concerns as major barriers for e-commerce: a
survey study. Information Management & Computer Security, 9(4), 165-174.
Venkatesh, V. (1999). Creation of Favorable User Perceptions: Exploring the Role of
Intrinsic Motivation. MIS Quarterly, 23(2), 239-260.
Venkatesh, V. (2000). Determinants of perceived ease of use: Integrating control,
intrinsic motivation, and emotion into the technology acceptance model.
Information Systems Research, 11(4), 342-365.
Venkatesh, V., & Davis, F. D. (1996). A Model of the Antecedents of Perceived Ease
of Use: Development and Test. Decision Sciences, 27(3), 451-482.
Venkatesh, V., & Davis, F. D. (2000). A Theoretical Extension of the Technology
Acceptance Model: Four Longitudinal Field Studies. Management Science,
46(2), 186-204.
Venkatesh, V., & Morris, M. G. (2000). Why don’t men ever stop to ask for
directions: Gender, social influence and their role in technology acceptance
and usage behavior. MIS Quarterly, 24(1), 115-139.
Wadadekar, A. (2010). Mutual Fund Basics. Go Articles.com Retrieved December
10, 2010, from http://goarticles.com/article/Mutual-Fund-Basics/3645054/
Wainer, H., & Kiely, G. L. (1987). Item clusters and computerized adaptive testing: A
case for testlets. Journal of Educational Measurement, 24, 185–201.
Walker, I. (1999). Embracing the enemy. The Banker, 149(882), 70-71.
Wallis Report. (1997). The Financial System Inquiry Final Report: AGPS, Canberra,
Chairman: Wallis, S.
Wang, Y.S., Wang, Y.M., Lin, H.-H., & Tang, T.I. (2003). Determinants of user
acceptance of Internet banking: an empirical study. International Journal of
Service Industry Management, 14(5), 501-519.
Weill, P., & Vitale, M. (1999). Assessing the health of an information system
portfolio: An example from process engineering. MIS Quarterly, 23(4), 601–
624.
Wilcox, J. B., Howell, R. D., & Breivik, E. (2008). Questions about formative
measurement. Journal of Business Research, 61(12), 1219-1228.
Page 346
330
Wixom, B. H., & Watson, H. J. (2001). An empirical investigation of the factors
affecting data warehousing success. MIS Quarterly, 25(1), 17–41.
World Trade Organization (WTO). (2005). WTO: 2005 Press Releases. Retrieved
Dec 16, 2007, from
http://www.wto.org/english/news_e/pres05_e/pr420_e.htm
Wungwanitchakornm, A. (2002). Adoption Intention of Banks’ Customers on Internet
Banking Service. ABAC Journal, 22(3), 63-80.
X-rates.com. (2008). Currency Exchange Rate, Saudi Riyal Exchange rate against the
US Dollar. Retrieved May 20, 2008, from http://www.x-
rates.com/d/SAR/table.html
Yang, Z., & Jun, M. (2002). Consumer Perception of E-service Quality: From Internet
Purchaser and Non-purchaser Perspectives. Journal of Business Strategies,
19(1), 19-41.
Yavas, U., & Tuncalp, S. (1985, 27 Februray -1 March ). Doing Business in Saudi
Arabia: A Primer for the First Time Visitor. Paper presented at the
Proceedings of the 15th Annual Meeting, Southeast American Institute for
Decision Science, New Orleans.
Yiu, C., Grant, K., & Edgar, D. (2007). Factors affecting the adoption of internet
banking in Hong Kong implications for the banking sector. International
Journal of Information Management, 27(5), 336-351.
Young, D. (1999). The impact of the Internet within the Retail Financial Services
Industry, Paying particular attention to banking. Retrieved March 15, 2008,
from http://www.intra.som.umass.eduiejournaltank.html
Yousafzai, S. Y. (2005). Internet Banking in the UK: A Customer Behaviour
Perspective. Ph.D. thesis, Cardiff Business School, Cardiff University, UK.
Yousafzai, S. Y., Foxall, G. R., & Pallister, J. G. (2007). Technology acceptance: a
meta-analysis of the TAM: Part 1. Journal of Modelling in Management, 2(3),
251-280.
Yousafzai, S. Y., Pallister, J. G., & Foxall, G. R. (2003). A proposed model of e-trust
for electronic banking. Technovation, 23, 847-860 .
Yousafzai, S. Y., Pallister, J. G., & Foxall, G. R. (2005). Strategies for building and
communicating trust in electronic banking: A field experiment. Psychology
and Marketing, 22(2), 181-201.
Yousafzai, S. Y., Pallister, J. G., & Foxall, G. R. (2009). Multi-dimensional role of
trust in Internet banking adoption. The Service Industries Journal, 29(5), 591–
605.
Page 347
331
Yousafzai, S., & Yani-de-Soriano, M. (2012). Understanding customer-specific
factors underpinning internet banking adoption. International Journal of Bank
Marketing, 30(1).
Zain Telecom. (2011). Broadband for Computers. Retrieved January 13, 2011, from
http://www.sa.zain.com/autoforms/portal/home
Zainuddin, Y., Jahyd, N., & Ramayah, T. (2004). Perception of Islamic banking: does
it differ among users and non users. Jurnal Manajemen dan Bisnis, 6(3), 221-
232.
Zhang, Y., Chen, J. Q., & Wen, K. W. (2002). Characteristics of Internet Users and
Their Privacy Concerns: A Comparative Study Between China and the United
States. Journal of Internet Commerce, 1(2), 1-1.
Zmud, R. W. (1979). Individual differences and MIS success: a review of the
empirical literature. Management Science, 25(10), 966-979.
Page 349
333
APPENDIX A
Litereture Review of IB Research
Page 350
334
Study Topic of Analysis Findings Lockett and Littler (1997)
Adoption of direct banking
Services in the UK
Used a model of perceived innovation attributes and personal characteristics of
adopters and non-adopters. The results indicated that the most important
perceived positive attribute of direct banking was its 24/7 availability, whereas
complexity and risk of service were the two negative attributes.
Mols (1998)
Strategic distribution channel
strategies for IB
The existence of barriers to the use of IB plays a crucial role in predicting the
pace with which the expected development will take place.
Athanassopoulos and
Labroukos (1999)
Electronic banking in Greece
Product-specific attributes, such as price and speed, are conceived differently by
customers. Price, speed and the bank’s reputation are important criteria in the
adoption of e-banking.
Daniel (1999)
Provision of e-banking in the
UK and Ireland
Examined online banking issues, e.g., culture of innovation, market share, and
organisational restrictions, and related them to the bank’s adoption of online
banking.
Liao et al. (1999)
Adoption of virtual banking
in Hong Kong
Applied the Theory of Planned Behaviour (TPB) to IB adoption. The theory was
found to be partially applicable to the context. The empirical research provided
limited and weak support to the constructs of the theory.
Mols et al. (1999)
Adoption process in the
Danish retail banking sector
Most Danish retail banks give more importance to offering a customer-friendly
PC bank service, whereas fewer of them give equal importance to telephone,
internet and branch banking. A multiple-channel strategy combining several
channels is the most popular.
Sathye (1999)
Adoption of IB in Australia
Identified security, ease of use, awareness, pricing, resistance and infrastructure
issues as the main obstacles to non-adoption of IB. Young, educated, and
wealthy were the most relevant customer segments.
Jayawardhena and Foley
(2000)
Changes in UK bank sector
Listed the advantages for banks: cost savings, increased customer base, mass
customization, marketing and communication, innovation, and development of
non-core business.
Mols (2000)
IB marketing in Denmark
To retain loyal customers, banks must adapt and customise their offerings. First-
movers will have the advantage of building customer relationships, brand name
and awareness among internet users. Late-movers may learn from the mistakes
of early movers and thus lower their entry costs.
Moutinho and Smith (2000)
Attitude towards human and
automated banking
Suggested that the drive towards ease of banking and convenience is favoured
by the customer and, therefore, banks should find alternative strategic routes
designed to improve service delivery (either human-based or technology based).
Aladwani (2001)
Drivers and challenges for
online banking in Kuwait
Drivers of IB from bank’s perspective are providing faster, more reliable and
easier service to customers, improving bank’s image and competitive position,
creating new markets, and reducing operational and administrative costs and the
work force.
Jun and Cai (2001)
Service Quality in IB
Classified 17 service quality dimensions into three categories: customer service
quality, online service quality, and banking service product quality.
Gurau (2002)
E-banking intransition
economies (Romania)
The implementation of e-banking in a transition economy is limited because of:
incomplete legislations, risky financial systems, slow internet connections, low
internet penetration, lack of knowledge about the internet, and opportunistic
behaviour of banks.
Howcroft et al. (2002)
Preferred delivery channels
for purchasing financial serv.
Branch network is still the most popular delivery channel. Consumers are not
predisposed to change their behaviour radically and adopt widespread use of IB.
They prefer a mix of delivery channels.
Karjaluoto et al. (2002)
Attitude formation towards
online banking in Finland
Prior experience, attitude towards computers, and demographics (occupation
and household income) influenced the attitude towards online banking and
actual behaviour. A typical online banking user was found to be relatively
young, well educated with a high income, and a family man with a good job.
Suh and Han (2002)
IB adoption in South Korea
Trust, perceived usefulness, and perceived ease of use were found to be most
significant beliefs in explaining customer attitudes towards the use of IB.
Gerrard and Cunningham
(2003)
Diffusion of IB in Singapore
The eight influential factors of IB adoption are social desirability, compatibility,
convenience, complexity, confidentiality, accessibility, economic benefits, and
PC proficiency.
Joseph and Stone (2003)
US customers perception of
impact of technology on
service delivery
Technology-based delivery channels are linked with the customer perceptions of
how the bank services are delivered to customers; these perceptual outcomes
affect their level of satisfaction.
Mattila et al. (2003)
IB adoption among mature
customers in Finland
Household income and education had a significant effect on the adoption of IB
among mature consumers, whereas perceived difficulty in using computers
combined with the lack of personal service in e-banking were the main barriers.
Mukherjee and Nath (2003)
Modelling trust in online
banking in India
Shared value and communication played a significant positive role regarding
trust in IB and that trust had a significant positive influence on commitment.
Page 351
335
Rotchanakitumnuai and
Speece (2003)
Adoption of IB among
corporate customers in
Thailand
Users of IB have more confidence in the reliability of the system, whereas non-
users are much more service conscious, and do not trust financial transactions
made via internet channels. Non-IB users tend to have more negative
management attitudes towards adoption and are more likely to claim a lack of
resources. Legal support is also a major barrier.
Sohail and Shanmugham
(2003) Malaysian customers’
preference in E-banking
Internet access, awareness of e-banking, security concerns, ease of use, and
customer’s reluctance to change affects the usage of IB.
Wang et al. (2003)
IB adoption in Taiwan
Applied the TAM to IB adoption and found that perceived ease of use,
perceived usefulness, and perceived credibility had a significant positive effect
on people’s intention to adopt IB.
Yousafzai et al. (2003)
A proposed model of e-trust
for electronic banking
A conceptual model of trust in e-banking was proposed with two main
antecedents that influence customer’s trust: perceived security and
perceived privacy. The antecedent variables were moderated by the
perceived trustworthiness attributes of the bank, which include
benevolence, integrity and competence. Trust was defined as a function of
the degree of risk involved in the e-banking transaction, and the outcome of
trust is proposed to be a reduction in the perceived risk, leading to positive
intentions towards the adoption of e-banking.
Akinci et al. (2004)
IB adoption among
sophisticated consumers
(Turkey)
Non users were not aware of the benefits of IB and were not confident in using
the internet for banking activities; felt they could not get help for any problem
they might face during electronic transactions; and preffered going to branch
despite having internet access. Users of IB emerged as technology-oriented
customers who like to make use of the technology.
Chan and Lu (2004)
IB adoption in Hong Kong
Applied Social Cognitive Theory and the TAM to IB adoption. Subjective
norms, self-efficacy, perceived ease of use, and perceived usefulness play
significant role in IB adoption.
Pikkarainen et al. (2004)
IB adoption in Finland
Perceived ease of use, perceived usefulness, perceived enjoyment, awareness
about IB, and concerns about security and privacy have an impact on the
acceptance of IB.
Shih and Fang (2004)
IB in Taiwan
Applied the TRA and Theory of Planned Behaviour to IB adoption context.
Found relative advantage, compatibility, complexity, normative influence,
efficacy, and facilitating conditions as determinants of intentions to adopt IB.
Singh (2004)
Trends in south African IB
Security was found to be major barrier in the adoption of IB. Potential users
wanted guaranteed safety and loyalty rewards to adopt IB.
Akamavi (2005)
Re-engineering service
quality process mapping: e-
banking process
Show the increased efficiency, productivity and customer satisfaction levels that
are the key innovation process performance. The study concludes with evidence
of non-financial performance results of this type of financial service innovation.
Eriksson et al. (2005)
Customer acceptance of IB
Applied the TAM to IB context. Trust affects the perceived ease of use and
perceived usefulness, which leads to greater use of IB. (in Estonia)
Lassar et al. (2005)
IB adoption in USA
Studied the relationship between consumer innovativeness and personal
characteristics; found that domain-specific consumer innovation, self efficacy,
and utilitarian-based web use positively affect the adoption of online banking.
Yousafzai et al. (2005)
Strategies for building and
communicating trust in e-
banking
Structural assurance and situational normality affect customer’s trust in e-
banking. Suggests that banks need to use a portfolio of strategies to build
customer trust. Communication of meaningful and timely information has the
potential to influence customers trusting intentions.
Corrocher (2006)
Internet adoption in Italian
banks: An empirical
investigation
First, banks with high branching intensity adopt IB more slowly than do banks
with only a few branches in place. Second, adoption is negatively affected by
the existence of a large customer base, once we control for assets. An important
consequence of this is that the provision of financial services over the internet is
a strategy directed more at attracting new customers than at strengthening the
relationship with existing ones.
Kassim and Ahmed (2006)
The influence of attraction on
IB
Investigated the trust-relationship commitment model (MH94) as applied to an
IB setting by adding “attraction to use IB services” as a new factor. Suggest
that, in order to develop trust and to attract more users to IB, making the system
easy to interact with is not going to be enough. Shah and Siddiqui (2006)
Organisational critical
success factors in adoption of
e-banking at the Woolwich
bank
Banks need to implement considerable organisational changes in order to web-
enable themselves. The main focus of their e-commerce strategy should be to
integrate the e-banking channel with other service delivery channels to
maximise benefits.
Al-Gahtani et al. (2007)
Information technology (IT)
in Saudi Arabia: Culture and
The model explained 39.1% of intention to use variance, and 42.1% of usage
variance. In addition, drawing on the theory of cultural dimensions, this study
formulated and tested hypotheses regarding the similarities and differences
Page 352
336
the acceptance and use of IT
between the North American and Saudi validations of UTAUT in terms of
cultural differences affected the organizational IT acceptance of two societies.
Maenpaa et al. (2007)
Consumer perceptions of IB
in Finland
Consumer perceptions differed in four of seven dimensions of IB services when
examined using the criterion of expertise. The most interesting result is that
security is not a concern for any of the user groups. Also, an interesting finding
is that the dimensions of status, personal finances and investment proved to be
U-shaped. Yiu et al. (2007)
Factors affecting the
adoption of IB in Hong Kong
Certain factors did have a positive relationship with the adoption of IB and so
strategy in the banking services sector can be refined to better meet the demands
and profile of the Hong Kong market.
Al-Somali et al. (2008)
IB Acceptance in the Context
of Developing Countries
Suggested the quality of internet connection, the awareness of online banking
and its benefits, the social influence and computer self efficacy have significant
impact on perceived usefulness (PU) and perceived ease of use (PEOU) of
online banking acceptance. Education, trust and resistance to change also have
significant effects on the attitude towards the likelihood of adopting online
banking.
Poon (2008)
Users’ adoption of e-banking
services: the Malaysian
perspective
Results indicated that all elements for ten identified factors are significant with
respect to the users’ adoption of e-banking services. Privacy and security were
the major sources of dissatisfaction, which have significantly affected users’
satisfaction. Meanwhile, accessibility, convenience, design and content are
sources of satisfaction. Besides, the speed, product features availability, and
reasonable service fees and charges, as well as the bank’s operations
management factor are critical to the success of e-banks. WAP, GPRS and 3G
features from mobile devices are of no significance and do not influence the
adoption of e-banking services in this study. Results also revealed that privacy,
security and convenience factors play an important role in determining the
users’ acceptance of e-banking services with respect to demographic
segmentation of age group, education level and income level.
Hosein (2009)
IB: An Empirical Study Of
Adoption Rates Among
Midwest Community Banks
Indicated that customers find it difficult to use internet banking services, which
leads to a decrease in the adoption of IB.
Adesina and Ayo (2010)
An Empirical Investigation of
the Level of Users’
Acceptance of E-Banking in
Nigeria
The ATM still remains the most widely used form of e-banking service. Banks’
customers who are active users of an e-banking system use it because it is
convenient, easy to use, time saving and appropriate for their transaction needs.
Also, the network security and the security of the system in terms of privacy are
the major concerns of the users and constitute a hindrance to intending users.
Alsajjan and Dennis (2010)
IB Acceptance model: cross-
market examination
This study suggested the importance of attitude; attitude and behavioural
intentions emerged as a single factor, denoted as “attitudinal intentions” (AI).
Structural equation modelling confirmed the fit of the model, in which
perceived usefulness and trust fully mediate the impact of subjective norms and
perceived manageability on AI. The invariance analysis demonstrated the
psychometric equivalence of the IBAM measurements between the two country
groups. At the structural level, the influence of trust and system usefulness on
AI varies between the two countries, emphasizing the potential role of cultures
in IS adoption. The IBAM was robust and parsimonious, explaining over 80%
of AI.
Al-Majali and Nik Mat
(2011)
Modeling the antecedents of
internet banking service
adoption (IBSA) in Jordan: A
Structural Equation
Modeling (SEM) approach
This study was concerned with an empirical investigation of success factors that
could affect a successful internet banking services adoption (IBSA) in Jordan
through the application of Innovation Diffusion Theory (IDT). The Revised
Model (RM) indicated that the IDT has accomplished model fit and supports all
six direct paths (perceived usefulness, perceived ease of use, compatibility,
trialability, perceived trust and awareness).
Lin et al. (2011)
“Banking” on the Internet:
Does Internet Banking Really
Improve Bank Performance?
This study found only modest evidence that internet banking adoption improves
bank performance. Also, it suggested that younger banks and banks that are
earlier adopters are more likely to enjoy the benefits of internet banking.
Mahdi (2011)
Trust and security of
electronic banking services in
Saudi commercial banks:
Saudis versus Non Saudis
Opinions
The study revealed how Saudi banks’ customers have very high trust in using
the electronic banking services and how Saudi banks’ customers strongly
believed that the electronic banking services are more secure compared with
their non Saudi counterparts. Also, it presented new empirical evidence, and
enhanced understanding of the trust and the security of electronic banking
technology in a Middle East country.
Page 353
337
Mangin et al. (2011) Modelling perceived
usefulness on adopting on
line banking through the tam
model in a Canadian banking
environment
The study had significant meaning to encourage Canadian people to use internet
for making all their personal banking operations in a secure, easy and self
efficacy way.
Masocha et al. (2011)
E-banking adoption by
customers in the rural milieus
of South Africa: A case of
Alice, Eastern Cape, South
Africa
This study provided primary information to guide banks in structuring their
marketing strategies, quality improvements and business processes against the
backdrop of rural milieus.
Nasri (2011)
Factors Influencing the
Adoption of Internet Banking
in Tunisia
The results of the model tested clearly show that use of IB in Tunisia is
influenced most strongly by convenience, risk, security and prior internet
knowledge. Only information on online banking did not affect intention to use
internet banking service in Tunisia. The results also proposed that demographic
factors significantly affect internet banking behaviour, specifically, occupation
and education level. Finally, this paper suggested that an understanding the
factors affecting intention to use internet banking is very important to the
practitioners who plan and promote new forms of banking in the current
competitive market.
Safeena et al. (2011)
Internet Banking Adoption in
an Emerging Economy:
Indian Consumer’s
Perspective
This study determined the factors influencing the consumer’s adoption of
internet banking in India and hence investigated the influence of perceived
usefulness (PU), perceived ease of use (PEU) and perceived risk (PR) on use of
IB. The result showed that PU, PEU and PR are the important determinants of
online banking adoption.
Mansumitrchai and chiu
(2012)
Adoptation of internet
banking in uae:
factors underlying adoption
characteristics
This study showed that adopters and non-adopters differed in their attitudes
toward three factors of adoption: compatibility, trust and human contact. No
significant differences were found between attitudes of adopters and non-
adopters toward the issues of security, third party concern and status. An
interesting finding was that human or physical contact and trust were the most
important factors for non-adopters. Moga et al. (2012)
Trust and Security in E-
banking Adoption in Romania
This study found that Romania has legal frameworks in place and banks have
also adopted measures to address the issue. However, whether or not these
measures were effective in mitigating banking consumers’ security concerns
was yet uncharted and need to be investigated.
Yousafzai and Yani-de-
Soriano (2012)
Understanding customer-
specific factors underpinning
internet banking adoption
The results indicated the importance of customer-specific factors in predicting
actual behaviour. Technology readiness, age and gender moderate the beliefs-
intention relationship. Customers with varying levels of technology-related
views and demographics hold different beliefs about technology. The
relationship between usefulness and behaviour was stronger for younger males
with high levels of optimism and innovativeness (explorers and pioneers),
whilst the relationship between ease of use and behaviour was stronger for older
females with a high level of discomfort (paranoids and laggards).
Source: Yousafzai (2005) and updated by the author of this research.
Page 354
338
APPENDIX B
Consumer Survey Questionnaire About The Adoption, Usage and Success of The Internet
Banking (IB) Services In Saudi Arabia (SA)
(English Version)
Page 355
339
Dear Participant
My name is Mohammed Eid Al-Qahtani and I am currently studying for a PhD under
the supervision of Dr. Dimitrios Tsagdis at Hull University Business School, United
Kingdom. The topic of my PhD focuses on customer attitudes towards internet
banking in Saudi Arabia.
I am thus sending to you the accompanying questionnaire in order to gather the
opinions of internet banking users in Saudi Arabia. There are no right or wrong
answers; we are just interested in your opinions. Thus if you are using internet banking
please answer all questions as best as you can and return the completed questionnaire
in the provided stamped addressed envelope. If you face any difficulty or have any
questions please contact me on the address below. Your response is extremely
important to the success of this study and will be held in strict confidence.
We shall be pleased to share the findings of this research once it is completed. To that
extent if you would like to receive to receive a copy of its findings please provide us
with an e-mail address at the end of the survey.
Thank you very much in anticipation for your kind co-operation.
I look forward to receiving your reply.
Yours faithfully
Mr Mohammed Eid Al-Qahtani
P. O. Box 1411
Dhahran 31311
Saudi Arabia
E-mail: [email protected]
Dr Dimitrios Tsagdis
University of Hull
Scarborough Management
Centre
Page 356
340
Section A: Factors influencing the usage of Internet Banking (IB)
The aim of this section is to investigate the factors which may impact on the usage of IB. Please
indicate how strongly you agree or disagree with the statements? Please tick () the box that best
reflects your answer where:
1=Strongly disagree 2= Disagree 3= Uncertain 4= Agree 5= Strongly agree
No. Satisfactions of the IB services 1 2 3 4 5
A1 Available 7 days and 24 hours
A2 I can access my IB account from anywhere
A3 It provides time savings
A4 The transactions have low or no cost
A5 IB services are reliable
A6 I can get instant feedback for my transactions
A7 It is self-service
A8 Satisfied all my banking needs
A9 Satisfied all my Islamic Banking (IsB) needs
Perceived Usefulness of the IB services 1 2 3 4 5
A10 Using the IB services enables me to utilize banking services more quickly
A11 Using the IB services improves my performance in utilizing the banking
services
A12 Using the IB services for my banking services increases my productivity
A13 Using the IB services enhance my effectiveness of utilising banking services
A14 Using the IB services makes it easier for me to utilise banking services
A15 Overall, IB is useful for me to utilise banking services
Perceived Ease of Use of the IB services 1 2 3 4 5
A16 Learning to use the IB services is easy for me.
A17 I find it easy to do what I want to do in IB.
A18 My interaction with the use of the IB services is clear and understandable.
A19 I find IB services to be flexible to interact with
A20 It is easy for me to become skilful at the use of the IB services.
A21 Overall, I find the use of the IB services easy to use.
Security of the IB services 1 2 3 4 5
A22 Using the IB services is financially secure
A23 I trust the ability of the IB services to protect my privacy
A24 I trust in the technology that IB services
A25 I trust in the IB services as a bank
A26 Matters of security have no influence on using the IB services
Awareness 1 2 3 4 5
A27 I have generally received enough information about IB.
A28 I have received enough information about the benefits of the IB services.
Self-Efficiency 1 2 3 4 5
A29 I can use IB even if there was no one around to show me how to do it
A30 I can use IB with only the online help function for assistance
A31 I could use IB even if the system was changed
Page 357
341
A2B: To what extent do you think the following factors are problematic in using your IB services?
From 1 (major Obstacle) to 5 (No obstacle), please tick () the box that best reflects your answer:
1=Major obstacle 2= Obstacle 3= Moderate obstacle 4=Minor obstacle 5= No obstacle
Availability of the Infrastructure, Resistance to Change, Cost and
availability of Islamic Banking (IsB) services online
1 2 3 4 5
A2B1 Access to Computer
A2B2 Access to Internet
A2B3 Using the IB services rather than using the other banking channels, e.g.
telephone/branch banking/ATM
A2B4 The cost of usage of IB
A2B5 The availability of the IsB products and services on your IB services
Section B. Socio-demographic characteristics
The purpose of this section is to obtain information about the socio-demographic characteristics of IB
users.
B1. Are you?
Male Female
B2. What is your religion?
Muslim Christian Buddhist Hindu Other (Please specify)
B3. How old are you?
20 or less 21-30 31-40 41-50 51-60 61 or more
B4. How much is your yearly income in SR?
Equal or Less than 50,000 50,001-100,000 100,001-150,000 150,001-200,000 200,001 or more
B5. What is your education level?
High school Community college Bachelor's Master's Doctoral
Other (Please specify)
B6. What is your current occupation?
Public sector Private sector Education sector Self-employed
Military service Other (Please specify)
B7. What is the level of your ability to use the computer?
Not good at all Not good Beginner Good Expert
B8. You often access the Internet from?
Home School Internet café Work
Friend's house Other (Please specify)
Page 358
342
B9. If you graduated from a college, what was your field of study?
Business Engineering Art Education Islamic Studies Medical
Law Computer Science NA Other (Please specify)
B10. How long have you been using the Internet?
<1 Month 1 - 12 Months (>1 year) - 3 Years (>3 year) - 5 Years > 5 years
B11. How frequently do you access the Internet each month?
1-5 times 6 -10 times 11-20 times 21-30 times > 30 times
B12. Which of these banks you have your IB access with? (Pease tick all that apply)
Al-Bank Al-Saudi Al-Fransi Al-Rajhi Bank
National Commercial Bank Bank Al-Jazira
Saudi Investment Bank Riyad Bank
Saudi British Bank Saudi Hollandi Bank
Arab National Bank Saudi American Bank
Bank Al-Bilad
B13. How long have you been using the IB?
<1 Month 1 - 12 Months (>1 year) - 3 Years (>3 year) - 5 Years > 5 years
B14. How frequently do you access IB information each month?
1-5 times 6 -10 times 11-20 times 21-30 times > 30 times
B16. I use my IB account to do the following (Check all that apply):
Check account balances View transaction history
Transfer money between accounts Payment of bills
View images of your checks Purchase of goods or services
Obtains interest rates on deposit products Apply for loan
Request copies of past statements and processed checks check my share’s portfolio account
Order traveller's, cashier's, and regular cheques
Other (Please specify)
If there is anything else you can think of which you would like to tell me, please do so in the next
space.
Space for any additional comments: -----------------------------------------------------------------------------
---------------------------------------------------------------------------------------------------------------------------
Thank you very much for your assistance in completing this questionnaire.
If you would like to receive a copy of this study’s findings, please provide us with an email
address ____________________________________
B15. I intend to use the IB in the future for a period of:
Never 1 - 12 Months (>1 year) - 3 Years (>3 year) - 5 Years > 5 years
Page 359
343
APPENDIX B
استبيان عن تطبيق وإستخدام ومدى نجاح الخدمات البنكية عبر الانترنت في
المملكة العربية السعودية
)نسخة عربية(
(Arabic Version)
Page 360
344
عزيزي المشارك،
انا الباحث محمد عيد القحطاني ، اقوم حاليا بدراسة الدكتوراة تحت إشراف الدكتور "ديمتري تساغديس" في كلية إدارة
ل في جامعة هال بالمملكة المتحدة، وأعمل على مشروع بحثي بعنوان "سلوكيات وتوجهات مستخدمي الخدمات الأعما
البنكية عبر الأنترنت في المملكة العربية السعودية".
وعلى ضوء ذلك أرسل هذا الإستبيان المرفق من أجل الحصول على آراء مستخدمي الخدمات البنكية عبر الانترنت في
العربية السعودية. لا يوجد هناك إجابة صائبة أو خاطئة؛ نحن نهتم فقط بآرائكم. ولذلك، إذا كنت من مستخدمي المملكة
الخدمات البنكية عبر الأنترنت، نرجو منك التكرم بالإجابة على جميع الأسئلة المرفقة في حالة تمكنك من ذلك، ومن ثم قم
وف المعنون المرفق مع طابع ملصق، وإذا واجهتك أي صعوبة أو إذا كان بإرسال الإستبيان بعد إتمامه كاملاً في المظر
لديك أي سؤال، الرجاء مراسلتي على العنوان في الأسفل. أود التوضيح أن استجابتك معي ذات أهمية بالغة وذلك من أجل
لمقدمة في هذه إنجاح هذه الدراسة، كما أؤكد لك حرصي التام ومحافظتي على خصوصية وسرية جميع المعلومات ا
الإستبانة.
وإنه لمن دواعي سروري أن أطلعك على نتائج هذه الدراسة عند الإنتهاء منها، وبالتالي اذا كنت راغبا في ذلك ارجو منك
التكرم بكتابة بريدك الإلكتروني في نهاية الإستبانة.
في القريب العاجل. وفي الختام، اقدم الشكر الجزيل لك لتعاونك معي، ومتطلعا لإستقبال ردك
.محمد عيد القحطاني /الباحث
العنوان:
محمدعيد القحطاني
المملكة العربية السعودية
١١١١صندوق البريد:
٣١٣١١الرمز البريدي:
[email protected] البريد الألكتروني:
المشرف الدراسي:
د. ديمتري تساغديس جامعة هال
Page 361
345
تخدام الخدمات البنكية عبر الأنترنت.القسم أ: العوامل المؤثرة في إس
الهدف من هذا القسم هو التعرف على العوامل التي قد تؤثر على إستخدام الخدمات البنكية عبر الأنترنت.
في المربع المناسب.)×( الرجاء تحديد موافقتك أو عدم موافقتك على العبارات التالية عن طريق وضع علامة
أوافق بشدة-٥ أوافق-١ محايد -٣ وافقلا أ -٢ لا أوافق بشدة -١
٥ ١ ٣ ٢ ١ مدى ملائمة الخدمات البنكية التي تقدمها البنوك عبر الأنترنت الرقم
ساعة في اليوم. 42ايام في الأسبوع و 7الخدمات البنكية عبر الإنترنت متاحة ١أ
من أي مكان.بإمكاني الوصول إلى الخدمات البنكية عبر الإنترنت وإستخدامها ٢أ
الخدمات البنكية عبر الإنترنت توفر الوقت. ٣أ
العمليات البنكية عبر الإنترنت قليلة أو تكاد تكون عديمة التكلفة. ١أ
الخدمات البنكية عبر الإنترنت شديدة الفعالية. ٥أ
نترنت.أحصل على رد سريع على العمليات البنكية التي أقوم بها عبر الأ ٦أ
الخدمات البنكية عبر الإنترنت توفر"خدمة ذاتية". ٧أ
الخدمات البنكية عبر الإنترنت تلبي جميع إحتياجاتي البنكية. ٨أ
الخدمات البنكية عبر الإنترنت تلبي جميع إحتياجاتي البنكية الإسلامية. ٩أ
٥ ١ ٣ ٢ ١ نترنت مدى فائدة إستخدام الخدمات البنكية عبر الإ
تمكنني من الإنتفاع من الخدمات البنكية المتوفرة بسرعة كبيرة. ١١أ
الخدمات البنكية عبر الإنترنت تقوم بتطوير فعالية إستخدامي للخدمات البنكية. ١١أ
الخدمات البنكية عبر الإنترنت تقوم بزيادة انتاجيتي. ١٢أ
ر الإنترنت تزيد من تأثير استخدامي للخدمات البنكية.الخدمات البنكية عب ١٣أ
الخدمات البنكية عبر الإنترنت تسهل علي استخدام الخدمات البنكية. ١١أ
بشكل عام، الخدمات البنكية عبر الإنترنت مفيدة في إستخدام الخدمات البنكية. ١٥أ
٥ ١ ٣ ٢ ١ وك عبر الأنترنتمدى سهولة الخدمات البنكية التي تقدمها البن
تعلم إستخدام الخدمات البنكية التي تقدمها البنوك عبر الانترنت سهل بالنسبة لي. ١٦أ
وجدت أنه من السهل أن أنجز معاملاتي البنكية التي تناسبني عبر الأنترنت. ١٧أ
وقابلة للفهم.وجدت من تعاملي مع الخدمات البنكية عبر الأنترنت أنها واضحة ١٨أ
وجدت أن الخدمات االبنكية عبر الإنترنت مرنة عند التعامل معها. ١٩أ
من السهل علي ان أكون ماهرا في إستخدام الخدمات البنكية عبر الانترنت. ٢١أ
بشكل عام، أجد أن إستخدام الخدمات البنكية عبر الأنترنت سهل. ٢١أ
٥ ١ ٣ ٢ ١ لبنكية عبر الإنترنتمدى أمن الخدمات ا
استخدام الخدمات البنكية عبر الإنترنت آمن ماليا. ٢٢أ
أثق في قدرة الخدمات البنكية عبر الإنترنت في المحافظة على خصوصيتي. ٢٣أ
.أثق في تكنولوجيا الخدمات البنكية عبر الإنترنت ٢١أ
نترنت كما اثق في البنك.اثق في الخدمات البنكية عبر الإ ٢٥أ
النواحي الأمنية ليس لها تأثير على استخدامي للخدمات البنكية عبر الإنترنت. ٢٦أ
٥ ١ ٣ ٢ ١ مدى درجة المعرفة
بشكل عام، أحصل على معلومات كافية عن الخدمات البنكية عبر الأنترنت. ٢٧أ
ن فوائد إستخدام الخدمات البنكية عبر الأنترنت.بشكل عام، أحصل على معلومات كافية ع ٢٨أ
٥ ١ ٣ ٢ ١ مدى فاعلية قدرة الشخص
أستطيع استخدام الخدمات البنكية عبر الإنترنت حتى لو لم يكن معي أحد لمساعدتي. ٢٩أ
ت.أستطيع استخدام الخدمات البنكية عبر الإنترنت فقط عندما تتوفر المساعدة عبر الإنترن ٣١أ
أستطيع استخدام الخدمات البنكية عبر الإنترنت حتى لو تم تغيير طريقة إستخدامها. ٣١أ
Page 362
346
الخدمات البنكية عبر الأنترنت, وذلك بوضع ب: الرجاء تحديد مدى العائق الذي تشكله العبارات التالية لإستخدامك٢أ
في المربع المناسب:)×( علامة
ليس عائق بشدة-٥ لا يشكل عائق-١ محايد -٣ عائق -٢ عائق بشدة -١
مدى توفر البنية التحتية للخدمات البنكية عبرالأنترنت، مقاومة التغيير ، التكلفة
ومدى توفرالخدمات البنكية الإسلامية عبر الإنترنت
٥ ١ ٣ ٢ ١
إمكانية توفر الحاسب الآلي. ١ب ٢ا
إمكانية توفر الأنترنت. ٢ب ٢أ
إستخدام الخدمات البنكية عبر الأنترنت عوضا عن إستخدام القنوات البنكية الأخرى ٣ب ٢أ
مثل الهاتف المصرفي أو الفروع البنكية أو أجهزة الصرف الآلي.
تكلفة استخدام الخدمات البنكية عبر الأنترنت. ١ب ٢أ
نت.مدى توفرالخدمات البنكية الإسلامية عبر الإنتر ٥ب ٢أ
القسم ب: قسم الخصائص السكانية )_الديموغرافية( للمجتمع.
الغرض من هذا القسم هو الحصول على معلومات عن خصائص المجتمع السكانية )الديموغرافية( لمستخدمي الخدمات
البنكية عبر الأنترنت.
. الجنس؟١ب
ذكر أنثى
.ما هي ديانتك؟٢ب
مسلم مسيحي بوذي هندوسي )أخرى )الرجاء تحديدها-----------------
. العمر؟٣ب
٢٢تحت ٣٢-٢١ ٠٢-٣١ ٠٢-٠١ ٠٢-٠١ وأكثر٠١
. الدخل بالريال السعودي)السنوي(؟٠ب
أو أقل ٠٢٢٢٢٠0٢٢1-١٢٢٢٢٢ ١٢0٢٢1-١٠٢٢٢٢
١٠0٢٢1-٢٢٢٢٢٢ ٢٢0٢٢1 أو أعلى
. ما هو مستواك التعليمي؟٠ب
الثانوية العامة )الكلية المتوسطة )دبلوملريوس درجة البكا
درجة الماجستير درجة الدكتوراة )أخرى )الرجاء تحديدها-----------------
. الوظيفة الحالية؟٠ب
حكومية القطاع الخاص أكاديمية أعمال حرة
عسكرية)أخرى )الرجاء تحديدها---------------------------------
. مستوى قدرتك في إستخدام الكمبيوتر؟٧ب
غير جيد أطلاقا غير جيد مبتدئ جيد خبير
. من أين يكون إتصالك بالأنترنت غالبا؟٨ب
البيت المدرسة مقهى أنترنت العمل
بيت صديق)أخرى )الرجاء تحديدها-------------------------------------------
. إذا كنت حاصلا على شهادة جامعية، فهي في مجال؟٩ب
الأعمال الهندسة التعليم الفنالطب
دراسات إسلامية القانون علوم الكمبيوتر ًلست خريجاً جامعياجاء تحديده(آخر )الر----------
-
Page 363
347
. منذ متى تستخدم خدمة الأنترنت؟١٢ب
أقل من شهرشهر ١٢-١ سنة ٣-أكثر من سنة سنة٠-سنوات 3أكثر من سنوات٠أكثر من
. كم عدد مرات إستخدامك للأنترنت شهريا؟١١ب
مرات ٠-١مرات ١٢-٠مرة ٢٢-١١ مرة ٣٢-٢١ مرة ٣١أكثر من
. في أي من هذه البنوك لديك خدمة بنكية عبر الأنترنت )بإمكانك إختيار أكثر من بنك(؟١٢ب
البنك السعودي الفرنسيبنك الراجحي
البنك الأهلي التجاريبنك الجزيرة
عودي للأستثمار البنك السبنك الرياض
البنك السعودي البريطانيالبنك السعودي الهولندي
البنك العربي الوطنيالبنك السعودي الأمريكي
بنك البلاد
الخدمات البنكية عبر الأنترنت؟. منذ متى وأنت تستخدم ١٣ب
أقل من شهر شهر ١٢-١ سنة ٣-أكثر من سنة سنة٠-سنوات 3أكثر من سنوات٠أكثر من
. كم عدد المرات التي تجري فيها معاملاتك البنكية عبر الأنترنت شهريا؟١٠ب
مرات ٠-١مرات ١٢-٠مرة ٢٢-١١ مرة ٣٢-٢١ مرة ٣١أكثر من
. أفكرفي إستخدام الخدمات البنكية عبر الأنترنت في الفترة القادمة من:١٠ب
ولا مرة شهر ١٢-١ سنة ٣-أكثر من سنة سنة ٠-سنوات 3أكثر من سنوات٠أكثر من
ر الأنترنت لإجراء ما يلي: )بإمكانك إختيار أكثر من خدمة(:. أستخدم الخدمات البنكية عب١٠ب
مراجعة رصيد حسابي
للاطلاع على سجل العمليات التي قمت بها
للتحويل بين الحسابات
لتسديد الفواتير
للإطلاع على صور الشيكات المدفوعة
لشراء بضائع أو خدمات الحصول على نسبة فائدة على الودائع لطلب قروض
لطلب نسخ من بيانات سابقة أو شيكات مدفوعة
لمراجعة حساب محفظة أسهمي
مصرفية/لطلب شيكات سياحية
)غير ذلك )الرجاء تحديدها---------------------------------------------
-أنتهت الأسئلة-
*إذا كان لديك ما ترغب إضافته فالرجاء كتابته هنا:
------------------------------------------------------------------------------------------------------------------
------------------------------------------------------------------------------------------------------------------
------------------------------------------------------------------------------------------------------------------
------------------------------------------------------------------------------------------------------------------
------------------------------------------------------------------------------------------------------------------
شكرا جزيلا لك لتعاونك معي بإكمالك هذا الإستبيان.
في حالة رغبتك بالحصول على نسخة من نتائج هذه الدراسة عند إنتهاء البحث، فالرجاء كتابة بريدك الإلكتروني الخاص
بك.
---------------------------------البريد الألكتروني:
Page 364
348
APPENDIX C
The First Follow-Up Postal Reminder
(English Version)
Page 365
349
Dear Participant
My name is Mohammed Eid Al-Qahtani and I am currently studying for a PhD under
the supervision of Dr. Dimitrios Tsagdis at Hull University Business School, United
Kingdom. The topic of my PhD focuses on customer attitudes towards internet
banking in Saudi Arabia.
I am sending this letter as a first reminder; as I have sent the accompanying
questionnaire to you before 6 weeks, seeking your participation in this survey.
Unfortunately, we have not received your reply and it will be highly appreciated if
you kindly provide us with your valuable feedback in order to gather your opinions of
internet banking usage in Saudi Arabia. We would like to remind that this study is
very important for the improvement the Internet Banking market and building an
Internet Banking integrated system in Saudi Arabia. Also, I would like to remind you
that you response is extremely important to the success of this study and would like to
reassure you that your response will be held in strict confidence.
Again, I would like to remind that there are no right or wrong answers; we are just
interested in your opinions. Thus if you are using Internet Banking please answer all
questions as best as you can and return the completed questionnaire in the provided
stamped addressed envelope. If you face any difficulty or have any questions please
contact me on the address below.
We shall be pleased to share the findings of this research once it is completed. To that
extent if you would like to receive a copy of its findings please provide us with an e-
mail address at the end of the survey. Your kind co-operation in participating in this
survey will be appreciated.
I look forward to receiving your reply.
Yours faithfully
Mr Mohammed Eid Al-Qahtani
P. O. Box 1411
Dhahran 31311
Saudi Arabia
E-mail: [email protected]
Dr Dimitrios Tsagdis
University of Hull
Scarborough Management Centre
Page 366
350
APPENDIX C
رسالة تذكير بريدية أولى للمشاركة في الاستبانه
)نسخة عربية(
(Arabic Version)
Page 367
351
عزيزي المشارك،
انا الباحث محمد عيد القحطاني ، اقوم حاليا بدراسة الدكتوراة تحت إشراف الدكتور "ديمتري تساغديس" في كلية
مشروع بحثي بعنوان "سلوكيات وتوجهات إدارة الأعمال في جامعة هال بالمملكة المتحدة، وأعمل على
مستخدمي الخدمات البنكية عبر الأنترنت في المملكة العربية السعودية".
وعلى ضوء ذلك أرسل لك هذا التذكيرالأول لكي أخبركم بانني قد ارسلت لك هذا الإستبيان المرفق, قبل ستة
كية عبر الانترنت في المملكة العربية السعودية. اسابيع من أجل الحصول على مرئياتك في استخدام الخدمات البن
ولسوء الحظ لم يتسنى لنا الحصول عل مرئياتك القيمة في هذه الاستخدامات. كما أود اعادة تذكيرك بان هذه
الدراسة مهمة في تطور وتكامل نظام التعاملات البنكية في المملكة العربية السعودية. كما أود التوضيح أن
الاستبانه ذات أهمية بالغة وذلك من أجل إنجاح هذه الدراسة. كما أود ان أعيد تذكيرك من تأكيدي استجابتك لهذه
لك حرصي التام ومحافظتي على خصوصية وسرية جميع المعلومات المقدمة في هذه الإستبانة.
لك، إذا كنت من كما أود افادتكم من أنه لا يوجد هناك إجابة صائبة أو خاطئة؛ نحن نهتم فقط بآرائكم. ولذ
مستخدمي الخدمات البنكية عبر الأنترنت، نرجو منك التكرم بالإجابة على جميع الأسئلة المرفقة في حالة تمكنك
من ذلك، ومن ثم قم بإرسال الإستبيان بعد إتمامه كاملاً في المظروف المعنون المرفق مع طابع ملصق، وإذا
الرجاء مراسلتي على العنوان في الأسفل.واجهتك أي صعوبة أو إذا كان لديك أي سؤال،
وإنه لمن دواعي سروري أن أطلعك على نتائج هذه الدراسة عند الإنتهاء منها، وبالتالي اذا كنت راغبا في ذلك
ارجو منك التكرم بكتابة بريدك الإلكتروني في نهاية الإستبانة.
علينا باجابة استفسارات هذه الاستبانه، ومتطلعا وفي الختام، سوف أكون مقدرا لكم ارسالنا مرئياتك والرد
لإستقبال ردك في القريب العاجل.
.محمد عيد القحطاني /الباحث
العنوان:
محمدعيد القحطاني
المملكة العربية السعودية
١١١١صندوق البريد:
٣١٣١١الرمز البريدي:
[email protected] البريد الألكتروني:
المشرف الدراسي:
. ديمتري تساغديسدجامعة هال
Page 368
352
APPENDIX D
The Second Follow-Up Postal Reminder
(English Version)
Page 369
353
Dear Participant
My name is Mohammed Eid Al-Qahtani and I am currently studying for a PhD under
the supervision of Dr. Dimitrios Tsagdis at Hull University Business School, United
Kingdom. The topic of my PhD focuses on customer attitudes towards internet
banking in Saudi Arabia.
I am sending this letter as a second reminder; as I have sent the accompanying
questionnaire to you before 10 weeks, seeking your participation in this survey.
Unfortunately, we have not received your reply and it will be highly appreciated if
you kindly provide us with your valuable feedback in order to gather your opinions of
internet banking usage in Saudi Arabia. We would like to remind that this study is
very important for the improvement the Internet Banking market and building an
Internet Banking integrated system in Saudi Arabia. Also, I would like to remind you
that you response is extremely important to the success of this study and would like to
reassure you that your response will be held in strict confidence.
Again, I would like to remind that there are no right or wrong answers; we are just
interested in your opinions. Thus if you are using Internet Banking please answer all
questions as best as you can and return the completed questionnaire in the provided
stamped addressed envelope. If you face any difficulty or have any questions please
contact me on the address below.
We shall be pleased to share the findings of this research once it is completed. To that
extent if you would like to receive a copy of its findings please provide us with an e-
mail address at the end of the survey. Your kind co-operation in participating in this
survey will be appreciated.
I look forward to receiving your reply.
Yours faithfully
Mr Mohammed Eid Al-Qahtani
P. O. Box 1411
Dhahran 31311
Saudi Arabia
E-mail: [email protected]
Dr Dimitrios Tsagdis
University of Hull
Scarborough Management Centre
Page 370
354
APPENDIX D
للمشاركة في الاستبانهثانية رسالة تذكير بريدية
)نسخة عربية(
(Arabic Version)
Page 371
355
عزيزي المشارك،
انا الباحث محمد عيد القحطاني ، اقوم حاليا بدراسة الدكتوراة تحت إشراف الدكتور "ديمتري تساغديس" في كلية
روع بحثي بعنوان "سلوكيات وتوجهات إدارة الأعمال في جامعة هال بالمملكة المتحدة، وأعمل على مش
مستخدمي الخدمات البنكية عبر الأنترنت في المملكة العربية السعودية".
وعلى ضوء ذلك أرسل لك هذا التذكيرالثاني لكي أخبركم بانني قد ارسلت لك هذا الإستبيان المرفق, قبل عشرة
كية عبر الانترنت في المملكة العربية السعودية. اسابيع من أجل الحصول على مرئياتك في استخدام الخدمات البن
ولسوء الحظ لم يتسنى لنا الحصول عل مرئياتك القيمة في هذه الاستخدامات. كما أود اعادة تذكيرك بان هذه
الدراسة مهمة في تطور وتكامل نظام التعاملات البنكية في المملكة العربية السعودية. كما أود التوضيح أن
الاستبانه ذات أهمية بالغة وذلك من أجل إنجاح هذه الدراسة. كما أود ان أعيد تذكيرك من تأكيدي استجابتك لهذه
لك حرصي التام ومحافظتي على خصوصية وسرية جميع المعلومات المقدمة في هذه الإستبانة.
لك، إذا كنت من كما أود افادتكم من أنه لا يوجد هناك إجابة صائبة أو خاطئة؛ نحن نهتم فقط بآرائكم. ولذ
مستخدمي الخدمات البنكية عبر الأنترنت، نرجو منك التكرم بالإجابة على جميع الأسئلة المرفقة في حالة تمكنك
من ذلك، ومن ثم قم بإرسال الإستبيان بعد إتمامه كاملاً في المظروف المعنون المرفق مع طابع ملصق، وإذا
الرجاء مراسلتي على العنوان في الأسفل.واجهتك أي صعوبة أو إذا كان لديك أي سؤال،
وإنه لمن دواعي سروري أن أطلعك على نتائج هذه الدراسة عند الإنتهاء منها، وبالتالي اذا كنت راغبا في ذلك
ارجو منك التكرم بكتابة بريدك الإلكتروني في نهاية الإستبانة.
علينا باجابة استفسارات هذه الاستبانه، ومتطلعا وفي الختام، سوف أكون مقدرا لكم ارسالنا مرئياتك والرد
لإستقبال ردك في القريب العاجل.
.محمد عيد القحطاني /الباحث
العنوان:
محمدعيد القحطاني
المملكة العربية السعودية
١١١١صندوق البريد:
٣١٣١١الرمز البريدي:
[email protected] البريد الألكتروني:
المشرف الدراسي:
. ديمتري تساغديسدجامعة هال
Page 372
356
APPENDIX E
Questionnaire Coding Procedure
Page 373
357
Section A: Factors influencing the usage of Internet Banking (IB)
The aim of this section is to investigate the factors which may impact on the usage of IB.
Please indicate how strongly you agree or disagree with the statements? Please tick () the
box that best reflects your answer where:
1=Strongly disagree 2= Disagree 3= Uncertain 4= Agree 5= Strongly agree
No. Satisfactions of the IB services 1 2 3 4 5
A1 Available 7 days and 24 hours
A2 I can access my IB account from anywhere
A3 It provides time savings
A4 The transactions have low or no cost
A5 IB services are reliable
A6 I can get instant feedback for my transactions
A7 It is self-service
A8 Satisfied all my banking needs
A9 Satisfied all my Islamic Banking (IsB) needs
Perceived Usefulness of the IB services 1 2 3 4 5
A10 Using the IB services enables me to utilize banking services more quickly
A11 Using the IB services improves my performance in utilizing the banking
services
A12 Using the IB services for my banking services increases my productivity
A13 Using the IB services enhance my effectiveness of utilising banking services
A14 Using the IB services makes it easier for me to utilise banking services
A15 Overall, IB is useful for me to utilise banking services
Perceived Ease of Use of the IB services 1 2 3 4 5
A16 Learning to use the IB services is easy for me.
A17 I find it easy to do what I want to do in IB.
A18 My interaction with the use of the IB services is clear and understandable.
A19 I find IB services to be flexible to interact with
A20 It is easy for me to become skilful at the use of the IB services.
A21 Overall, I find the use of the IB services easy to use.
Security of the IB services 1 2 3 4 5
A22 Using the IB services is financially secure
A23 I trust the ability of the IB services to protect my privacy
A24 I trust in the technology that IB services
A25 I trust in the IB services as a bank
A26 Matters of security have no influence on using the IB services
Awareness 1 2 3 4 5
A27 I have generally received enough information about IB.
A28 I have received enough information about the benefits of the IB services.
Self-Efficiency 1 2 3 4 5
A29 I can use IB even if there was no one around to show me how to do it
A30 I can use IB with only the online help function for assistance
A31 I could use IB even if the system was changed
Page 374
358
A2B: To what extent do you think the following factors are problematic in using your IB
services? From 1 (major Obstacle) to 5 (No obstacle), please tick () the box that best reflects
your answer:
1=Major obstacle 2= Obstacle 3= Moderate obstacle 4=Minor obstacle 5= No obstacle
Availability of the Infrastructure, Resistance to Change, Cost and
availability of Islamic Banking (IsB) services online
1 2 3 4 5
A2B1 Access to Computer
A2B2 Access to Internet
A2B3 Using the IB services rather than using the other banking channels, e.g.
telephone/branch banking/ATM
A2B4 The cost of usage of IB
A2B5 The availability of the IsB products and services on your IB services
Section B. Socio-demographic characteristics
The purpose of this section is to obtain information about the socio-demographic
characteristics of IB users.
B1. Are you?
Male (1) Female (2) (
B2. What is your religion?
Muslim (1) Christian (2) Buddhist (3) Hindu (4) Other (Please specify) (5)
B3. How old are you?
20 or less (1) 21-30 (2) 31-40 (3) 41-50 (4) 51-60 (5) 61 or more (6)
B4. How much is your yearly income in SR?
Equal or Less than 50,000 (1) 50,001-100,000 (2) 100,001-150,000 (3) 150,001-200,000 (4)
200,001 or more (5)
B5. What is your education level?
High school (1) Community college (2) Bachelor's (3) Master's (4) Doctoral (5)
Other (Please specify) (6)
B6. What is your current occupation?
Public sector (1) Private sector (2) Academic sector (3) Self-employee (4)
Military sector (5) Other (Please specify) (6)
B7. What is the level of your ability to use the computer?
Not good at all (1) Not good (2) Beginner (3) Good (4) Expert (5)
Page 375
359
B8. You often access the Internet from?
Home (1) School (2) Internet café (3) Work (4)
Friend's house (5) Other (Please specify) (6)
B9. If you graduated from a college, what was your field of study?
Business (1) Engineering (2) Art (3) Education (4) Islamic Studies (5) Medical (6)
Law (7) Computer Science (8) NA (9) Other (Please specify) (10)
B10. How long have you been using the Internet?
<1 Month (1) 1 - 12 Months (2) (>1 year) - 3 Years (3) (>3 year) - 5 Years (4) > 5 years (5)
B11. How frequently do you access the Internet each month?
1-5 times (1) 6 -10 times (2) 11-20 times (3) 21-30 times (4) > 30 times (5)
B12. Which of these banks you have your IB access with? (Pease tick all that apply)
(1) Al-Bank Al-Saudi Al-Fransi (7) Al-Rajhi Bank
(2) National Commercial Bank (8) Bank Al-Jazira
(3) Saudi Investment Bank (9) Riyad Bank
(4) Saudi British Bank (10) Saudi Hollandi Bank
(5) Arab National Bank (11) Saudi American Bank
(6) Bank Al-Bilad
B13. How long have you been using the IB?
<1 Month (1) 1 - 12 Months (2) (>1 year) - 3 Years (3) (>3 year) - 5 Years (4) > 5 years (5)
B14. How frequently do you access IB information each month?
1-5 times (1) 6 -10 times (3) 11-20 times (4) 21-30 times (5) > 30 times (6)
B16. I use my IB account to do the following (Check all that apply):
(1) Check account balances (8) View transaction history
(2) Transfer money between accounts (9) Payment of bills
(3) View images of your checks (10)Purchase of goods or services
(4) Obtains interest rates on deposit products (11)Apply for loan
(5) Request copies of past statements & processed checks (12) check my share’s portfolio
(6) Order traveller's, cashier's, and regular cheques
(7) Other (Please specify)
If there is anything else you can think of which you would like to tell me, please do so in
the next space. Space for any additional comments: ----------------------------------------------
----------------------------------------------------------------------------------------------------------------
----------------------------------------------------------------------------------------------------------------
Thank you very much for your assistance in completing this questionnaire.
If you would like to receive a copy of this study’s findings, please provide us with an
email address ____________________________________
B15. I intend to use the IB in the future for a period of:
Never (1) 1 - 12 Months (2) (>1 year) - 3 Years (3) (>3 year) - 5 Years (4) > 5 years (5)
Page 376
360
APPENDIX F
Questionnaire Items Characteristics
Page 377
361
Satisfactions (Time Saving) of the IB services
Items M Sd Min Max Skn Kurtosis
Available 7 days and 24 hours 3.230 0.980 1.00 5.00 0.750 -0.530
It provides time savings 3.540 1.0156 1.00 5.00 0.540 -0.700
I can get instant feedback for my transactions
3.817 0.960 1.00 5.00 0.666 0.231
Total mean 3.529 0.9852 N = 228
Satisfactions (Convenience) of the IB services
Items M Sd Min Max Skn Kurtosis
The transactions have low or no cost 3.500 0.890 1.00 5.00 0.430 0.227
IB services are reliable 3.370 0.5236 1.00 5.00 0.394 0.400
It is self-service 3.291 0.810 1.00 5.00 0.820 0.450
Total mean 3.387 0.7412 N = 228
Satisfactions (Fulfilment) of the IB services
Items M Sd Min Max Skn Kurtosis
I can access my IB account from anywhere
3.530 0.3352 1.00 5.00 0.870 2.100
Satisfied all my banking needs 3.263 0.760 1.00 5.00 0.620 1.718
Satisfied all my Islamic Banking (IsB) needs
2.930 0.880 1.00 5.00 0.733 1.720
Total mean 3.241 0.6584 N = 228
Perceived Usefulness of the IB services
Items M Sd Min Max Skn Kurtosis
Using the IB services enables me to utilize banking services more quickly
3.900 0.840 1.00 5.00 -0.370 -0.618
Using the IB services improves my performance in utilizing the banking services
3.700 0.500 1.00 5.00 -0.600 0.780
Using the IB services for my banking services increases my productivity
2.500 0.800 1.00 5.00 -0.340 0.570
Using the IB services enhance my effectiveness of utilising banking services
2.344 0.900 1.00 5.00 -0.610 -0.440
Using the IB services makes it easier for me to utilise banking services
3.200 0.870 1.00 5.00 -0.640 -0.340
Overall, IB is useful for me to utilise banking services
3.100 0.5624 1.00 5.00 -0.362 0.540
Total mean 3.124 .7454 N = 228
Page 378
362
Perceived Ease of Use (Easiness) of the IB services
Items M Sd Min Max Skn Kurtosis
Learning to use the IB services is easy for me.
3.640 0.980 1.00 5.00 0.330 0.960
I find it easy to do what I want to do in IB.
3.020 1.070 1.00 5.00 0.300 0.730
It is easy for me to become skilful at the use of the IB services.
2.890 0.990 1.00 5.00 0.462 0.620
Overall, I find the use of the IB services easy to use.
3.786 1.044 1.00 5.00 0.500 0.670
Total mean 3.334 1.0210 N = 228
Perceived Ease of Use (Interaction) of the IB services
Items M Sd Min Max Skn Kurtosis
My interaction with the use of the IB services is clear and understandable.
3.860 0.910 1.00 5.00 -0.780 1.050
I find IB services to be flexible to interact with
3.276 1.0664 1.00 5.00 -0.524 1.002
Total mean 3.568 .9882 N = 228
Security of the IB services
Items M Sd Min Max Skn Kurtosis
Using the IB services is financially secure
2.500 1.0400 1.00 5.00 -0.780 -0.820
I trust the ability of the IB services to protect my privacy
3.260 1.0500 1.00 5.00 -0.620 0.410
I trust in the technology that IB services
3.670 0.7146 1.00 5.00 -0.750 0.715
I trust in the IB services as a bank 3.300 1.0900 1.00 5.00 -0.500 -0.650
Matters of security have no influence on using the IB services
2.600 1.1900 1.00 5.00 -0.350 -0.760
Total mean 2.890 1.0241 N = 228
Awareness
Items M Sd Min Max Skn Kurtosis
I have generally received enough information about IB.
3.962 0.914 1.00 5.00 -0.950 0.890
I have received enough information about the benefits of the IB services.
3.520 0.800 1.00 5.00 -0.880 0.652
Total mean 3.741 0.857 N = 228
Self-Efficiency
Items M Sd Min Max Skn Kurtosis
I can use IB even if there was no one around to show me how to do it
3.676 0.5906 1.00 5.00 -0.740 1.320
I can use IB with only the online help function for assistance
3.321 1.1050 1.00 5.00 -0.508 1.432
I could use IB even if the system was changed
3.680 0.7500 1.00 5.00 -0.690 1.139
Total mean 3.559 0.8152 N = 228
Page 379
363
Availability of Infrastructure
Items M Sd Min Max Skn Kurtosis
Access to Computer 3.742 0.9972 1.00 5.00 -0.992 0.930
Access to Internet 3.480 0.8820 1.00 5.00 -0.978 0.594
Total mean 3.611 0.9396 N = 228
Resistance to change
Items M Sd Min Max Skn Kurtosis
Using the IB services rather than using the other banking channels, e.g. telephone/branch banking/ATM
2.951 1.1170 1.00 5.00 -0.715 -0.703
High cost
Items M Sd Min Max Skn Kurtosis
The cost of usage of IB 3.771 0.9007 1.00 5.00 -.212 1.112
Availability of IsB
Items M Sd Min Max Skn Kurtosis
The availability of the IsB products and services on your IB services
3.689 .6325 1.00 5.00 -.681 -.369
Page 380
364
APPENDIX G
Business School Research Ethics Committee
Review and Support Letter
Page 382
366
APPENDIX H
Research Correlation Cronbach’s Alpha and
Pearson coefficients of each item with item-total for the scale
Page 383
367
SN Items
Pearson correlation
coefficients of each item with item-total for
the scale
Total Correlation Cronbach’s
Alpha if Item Deleted
Satisfactions of the IB services
1 Available 7 days and 24 hours .473** .722
2 I can access my IB account from anywhere .570** .819
3 It provides time savings .463** .745
4 The transactions have low or no cost .396** .825
5 IB services are reliable .592** .704
6 I can get instant feedback for my transactions .522** .723
7 It is self-service .614** .811
8 Satisfied all my banking needs .537** .872
9 Satisfied all my Islamic Banking (IsB) needs .472** .769
Perceived Usefulness of the IB services
10 Using the IB services enables me to utilize banking services more quickly
.686** .832
11 Using the IB services improves my performance in utilizing the banking services
.636** .863
12 Using the IB services for my banking services increases my productivity
.687** .820
13 Using the IB services enhance my effectiveness of utilising banking services
.651** .824
14 Using the IB services makes it easier for me to utilise banking services
.662** .812
15 Overall, IB is useful for me to utilise banking services
.684** .709
Perceived Ease of Use of the IB services
16 Learning to use the IB services is easy for me. .676** .721
17 I find it easy to do what I want to do in IB. .657** .727
18 My interaction with the use of the IB services is clear and understandable.
.722** .677
19 I find IB services to be flexible to interact with .697** .823
20 It is easy for me to become skilful at the use of the IB services.
.704** .784
21 Overall, I find the use of the IB services easy to use.
.707** .808
Security of the IB services
22 Using the IB services is financially secure .591** .840
23 I trust the ability of the IB services to protect my privacy
.593** .838
24 I trust in the technology that IB services .576** .845
25 I trust in the IB services as a bank .564** .827
26 Matters of security have no influence on using the IB services
.491** .850
Awareness
27 I have generally received enough information about IB.
.649** .890
28 I have received enough information about the benefits of the IB services.
.642** .690
Self-Efficiency
29 I can use IB even if there was no one around to show me how to do it
.558** .785
30 I can use IB with only the online help function for assistance
.226** .882
31 I could use IB even if the system was changed .579** .943
Availability of Infrastructure
32 Access to Computer .348** .782
33 Access to Internet .378** .778 Resistance to
change 34 Using the IB services rather than using the other
banking channels, e.g. telephone/branch .491** .796
Page 384
368
banking/ATM
High cost 35 The cost of usage of IB .379** .725 availability of IsB services
36 The availability of the IsB products and services on your IB services
.351** .852
Cronbach's Alpha = 0.80 N = 36
** Correlation is significant at the 0.01 level
Page 385
369
APPENDIX I
Common Method Variance Harman’s Single-
Factor Test
Page 386
370
Total Variance Explained
Component Initial Eigenvalues Extraction Sums of Squared Loadings
Total % of Variance Cumulative % Total % of Variance Cumulative %
1 12.117 33.659 33.659 12.117 33.659 33.659
2 2.578 7.160 40.819
3 2.355 6.542 47.361
4 1.879 5.221 52.581
5 1.638 4.549 57.130
6 1.280 3.556 60.687
7 1.161 3.225 63.912
8 1.070 2.972 66.884
9 .980 2.722 69.606
10 .895 2.486 72.092
11 .846 2.351 74.443
12 .760 2.111 76.554
13 .723 2.010 78.564
14 .659 1.830 80.394
15 .620 1.722 82.115
16 .570 1.583 83.698
17 .522 1.451 85.150
18 .509 1.415 86.565
19 .476 1.321 87.886
20 .448 1.243 89.129
21 .429 1.192 90.322
22 .394 1.094 91.416
23 .356 .990 92.406
24 .322 .895 93.301
25 .287 .798 94.099
26 .281 .781 94.880
27 .255 .710 95.590
28 .245 .681 96.271
29 .229 .637 96.908
30 .223 .618 97.526
31 .192 .532 98.059
32 .177 .490 98.549
33 .157 .436 98.985
34 .143 .398 99.383
35 .116 .323 99.706
36 .106 .294 100.000
Extraction Method: Principal Component Analysis.
Page 387
371
APPENDIX J
SA Comercial Banks History
Page 388
372
SA Comercial Banks History
SA Commercial Banks
In this section, an overview is given of the history, development and origins of
banking in SA. Starting with the history, the evolution of the banking industry in SA
can be divided into five broad stages:
1. The early years (1950-1970).
2. Consolidation (1970-1980).
3. The turbulent years (1980-1990).
4. The economic boom and banking growth (1990-2000).
5. The present Saudi banking system (2000 – present).
The Early Years (1950-1970)
The modern banking system in SA has its roots in the creation of SAMA in 1952,
with a mandate for monetary stability. Before this, branches of a few foreign banks
and some money-changers had provided all the financial services requirements of the
trading community. By 1952, the inflow of royalties from the increasing production
of and demand for oil had contributed to a sharp rise in government revenues and
expenditure. As this enhanced the domestic economy, the demand for financial
services rose sharply. As a result, the government encouraged a competitive banking
environment by licensing new domestic and foreign banks in SA. SAMA's creation
was followed by the establishment of more foreign bank branches, including the
Banque du Cairo and the First National City Bank of New York. Some domestic
banks were also licensed. NCB was licensed in 1953 and Riyad Bank commenced
operations in 1957, followed by Al-Bank Al-Watany (The National Bank) in 1958.
Following problems in 1960, Riyad Bank took over the operations of Al-Watany and
the government acquired 38% of the shares in the bank. In 1966, a new Banking
Page 389
373
Control Law gave SAMA wider regulatory powers, and a few more foreign banks
were licensed (SAMA, 2004). By the end of 1970, there were four banks in SA.
Consolidation (1970-1980)
In the end of 1960s, 1971, 1973, and 1974, the Saudi Arabian Agricultural Bank, the
Saudi Credit Bank, the Public Investment Fund (PIF), the Saudi Industrial
Development Fund, and the Real Estate Development Fund were formed to provide
financial support to the agricultural sector, to offer loans to low-income Saudis with
interest-free terms, and to promote private sector firms with interest-free loans
(Money and Banking, 1992). The 1970s was a period of rapid expansion for the
banking system, principally due to the significant rise in government revenues and
expenditure and the financing of major infrastructure and industrial projects. There
was, according to SAMA (2004), significant growth in commercial banks, with their
total assets increasing from SR 2.7 billion in 1970 to SR 93 billion in 1978, while
deposits increased from SR 0.6 billion to SR 68 billion in the same period. The
demand for commercial credit delayed the increasing liquidity available in the
banking system, and low-cost medium- to long-term credit was easily available from
the government lending institutions. Consequently, the foreign assets of commercial
banks grew rapidly from 11% of their total assets in 1977 to 45% at the end of 1980
(SAMA, 2004). By 1980, there were 12 banks in operation; three were foreign and
seven had a substantial foreign ownership and management. The total number of
bank branches had risen to 247 and covered nearly the entire country. Irrespective of
this impressive growth, significant gaps remained in the provision of banking and
financial services. Some of the key gaps, according to SAMA (2004), were small
businesses with limited access to credit; cheque facilities, which were limited to cash
withdrawals, foreign currency transfers, which were available only through money
Page 390
374
changers, no consumer loans or credit facilities for small savers; outdated banking
procedures; and non-existent-computer technology. A major shortcoming was the
dependence of banks on foreigners and expatriates having shares in the Saudi banks.
Consequently, by 1980, Saudi banks and authorities had a number of deficiencies to
remedy.
The turbulent years (1980-1990)
As the 1980s were a turbulent and testing period for the Saudi banking system, this
decade has witnessed the announcement of market regulation in 1984, by the
Ministry of Finance and SAMA. The intermediation function was restricted to
commercial banks. In addition to that, SSRC was established in 1985 while the
Electronic Securities and Information System (ESIS)1 was introduced in 1990.
Moreover, and as a consequence of the great increase in government revenues during
1979-81 and the subsequent decrease in 1982-86, the commercial banks in SA
experienced rapid expansion followed by a difficult period of adjustment, a decline in
asset quality and a reduction in expenditure (SAMA, 2004). This was largely due to
oil prices falling from an all-time high in 1981 and the subsequent and continued
decline during the next five years. This stimulated some bank mergers and reforms;
for example, the United Saudi Commercial Bank was formed in 1983 to take over the
branches of three foreign banks, namely, the United Bank of Pakistan, Bank Melli
Iran, and Banque (SAMA, 2004). This completed the process of conversion of
foreign bank branches into strong joint venture banks involving foreign and Saudi
shareholders. Moreover, in 1984, the Saudi Investment Bank was given a full
commercial licence.
1 The Electronic Securities Information System (ESIS) provided a continuous order-driven market. In
ESIS, the settlement used to take place on the same day for advice, and for settlement of share
certificates, it used to take place on the following day of execution (Al-Dukheil, 2002).
Page 391
375
By 1987, government revenues had also declined rapidly from SR 93 billion to SR 74
billion. Credit to the private sector grew only at an annual rate of less than 4% per
year over the next five years. Over 20% of loans were non-performing by 1986. Bank
profits suffered significantly and loan-loss provisions and loan write-offs mounted.
By 1988, most banks had made sufficient provisions for doubtful debts and the
average provision for the banking system had risen to over 12% of total loans
(SAMA, 2004). In 1988, a licence was granted to Al Rajhi Banking and Investment
Corporation to convert the Al Rajhi money-changing family business into a fully
operational commercial bank. With these developments, by 1990, the Saudi banking
system had twelve Saudi commercial banks, of which nine had substantial foreign
ownership. By 1990, the number of bank branches had reached 1,036 and the total
number of employees had also risen significantly from 11,000 in 1980 to about
25,000. Another aspect of expansion was the opening of overseas branches of major
Saudi banks in the UK, Bahrain, and Turkey to service the needs of Saudis abroad
(SAMA, 2004). The difficulties of the mid-1980s led to a significant increase in the
banks' capital with the encouragement of SAMA. During the period 1988-93, seven
of the 12 Saudi banks increased their capital through new Initial Purchase Offers
(IPOs) and rights issues. Therefore, the capital and reserves for the banking system
doubled from SR 15 billion at end of 1988 to SR 30 billion by 1993 (SAMA, 2004).
The Economic Boom and Banking Growth (1990-2000)
Following the resolution of the Gulf crisis in 1991, there was a small boom in the
economy. During 1991, there was a large inflow of about 20% in the deposits of the
banking system. Banks' domestic loans and advances grew by 90% in 1990-95 and all
other banking indicators, such as rates of return on equity and assets, continued to be
very strong, with many banks posting record profits. Despite difficult international
Page 392
376
conditions such as the Gulf War, the banks continued to show solid and stable growth
and strong profitability during the second half of the 1990s. The trend towards
increasing the banks' capital base continued, and three Saudi banks went public on
the stock market between 1993 and 1997. The capitalisation objectives were mostly
achieved, and with a risk/asset ratio of over 20% at the end of 2000, Saudi banks
were now highly capitalised by international standards (SAMA, 2004).
The reform of the banking system, according to SAMA (2004), continued with the
1997 merger of the United Saudi Commercial Bank and the Saudi Cairo Bank to form
the United Saudi Bank. In 1999, the United Saudi Bank merged with the Saudi
American Bank (SAMBA) to form the third largest bank in SA. This consideration of
Saudi banks was driven primarily by shareholders, who wished to maximise share
values and believed that size mattered. The trend towards mergers was expected, as
banks were in need of more capital to invest in technology, in new products and
services and in risk management systems. Bank (SABB) in 1998 was tied to capital
increases in SAMBA in 2001, following the merger with United Saudi Bank in 1999.
The trend towards having far fewer shareholders is unmistakable and there are several
implications. First, holding a higher concentration of shares in fewer hands might
enable some business groups to influence day-to-day operations and bank
management through board representation. Second, the concentration of shares in a
few hands with block votes "de-democratizes" the role of annual general meetings in
joint-stock companies. Concentration eliminates transparency and leads to joint stock
companies operating like partnerships.
Page 393
377
The present Saudi banking system (2000 – present)
The new millennium saw Saudi banks faced with competitive pressures from regional
and international banks. While it may take some time before the impact of such
competition is felt on the bottom-line profitability of Saudi banks, some of these
banks are already trying to reposition themselves in a more focused manner in the
Saudi market. The international environment of low interest rates affected their
margins, as the cost of funds fell faster than lending rates, eroding lending margins.
In 2003, Saudi banks began to search for non-interest investment income and to
diversify their product range to reduce their dependency on interest income (or
commission income, as it is termed in SA). According to Ramady (2005), the Saudi
banking industry, as a whole, is still dependent on commission income for around
70% of its total income, although there are some individual bank differences. In April
2000, the Saudi Government introduced the Foreign Investment Act, which
announced major changes to the existing legal and regulatory environment, thus
ushering in a new era of foreign investment in SA. The new Foreign Investment Act
also had implications for the financial sector, as it further opened up the Saudi market
to foreign investments, including 100% foreign-owned companies. This law created
the SAGIA, which has the power to issue licenses to companies for most investment.
In October, 2003, it was a turning point in the history of Saudi banking, as it saw the
"complete" Saudization of one of the earlier joint-venture banks, when Citibank
completed the transfer of local management to the renamed SAMBA Financial
Group. The government acquired Citibank's 20% share through the PIF. According to
its 2003 Annual Report, SAMBA decided to liquidate its overseas branch holdings in
the UK and Luxemburg, but retained a wholly-owned subsidiary specializing in
mutual funds operating in Guernsey (SAMBA Annual report, 2003). In 2003, the Al
Page 394
378
Rajhi and Al Jazira banks had the highest investment income ratios amongst Saudi
banks; that was because these two institutions applied their customer deposits in
Islamically-acceptable investments (Ramady, 2005). Al Rajhi's commission income
was not really a net interest differential, but was based on customer-owned
investment products, with Al Rajhi acting as a fiduciary agent in managing these
investments for a fee. With the foreign licensed banks eyeing the investment income
market in SA, the domestic banks realized that they needed to develop more expertise
and deliver more products if they were to compete effectively in this market segment
in the future. The issue of shareholder concentration is also a recent major concern
for the Saudi banking sector, as it is for most other publicly-listed Saudi joint-stock
companies (Abdullatife, 2002). The increase in the number of shareholders in the
Saudi British From 2003 onwards, the concentration level has also been reflected in
other "wholly owned" Saudi banks, such as Riyad Bank and NCB, through
government major ownership participation in these banks.
According to Ramady (2005), in 2003, the major shareholder concentration was more
obvious within the Saudi Hollandi, SAMBA and Al Rajhi banks; however the Saudi
British Bank (SABB) has the least concentrated shareholder of the three. Historical
reasons explain the high level of Saudi banks’ shareholder concentration, especially
for the joint-venture banks. These banks usually started life through a founding group
of investors who were granted a certain percentage of the founding share capital, with
remaining shares being distributed between the foreign joint-venture partner and the
general public. Because the smaller investors received only a few shares, over time,
they sold out to the larger investors and founding shareholders. The Saudi
government is aware of these issues, and is encouraging wider share ownership by
planning a partial privatization of its own banking holdings, especially in the
Page 395
379
Kingdom's largest bank, NCB. According to press reports in 2003, the government
planned to sell up to 50% of its holding in NCB; that would give a large boost to the
CMA which is formed in 2003 (Abdul Ghafour, 2003). It worth to highlight that, the
government owns 80% of NCB (SAMA, 2004). SAMA introduced the SADAD
Payment System (SADAD) on 3 October 2004 to be the national Electronic Bill
Presentment and Payment (EBPP) service provider for SA (SAMA, 2011). The core
mandate for SADAD is to facilitate and streamline bill payment transactions of end
consumers through all channels of Saudi’s banks. In essence, the system facilitates
data exchange between registered billers and the nation’s commercial banks, and
relies on existing banking channels (such as IB, telephone banking, ATM
transactions, and even counter transactions) to allow bill payers to view and pay their
bills via their banks. Many consumers are comfortable with using SADAD. However,
AlGhamdi, taking into account follow-up comments from some of the respondents in
his study, suggested that small-to-medium businesses see the initial costs of
registration with SADAD and the ongoing transactions processing fees as being too
high (AlGhamdi et al., 2011). In 2008, as a reaction to the global financial crisis,
SAMA played down the impact of the global financial crisis both on the Saudi
economy and globally, saying there was no liquidity problem. SAMA has guaranteed
the bank deposits to boost confidence in the SA's financial institutions and this has
further consolidated the banking sector’s position. According to the study by the
Kuwaiti-based Global Investment House (GIH) in 2008, the Kingdom's banking
sector was good because of a strong economic performance and an announcement by
SAMA that it could inject SR 150 billion into the banking sector to offset the credit
crunch. Moreover, the Saudi banking sector, with its limited exposure in the global
markets, was somewhat better able to escape the severe implications of the global
Page 396
380
financial distress. However, being an important part of the intertwined global markets
meant that some of the dampening effects were directly or indirectly translated into
the SA's banking sector performance. In Table 2.4, all SA banks are listed with their
websites, year of establishment, number of branches and capital.
# Bank Name Website address
Est.
Year
Branches
No. Capital
(SRm)
1 Al Rajhi Bank www.alrajhibank.com.sa/en 1978 500 15,000
2 National Commercial Bank www.ncb.com.sa 1953 288 15,000
3 Saudi Arabia British Bank www.sabb.com.sa/ 1978 80 10,000
4 Banque Saudi Fransi www.alfransi.com.sa 1977 114 9,040
5 Saudi American Bank www.samba.com.sa/eng_index.htm 1980 66 9,000
6 Arab National Bank www.anb.com.sa/default.asp 1979 183 8,500
7 Riyad Bank www.riyadbank.com/index_en.html 1957 248 6,000
8 Saudi Investment Bank www.saib.com.sa/english/home.aspx 1976 54 5,500
9 Saudi Hollandi Bank www.saudihollandibank.com/vEnglish/default.asp 1926 44 3,307
10 Bank Al Bilad www.bankalbilad.com.sa/en 2004 78 3,000
11 Bank Al Jazira www.baj.com.sa/default.asp?lng=ar 1975 51 3,000
List of the Saudi banks’ websites, year of foundation, number of branches and capital.
Sources: (Saudi banks’ websites, 2011) (ordered by capital and branches).
Figure 2.6 below is an evaluation of the number of branches and ATMs from a survey
conducted by SAMA between 1994 and 2011. The figure shows growth in both the
number of bank branches and ATMs in SA (SAMA, 2011).
1000
1050
1100
1150
1200
1250
1300
1350
1400
1450
1500
1550
1600
1650
1994 1997 1998 2000 2002 2003 2004 2006 2008 2009 2010 2011
070014002100280035004200490056006300700077008400910098001050011200
Branches ATMs
Evolution of branches and ATMs (1994-2011 1
st Q).
Source: (SAMA, 2011).
Ramady (2010) summarised a list of the key strengths of Saudi Arabian banks1 as
presented in Table 2.5; this indicates that the key strength of Al Rajhi Bank and NCB
is the IsB, while the key strength of other banks, such as SABB, SAMBA and Arab
National, is e-banking. All the following listed 11 banks have established their
1 In Chapter 5, section 5.2.2.3, the most used Saudi Banks are reported based on this study research
survey results.
Page 397
381
presence on the internet, as their websites are bilingual and have been designed for
both Arabic- and English-speaking users (Jasimuddin, 2001). Each bank’s key
strength is presented in the next column:
Institution Perception - strengths
Al Rajhi Islamic investments, foreign exchange, trading activities,
“safety first”.
National
Commercial Bank (NCB)
Consumer banking, small business, Islamic products, corporate
and government lending, foreign exchange and treasury, large
ticket items.
Riyad Bank Consumer loans, trading activities, investment, government
accounts, oil and agricultural sector, syndications, small
business.
SAMBA Corporate banking, treasury and investment products, e-
banking, high net worth clients, international links,
syndications.
Saudi British Bank
(SABB)
E-banking, investments, treasury products, international links,
medium-term facilities to Saudi corporate, part of an
international Hong Kong and Shanghai Banking Corporation
(HSBC) network and global image.
Arab National E-banking, mutual funds, consumer banking, small business,
treasury products.
Al-Jazira Bank Islamic investments, innovation in capital market Sukuk1
products.
Al Bilad Bank Expertise in FX and remittance, SME-friendly.
Saudi Investment Bank Corporate finance medium-to long-term loans, international
trade, treasury products, syndications.
Saudi Fransi Corporate banking, investments, treasury products, loan
syndication.
Saudi Hollandi International trade, medium corporate loans, international
capital markets, off-balance sheet products.
Saudi commercial banks: perception of key strengths.
Source: Ramady (2010).
Online Banking (OB) in Saudi Banks
This section introduces the current status of OB in SA. The WWW is a vehicle for the
most common transactions that one could expect to have with a bank. Websites also
1 The word ‘Sukuk’ (plural of the Arabic word Sakk meaning certificate) reflects participation rights in
underlying assets. The term ‘Sukuk’ is not new and is recognized in the traditional Islamic
jurisprudence. The idea behind Sukuk is simple. The prohibition of interest virtually closes the door
for pure dept security, but an obligation that is linked to the performance of a real asset is acceptable
by Shari’ah (Iqbal and Mirakhor, 2007).
Page 398
382
act as the digitised form of brochures that provide organizational and promotional
information, financial reports, recruitment, general information, contact details, etc.
Today, some Saudi banks have reached a highly developed state in IB service
provision. For example, Global Finance has awarded the Riyad Bank’s website for
having the best website design and the best consumer IB in the Middle East, and the
SAMBA website for being the best institutional/corporate website in the Middle East
and Africa (Rombel, 2005). Diniz (1998) categorized the content of bank websites
into three levels; these will be examined in more depth in subsequent sections, and as
illustrated in Table 2.6.
Basic
interactivity level
Intermediary
interactivity level
level
of interactivity
Advanced
interactivity level
level A) Banks use the web for information delivery
Electronic brochure Report downloads Use customised
resources
Promotional information Recruitment forms Subscription options
Contact and location details Hot links to other sites Advertising
Special offer announcements E-mail Discussion groups
B) Banks use the web to improve their relationship with customers
E-mail and e-forms Investment Advisor More advanced
support tools
Client suggestions and
complaints (calculators, for example)
1
More advanced technologies,
e.g. videoconferencing
C) Banks use the web as a vehicle for the most common transactions2
Opening accounts Clients can access their account
details and statements on-line
Promoting e-cash as a
way to develop Web-
based transactions
Investment and credit
applications
Limited client access
to the bank's database
Enhancing Customer
Relationship Marketing (CRM)
Diniz model, Bank website’s content categories.
Source: Diniz (1998).
Banks use the internet to improve their relationship with customers. By applying
Diniz’s model to Saudi banks, it can be seen that the basic interactivity level of
1 Some banks’ websites provide supportive tools such as calculators.
2 It also includes transfer of fund and payment of bills.
Page 399
383
information delivery is almost universally found in Saudi banks’ websites. However,
there is a significant difference in the second and third levels, regarding the use of the
internet to enhance customer relationships and using the internet as a vehicle for the
most common transactions, as it appears in the Table 2.7.
Banks
Website content and facilities
Al R
ajh
i B
ankin
g &
Investm
ent
Corp
ora
tio
n
(AR
BIC
)
Natio
nal C
om
me
rcia
l B
ank
(NC
B)
1R
iyad B
ank (
RB
)
2S
audi A
me
rican B
ank
(SA
MB
A)
Saudi B
ritish B
ank (
SA
BB
)
Ara
b N
atio
nal B
ank (
AN
B)
Bank A
l-Jazira (
BJ)
Al-B
ilad B
ank
Saudi In
vestm
ent B
ank (
SIB
)
Banque S
audi F
ransi (B
SF
)
Saudi H
olla
ndi B
ank (
SH
B)
A) Banks use the web for information delivery
Electronic brochure * * * * * * * * * * *
Promotional information * * * * * * * * * * *
Ways to contact the bank * * * * * * * * * * *
Promotion of special offers * * * * * * * * * * *
Report downloads * * * * * * * * * * *
Recruitment forms * * * * * * * *
Hot links to other websites * * * * * * * * * *
Use customising resources * * * * * * * * * * *
Subscription options * * * * * * * * * *
Advertising * * * * * * * * * * *
Discussion groups * * * * * *
B) Banks use the web to improve their relationship with customers
E-mail and e-forms * * * * * *
More advanced support tools * * * *
More advanced technologies * * * * * *
C) Banks use the web as a vehicle for the most common transactions
Opening accounts * * * * * * * * * * *
Requesting products and services * * * *
Investment and credit applications * * * * *
Clients can access their account
details and statements on-line * * * * * * * * * * *
Fund transfer * * * * * *
Bill payments * *
Promoting e-cash as a way to develop
web-based transactions * * * * * *
3The contents and facilities found in the websites of Saudi banks.
1 In 2005, Adam Rombel from Global Finance selected Riyad Bank as the best website design.
2 Saudi American Bank (SAMBA) has been selected by Global Finance as the best
corporate/Institutional and consumer Internet Bank in the Middle East & Africa (Rombel, 2005).
3 Banks listed in capital size and branch number order.
Page 400
384
After joining the WTO, the Saudi government opened the banking and insurance
sector to foreign investors and, indeed, the Saudi banking sector has now been
opened up to national banks from the other GCC member states. With the e-
commerce revolution, some of the foreign banks have already moved into the
Saudi market. What does this mean for banks, customers and the different
governments’ institutions, and what are their roles in marketing IB services?
The SA Government role in adopting e-business is as follows:
1. Planning management and training.
2. Develop the legal framework.
3. Establish and maintain the infrastructure.
4. Provide the access.
5. Develop and maintain the database management.
6. Develop the relevant standards.
SA announced a large scale initiative to equip over 21,000 schools with PC
equipment, networks, internet access and peripherals. A technical committee for e-
commerce was established in 2001 to create a legal framework, improve
infrastructure, and present technical support and training (KACST, 2005). On the
other hand, SAMA has two main roles: establishing the different e-payment systems,
and supervising (monitoring) local banks and bank-customer relations. SAMA
encourages banks to establish IB systems. However, it is essential that risks in such
systems be properly controlled and monitored. The onus of maintaining adequate
systems of control, including those in respect of IB, ultimately lies with the institution
itself (SAMA, 2004). As IB develops, SAMA aims to keep the banks informed of the
best security practice internationally by issuing enhanced versions of this document
to assist in maintaining the safety of OB in the Kingdom. However, it is the banks’
responsibility to maintain effective internal & technical controls in keeping with the
guidelines (SAMA, 2004).
Page 401
385
In 2004, Saudi banks adopted e-banking services mainly for two reasons: first, to face
the challenges of the financial requirements, and second, to gain the benefits of OB.
Most of the Saudi banks adopted the integrated approach whereby they keep their
existing brand name and offer IB services as an extension to their branch, ATM and
telephone-based services (SAMA, 2005). Saudi Banks offering online services may
face challenges of:
Identifying and addressing consumer concerns about transacting online.
Identifying areas of exposure or vulnerability due to insufficient
disclosures.
Building and sustaining the confidence of customers.
Customers’ inexperience.
Persuading customers to accept the impact of secure access technologies.
Carrying the cost of secure access technologies. (SAMA, 2005).
Page 402
386
APPENDIX K
Al Wahda Express
Field Study Acceptance