Calhoun: The NPS Institutional Archive Theses and Dissertations Thesis Collection 1987 An investigation of unipolar arcing at atmospheric pressure in Aluminum 2024 and aluminum coated glass slides. Woodson, Steven Wayne. http://hdl.handle.net/10945/22327
Transcript
Calhoun: The NPS Institutional Archive
Theses and Dissertations Thesis Collection
1987
An investigation of unipolar arcing at atmospheric
pressure in Aluminum 2024 and aluminum coated
glass slides.
Woodson, Steven Wayne.
http://hdl.handle.net/10945/22327
NAVAL POSTGRADUATE SCHOOL
Monterey, California
THESISAN INVESTIGATION OF UNIPOLAR ARCING ATATMOSPHERIC PRESSURE IN ALUMINUM 2024
AND ALUMINUM COATED GLASS SLIDES
by
Steven Wayne Woodson
June 1987
Thesis; Advisor: F. R. Schwirzke
Approved for public release; distribution is unlimited
Approved for public release;distribution is unlimited.
i PERFORMING ORGANISATION REPORT NUM8£R(S) 5 MONITORING ORGANIZATION REPORT NUMBER(S)
6a NAME OF PERFORMING ORGANIZATION
Naval Postgraduate School
6b OFFICE SYMBOL(if aopi'cabie)
61
7a NAME OF MONITORING ORGANIZATION
Naval Postgraduate School
6< AODRESS (City. Stitr. and ZIP Code)
Monterey, California 93943-5000
7b ADDRESS (Cry. Staff. and l\P Code)
Monterey, California 93943-5000
8a NAME OF FUNDING/SPONSORINGORGANIZATION
8b OFFICE SYMBOL(If applicable)
9 PROCUREMENT INSTRUMENT IDENTIFICATION NUMBER
8c AODRESS (Cry, Sfafe and ZIP Code) 10 SOURCE OF FUNDING NUMBERS
PROGRAMELEMENT NO
PROJECTNO
TASKNO
WORK JNlTACCESSION NO
'i T;Tl E (include Security^ Claudication)
AN INVESTIGATION OF UNIPOLAR ARCING AT ATMOSPHERIC PRESSURE IN ALUMINUM20 24 AND ALUMINUM COATED GLASS SLIDES
!»' PERSONAL AUTHOR(S)Woodson, Steven W
• 3d ! >'t OF REPORT
Master's Thesisi 3b T'ME COVEREDFROM TO
U DATE Of REPORT (Year Month Day)
June 19871S PAGE COoNT
53'6 Supplementary notation
COSATi CODES
ElD GROUP subgroup
18 SuBjECT TERMS (Continue on reverie if neceuary and identify by block number)
Unipolar, Unipolar Arcing
9 £8STR_ACT (Continue on reverie if neceuary and identify by block number)
An experimental investigation of unipolar arcing at atmosphericpressure was conducted using Aluminum 2024 and glass slides with a thincoating of pure aluminum. The plasma was produced on the surface usinga neodymium- glass laser in the Q-switched mode. It was found that thepower density required for the onset of unipolar arcing was similar tothat of samples irradiated in a vacuum, although the size and densityof the resulting craters were significantly different.
0 S"R'3UTiON ' AVAILABILITY OF ABSTRACT
KK'NCLASSiFiEDAJNL'MiTED D SAME AS RPT D DTiC USERS
21 ABSTRACT SECURITY CLASSIFICATION
UNCLASSIFIED22a NAME OF RESPONSIBLE INDIVIDUAL
F. R. S chwir zke22b TELEPHONE (include Area Code)
646-263522c OFFICE SYMBOL
51SwDO FORM 1473. 84 mar 83 APR edition may be uted until e«hautted
All other edition* art obioletesecurity classification of t h .s page
UNCLASSIFIED
Approved for public release; distribution is unlimited
An Investigation of Unipolar Arcing atAtmospheric Pressure in Aluminum 2024
and Aluminum Coated Glass Slides
by
Steven Wayne WoodsonLieutenant, United States Navy
B.O.E., University of Mississippi, 1979
Submitted in partial fulfillment of therequirements for the degree of
MASTER OF SCIENCE IN PHYSICS
from the
NAVAL POSTGRADUATE SCHOOLJune 1987
ABSTRACT
An experimental investigation of unipolar arcing at
atmospheric pressure was conducted using Aluminum 2024 and
glass slides with a thin coating of pure aluminum. The
plasma was produced on the surface using a neody mium-g las
s
laser in the Q-switched mode. It was found that the power
density required for the onset of unipolar arcing was similar
to that of samples irradiated in a vacuum, although the size
and density of the resulting craters were significantly
different .
»
TABLE OF CONTENTS
I. INTRODUCTION 6
II. BACKGROUND AND THEORY OF UNIPOLARARCING MODELS 10
A. ROBSON-THONEMANN MODEL 10
B. TAYLOR-SCHWIRZKE MODEL 13
III. EXPERIMENTAL DESIGN AND PROCEDURES 20
A. EXPERIMENTAL DESIGN 20
B. EQUIPMENT 21
1. Laser 21
2. Optical Microscope 23
3. Scanning Electron Microscope 23
4. Target Test Chamber 23
C. TARGET PREPARATION 24
1. Aluminum Coated Microscope Slides 24
2. Aluminum Targets 25
IV. EXPERIMENTAL RESULTS 26
A. TYPE 2024 ALUMINUM TARGETS 26
1. Description 26
2. Target Damage 26
3. Determination of Power Density Requiredfor the Onset of Unipolar Arcing 30
a. Experimental Results 30
b. Analysis of Results 31
c. Discussion of Results 35
B. ALUMINUM COATED GLASS SLIDES 37
1. Description 37
2. Target Damage 38
V. CONCLUSIONS 48
LIST OF REFERENCES 50
INITIAL DISTRIBUTION LIST 52
I. INTRODUCTION
One of the most active areas of research that the
scientific community is currently engaged in is that of power
production. Fusion energy sources in particular have
received great emphasis. In most fusion reactor design
studies, the plasma is confined by strong magnetic fields.
Some of the plasma will, however, diffuse perpendicular to
the field lines and come into contact with the surrounding
walls. This has led to extensive studies involving the
interaction of a hot dense plasma with a surface. These
studies have revealed that erosion due to several processes
occurs. These processes include sputtering, unipolar arcing,
pulse heating, and gas implantation [Ref. 1].
The process involved in sputtering is a momentum transfer
process. When an energetic neutral atom or ion hits the
solid surface it imparts its energy to a surface atom, and if
this energy exceeds its binding energy, the particle can be
released into the plasma [Ref. 2], Heat pulses are a result
of nonuniform energy deposition onto the wall from the plasma
and may lead to localized evaporation and surface cracking.
Gas implantation results when high energy hydrogen or helium
plasma ions impact on the first wall. The ones that are not
directly backscattered come to rest in the wall, generally at
an interstitial site [Ref. 1], Unipolar arcing is a process
where an arc is established between the wall and the plasma
with the wall acting as both the anode and cathode.
These erosion processes lead to two major areas of
concern. The first is that various components of the reactor
will be damaged, resulting in a limited lifetime. The
second, and perhaps more significant, is that these erosion
processes introduce impurities into the plasma, and these
impurities limit the available plasma parameters [Ref. 1: p.
1047]. In an article by T. Taxima, he states that "the major
energy losses from the present day's tokamak plasmas are
those to impurities" [Ref. 3],
Evidence of unipolar arcing (i.e. arc tracks) has been
observed in DITE, as well as PLT, ISX, Macrator and Pulsator
Tokamaks [Ref. 4], The arc tracks appear on the fixed
limiter, probes inserted in the plasma and on parts of the
torus vacuum structure. A study on impurity levels and
erosion rates showed that unipolar arcing is the dominant
mechanism for impurity production [Ref. 5]. This is due to
the fact that unipolar arcing is not a homogeneous energy
deposition process, but rather one whereby the energy from
the plasma is concentrated towards the cathode spots [Ref.
6].
Plasma surface interactions are also important in newly
evolving areas of technology. For example, weapon system
designs for both high energy lasers and particle beams
include high speed plasma switches. The contacts on the
switches will operate in a plasma environment and will be
subject to these erosion processes. Also, in high energy-
laser weapons a plasma could be formed at the target which
will result in surface damage. It is not known how severe
this plasma surface damage will be compared to other damage
mechanisms, but conceivably it could be significant.
Although unipolar arcing was first observed in the late
1950's, other problems dominated the fusion program and
interest in arcing diminished. It was not until the late
1970's that interest in unipolar arcing was revived, and
since that time it has been an area receiving much study,
although the process is still not fully understood. For this
thesis, experimentation was done to observe plasma-surface
damage which occurs at atmospheric pressure on a good
conducting material (type 2024 Aluminum) and on a poor
conductor (a glass slide) that was coated with a thin film of
aluminum
.
The specific goals of this thesis were twofold. The
first was to conduct a systematic experimental study to
observe unipolar arcing at atmospheric pressure, determine
the power density required for the onset of arcing (on type
2024 Aluminum targets) and compare the observed results to
those previously reported. Secondly, it was a goal to try to
8
photograph the arcing events as they were occurring. For
this, the aluminum coated glass slides were used with a
camera placed behind the targets.
The following section deals with the theory of the
unipolar arcing phenomenon and gives details of the
underlying model on unipolar arcing.
II. BACKGROUND AND THEORY OF UNIPOLAR ARCING MODELS
A. ROBSON-THONEMANN MODEL
In 1958 Robson and Thonemann proposed the first model of
an arcing phenomenon which "requires only one electrode and
is maintained by the thermal energy of the plasma electrons"
[Ref. 7], They called this phenomenon "unipolar arcing."
Two experiments were also conducted which verified their
theory. In these, a strong plasma was generated by an
electrodeless high-frequency discharge in a mercury cathode
tube which was evacuated to a gas pressure of less than 10
mm Hg. An arc was then established by an externally applied
anode voltage. As the plasma density increased, the arc
current increased. The externally applied voltage was then
turned off, but the arc continued to burn in the unipolar
mode until the plasma density became too low to sustain it.
The basis of their theory lies in the idea that a
floating potential is established between a plasma and the
exposed metal plate. Within a plasma, the ion temperature
(T^) does not necessarily equal the electron temperature
(T e ). The electrons will have a much higher thermal velocity
than will the ions due to their relatively small mass. When
in the vicinity of a wall, many more electrons will initially
contact the wall, resulting in a negative potential relative
to the plasma. (One of the defining conditions for the
10
existence of a plasma is that it is "a quasineutral gas of
charged and neutral particles" [Ref. 8], The idea behind
quas ineu t r al i t y is that if the plasma dimensions are large
compared to a characteristic length called the Debye Length,
then it will shield itself from electric potentials (or
electric fields) in a distance on the order of the Debye
Length. This results in the formation of a potential sheath
(Fig. 2.1) which prevents all but the most energetic of the
electrons to reach the wall while at the same time it
functions to accelerate the ions within the sheath. The
plasma potential will build up to the point where the ion
loss level is equal to the electron loss level, thus
maintaining an equilibrium situation where the net current is
zero. For singly charged ions the sheath potential is given
by
:
vf
-kT M.
e £n1
2e 2ttM(Eqn. 2.1)
where
k = Boltzmann Constant
e
T e
M e
M,
= charge of the electron
= electron temperature
= electron mass
= ion mass
11
If the value of this floating potential exceeds a certain
value, an arc will be initiated and sustained on the isolated
plate. If a cathode spot is initiated on the plate, there
will be a strong local emission of electrons from it. This
results in a reduction in the floating potential to the value
of v c - More electrons can then reach the plate, closing the
current loop and maintaining the plasma's q uasi neut r al i t y
.
This circulating current is given by {Ref. 9 ]
:
I = AnkT
%
M"C
(-eV ) (-eVf )
exp -exp ^r—r[ (kT )
UV (Eqn 2.2)
where
n = electron plasma density
A = area of the exposed plate
In order to maintain a stable cathode spot, there is a
lower limit for I c « Above this value the arc will be
maintained, and below it, it will not. This critical value
of current is dependent on the material of the plate and is
on the order of 10 Amperes.
12
sheat h
v=o
M3plasma
v = vL sheath
Figure 2.1 Plasma-Wall Potential Sheath.
This model is widely referenced in many papers dealing
with unipolar arcing and is generally accepted to explain the
basic process of unipolar arcing. However, this model does
not address many of the specifics of what is happening, and
in order to gain a better understanding of this phenomenon, a
more detailed model must be examined.
B. TAYLOR-SCHWIRZKE MODEL
An expanded version of the unipolar arcing phenomenon was
introduced in 1980 by Schwirzke and Taylor [Ref. 10]. This
13
model expands on the basic ideas presented in the Thonemann
model by elaborating "upon the electric fields which are set
up in the plasma and drive the arc" [Ref. 11].
As discussed previously, a sheath potential is
established between the plasma and the surface (as given by
Equation 2.1). The length (perpendicular to the surface)
over which this potential exists is proportional to the Debye
Shielding Length (A^) which is given by:
Xd
= (W /4^aV (Eqn. 2.3)
In order for an arc to develop, Vf must increase sufficiently
for an arc to ignite and be sustained. Another necessry
condition, they argue, is that the density of ions above the
cathode spot increases in order for a larger electron current
to flow from the surface into the plasma (this is different
from the previously discussed model in that it implies a
constant plasma density). This increase is due to the
ionization of neutral particles being released from the
cathode spot (Fig. 2.2). Cathode spots can initiate from
surface protrusions, inclusions, micro-whiskers, or other
metallurgical inhomogeneities.
This idea (of where the cathode spot begins) is
consistent with a study done by Tien, Panayotou, Stevenson,
and Gross on different materials which had been prepared
14
similarly, but upon which some samples were slightly etched
to expose their characteristic grain structure. They found
that the etched samples had evidence of a higher area
neutrals AJf
onization
wall
Figure 2.2 Schwirzke-Taylor Unipolar Arc Model.
coverage of arcing than did the polished samples. They also
reported that "the locations of the arc spots are not random
in the slightly etched samples." They continue by saying,
"It is interesting that, on the polished specimens, ..., arc
spots are more randomly distributed." One of their main
conclusions is that the cathode spots are preferentially
water and then with methyl alcohol. They were then coated
with a thin film of pure (99.99%) aluminum. The deposition
of aluminum on the slide surface was accomplished by an
evaporation process under high vacuum using a Veeco Series
401 system. The slides were then stored in a desicator until
ready for use, at which point any surface dust was removed by
using high pressure freon gas.
The thickness of the aluminum coatings was
approximated by comparing the mass of the slide before and
after depositing the aluminum coating. This assumes a
uniform thickness of aluminum on the coated area.
24
2 . Aluminum Targets
The disk targets were made of type 2024 aluminum.
They were machined on a lathe to a final diameter of
approximately 1/4 inch. The samples were mounted in bakelite
and rough sanded. They were then polished using an AB Duo
Belt Wet Sander (400 grit) and fine ground using 600 grit wet
paper. Following this, they were dry sanded and polished
using three (3) slurries of .05 AI2O3 to reduce surface
roughness
.
The specimens were then removed from the bakelite,
cleaned with methyl alcohol and ul
t
rasonical 1 y cleaned in
acetone. They were then stored in a desicator until ready
for use in the target chamber.
25
IV. EXPERIMENTAL RESULTS
A. TYPE 2024 ALUMINUM TARGETS
1
.
Description
Numerous highly polished Aluminum 2024 targets were
irradiated in the target chamber at atmospheric pressure.
The power density was varied by the use of transmission
filters and the energy was measured with the energy meter.
The beam spot size was controlled by using a glass lens and
was measured by irradiating an exposed Polaroid film at the
target plane and then measuring the diameter of the spot.
Using an oscilloscope, the 3 db pulse width was found to be
20 nanoseconds. A hand held Polaroid camera was positioned
above the targets to note any plasma formation.
2
.
Target Damage
After being exposed to the laser radiation each
sample was observed using an optical and scanning electron
microscope. Target damage was in the form of unipolar arcing
and surface melting. Figure 4.1 shows target damage in the
region of maximum irradiation. In all of the field of view
with the exception of the right central portion it is evident
that melting has occurred. At greater magnification, Figure
4.2 shows the boundary region of melting. The plasma flow
direction away from the focal spot in the figure is from top
26
/" -"<"•
*•„,*
-*•*** ^*
Vf*
^*
^
Figure 4 .
1
»<«• y*vl^
High Irradiance Region ofAluminum Target, 220X, SEM
Figure 4 .
2
Boundary Region for Meltingon Aluminum Target, 1200X, SEM
27
to bottom. The small holes around which the flow was
diverted are the craters where, simultaneously, unipolar
arcing was occurring. Outside of the region of the melting,
unipolar arcing was the only visible damage mechanism as
evidenced by the characteristic crater and rim formation.
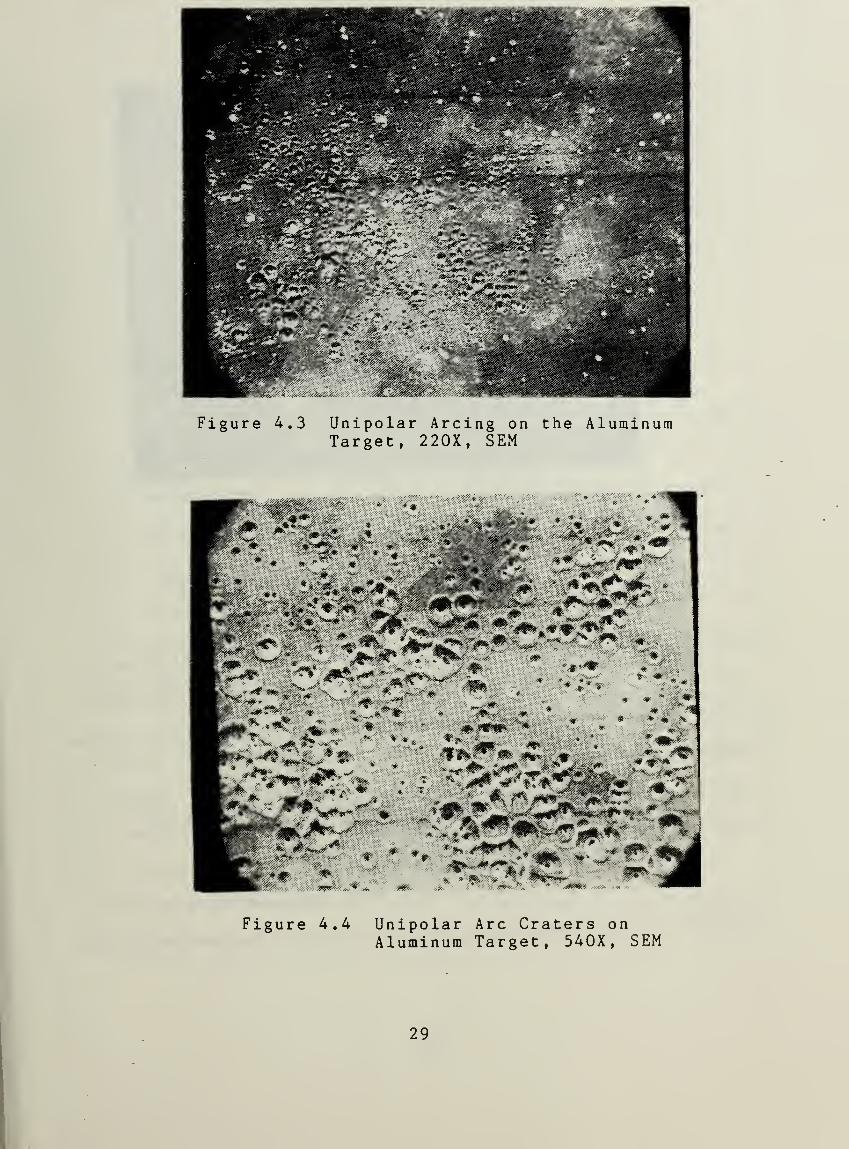
At lower energy densities the only observable damage
mechanism was unipolar arcing. Figure 4.3, at 220X
magnification, using the scanning electron microscope, shows
the region of maximum intensity on a sample irradiated at an
order of magnitude less energy density than the preceding
figures where melting was evident. The unipolar arc craters
are not evenly distributed, but are bunched in locally
concentrated areas. This is partially due to hot spots in
the laser beam but also may be a result of surface
inhomogenei t ies where arcing is initiated (such as surface
inhomogenei t ies like whiskers or at grain boundaries). At
high magnification, Figure 4.4 clearly shows the unipolar arc
craters. The crater density is on the order of 1.7 X 10
craters per square centimeter.
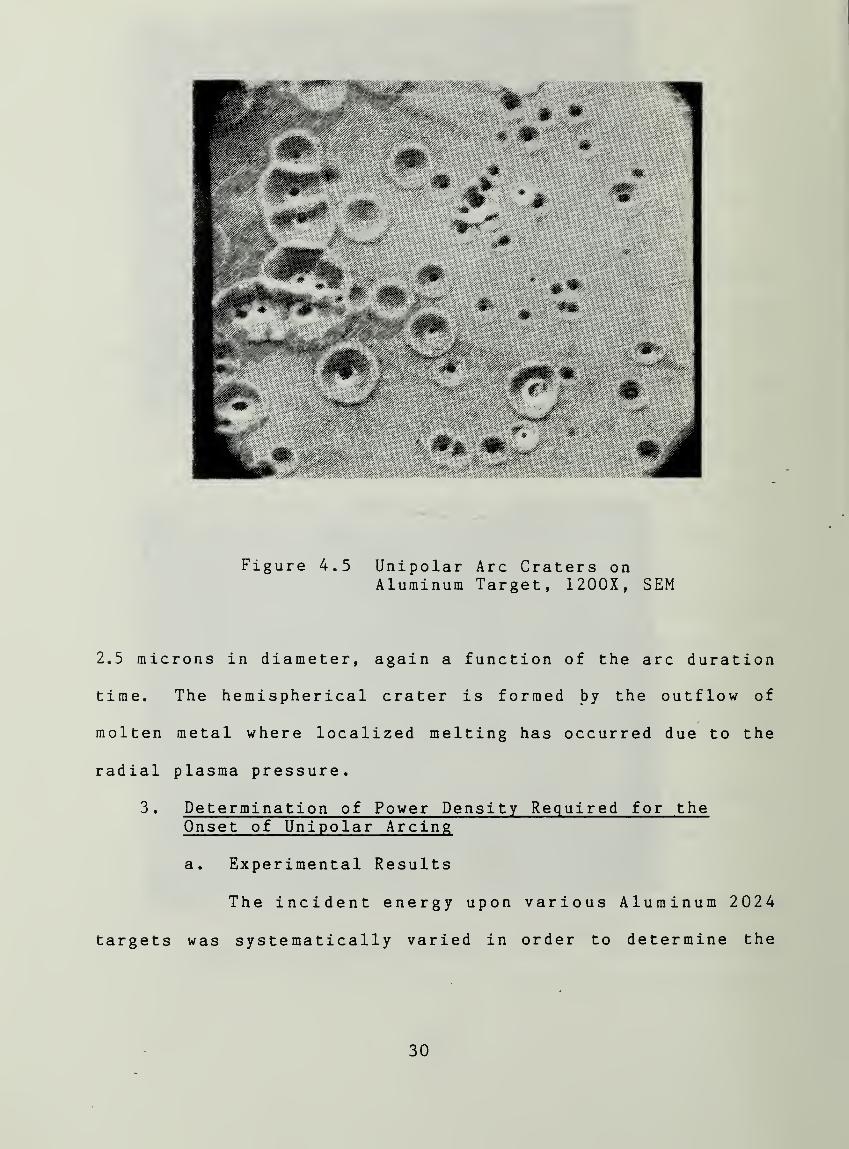
Further analysis from Figure 4.5 at higher
magnification shows a distinctive view of the unipolar arc
craters. The craters with the largest diameter, 12 to 13
microns, correspond to a long arc duration as compared to the
ones with small diameters, 3 to 4 microns. The central dark
regions are the cathode spots and range from .08 microns to
28
Figure 4.3 Unipolar Arcing on the AluminumTarget, 220X, SEM
v.;.; \;
. v ^ :. * 4-
Figure 4.4 Unipolar Arc Craters onAluminum Target, 540X, SEM
29
m
,:<:';:;
Figure 4.5 Unipolar Arc Craters onAluminum Target, 1200X, SEM
2.5 microns in diameter, again a function of the arc duration
time. The hemispherical crater is formed by the outflow of
molten metal where localized melting has occurred due to the
radial plasma pressure.
3 . Determination of Power Density Required for theOnset of Unipolar Arcing
a. Experimental Results
The incident energy upon various Aluminum 2024
targets was systematically varied in order to determine the
30
minimum power density required for unipolar arcing to occur.
Average power density, F, can be calculated by:
F = E/AT
where E = Incident Energy
A = Exposed Area
T = 3 db pulse width
A summary of results is contained in Table I.
b. Analysis of Results
From these results an indication of the onset of
arcing can be determined although there are some
inconsistencies in the data. Targets la and 2 showed no
evidence of arcing while targets 8 and 12 had arcing damage
even though the calculated value for power density was lower.
It is important to note that targets la through 5 were
irradiated on the same day and that targets 6 through 13 were
irradiated approximately three days later.
From the first group (la through 5) it can be
stated that the onset of arcing occurs between 13.1 and 20.3
o
MW/cm • The second group (6 through 13) indicates a region
2of between 6.8 and 9.7 MW/cm . Although these values differ,
the data obtained in each group is self consistent.
There are at least three possible explanations
for the inconsistencies in the data. These are:
31
TABLE I. SUMMARY OF RESULTS TO DETERMINE THE ONSET OFARCING FOR ALUMINUM 2024 AT ATMOSPHERIC PRESSURE
Calculated PowerTarget Density (MW/CM 2
) Light Arcing
la 13.1 no no
lb 103.0 yes yes
2 12.6 no no
3 26.4 yes yes
4 20.3 yes yes
5 19.4 no no
6 31.7 yes yes
7 21.2 yes yes
8 9.7 no yes
9 101.0 yes yes
10 17.6 no yes
11 29.0 yes yes
12 10.6 no yes
13 6.8 no no
32
(1) The targets were somehow different (due to formationof aluminum oxide with time).
(2) The diagnostic instrumentation was different.
(3) The laser mode was different.
Any one of the above or a combination of the
above could have caused the results to differ from one
another .
All of the above targets were identically
prepared and stored in a desicator until their use. It is
conceivable, however, that between the time the first and
second groups were irradiated the surface of the targets
changed due to absorption of moisture or to surface oxidation
or contamination. A change in the surface characteristics
could have caused a different point for the onset of arcing.
The hardware and experimental setup on the two
days in question was identical. It was noted, however, that
the energy meter had regions of deterioration on the detector
surface. Although care was taken on both days to avoid those
regions, it is possible that alignment on one of the days was
such that enough energy was incident on those regions to
account for the change in indicated energy.
The next possible cause is the output mode of the
laser. As previously stated, the intensity distribution of
the output beam is not gaussian or flat top in shape. The
high intensity region of the beam is a crescent shaped
33
portion in the lower part of the mode (as determined by-
actual target damage regions). The performance of the laser
is temperature sensitive. Between the two runs the
atmospheric conditions could have changed sufficiently to
cause a slightly different spatial intensity distribution
yielding a different peak to average ratio and causing
inconsistent results.
In a previous experiment at the Naval
Postgraduate School, Beelby and Ulrich III discovered a
similar inconsistency. They had done experimentation to
determine the onset of arcing in a vacuum for various types
of materials. It was determined that the onset of arcing for
type 304 stainless steel was between 5.1 and 5.4 Mw/ cm •
However, while determining the onset of arcing for aluminum
2024 a sample of this type of stainless steel was irradiated
and no plasma or arcing was present at 10.9 MW/ cm . [Ref.9]
In addition to the above explanations for the
inconsistency in the data there are also measurement errors.
The first, and possibly most significant, is the fact that in
calculating power density for the onset of arcing, a uniform
spatial intensity distribution is assumed. This is certainly
not the case and in making this assumption large errors may
result. Furthermore, the calculation also assumes that the
temporal content of the beam is a step function, which is
also not the case.
34
A second source of error results from measuring
spot size. The spot size seen using the exposed Polaroid
film has an average diameter on the order of ,75cm. The
response of the film to irradiation is not known exactly and
the spot is slightly elliptical in shape. Assuming the
measurement accuracy is 0.1 cm, a 3% error would result.
Another assumption in calculating the power density was that
each optical surface reflected 4% of the incident energy.
The actual amount of reflected energy could not be measured.
However, since the power meter was indirectly irradiated by
the reflection from one of the optics, a slight error in the
reflectivity could lead to relatively large measurement
errors. Finally, the Energy Meter was calibrated to an
accuracy of only 20%.
In lieu of these error sources, calculated power
densities can only be assumed to be accurate to an order of
magnitude
.
c. Discussion of Results
Previous studies of unipolar arcing have been
conducted at the Naval Postgraduate School. The equipment
and experimental setup in these studies were, for the most
part, identical to those used for this thesis. In
particular, the laser (with its ancillary equipment), target
chamber, optics, and power meter were identical. The
35
variable of concern in this experiment was ambient pressure.
Previous work has involved placing the samples in the target
chamber, evacuating the chamber and then irradiating the
targets. For this experiment the target chamber was allowed
to remain at atmospheric pressure. This section will discuss
and compare results from previous work with that done for
this thesis.
The damage mechanisms seen in this experiment
were similar to those previously reported. Samples were
observed to have evidence of melting and unipolar arcing. As
the power density was decreased, unipolar arcing was the only
damage mechanism present.
Samples irradiated at atmospheric pressure had
the characteristic hemispherical shaped craters associated
with unipolar arcing. The density of craters found at
atmospheric pressure (1.7 X 10" craters per square
centimeter) is an order of magnitude larger than previously
reported values (3.0 X 10-> craters per square centimeter)
[Ref. 9]. There was also a difference found in the size of
the crater rims. At atmospheric pressure the largest single
craters found were approximately 13 microns in diameter while
in a vacuum the longest burning arcs left craters up to 30-40
microns in diameter. The cathode spots were similar in size
and nature .
36
The onset of arcing at atmospheric pressure for
oAluminum 2024 was found to be between 6.8 and 20.3 MW/cm^ .
In previous work done at the Naval Postgraduate School,
Beelby and Ulrich III reported the onset of arcing for
Aluminum 2024 in a vacuum to be between 4.6 and 11.2 MW/cm^
.
Because of the accuracies of both of these measurements, the
only conclusion which can be made is that the onset of arcing
at atmospheric pressure occurs close to that of a target in a
vacuum. That is, there does not appear to be a strong
dependency on surrounding pressure.
B. ALUMINUM COATED GLASS SLIDES
1 . Description
Numerous shots were made on the aluminum coated glass
microscope slides. They were positioned outside of the
target test chamber such that the incident beam made an angle
of about 10 degrees relative to the surface normal. A narrow
band filter ( 1 . 6Pm ) was placed immediately behind the coated
slide and then a Polaroid camera was positioned to photograph
the backside of the microscope slide. After the targets were
irradiated, they were examined using an optical and scanning
electron microscope (SEM).
Examining the damage using the SEM proved difficult
due to the lack of conductivity of the surface of the target.
(The SEM requires an electrically conductive surface in order
37
to function properly.) In the figures produced by the SEM,
the horizontal light colored bands are a result of the poor
conductivity .
2 . Target Damage
After being irradiated, all of the targets had areas
where the aluminum coating had been removed from the surface.
The bright streaks in Figure 4.6 are the paths of molten
aluminum particles occurring during the time the laser beam
was incident on the target. The bright portion is indicative
of a plasma being present. In Figure 4.7 a 90% attenuating
broad band filter was placed before the camera. Again, the
bright portion is evidence that a plasma was present and the
crescent shape is where the aluminum was removed,
corresponding to the high intensity portion of the beam. In
the less intense regions of the beam the aluminum coating was
not removed.
Within the high intensity region there were brown
colored elliptical shaped areas of even higher intensity.
Figure 4.8 shows a portion of the cresent shaped high damage
region and Figures 4.9 and 4.10 show extremely high intensity
regions. Figure 4.11 is a magnified view of Figure 4.10.
From this it can be seen that there are small circular areas
of damage (top central region and the region in the center of
38
Figure 4.6 Polaroid Photograph of AluminumCovered Glass Slide
Figure A .
7
Same as above with a
Attenuating Filter90%
39
Figure 4 .
8
High Intensity Region of AluminumCovered Glass Slide, 15X, SEM
Figure 4.9 Hot Spot within High Intensity Region ofAluminum Covered Glass Slide, 75X, SEM
40
::
Figure 4.10 Hot Spot within High Intensity Region ofAluminum Covered Glass Slide, 50XOptical Microscope
Figure 4.11 Hot Spot within High Intensity Regionof Aluminum Covered Glass Slide, 100X,Optical Microscope
41
the photograph). Figure 4.12 is a magnified view of one of
these regions. At 400X magnification on the optical
microscope, Figure 4.13 shows that these areas are concentric
rings. This interference pattern is seen frequently when
studying unipolar arcing. The rings are a result of
interference fringes from the laser and typically the high
intensity bands have many unipolar arc craters while the low
intensity regions have few or none. In this figure it is
difficult to determine decisively if the unipolar arc craters
are present, although in the central region where focus in
the figure is the sharpest it appears that they are
craterlike structures. The diameter of the crater is
approximately 7.5 micrometers, corresponding to what would be
expected if they were craters from unipolar arcing. Although
clearly visible using an optical microscope, these regions
did not appear using the scanning electron microscope.
A feature that was evident in the "hot spots" within
the high intensity regions, using the scanning electron
microscope, was barnacle appearing structures. The
structures are shown in increasing magnification in Figures
4.14 through 4.16. The cores or "holes" in the center of the
barnacles have diameters ranging from 0.3 to 1.9 microns, but
are probably not unipolar arcs as they do not have the
characteristic rims surrounding the cores. Similar
structures have been observed previously with the conclusion
42
'^mMddi^ #'
Mi
-^p?^>^#y w^ry/' - 2'-i;^»^ig^%Figure 4.12 Magnified View of Figure 4.
200X, Optical Microscope11.
Figure 4.13 Concentric Rings Occurring in Hot Spotson Aluminum Coated Glass Slides, 400X
,
Optical Microscope
43
Figure 4.14 Barnacle-like Structures Appearingin Hot Spots, 760X, SEM
Figure 4.15 Same as above, 1500X, SEM
44
Figure 4.16 Barnacle-like Structures Appearingin Hot Spots, 7500X, SEM
Figure 4.17 Boundary of Hot Spot Region, 760X, SEM
45
that since the samples were not outgassed, the barnacles may
be a result of "expanding cavities" or "blisters" of trapped
hydrogen due to the flash heating by the laser [Ref. 9].
Surface tension acting on the liquid metal can also
contribute to the formation of the barnacle structures.
At the boundary of the "hot spots" the barnacles are
no longer present and the surface becomes much smoother (see
Figure 4.17). In this region there is no evidence of
unipolar arcing.
In the lower intensity region, Figure 4.18 shows what
appear to be craterlike formations. The diameters of these
craters are .5 to 1.5 microns. These structures are likely
to be unipolar arc craters with the rims not visible due to
poor conductivity of the glass slide under the SEM.
46
Figure 4.18 Craters in Low Intensity Region ofAluminum Covered Glass, 1500X, SEM
47
V. CONCLUSIONS
The study undertaken in this thesis examined the unipolar
arcing phenomenon at atmospheric pressure. On the aluminum
targets it was found that anytime there was a plasma present,
unipolar arcing occurred. The power density required for the
onset of arcing at atmospheric pressure was found to be
similar to that in a vacuum, although the crater density was
found to be an order of magnitude higher, while the size of
the resulting craters was more than a factor of 2 smaller.
This suggests that although the power density required to
initiate arcing was similar at atmospheric pressure, more arc
initiation sites are present. Consequently, in order to
maintain a balance they burn less intensely.
The extremely high intensity regions on the aluminum
coated glass slides when viewed under the SEM showed no
evidence of unipolar arcing, but arc craters in these regions
may have been obscured by the appearance of the barnacle-like
structures. Using the optical microscope, these high
intensity regions showed interference rings and craterlike
structures which possibly were formed by unipolar arcing. In
the regions of less intense radiation the barnacles were no
longer seen and craters resembling those from unipolar arcing
were apparent
.
48
A previous study had suggested that the use of better
vacuum systems would result in minimizing damage from
unipolar arcing. This study suggests that while the number
of arc sites may be minimized, the sites that did initiate
and sustain an arc would burn more violently. The number of
damaged spots from unipolar arcing would be fewer but the
damage to the surface in these regions would be more drastic.
49
LIST OF REFERENCES
1. Behrisch, R., "Surface Erosion from Plasma MaterialsInteraction," Journal of Nuclear Materials
, v. 85-86, p.1047-1061, 1979.
2. Keville, M. T. and Lautrup, R. W., "An Investigation ofUnipolar Arcing Damage on Stainless Steel and TitaniumCarbide Coated Surfaces," M.S. Thesis, NavalPostgraduate School, Monterey, California, 1980.
3. Tazima, T., "First Wall Design Considerations of JT-60and Related Experiments," Journal of Nuclear Materials ,
v. 76-77, p. 594-599, 1978.
4. Ryan, F. T. and Shedd, S. T., "A Study of the UnipolarArcing Damage Mechanism on Selected Conductors andSemiconductors," M.S. Thesis, Naval Postgraduate School,Monterey, California, June 1981.
5. Goodall, D.H.J. , Conlon, T. W., Sofield, C. andMcCraken, G. M. "Investigations of Arcing in the DITETokamak," Journal of Nuclear M aterials , v . 7 6-77, p
.
492-498, 1978.
6. Schwirzke, F., "Basic Mechanisms that Lead to LaserTarget Damage," Naval Postgraduate School Paper, Oct1981.
7.
8.
9.
Robson, A. E. and Thonemann, P. C, "An Arc Maintainedon An Isolated Metal Plate Exposed to A Plasma,"Institute of Electrical Engineers , v. 106, pt. A, supp.2, p. 508-512, April 1959.
a nd Controlled1984.
Chen, F., Introduction to Plasma Physics a
Fusion , v. 1, Plenum Press, New York, N.Y.,
Beelby, M. H. and Ulrich III, H. C, "A Study of theBreakdown Mechanism of AISI 304 Stainless Steel, Type2024 Aluminum and Various Titanium Coatings," M.S.Thesis, Naval Postgraduate School, Monterey, California,1981.
10. Schwirzke, F. and Taylor, R. J., "Surface Damage bySheath Effects and Unipolar Arcs," Journal of NuclearMaterials , v. 93-94, p. 780-784, 1980.
50
11. Schwirzke, F., "Laser Induced Unipolar Arcing," LaserInteraction and Related Plasma Phenomena
,v. 6, 1984.
12. Tien, J. K., Panayotou, N. F., Stevenson, R. D., andGross, R. A., "Unipolar Arc Damage of Materials in a