S1
An NIR-Emitting Lysosome-Targeting Probe with Large Stokes’ Shift via Coupling Cyanine and
Excited-State Intramolecular Proton Transfer
Dipendra Dahal,a Lucas McDonald,a Xiaoman Bi,a Chathura Abeywickrama,a Farai Gombedza,a
Michael Konopka,a Sailaja Paruchuri,a Yi Panga*
a Department of Chemistry, University of Akron, Akron, Ohio 44325, USA.
Materials. 2-Hydroxy-5-methylbenzaldehyde (98%) was purchased from Ark Farm. 2-
Methylbenzo[d]thiazole (98%) and ethyl iodide were purchased from Alfa Aesar. 2-
aminothiophenol (90%) was purchased from Aldrich chemical. Hexamethylenetetramine (99%)
was purchased from Acros Organics. And methanol, trifluoroacetic acid and pyridine (all in
analytical grade) were purchased from Fisher Scientific. Lyso-Tracker red DND-99 was
purchased from ThermoFisher Scientific. All chemicals and reagents were used as received
unless otherwise stated. Starting materials 2-(Benzo[d]thiazol-2-yl)-4-methylphenol (2) 1 and 4-
(2-benzothiazolyl)phenol2 was synthesized by using literature procedures.
Spectroscopic Measurements. NMR spectra were collected on a Varian 300 Gemini
spectrometer. Mass spectrometric data were obtained on a HP1100LC/MSD mass spectrometry.
HRMS data were performed on an ESI-TOF MS system (Waters, Milford, MA). UV-Vis spectra
were acquired on a Hewlett-Packard 8453 diode-array spectrometer. Fluorescence spectra were
obtained on a HORIBA Jobin Yvon NanoLog spectrometer.
1. Experimental Details for Chemical Synthesis
Electronic Supplementary Material (ESI) for Chemical Communications.This journal is © The Royal Society of Chemistry 2017
S2
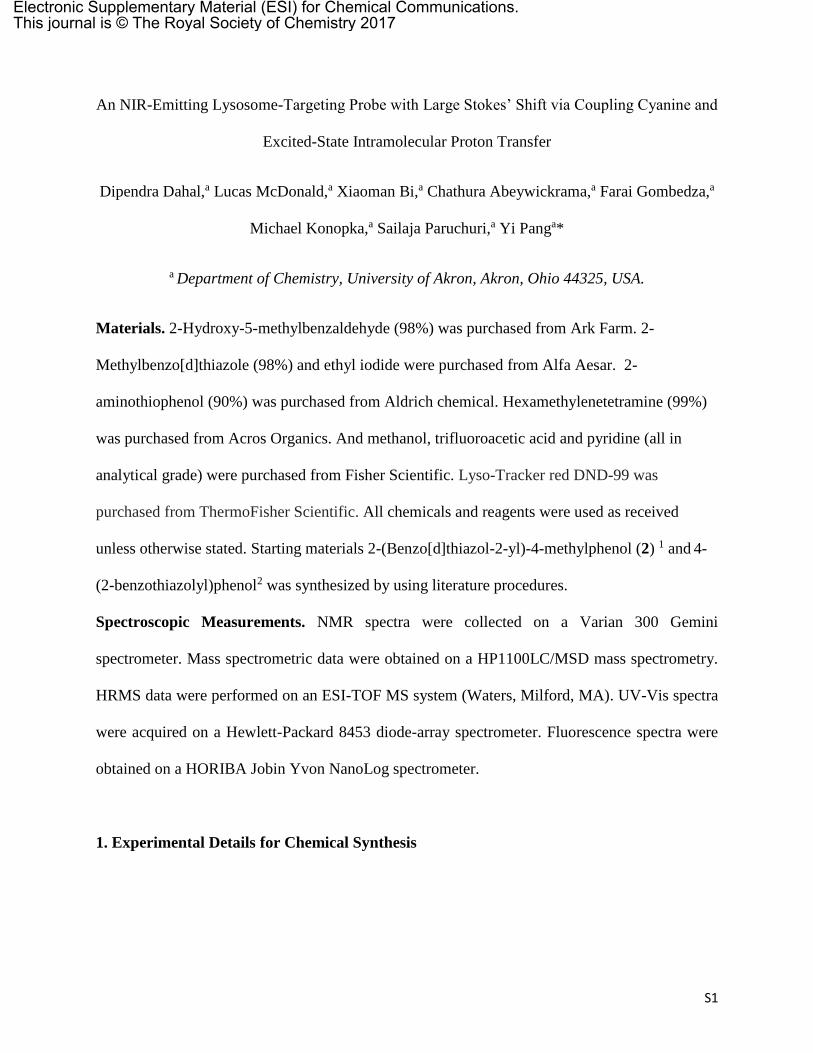
Scheme S1: Synthesis of compound 1.
Synthesis of 3-(benzo[d]thiazol-2-yl)-2-hydroxy-5-methyl- benzaldehyde (4). To a round-
bottomed flask was added compound 2 (0.455 g, 1.7 mmol), hexamethylenetetramine (0.546 g,
3.9 mmol), and trifluoroacetic acid (15 mL). The mixture was refluxed overnight. After the
mixture was cooling down, the acid was neutralized with KOH solution. The precipitate was
collected by filtration, and washed with water for several times. After drying under vacuum, 4
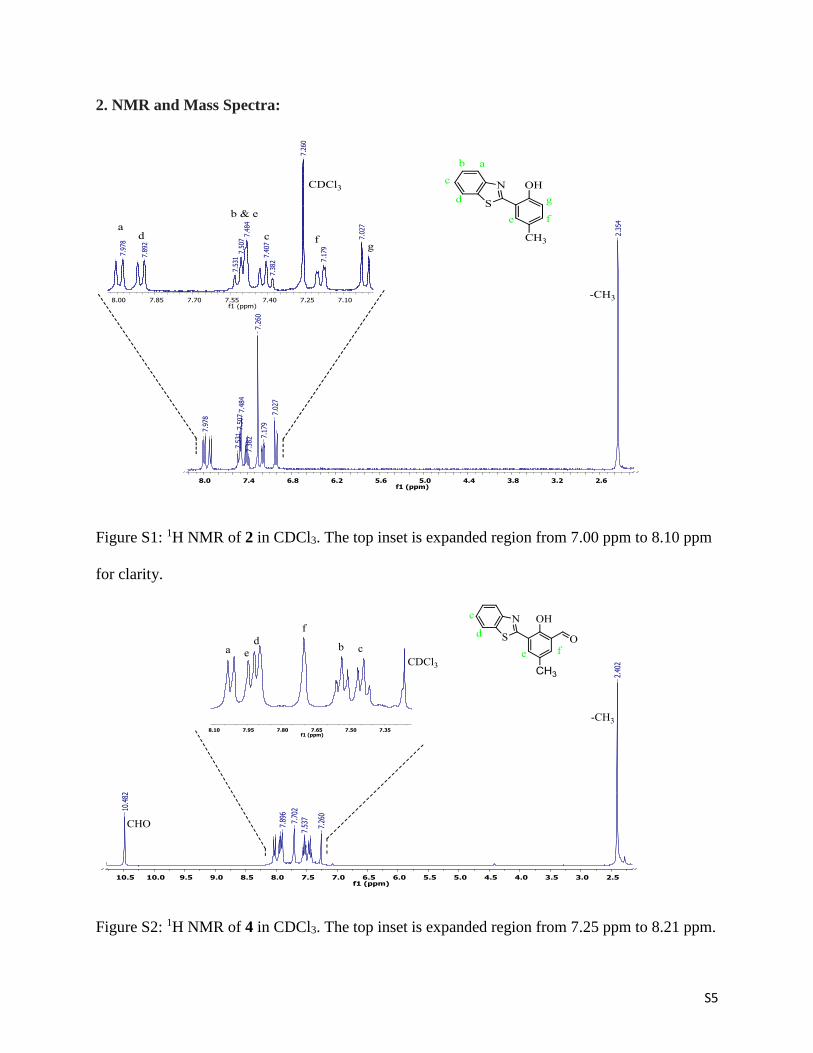
was obtained in 100% yield, and had the following spectral properties. 1H NMR (in CDCl3):
10.46 (s, 1H), 8.01 (d, 1H), 7.90 (t, 2H), 7.68 (s, 1H), 7.53 (t, 1H), 7.44 (t, 1H), 7.26
(s, CDCl3), 2.40 (s, 3H).
Synthesis of compound 2-[3-(benzo[d]thiazol-2-yl)-2-hydroxy-5-methylstyr-yl]-3-
ehtylbenzo[d]thiazol-3-ium iodide (1). To the methanol solution (20 mL) of 5 (298 mg, 0.976
mmol) was added compound 4 (300 mg, 1.118 mmol) and pyridine (0.5mL). The resulting mixture
was heated to reflux overnight. After removing the solvent on a rotary evaporator, the solid residue
was collected by filtration, washed with ethyl acetate (50 mL), and dried under vacuum to give
brown solid product 1 in 85% yield (melting point 2390C -2400C). The product had the following
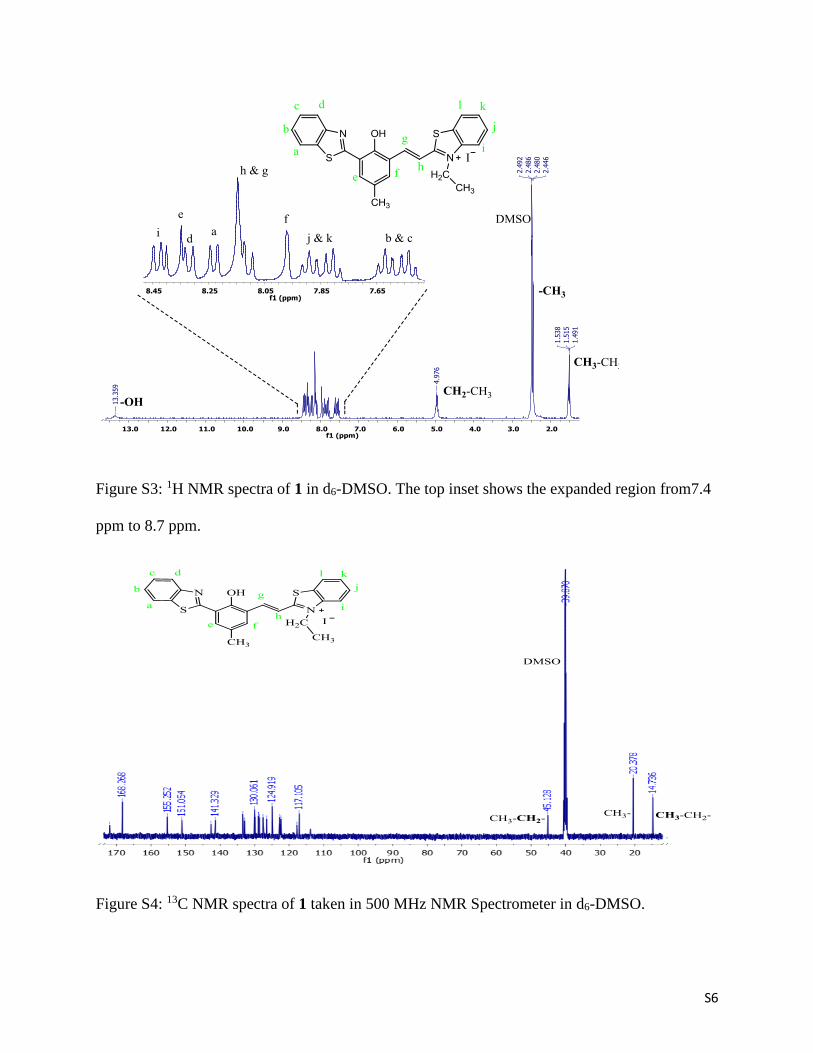
spectral properties. 1H NMR (d6-DMSO, ): 13.35 (s, 1H), 8.42 (d, 1H), 8.34 (s, 1H), 8.30
(d, 1H), 8.21(d, 1H), 8.15 (s, 1H), 8.09 (d, 1H), 7.97 (s, 1H), 7.89 (t, 1H), 7.80 (t, 1H),
S3
7.62 (t, 1H), 7.53 (t, 1H), 4.98 (q, 2H), 2.49 (s, 6H), 2.44 (s, 3H), 1.52 (t, 3H). HRMS
(m/z): [M-I]+ calcd for C25H21N2OS2, 429.1095; found, 429.0998.
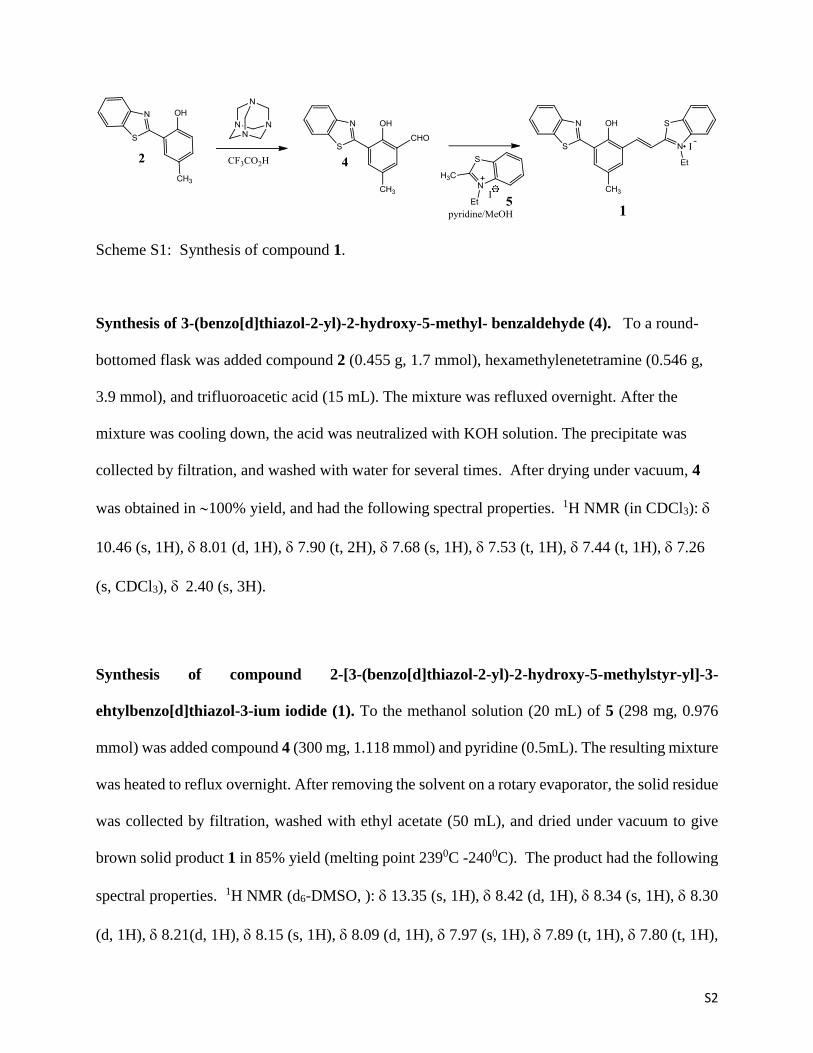
Scheme S2: Synthesis of compound 3.
Synthesis of 3-ethyl-2-(hydroxy-5-methylstyryl)benzo[d]thiazol-3-ium iodide (3).
To a 50 mL round-bottomed flask was added compound 5 (92 mg, 0.301 mmol), methanol (20
mL), 2-hydroxy-5-methylbenzaldehyde (50 mg, 0.367 mmol) and 0.5 mL of pyridine. The mixture
was refluxed overnight at 600C. After completing reaction, solvent was evaporated on a rotary
evaporator and the solid residue was washed with ethyl acetate (50 mL), filtered and dried under
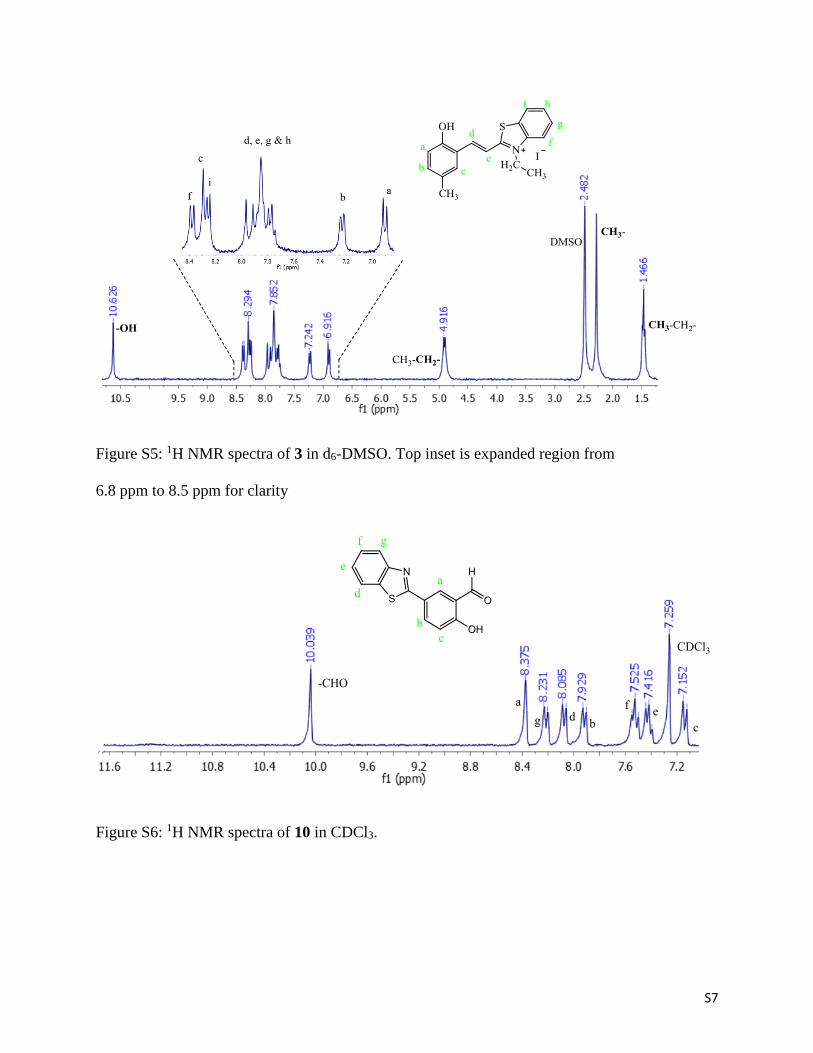
vacuum to give 0.127 g 3 as yellow solid (isolation yield 80%). 1H NMR (d6-DMSO): 10.62
(s, 1H), 8.36 (d, 1H), 8.29 (s, 1H), 8.24 (d, 1H), 7.852 (m, 4H), 7.21 (d, 1H), 6.91 (d, 1H),
4.91 (q, 2H), 2.28 (s, 3H), 1.46 (t, 3H). HRMS (m/z): [M-I]+ calcd for C18H18NOS, 296.1109;
found, 296.1154.
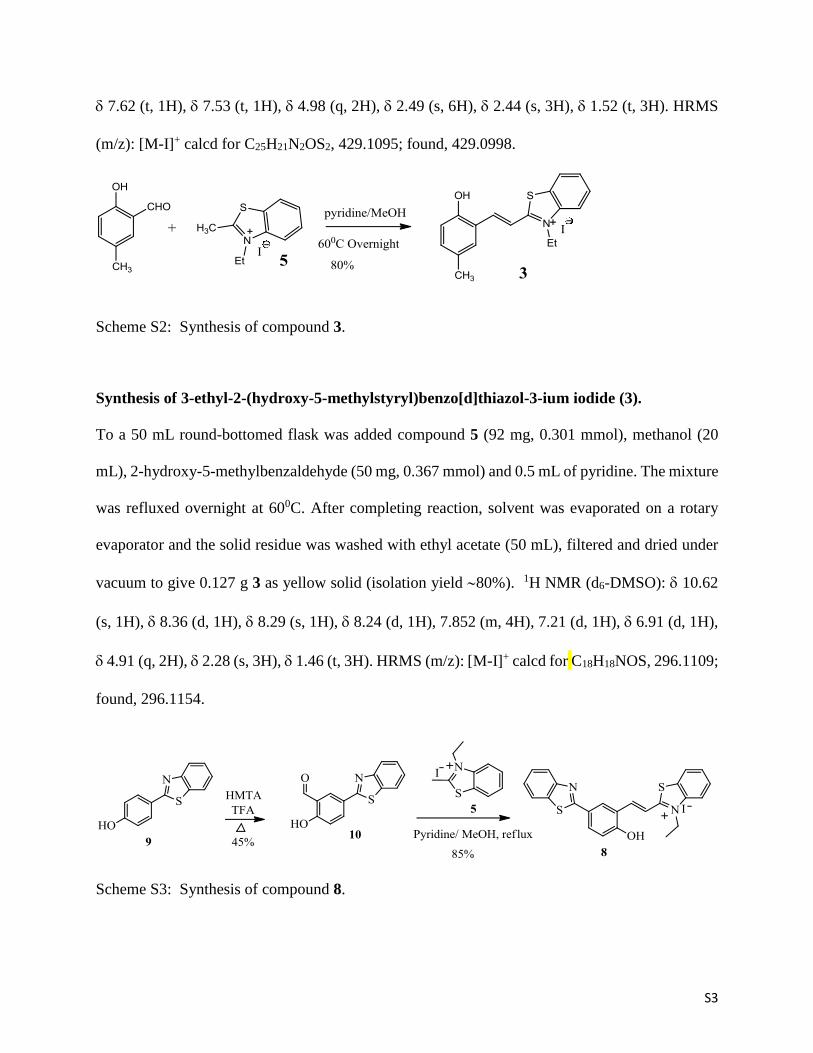
Scheme S3: Synthesis of compound 8.
S4
Synthesis of compound 5-(benzo[d]thiazol-2-yl)-2-hydroxybenzaldehyde (10). To a 100 mL
round-bottomed flask was added 4-(2-benzothiazolyl)phenol2 (9) (200 mg, 0.88 mmol), HMTA
(250 mg, 1.8 mmol) and 40 ml of TFA. The mixture was reflux for 18 hours. The reaction mixture
was cooled down to room temperature and pH was adjusted to 6.5 by using NaOH with occasional
cooling. Crude product (as yellowish solid) was collected by vacuum filtration. The product was
further purified on a silica gel column with MeOH/dichloromethane (2:98) eluent to afford 10 as
a light yellow powder (100 mg, 45% yield). 1H NMR (CDCl3): δ 11.29 (broad, 1H), δ 10.04 (s,
1H), δ 8.36 (s, 1H), δ 8.22 (d, 1H), δ 8.08 (d, 1H), δ 7.92 (d, 1H), δ 7.51 (m, 1H), δ 7.41 (m, 1H),
δ 7.26 (s, 1H), δ 7.15 (d, 1H).
Synthesis of compound 2-[5-(benzo[d]thiazol-2-yl)-2-hydroxystyryl]-3-
ehtylbenzo[d]thiazol-3-ium iodide (8). To a 50 mL round-bottomed flask was charged with 3-
ethyl-2-methylbenzo[d]thiazolium iodide 5 (50 mg, 0.164 mmol), 20 ml methanol and 0.5 ml of
pyridine, and 5-(benzo[d]thiazol-2-yl)-2-hydroxybenzaldehyde 10 (48 mg, 0.188 mmol). The
mixture was refluxed overnight at 600C. After removing the solvent on a rotary evaporator, the
residue was washed with ethyl acetate (~50 mL) to give 8 as a yellow-greenish solid. 1H NMR
(d6-DMSO): δ 11.78 (s, 1H), δ 8.41 (t, 2H), δ 8.33 (d, 2H), δ 8.23 (s, 1H), δ 8.12 (m, 2H), δ 8.01
(d, 1H), δ 7.88 (t, 1H), δ 7.79 (t, 3H), δ 7.53 (t, 1H), 7.44 (t, 1H) δ 7.25 (d, 1H), δ 4.95(q, 2H),
δ 2.48 (s, 6H), δ 1.50 (t, 3H). HRMS (m/z): [M-I]+ calcd for C24H19N2OS2, 415.0939; found,
415.0969.
References
1. Wang, J.; Chen, W.; Liu, X.; Wesdemiotis, C.; Pang, Y. J. Mater. Chem. B. 2014, 2, 3349-
3354.
2. Puranik, N. V.; Puntambekar, H. M.; Srivastava, P. Medicinal Chemistry Research 2016, 25,
805-816.
S5
2. NMR and Mass Spectra:
Figure S1: 1H NMR of 2 in CDCl3. The top inset is expanded region from 7.00 ppm to 8.10 ppm
for clarity.
Figure S2: 1H NMR of 4 in CDCl3. The top inset is expanded region from 7.25 ppm to 8.21 ppm.
S6
Figure S3: 1H NMR spectra of 1 in d6-DMSO. The top inset shows the expanded region from7.4
ppm to 8.7 ppm.
Figure S4: 13C NMR spectra of 1 taken in 500 MHz NMR Spectrometer in d6-DMSO.
S7
Figure S5: 1H NMR spectra of 3 in d6-DMSO. Top inset is expanded region from
6.8 ppm to 8.5 ppm for clarity
Figure S6: 1H NMR spectra of 10 in CDCl3.
S8
Figure S7: 1H NMR spectra of 8 in d6-DMSO. Top inset shows the expanded region from 7.18 to
8.66 ppm.
Figure S8: TOF MS ES+ Mass Spectra of 1.
Theoretical
Actual
20 ppm error
[M – I]+
[M + 1– I]+
[M + 2– I]+
S9
Figure S9: TOF MS ES+ Mass Spectra of 3.
Figure S10: TOF MS ES+ Mass Spectra of 8.
Theoretical
Actual
16 ppm error
[M-I]+
[M+1 – I]+
[M+2 – I]+
[M-I]+
[M+1 – I]+
[M+2 – I]+
S10
3. Optical Spectra:
400 450 500 550 600 650 700 750
0.0
0.1
0.2
0.3
0.4
0.5
Ab
so
rba
nce
(A
U)
Wavelength (nm)
DCM
DMF
DMSO
MeCN
MeOH
THF
Water
423447
641
556
384
600 650 700 750 800
0
1x10⁶
2x10⁶
3x10⁶
4x10⁶
5x10⁶
6x10⁶
Inte
nsity (
CP
S)
Wavelength (nm)
DCM
DMF
DMSO
MeCN
MeOH
THF
Water
681728
704
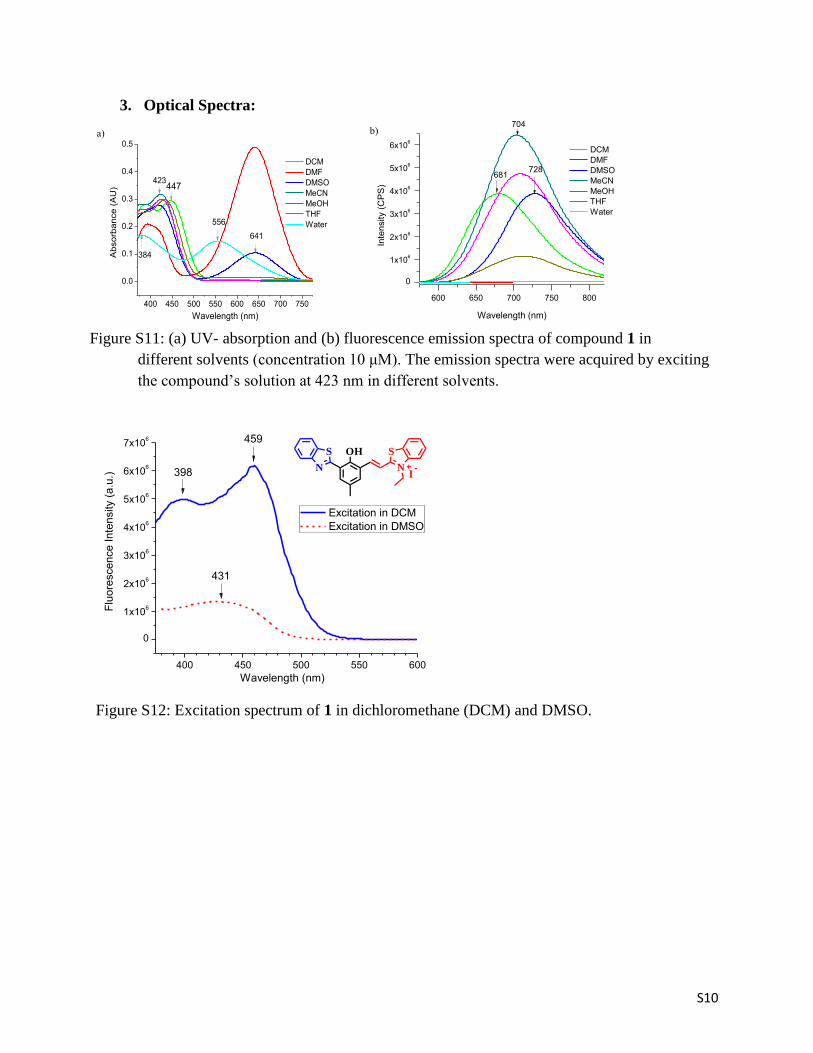
Figure S11: (a) UV- absorption and (b) fluorescence emission spectra of compound 1 in
different solvents (concentration 10 μM). The emission spectra were acquired by exciting
the compound’s solution at 423 nm in different solvents.
400 450 500 550 600
0
1x10⁶
2x10⁶
3x10⁶
4x10⁶
5x10⁶
6x10⁶
7x10⁶
OHS
N N
S
I
Flu
ore
scence I
nte
nsity (
a.u
.)
Wavelength (nm)
Excitation in DCM
Excitation in DMSO
459
431
398
Figure S12: Excitation spectrum of 1 in dichloromethane (DCM) and DMSO.
S11
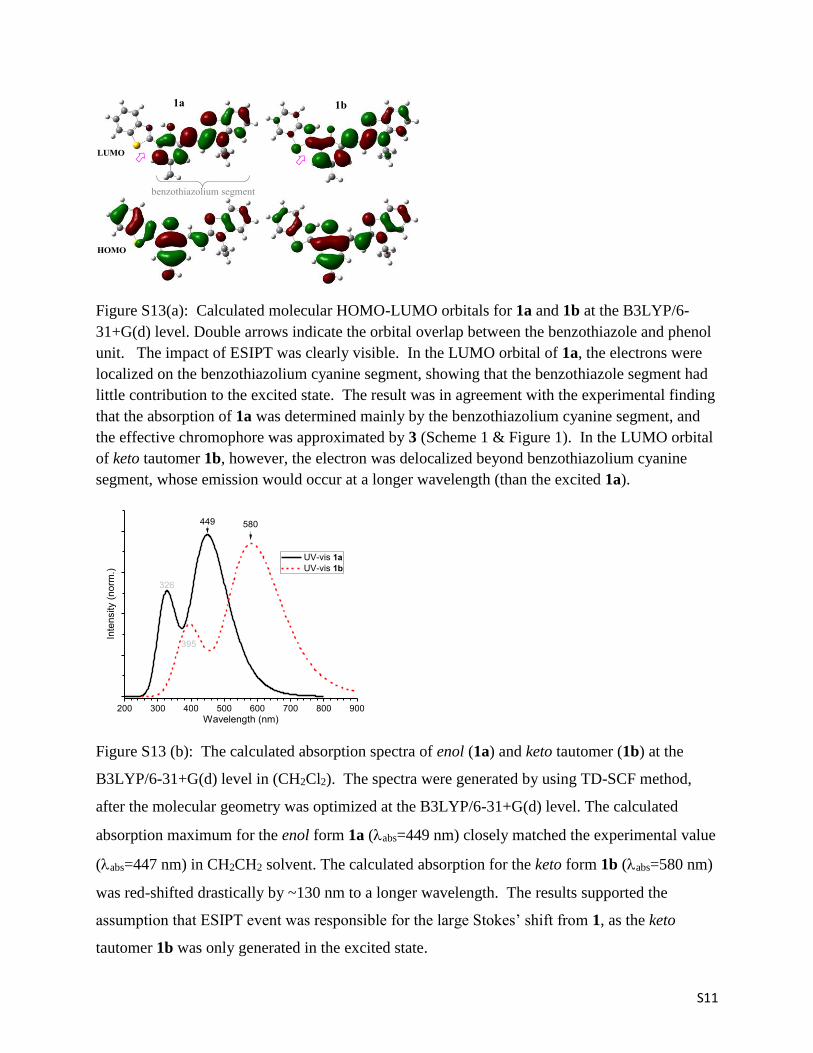
Figure S13(a): Calculated molecular HOMO-LUMO orbitals for 1a and 1b at the B3LYP/6-
31+G(d) level. Double arrows indicate the orbital overlap between the benzothiazole and phenol
unit. The impact of ESIPT was clearly visible. In the LUMO orbital of 1a, the electrons were
localized on the benzothiazolium cyanine segment, showing that the benzothiazole segment had
little contribution to the excited state. The result was in agreement with the experimental finding
that the absorption of 1a was determined mainly by the benzothiazolium cyanine segment, and
the effective chromophore was approximated by 3 (Scheme 1 & Figure 1). In the LUMO orbital
of keto tautomer 1b, however, the electron was delocalized beyond benzothiazolium cyanine
segment, whose emission would occur at a longer wavelength (than the excited 1a).
200 300 400 500 600 700 800 900
Inte
nsity (
norm
.)
Wavelength (nm)
UV-vis 1a
UV-vis 1b
449 580
326
395
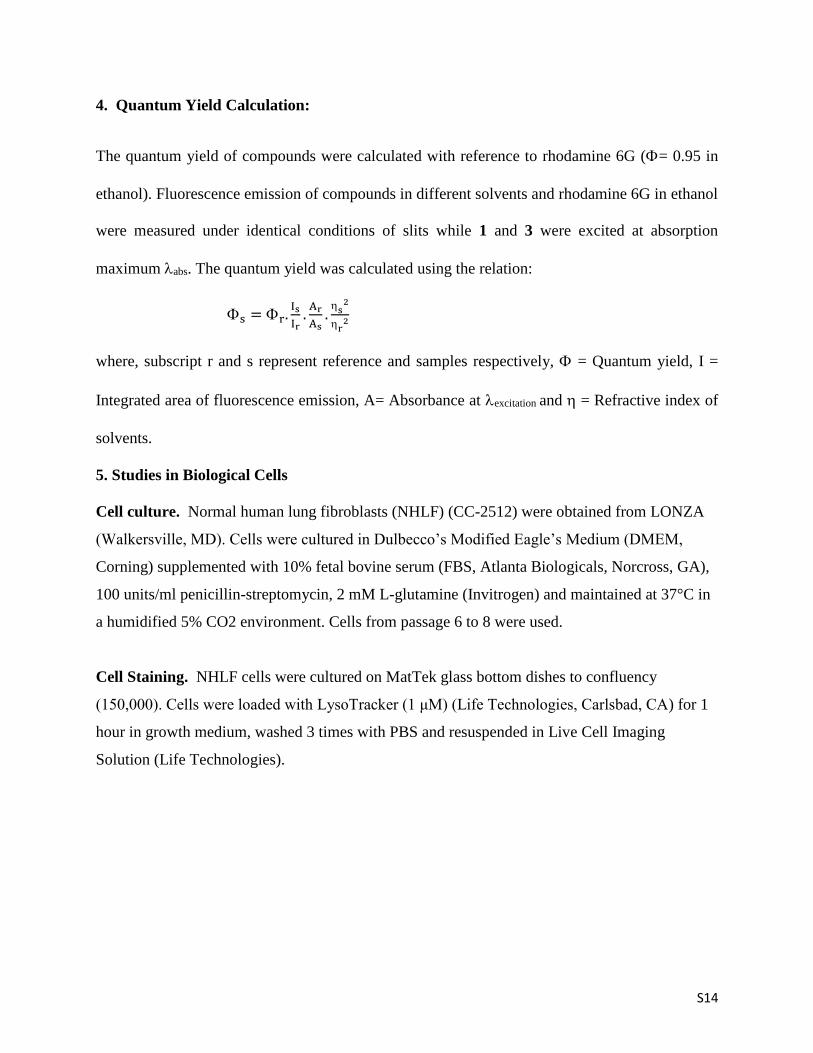
Figure S13 (b): The calculated absorption spectra of enol (1a) and keto tautomer (1b) at the
B3LYP/6-31+G(d) level in (CH2Cl2). The spectra were generated by using TD-SCF method,
after the molecular geometry was optimized at the B3LYP/6-31+G(d) level. The calculated
absorption maximum for the enol form 1a (abs=449 nm) closely matched the experimental value
(abs=447 nm) in CH2CH2 solvent. The calculated absorption for the keto form 1b (abs=580 nm)
was red-shifted drastically by ~130 nm to a longer wavelength. The results supported the
assumption that ESIPT event was responsible for the large Stokes’ shift from 1, as the keto
tautomer 1b was only generated in the excited state.
S12
Determination of pKa for Compound 1:
Figure S14(a): Boltzmann’s fitting for the plot of absorbance at 1 (acidic pH) and at 2 (basic pH)
at different pH for the compound 1. The pKa from the plot is 5.72.
350 400 450 500 550 600 650 700 750
0.00
0.05
0.10
0.15
0.20
0.25
Ab
so
rba
nce
(A
U)
Wavelength (nm)
pH 1
pH 2
pH 3
pH 4
pH 5
pH 6
pH 7
pH 8
pH 9
pH 10
pH 11
415 nm
385
565 nm
Figure S14(b). Absorbance spectra of compound 1 in water at different pH.
S13
350 400 450 500 550 600 650 700
0.0
0.1
0.2
0.3
Ab
sorb
an
ce (
AU
)
Wavelength (nm)
DCM
DMF
DMSO
MeCN
MeOH
THF
Water
425
449
500 550 600 650 700 750 800-5.0x10
4
0.0
5.0x10⁴
1.0x10⁵
1.5x10⁵
2.0x10⁵
2.5x10⁵
3.0x10⁵
3.5x10⁵
Inte
nsity (
CP
S)
Wavelength (nm)
DCM
DMF
DMSO
MeCN
MeOH
THF
Water
583
606
Figure S15: (a) UV- absorption spectra and (b) fluorescence emission spectra of compound 3 in
different solvents.(Concentration of the solution 10 μM). The emission spectra were acquired by
exciting the solution at 449 nm in DCM and at 425 nm in other solvents.
400 450 500 550 600 650 700
0.0
0.1
0.2
0.3
0.4
Ab
sorb
an
ce (
AU
)
Wavelength (nm)
DCM
DMF
DMSO
EtOH
MeCN
MeOH
THF
Water
418
457
550 610
500 550 600 650 700 750 800 850
0.0
2.0x10⁵
4.0x10⁵
6.0x10⁵
8.0x10⁵
1.0x10⁶
1.2x10⁶
1.4x10⁶
1.6x10⁶
Inte
nsity
(C
PS
)
Wavelength (nm)
DCM
DMF
DMSO
EtOH
MeCN
MeOH
THF
Water
613
Figure S16: (a) UV-vis absorption spectra and (b) fluorescence emission spectra of compound 8
in different solvents (concentration 10 μM). Excitation wavelengths (DCM 457 nm, DMF 450 nm,
DMSO 450 nm, EtOH 457 nm, MeCN 418 nm, MeOH 550 nm, THF 450 nm and Water 450 nm
for all solvents except in DCM which was excited at 447 nm.
S14
4. Quantum Yield Calculation:
The quantum yield of compounds were calculated with reference to rhodamine 6G (= 0.95 in
ethanol). Fluorescence emission of compounds in different solvents and rhodamine 6G in ethanol
were measured under identical conditions of slits while 1 and 3 were excited at absorption
maximum abs. The quantum yield was calculated using the relation:
s = r.Is
Ir.Ar
As.s
2
r2
where, subscript r and s represent reference and samples respectively, = Quantum yield, I =
Integrated area of fluorescence emission, A= Absorbance at excitation and = Refractive index of
solvents.
5. Studies in Biological Cells
Cell culture. Normal human lung fibroblasts (NHLF) (CC-2512) were obtained from LONZA
(Walkersville, MD). Cells were cultured in Dulbecco’s Modified Eagle’s Medium (DMEM,
Corning) supplemented with 10% fetal bovine serum (FBS, Atlanta Biologicals, Norcross, GA),
100 units/ml penicillin-streptomycin, 2 mM L-glutamine (Invitrogen) and maintained at 37°C in
a humidified 5% CO2 environment. Cells from passage 6 to 8 were used.
Cell Staining. NHLF cells were cultured on MatTek glass bottom dishes to confluency
(150,000). Cells were loaded with LysoTracker (1 μM) (Life Technologies, Carlsbad, CA) for 1
hour in growth medium, washed 3 times with PBS and resuspended in Live Cell Imaging
Solution (Life Technologies).
S15
CI-50 of Compound 1:
MTT Assay. Cytotoxicity was assessed using MTT (3-(4,5-dimethylthiazol-2-yl)-2,5-
diphenyltetrazolium bromide) assay. Cells (Normal Human Lung Fibroblasts) 1×10³ per well
were seeded in a 96-well plate in DMEM media with 10% FBS and incubated overnight at 37⁰ C
with 5% CO2. The cells were then treated with a series of dilution of compound 1 (0-1 mM)
(n=8). MTT was used at a final concentration of 0.5 mg/ml per well followed by incubation at
37⁰ C for 2 hours. The insoluble tertrazolium salt was dissolved by addition of (150μL) DMSO.
The absorbance was detected using Epoch Bio-Tek microplate reader at 570nm to calculate the
IC50 value.
Table 1: MTT Assay data for cell viability measurement.
Concentration (mM) Absorbance Stdev SEM Log Abs
0 0.276 0.069025875 0.024404332 -0.559090918
0.000976563 0.2725 0.068448103 0.024200059 -0.564633493
0.001953125 0.249 0.0595483 0.021053503 -0.603800653
0.00390625 0.178875 0.037498333 0.013257663 -0.747450353
0.0078125 0.13125 0.024034202 0.008497374 -0.881900688
0.015625 0.10925 0.014772078 0.005222718 -0.961578554
0.03125 0.06325 0.00795972 0.002814186 -1.19893947
0.0625 0.050125 0.003603074 0.001273879 -1.299945614
0.125 0.04975 0.005035588 0.001780349 -1.303206915
0.25 0.0475 0.004035556 0.001426785 -1.32330639
0.5 0.048375 0.003461523 0.001223833 -1.315379022
1 0.046375 0.002825269 0.000998883 -1.333716077
CI50=31.25μM
S16
0.0 0.2 0.4 0.6 0.8 1.0
0.05
0.10
0.15
0.20
0.25
0.30
0.00 0.02 0.04 0.06 0.08
0.05
0.10
0.15
0.20
0.25
0.30
Absorb
ance
Concentration (mM)
Absorb
ance
Concentration (mM)
Absorbance
MTT Assay
Figure S17: Plot of absorbance vs concentration for MTT assay. The inset shows the expanded
region at low concentration.
0.0 0.2 0.4 0.6 0.8 1.0
-1.3
-1.2
-1.1
-1.0
-0.9
-0.8
-0.7
-0.6
-0.5
Log Abs
Log A
bs
Concentration (mM)
CI 50
Figure S18: Plot of Log(Absorbance) vs concentration.
Cell images for Compound 1:
Imaging was performed on a Nikon A1 confocal system with a 100x Plan Apo λ, NA=1.45 oil
objective with both GaAsP dectectors and high sensitivity low noise PMTs for detection. The
excitation used for compound 1 was 405 nm with 680-720 nm filter for emission. The LysoTracker
S17
was excited using 577 nm and with a 590/50 nm bandpass filter used for emission. All imaging
was done in an Okolab Bold Cage Incubator at 37C, and images were processed using NIS
Elements or Image J Pro imaging software.
Figure S19: Images of a mouse endothelial cell (mec) with (A) LysoTracker, (B) Compound 1,
(C) overlap in 100x and (D) Enclosed portion of ‘C’ digitally enhanced by 526x. Excitation for
compound 1 is 405 nm with 680-720 nm filters for emission, and the LysoTracker has an
excitation/emission of 577/590.