40
Richard V. Burkhauser Sean Lyons Cornell University Kosali Simon Indiana University AN OFFER YOU CAN’T REFUSE Estimating the Coverage Effects of the 2010 Affordable Care Act July 2011

Richard V. BurkhauserSean LyonsCornell University
Kosali SimonIndiana University AN OFFER
YOU CAN’T REFUSEEstimating the Coverage Effects ofthe 2010 Affordable Care Act
July 2011
2
The Employment Policies Institute (EPI) is a nonprofit research organization
dedicated to studying public policy issues surrounding employment growth. Among
other issues, EPI research has quantified the impact of new labor costs on job
creation, explored the connection between entry-level employment and welfare
reform, and analyzed the demographic distribution of mandated benefits. EPI
sponsors nonpartisan research that is conducted by independent economists at major
universities around the country.
Dr. Richard Burkhauser is the Sarah Gibson Blanding Professor of Policy Analysis in Cornell University’s
Department of Policy Analysis and Management. Since joining the department in 1998, he has focused on how
public policies affect the economic behavior and well-being of vulnerable populations, e.g., people with
disabilities, older persons, and low-income households. He has published widely on these topics in journals of
demography, economics, gerontology, as well as public policy. Dr. Burkhauser’s research has been cited by
major publications, and he has testified before Congressional committees about the economic consequences of
public policy decisions.
Dr. Kosali Simon is a Professor in the School of Public and Environmental Affairs at Indiana University. Prior
to fall 2010, she was an Associate Professor in Cornell University’s Department of Policy Analysis and
Management. Her research examines economic questions in health insurance policy as well as in the
determinants of health and care use.
Sean Lyons is a graduate student in Cornell University’s Department of Policy Analysis and Management.
From 2007 to 2009, he worked as a Research Analyst at Lewin Group focusing mostly on the evaluation of state
and federal health care policies, including simulation modeling of proposed health care system reforms.

3
TABLE OF CONTENTS
Introduction ....................................................................................................... 4
Previous Estimates of the Affordable Care Act .................................................. 6
Reform Components Analyzed in this Paper ...................................................... 7
Data Sources and Methods ................................................................................. 9
Results ............................................................................................................. 12
Static Cases............................................................................................................. 12
Dynamic Cases ....................................................................................................... 16
Government Spending On Subsidies ...................................................................... 20
Discussion and Summary ................................................................................. 22
References ....................................................................................................... 25

4
INTRODUCTION
Proponents of the Patient Protection and Affordable Care Act and the companion Health Care and Education
Reconciliation Act of 2010, known collectively as the Affordable Care Act (ACA)1, expect that the law will
substantially expand health insurance coverage to the 17.61 percent of currently uninsured non-elderly working
Americans,2 without dramatically changing the terms under which the vast majority of working Americans now
receive their health insurance.3 Conversely, critics claim that the nature of currently insured workers’ coverage
will change. They predict the ACA mandates requiring firms to provide health insurance to their workers or
face a fine will cause large scale reductions in hiring (Chow and Phillips, 2009, and Beacon Hill Institute, 2010)
and the ACA subsidies for health insurance purchased by some lower income families at privately run
exchanges will substantially crowd out employer-sponsored health insurance (ESI) and discourage work
(Kessler, 2011, and Holtz-Eakin and Smith, 2010).
While it will be some time before the ACA implementation is complete, there is a nascent literature attempting
to estimate its behavioral consequences. Here, using stylized calculations, we provide a first approximation of
the sensitivity of predicted changes in the share of workers covered by ESI to alternative assumptions about
how workers and employers will react to the implementation of the ACA.4
We show that predictions of the share of workers who will keep their current ESI are quite sensitive to
behavioral assumptions—an increase in ESI coverage from 74.29 to 78.62 percent in the static case where no
workers currently receiving ESI move to the newly created exchanges, to a drop from 74.29 to 65.89 percent in
1 The Patient Protection and Affordable Care Act of 2010 (P.L.111-148) can be found at http://frwebgate.access.gpo.gov/cgi-
bin/getdoc.cgi?dbname=111_cong_bills&docid=f:h3590enr.txt.pdf and the Health Care and Education Reconciliation Act of 2010 can
be found at http://frwebgate.access.gpo.gov/cgi-bin/getdoc.cgi?dbname=111_cong_bills&docid=f:h4872enr.txt.pdf
More detailed reviews of the provisions of this law for employers can be found elsewhere, such as Simon (2010). 2 Congressional Budget Office (CBO) using formal simulation modeling, forecasts that it will insure 32 Million more than otherwise
by 2019 (CBO 2010). See http://www.cbo.gov/publications/collections/health.cfm for an overview of CBO reports on the health care
bills. 3 “First, if you are among the hundreds of millions of Americans who already have health insurance through your job, or Medicare, or
Medicaid, or the VA, nothing in this plan will require you or your employer to change the coverage or the doctor you have.
(Applause.) Let me repeat this: Nothing in our plan requires you to change what you have." (President Obama, to joint session of
Congress, September 2009), reported at http://www.huffingtonpost.com/2009/09/09/obama-health-care-speech_n_281265.html 4 Employer mandates to provide health insurance to their workers will reduce incentives to hire low-skilled workers whose hourly
wage rate is close to the federal or state minimum hourly wage rate. Such mandates increase workers’ non-wage compensation and
when this increase cannot be offset by declines in their wage compensation, analysts predict it will have the same depressing effect on
employment as a minimum wage hike. However, because the major ACA expansion of health insurance coverage for low-skilled
workers comes from increases in the income eligibility level for Medicaid, we predict that the implementation of the ACA will have
relatively small negative employment effects which will not be very sensitive to behavioral change assumptions. In an appendix
available from the authors, we show that the magnitude of job losses implied by binding minimum wages would be between 32,000
and 47,000 .

5
the most dynamic case we consider. This huge swing in predicted ESI coverage from 78.62 to 65.89 percent
depends on two critical assumptions whose implications are not well understood.
The first assumption is this: To what degree will firms and their workers alter their current contractual relations
with respect to the explicit workers’ share of the ESI premium? This is important because access to substantial
taxpayer subsidized exchange health insurance premiums for families defined as lower income (400 percent of
the official poverty line or below—$89,400 for a family of four in 2011) is restricted to those without ESI and
those whose ESI coverage is unaffordable. But because the ACA affordable coverage rule is whether the
worker’s premium is below 9.5 percent of his or her family income, we show that it could be in the interest of a
surprisingly large share of current ESI workers and employers to change their current contracts so that these
otherwise income eligible workers will be able to receive the exchange subsidy. This is the case even though
workers who choose this option will have to pay their exchange premium with post-tax dollars and their firms
will be fined $3,000.
The second factor is uncertainly with respect to in how the affordability provisions will be interpreted in the
codifying of ACA regulations. The language in doubt is whether the affordable coverage rule applies to single
coverage or family coverage for workers with families. We show that this as-yet-uncodified interpretation of the
language of the ACA will dramatically affect the degree that the ACA crowds out ESI.5
5 While it is clear that the ACA considers an offer of ESI to be affordable if it costs less than 9.5 percent of gross household income, it
is unclear whether this refers to the premium for single coverage or family coverage as applicable to the workers, or whether it always
refers to single coverage. The Senate Finance Committee report published on October 18, 2009, upon which the eventual ACA
legislation was based defined affordability as follows: “Unaffordable is defined as coverage with a premium required to be paid by the
employee that is ten percent or more of the employee’s income, based on the type of coverage applicable (e.g., individual or family
coverage).” (Underline added, U.S. Senate, 2009, p.39) . Between October 18, 2009 and December 24, 2009 when the final bill was
passed by the Senate, the language that defines affordability was changed with the word “self-only coverage” substituted for “the type
of coverage applicable (e.g., individual or family coverage)”. Because the House of Representatives accepted as a whole the language
in the Senate bill, in the final version of the ACA legislation passed by both Houses and signed by President Obama affordability is
defined in section 5000A(e)(1)(B) as:
“(B) REQUIRED CONTRIBUTION.—For purposes of this paragraph, the term ‘required contribution’ means—
(i) in the case of an individual eligible to purchase minimum essential coverage consisting of coverage through an eligible-employer-
sponsored plan, the portion of the annual premium which would be paid by the individual (without regard to whether paid through
salary reduction or otherwise) for self-only coverage” (underline added).
The Congressional Budget Office (CBO) and the Joint Committee on Taxation (JCT) used the definition of single coverage in scoring
the bill, following the language in Section 5000A(e)(1)(B) of the ACA. Under this interpretation, families will receive premium
subsidies on the exchanges based on income only if they were not offered ESI coverage at all or if the firm offered coverage to them
but the “single option”, as opposed to the “family option” was unaffordable.5
However, language in other parts of the ACA still refers to coverage for families as well. For example, Section 1513 describes the
shared responsibility clause that triggers a fine as occurring when a “… large employer fails to offer to its full-time employees (and
their dependents) the opportunity to enroll in minimum essential coverage..”. The section further stipulates that a large employer that
has offered its “...full time employees (and their dependents) the opportunity to enroll in minimum essential coverage…” but
nonetheless has one or more of its full time employee enroll in an exchange plan and receive a subsidy will trigger a different fine.
(Underline added).
6
In our most dynamic case, when all covered employees are compensated in higher wages to offset their payment
of the full ESI premium in order that some will be able to take full advantage of an affordable coverage rule that
is broadly interpreted to mean affordable family coverage, we estimate that the movement of workers out of ESI
and into exchange-based coverage will: 1) overwhelm the number of workers moving into ESI by currently
uninsured workers in large firms due to the mandates; 2) cause the provision of health care insurance to working
Americans to become more sharply segregated based on family income; and 3) cost taxpayers up to $5 billion
dollars in gross subsidies for every one million workers who switch from being an ESI main policy holder to
receiving subsidized exchange coverage, all else equal.6 As a result, we estimate that increased exchange use in
the most dynamic case will require about $47.5 billion more in gross yearly subsidy payments than in the least
dynamic case.
PREVIOUS ESTIMATES OF THE EFFECTS OF THE AFFORDABLE CARE ACT
Although several papers analyze the likely effects of health insurance reforms, to our knowledge none focus on
the importance that the definition of the affordable coverage rule and the consequences of basing that rule on
the percentage of the ESI premium paid by the worker have on overall ESI coverage or on the distribution of
such coverage, particularly across wage and income dimensions. For example, Dubay, Cook, and Garrett
(2009)7 simulate the effects of health reform on the uninsured, modeling a Medicaid expansion to 133 percent
of the poverty line and an individual mandate. They find that these two reform components would bring some
financial assistance to three-quarters of the uninsured, with about half being eligible for subsidies and half being
eligible for Medicaid. Holahan and Garrett (2011) discuss the impact of both health insurance and health care
provisions in the ACA on employment and conclude that, on net, there would be very small consequences.
Holtz-Eakin and Smith (2010) were the first to point out that the federal subsidies in the ACA, intended only for
those not eligible for ESI, are so large that they could induce strategic behavior on the part of some employees
and tempt some employers to change their labor contracts to take advantage of these subsidies. Using
hypothetical workers and a fine of $2,000 per worker (the case when large firms do not offer health insurance to
their workers), they demonstrate when it will make sense for an employer to drop health insurance coverage and
the types of workers who will benefit from a switch from ESI to subsidized exchange coverage.
6 We do not take into account cost sharing subsidies in our calculation. We also do not take into account the additional taxes that the
government will earn as a result of workers who receive higher wages once they switch away from employer coverage. However, we
do take into account the reduced amount of subsidies that would result once workers receive higher wages from compensating wage
differentials. 7 http://www.urban.org/uploadedpdf/411950_uninsured.pdf. More information about the Urban Institute Micro-simulation Model is
available at http://www.urban.org/UploadedPDF/411690_microsimulation_model.pdf and http://www.ncvhs.hhs.gov/090227p4.pdf

7
For instance, they calculate that for a large firm, with full-time employees in families earning up to 200 to 250
percent of the family poverty line (depending on how high health care costs rise by 2014), employers could
drop ESI, allow the worker to access the exchange subsidies, and make the employee better off through
increased wages despite the fines. They note that whether firms will adjust fully will depend on certain
inflexibilities in the labor market, but that “the massive federal subsidies are money on the table inviting a vast
reworking of compensation packages.” (Holtz-Eakin and Smith, 2010, p. 4.)
Here we provide a more systematic estimate of their behavioral assumptions. But our major innovation is to
demonstrate a more likely avenue for workers and employers to gain access to the “money on the table.” That
is, we explore a potential mutual agreement to reset the employer-employee sharing of the premium within a
firm to allow otherwise eligible workers to take full advantage of the arbitrary measure of affordability in the
current legislation rather than by such workers sorting to do so.
REFORM COMPONENTS ANALYZED IN THIS PAPER
Here we focus on the ACA’s three major routes to coverage expansion; the employer mandate, Medicaid
expansion, and exchange subsidies. We first look at the ACA’s effect on total coverage, and the sources of that
coverage under static cases where individuals do not fully consider their alternative health insurance options.
We then consider dynamic cases that allow firms and their workers to reconsider their compensation packages
in light of the new law. Our dynamic cases extend the analysis of Holtz-Eakin and Smith (2010) along several
dimensions. Instead of using aggregate numbers and focusing only on how the enactment of the law will impact
workers (assuming a family of four) in large firms with employer coverage, we use individual-based data from
the Current Population Survey (CPS) to look at the behavioral response to the ACA by all workers in our
universe. We do so by showing how health insurance coverage and its distribution by source in 2008 (in the
2009 March CPS) would have changed by firm size, income-to-need ratio (a worker’s pre-tax post-transfer
family income divided by the value of the poverty line for a family of that size), and wage rate if these three
ACA features had been implemented in 2008 and that all behavioral changes occur in that year.8 Our
calculations take into account the feedback loop that may exist if workers receive compensating differentials
when they drop ESI. That is, we take into account that someone who is at the cusp of Medicaid eligibility would
no longer be eligible for coverage if they were to drop ESI and receive a wage increase. We do this also when
calculating the applicable exchange subsidy, which depends on the family’s income.
8 We do this for the purpose of illustration; it will obviously take much more time for any behavioral effects to fully play out.

8
A more sophisticated budget-neutral consideration of ACA’s financing is beyond the scope of our paper, but
would be needed to consider the net effects of these reform features. The CBO used micro-simulations on the
entire U.S. population to project global yearly estimates of the ACA’s impact when all its provisions are fully
implemented. Here, we only focus on a subset of the working age population and their dependents and provide a
first approximation of the gross cost to taxpayers of the parts of the ACA related to financing exchange
subsidies and additional Medicaid expenditures, assuming that all the behavioral changes we discuss in our
dynamic cases fully play out in 2008. We do so to focus on the sensitivity of the outcomes to the assumptions
used and the unintended consequences these specific subsidies could have on the way health insurance is
provided in the United States.
In our estimations, we focus on non-self-employed working age (aged 17 to 64) individuals who are employed
in private sector jobs, but our simulations consider relevant family characteristics (e.g., family income, whether
the worker has other family members requiring coverage, etc.) and explicitly include dependents when making
cost calculations for exchange subsidies. In the first static case, we model the employer mandate as requiring all
large employers (50 or more workers) to ensure that all full-time workers (30 hours or more a week) are
covered by employer health insurance, providing family coverage when appropriate. We assume all firms will
provide such coverage rather than pay the fine. The Medicaid expansion builds upon this by covering all
workers in families with incomes at 133 percent or less of the poverty line through Medicaid, transferring some
of the people who otherwise would have been covered under the employer mandate rules. Exchange coverage is
available to everyone, and we assume in our final static case that everyone who remains uninsured (and values
insurance at least at 10 percent of income) will go into the exchange, but that no one who currently has
coverage through some other means will drop that coverage.
The dynamic cases allow individuals to make calculated decisions about whether exchange coverage (or lack of
coverage) makes them better off. We then assume that firms and workers collaborate to find the best option for
them. We will focus on four dynamic cases. The least dynamic, which is consistent with the CBO approach on
our two key assumptions, assumes a narrow definition of the affordable coverage rule and no change in
premium payments. In this case we find no crowd-out effect. The most dynamic case assumes a broad definition
of the affordable coverage rule and that workers explicitly pay 100 percent of the premium and results in the
greatest crowd-out effect. In our two intermediate cases, the effect diminishes when we use either a narrow
definition of the affordable coverage rule or do not allow a change in premium payments.
9
DATA SOURCES AND METHODS
Our calculations are performed on a nationally representative sample of the population. The appropriate data set
for this analysis should contain information on current health insurance sources, as well as income,
employment, and demographic information for workers and their families. We use the 2009 March Current
Population Survey, which contains most of the details we need, and supplement it with additional data on health
insurance premiums from other sources. A lack of detailed information on coworkers at the same firm is a
deficiency characteristic of all standard household surveys. The reason this matters is that a firm makes
decisions about health insurance with the current (and potential future) workforce in mind, and we would not
know this from household data.9 This matters less for illustrative calculations like ours when considering what
effects legislation may have several years in the future, but should be kept in mind when interpreting our results.
Health insurance, family income, and firm size data come from the 2009 March CPS.10
Wage data come from
the outgoing rotation group (ORG) questions of 2009 March-June CPS.11
The March CPS asks individuals to
report the size of their employer, and offers options of less than 10, 10 to 24, 25 to 99, 100 to 499, 500 to 999
and 1,000 and over. For purpose of the law, an important cutoff point occurs with respect to firms with 50
workers, so it is important for us to assign workers in the 25 to 99 category to either the 25 to 50 or 51 to 99
firm size category. The MEPSIC data show that of all firms with 25 to 99 workers, about half the workers are
employed by firms in the 25 to 50 firm size category. Thus, we randomly assign half of the workers in the CPS
25 to 99 firm size category to the 25 to 50 firm size category and the rest to the 50 to 99 firm size category and
report data by small (less than or equal to 50) and large (greater than 50) firms. Our sample size of workers in
the 2009 March CPS is 36,950, representing 95,496,817 workers. Note that the BLS estimate for the number of
total workers in the United States is 139,817,000 in July 2009.12
As expected, this is higher than our total since
we limit the sample (age 17 to 64 private sector, non self-employed workers).
9 More sophisticated simulation models create synthetic firms out of individual workers in surveys.
10 While the March survey asks about health insurance in the past year, questions asked in February relate to health insurance at that
point in time. However, this special CPS supplement in February was not conducted in 2009. To ensure that workers are assigned only
to one insurance status, we use a hierarchy that is explained in the Data Set Methods appendix. A full description of how we construct
our CPS-based data set is available upon request. 11
In each month, a quarter of the respondents in the CPS are asked detailed wage information. Because of the rotational structure of
the CPS, those in the March CPS will be answering those detailed questions in March-June of the CPS. We first select the March CPS
sample that meets the definition of private sector, non-self employed workers, aged 17-64, and record the total weight of this
population (the number of individuals represented by this population definition). We lose a large subset of this population because of
either failure to match to the ORG or failure to find a wage among those who match to the ORG, among these workers. We then re-
weight the remaining matched wage sample to total the national population of private sector non-self employed workers aged 17-64
and proceed with this sample. However, in case those workers who report wages are systematically different from workers who do not
report wages, we have created alternative versions of our key tables on the full sample of workers in the March CPS who are private
sector, non-self employed workers, aged 17-64 (without requiring wage data) to test the sensitivity of our results. These tables did not
show large differences from the main tables. 12
http://www.bls.gov/news.release/empsit.a.htm, accessed August 2010.
10
Using data on workers’ wages, firm size, coverage, and family incomes from the 2009 March CPS, we first
establish the current level and distribution of health insurance coverage, and then simulate the effects of the
main provisions of the ACA on this population, under different sets of simplifying assumptions. We limit
ourselves to private sector non-self-employed workers (both part-time and full-time) aged 17 to 64 years. We
begin with a discussion of the base-case before health reform, showing coverage rates by firm size, income, and
wage categories. From this initial setting, we examine coverage rate changes that result from each main aspect
of reform as they build on each other, by income, firm size, and wage category.
We first consider coverage patterns under a static case of full ACA compliance and full Medicaid take-up
without unintended behavioral changes. We assume that Medicaid and other insurance are viewed as equivalent
forms of coverage by workers. Finally, we show how the ESI share estimates will change under our four
dynamic scenarios where employers and workers take advantage of the new exchange subsidies in their
decisions about how work will be compensated, and where the interpretation of the affordable coverage rule in
the ACA varies.
The behaviors we describe can be summarized by equations. In the equations below, we assume that, for those
workers who were ESI insured as the main policy-holder prior to the ACA, the relevant decision is only
between keeping ESI or switching to exchange coverage (since we already know they bypassed the option of
being uninsured even when there was no fine associated with being uninsured). But for those who were
uninsured prior to the new law, we will compare their insurance options to being uninsured to decide their final
insurance status. We assume here that those who are eligible for Medicaid would opt for it, regardless of their
initial insurance status. The decisions regarding ESI, exchange coverage and being uninsured are summarized
by the following equations.
The worker with ESI in the base case chooses to remain with ESI coverage if:
[1] ((Px - Sx)) > [(Pe - Fe) (1-t)]
where Px stands for the total price that will be charged in the exchange,13
Sx stands for the subsidy to which they
will be entitled (based on their income-to-needs ratio after a compensating wage differential is received if they
do not receive ESI), t stands for the marginal tax rate and Pe stands for the total price of a policy when sold
through the employer. The tax adjustment is made to the cost of employer coverage because the total cost will
be incurred on a pre-tax basis. Fe stands for the fine triggered when the worker elects subsidized exchange
13
We have used estimates from Kaiser Family Foundation. We have also used employer premiums from the MEPSIC as an
alternative.

11
coverage, if they come from a large firm. The fine is $3,000 per marginal worker in question if the employee
contribution is set higher than a certain fraction of income. If the inequality in [1] does not hold, we assume the
worker opts for exchange-based coverage.
In Figure 1, we show the distribution of the amount [(Pe - Fe) (1- t)] - ((Px - Sx)) for each worker in a kernel
density graph. This shows whether the amount of after tax money received as compensation for agreeing not to
receive affordable ESI is greater than the after tax money needed to obtain exchange coverage, and if so, by
how much. A positive number means that the worker is better off trading in affordable ESI for a compensating
wage differential and using it to obtain subsidized exchange-based coverage. The fraction of those with positive
numbers who are able to realize these gains will depend on the “firewall”—whether the affordable coverage
rule is defined in a broad or narrow way and whether firms can adjust employee premium splits. The universe
included in Figure 1 is all workers who had ESI in the base case (full-time and part-time as well as small and
large firms) and those who are covered by the employer mandate. It is important to demonstrate this distribution,
as it allows one to judge the importance of any transaction costs that could be introduced into the decision-
making process.
Next, we consider decisions facing those who were uninsured prior to reform. Mechanically, we approach their
decisions in two steps. For those who are full-time workers in large firms, we first ask which option the worker
would prefer (ESI or exchange) if they were to be insured. This calculation (Equation 1) is conducted just as it
is for workers who currently have ESI. Then we question whether the worker (who is uninsured at baseline in
the CPS) would choose the winning status over the option of being uninsured. Unlike in the case of workers
who already have ESI, we cannot assume here that the uninsured workers would value coverage at whatever is
the lowest cost option available to them (ESI or exchange). This calculation also incorporates the fact that being
uninsured triggers an individual-level fine. We assume that the value placed on health insurance depends on
income and age (using 10 percent of family income). There is no one way to value health insurance for the
uninsured, but approximately 10 percent of income is the maximum considered affordable in the legislation for
families under four times the poverty line. And, in earlier legislation for poorer families (Children’s Health
Insurance Program), five percent was set as the maximum cost for the family for coverage of their children. We
have used alternate values of five and 15 percent, as well as values in that range by age group to see how much
the results depend on this arbitrary assumption. When doing so, we find our results are not changed in any
meaningful way.

12
The decision of whether or not to be uninsured is summarized by the following equation. The worker decides to
be uninsured if:
[2] Cost of outcome in [1] > (Fi + d) (Income)
where Fi stands for the individual-level mandate fine, and d stands for 10 percent if the person is under the age
of 35, and 20 percent if 35 or older. Income stands for their family income.
As in Figure 1, Figures 2a and 2b show the distribution of surpluses from being uninsured, for all workers who
were uninsured in the base case. Figure 2a is for those who picked ESI coverage in the most dynamic case, and
were uninsured in the base case. Positive numbers indicate that being uninsured is chosen. Figure 2b is for those
who picked exchange coverage in the most dynamic case, and were uninsured in the base case. Once again,
positive values indicate a preference for being uninsured. In our calculations, very few individuals would be
uninsured even when parameter (d) is set as low as 5 percent of income, partly because of the individual fine
and partly because very low income individuals receive Medicaid or generous exchange subsidies.
Once workers are assigned a final insurance status in our dynamic cases, we compare the insurance rates, ESI
rates, and exchange rates to the static case coverage rates. The Data Set Methods volume, available upon
request, contains a table at the end showing the number of workers (weighted and unweighted) who move from
one insurance status to another going from the base to the static and then to the dynamic cases.
RESULTS
Static Cases
The first row of Table 1 reports the source of health insurance coverage for the 95 million working Americans
(aged 17 to 64) employed in the private sector represented by our data. The primary target of ACA among the
working population is the 17.61 percent who have no health insurance. Of the 82.29 percent of workers who
have some form of health insurance, the majority (58.90 percent) are directly covered by their ESI plan.
Another 15.39 percent receive their insurance as a dependent on another worker’s ESI. In total, 74.29 percent of
all working age Americans employed in the private sector were covered by ESI plans in 2008. Only 5.09
percent were covered by health insurance purchased on the open market and 2.99 percent received their health
insurance coverage from Medicaid or some other government provided plan. Thus, ESI is the primary source of
health insurance for workers across all firm size, income-to-needs, and wage categories, and is more likely to be

13
held by workers in large firms, with higher incomes, and higher wages. Those in small firms, those with low
income-to-needs ratios, and those with low wage rates are much less likely to have any form of health insurance.
Appendix Table 1 contains the same Table 1 categories, but reports the number of workers in each cell rather
than the percentage of workers by firm size, income-to-need, and wage rate categories. These numbers are
obtained from the CPS weights that show the number of workers represented by each CPS observation. For
instance, of the 95 million working age Americans employed in the private sector, 64 million are in large firms.
The other 31 million are in small firms that are not mandated to provide health insurance (i.e., not expected to
pay a fine if they do not).
However, since small firms are less likely to have ESI plans, the 16.8 million uninsured workers are almost
equally employed by small (8.7 million) and large (8.05 million) firms. Table 2 shows the number of uninsured
workers whose employers will be subject to fines in the static case, if they are not provided with ESI, relative to
the total number of uninsured workers. Of the 16.8 million uninsured workers, only 8.05 million are employed
in large firms and of those, 1.51 million of them work less than 30 hours per week. Hence, the ACA will only
mandate the employers of 6.6 million or 41 percent of all uninsured workers to provide ESI or pay a fine.
Table 3 shows in greater detail the distribution of workers across different insurance categories, with column
percentages adding up to 100 by category. As discussed in the context of Table 1 and Appendix Table 1, small
firm employees comprise a relatively smaller share of our sample of workers than large firm employees. But a
disproportionate share is uninsured, which is more precisely shown in Table 3. While 32.47 percent of our
sample is employed in small firms, they make up 49.70 percent of all uninsured workers. The ACA will not
penalize any of these firms, and, in our static estimations, these firms are unlikely to increase their provision of
ESI by much.
Another important ACA feature can be seen in the income-to-needs distribution in Table 3. While we saw in
Table 1 that ESI is the primary source for health insurance of those who have some form of health insurance in
all income categories, low income-to-needs workers are the least likely to have any form of health insurance. As
can be seen in Table 3, 23.36 (14.43 + 8.93) percent of the uninsured have income below 133 percent of the
family poverty line and therefore will be eligible after the ACA’s expansion of Medicaid to this level of income.
Likewise, 56.63 (21.52 + 21.86 + 13.25) percent of the uninsured whose income-to-needs ratios are between
133 and 400 percent of poverty will be potentially eligible for subsidies in the ACA created insurance

14
exchanges. The 20.02 percent of the uninsured whose income-to-needs ratios are above 400 percent of poverty
will also be able to purchase exchange coverage but they are not eligible for a subsidy.
Hence, while the mandate on large firms to provide health insurance to their full-time workers misses the
majority (59 percent) of uninsured workers who either work for small firms or are not full-time workers, the
Medicaid expansion and the subsidies for the uninsured who go to the exchanges will potentially impact all but
20 percent of the uninsured population whose income-to-needs ratios are greater than 400 percent of the poverty
line.
What is less obvious is that both the expansion of Medicaid and subsidies for the exchanges may also impact
the decisions of the vast majority (74.29 percent) of workers who are either directly or indirectly covered by
ESI. As demonstrated in Table 3, a small percentage of these workers have income-to-needs ratios that are
below 133 percent of the poverty line (2.99 percent of own employer and 1.38 percent of dependent). But a
much larger percentage have income between 133 and 400 percent of the poverty line (36.9 percent of own
employer and 28.7 percent of dependent). As can be seen in Appendix Table 1, this translates into 1.9 million
currently covered ESI workers with family incomes below 133 percent of the poverty line who could be eligible
for Medicaid coverage, and 25 million currently covered ESI workers with family income between 133 and 400
percent of the poverty line who could be eligible for subsidies if they switch coverage to the exchanges. These
potentially eligible Medicaid and subsidized private exchange customers who currently have ESI coverage far
exceed the ACA’s target population of 16.8 million currently uninsured workers. While the crowd-out effects of
these largely neglected 25 million current ESI covered workers will by definition be ignored in the static case
below, we will focus on this major behavioral effect in our four dynamic cases thereafter.
Coverage changes in the static case. In Table 4, we display the results of our three static simulation exercises.
These show the consequences of various aspects of the ACA on health insurance coverage and the source of
that coverage for the 95 million working age Americans employed in the private sector if it had been
implemented in 2008.14
In the first two columns we repeat the numbers for the insured and ESI coverage rate
(own and dependent) from Table 1. In the third column, we first assume that all large firms will provide
coverage to their full-time workers, including those living in lower-income families. As can be seen in row 1 of
this column, this will increase overall coverage to 89.99 percent, relative to 82.39 percent in the base case in
column 1. As demonstrated in column 4, this is entirely driven by the increase in ESI coverage from 74.29
percent (row 1 of column 2) to 81.97 percent (row 1 of column 4). This can be thought of as the maximum
14
Our sample was limited to those workers in the CPS sample who reported wages, as explained in the text and the footnote to Table
1. In unreported tables we recalculated Table 4 without such a limitation. The results were quite similar.

15
increase in ESI that would occur under full compliance with the ESI mandate by employers absent a Medicaid
expansion and with no behavioral effects by workers already covered by ESI.
Almost all the increase in ESI coverage in the static case occurs among workers in large firms, but because
some dependents of these newly insured, large-firm workers are employed in small firms, even the share of
small-firm employees with ESI rises slightly. This is because we first interpret the law broadly as stating if the
worker in question has dependents not covered through other means, then family health insurance coverage
must be provided by large firms. Thus, full compliance with the law would mean employers subject to the
mandate offer coverage to workers as applicable (single or family) and workers take up that coverage—our
broad interpretation of the law. Even in this case, large-firm ESI coverage will not reach 100 percent because
around 19 percent of uninsured employees in large firms work part-time. In this static case, workers and their
employers do not consider changing their compensation packages and taking advantage of the subsidies offered
under the new law, nor do any small-firm workers who are uninsured prompt their employers to start offering
coverage because of the individual mandate fine.15
However, we assume that all workers who qualify for
Medicaid take-up that coverage regardless of whether they previously received ESI.
The next two columns (columns 5 and 6) better represent the consequences of Medicaid take up in the static
case. Medicaid expansion (building on top of the employer mandate, so it understates its total effect) would
further increase overall coverage from 89.99 percent (row 1 of column 3) to 92.73 percent (row 1 of column 5),
a total increase of about 2.7 percentage points. This rise in overall coverage masks an important shift in the
source of coverage. The Medicaid expansion reduces ESI coverage from 81.97 percent (row 1 of column 4) to
78.62 percent (row 1 of column 6), a decline of 3.4 percentage points relative to what the static case would
predict in the absence of Medicaid expansion. For small firms, ESI coverage after the first two components of
the static case (60.10 percent) is actually lower relative to the base case (60.49 percent). This is because the
increase in coverage of their employees as dependents of mandated workers from the second set of columns is
overshadowed by the number of their workers who leave for Medicaid coverage under full take-up. As can be
seen by comparing columns 4 and 6, the decline in ESI coverage entirely occurs in income-to-needs ratios rows
below 133 percent which fall to zero based on our assumption of full Medicaid take-up.
15
In our calculations in this paper, we also do not consider the subsidies available to small firms to offer coverage because of their
temporary nature (up to two years) and because the full credit (which is 50 percent of the employer contribution towards coverage,
which could be as low as 50 percent of the total, which would put the credit as low as 25 percent of the cost of coverage) is available
only to very small firms with very low-wage workers (firm size less than 10 workers, average annual wages less than $25,000), many
of whom may be eligible for Medicaid or highly subsidized exchange coverage if their employers do not offer ESI. The cutoff for
Medicaid, 133 percent of the poverty level, is currently somewhat less than $30,000 a year for adults in a family of four
16
In the final of the static cases (columns 7 and 8), we assume that people choose to become insured through the
exchange unless they value health insurance at less than the premium in the exchange. We assume that people
value health insurance at 10 percent of their income. This applies to everyone else who remains uninsured and
who wishes to avoid the fines and moves to the exchanges, even the 20 percent of the uninsured with incomes
greater than 400 percent of the poverty line and hence not subsidized. In this static case, coverage now hits
almost 100 percent (column 7), but there is no further change in ESI.16
Dynamic Cases
Unlike the static cases, the dynamic cases can be thought of as incorporating strategic behavior on the part of
workers and firms. As before, we have full take-up of Medicaid. But unlike the static case, we now allow all
those who are offered ESI (because of the employer mandate or not) but are income-eligible for exchange
subsidies to consider obtaining subsidized exchange coverage, if their ESI coverage can be classified as
unaffordable. Our alternative cases reflect four combinations of two alternative assumptions. The first is with
respect to a broad or narrow interpretation of the affordable coverage rule. The second is concerned with
whether or not employers and their workers will increase all ESI premiums upward to allow those workers who
would otherwise be eligible for subsidized exchange coverage to now qualify for exchange subsidies due to
their ESI coverage being unaffordable.
To reduce ESI crowd-out, the ACA prohibits workers whose employer offers health insurance from accessing
the subsidized exchange market even if they would be eligible for it on family income grounds alone. But there
is an exception to this rule that allows small- and large-firm workers to receive subsidized exchange coverage if
that coverage is not affordable.17
To guard against this exception, subsidizing an unreasonable number of such
workers, there are firewall provisions in the law (CBO, 2010). When such workers receive subsidized insurance
from an exchange, if they are employed in a large firm, that firm must pay a fine of $3,000. Small firms pay no
fine. To meet the affordability test, workers’ ESI premiums must exceed 9.5 percent of their family income.
However it is ambiguous whether Congress intended the affordable coverage rule to be defined by a broad
(single or family coverage, depending on the worker’s family status) or narrow standard (single coverage even
if the worker has a family). Below we show how important this interpretation of Congressional intent will be by
comparing dynamic cases using both a broad and narrow interpretation of the ACA language. This is the first
assumption whose impact on ESI coverage and employment we will test in our dynamic cases.
16
An alternative possibility here is to assume that the remaining individuals, even those who are part-time workers, obtain employer
coverage. This would increase ESI but this case is not considered here. 17
We ignore the provision regarding low actuarial value of plans. We also ignore a provision regarding “free choice vouchers” that
may have applied to some employers as it was repealed as part of the 2011 budget act, (§1858 of H.R. 1473, Department of Defense
and Full-Year Continuing Appropriations Act, 2011).
17
Internal Revenue Service (IRS) rules allow both employers and employees to contribute to health insurance
premiums on a pre-tax basis, as long as employers establish the necessary paperwork (which almost all large
employers do). This means that the split between employee and employer contributions for health insurance is
largely an artificial one.18
The second assumption, whose impact on ESI coverage and employment we will test
in our dynamic cases is the importance of employers and their workers willingness to set the share of the
premium all workers pay for ESI to a level which exceeds the affordability standard of 9.5 percent of family
income for those workers who would otherwise be eligible for exchange subsidies on family income grounds
and providing higher wages for all workers instead.
Our most dynamic case is a broad interpretation of the affordability coverage rule and full flexibility of
employee premium. In it, we hypothesize that employers can and will, with the cooperation of their workers,
take advantage of the provisions in the law to give their workers in families living below four times the poverty
line the option of taking advantage of subsidized exchange coverage even though it will require them to pay a
fine.19
To distinguish our simulations finding from those of Holtz-Eakin and Smith (2010), we assume that employees
in both the short and long run remain with their firms. Hence none of the crowd-out we find in our model is
caused by workers sorting into firms that do or do not offer ESI.20
Despite our assumption that all workers
18
For large employers this is a straightforward exercise. But for small employers, this is currently a more meaningful distinction
because their ability to provide health insurance usually depends on the fraction of eligible employees accepting coverage. Small
employers tend to have low employee contributions to ensure high participation rates, an issue that does not concern large employers.
Insurer practices in unregulated markets allow them to put restrictions on terms of sale such as this. When reforms are instituted in the
insurance market, this may not matter. For example, small firm exchanges will offer guaranteed issue plans with close to community
rated premiums. These premiums will not depend on the participation rate. Thus, at the extreme, all employers could set the annual
contribution just above 9.5 percent of the income of the highest family income worker to qualify for a subsidy ($88,900, thus $8,454)
and bypass the affordability rule.
Even if many employers and employees do not renegotiate terms right away, there is more flexibility in the long run. The employer
would then pay $3,000 a year for the marginal worker who goes to the exchange and receives a subsidy; in equilibrium only those
workers for whom the exchange subsidy is larger than the $3,000 fine and the loss of the ESI tax deduction will choose to do so. 19
Exchange coverage can be either in a single or a family plan. We assume that when a worker obtains a family plan with a subsidy in
the exchange, only that main policy holding worker will trigger a fine for their employer. That is, a secondary worker in the same
family who is a dependent under the exchange insurance policy will not trigger their own employer fine since the subsidy is
technically received only by the main policy-holder worker. 20
Another possible mechanism implicit in the Holtz-Eakin and Smith, 2010 calculations is that large-firm workers who wish to take
advantage of exchange subsidies could sort into large firms where health insurance is not offered, and the employer would incur a fine
of $2,000 for each of these workers. We also modeled the Holtz-Eakin and Smith (2010) case in our work (Table A-2). In this case,
workers in large firms are allowed to sort into firms based on whether they find it in their interest for the firm to offer health insurance
or not. In large firms a fine of $2,000 applies if the firm does not offer coverage. Workers in small firms do not face this fine so all
who would qualify for an exchange subsidy will go as long as the subsidy is at least as great as the tax deductibility they would lose of
ESI. When not offered coverage, workers and families can go to the exchange and receive subsidies to which they are entitled. This
results in the greatest movement away from employer provided health insurance and into the subsidized exchanges by workers whose
income is less than four times the poverty line (from 78.62 in the static case—row 1 of column 4 in Table 4—to 61.66).
18
remain with their original firms and that the only changes to employer provided health insurance are related to
the share of the initial premium paid by the worker, in our most dynamic case we find that ESI declines and
increases the take-up of subsidized exchange provided health insurance close to those found in our case inspired
by Holtz-Eakin and Smith (2010) found in the appendix.
Our least dynamic case is a narrow interpretation of the affordability coverage rule and no change in employee
premium. In it, we hypothesize employers and workers maintain the same employee ESI premium payment
after the ACA is implemented as they did before. We show that the narrow definition of single coverage even
for workers with families, together with the assumption of no change in the current premium paid by workers,
results in exactly the same outcome as in the static case.
We also show two intermediate cases: a narrow interpretation of the affordable coverage rule that allows the
worker to pay the full premium and a broad interpretation of the affordable coverage rule with no change in
premium.
Comparing the most and least dynamic cases. Table 5 shows the distribution of coverage under both the least
and most dynamic cases discussed above. In the first three columns of Table 5 we, like the CBO, assume a
narrow definition of affordability and no changes in the premium paid. In the final three columns of Table 5 we
contrast these results with the most dynamic case—broad definition and fully flexible premium payment. In
both cases we use the same mechanisms for determining the gains from a move from ESI coverage to exchange
coverage.
Specifically, workers living in families whose income is below four times the poverty level will qualify for
exchange subsidies if their employer does not offer them coverage or if the coverage that is offered has cost
sharing that is unaffordable by the narrow standard in the first set of columns and by the broad standard in the
second set of columns. In the first set of columns we assume no change in who pays the premium. In the second
set of columns we assume full flexibility in setting employee cost sharing. In both cases we assume that workers
and their employers will take this new worker option of purchasing subsidized health insurance from an
exchange into consideration in adjusting the compensation package—but in the first case employer and
employee do not consider changing the premium paid by the worker to gain eligibility. In contrast, in
considering whether to include employee health insurance as part of an employee’s compensation package or
only providing monetary wages, in the more dynamic case they will recognize that switching from a
compensation package that contains ESI to one containing only wages will mean that large firms will be subject
19
to a fine and that both small and large firm workers will lose the implicit tax subsidy contained in tax free ESI
coverage.
The values in the first two columns of Table 5 are identical to the values in the last 2 columns of Table 4. That
is, in our least dynamic case in which we assume a narrow definition of the affordable coverage rule along with
no premium adjustments, no ESI covered worker is able to surmount the ACA firewall conditions and hence
there is no ESI crowd-out. This outcome was assumed in the static cases in Table 4. The third column of Table
5 reports exchange coverage in the least dynamic case. Its values are also the same as found in the static case,
although they are not explicitly shown in Table 4. There is no crowding out of ESI despite the subsidized
premium for exchange coverage, because the firewall of a narrow affordable coverage rule and an unwillingness
of employers and employees to change the mix of premiums paid results in few workers with ESI being eligible
for the subsidies among workers who would otherwise meet the family income test.
This is not the case in the most dynamic case (broad affordability and maximum change in premiums) in the
second set of columns in Table 5. ESI crowd-out is dramatic. ESI coverage declines from 78.62 percent in the
static case (which is also the narrow, no premium adjustments dynamic case as is seen in row 1 of column 2) to
65.89 percent in row 1 of column 5. Exchange coverage increases from 10.23 (row 1 of column 3) to 22.89
percent (row 1 of column 6) overall and from 27.98 (row 9 of column 3) to 68.18 percent (row 9 of column 6)
for those with income between 133 and 200 percent of poverty. Exchange coverage increases from 18.26 to
54.27 percent for families between 201 and 300 percent of poverty and from 12.58 to 35.04 percent for families
between 301and 400 percent of poverty.
Comparing intermediate dynamic cases. Table 6 reports the two intermediate cases and shows that both
moving from a broad to a narrow affordable coverage rule and reducing the ability of firms and workers to
change the premium paid by the worker will reduce the ability of workers who would otherwise be eligible for
subsidized exchange coverage to gain access to subsidized exchange premiums. ESI coverage falls from 78.62
percent (row 1 column 2 of Table 5) in the least dynamic case to 73.95 percent (row 1 column 2 of Table 6)
when the narrow definition of affordability is used but firms and workers are still able to increase the ESI
premium employees pay. Hence, substantial ESI crowd-out will occur even under the narrow affordable
coverage rule used by the CBO. But it is considerably less than the fall in ESI coverage to 65.89 percent (row 1
column 5 of Table 5) using the original broader coverage rule. In this intermediate case, exchange coverage
only increases from 10.23 percent (row 1 column 3 of Table 5) to 14.23 percent (row 1 of column 3 of Table 6)
rather than to 22.89 percent (row 1 column 6 of Table 5) in the most dynamic case.

20
ESI coverage only falls from 78.62 percent (row 1 column 2 of Table 5) in the least dynamic case to 76.74
percent (row 1 column 5 of Table 6) when the broad definition of affordability is used but firms and workers do
not increase the ESI premium employees pay.
Government Spending On Subsidies
Table 7 provides a first approximation of the populations receiving a subsidy for exchange coverage, and the
cost of coverage for that population. In our main calculations, the subsidy is estimated assuming that premiums
in the exchange equal those predicted by the Kaiser Family Foundation. Since these tend to be low in
comparison to current ESI premiums, we also discuss an alternative calculation that uses current ESI
premiums.21
In the base case, no one has exchange coverage and there are no government subsidies. In the static case as well
as in our least dynamic case, out of the 9.8 million workers who go to the exchanges, only the approximately
4.7 million workers who are living in income eligible families (1.33 to 4 times the poverty line) and are not
offered ESI receive subsidized exchange premiums. Since their average subsidy is $4,017, the total gross
subsidy is about $19 billion.
In contrast, in our most dynamic case—broad coverage rule and total flexibility—substantial crowd out occurs
and the gross subsidy rises to $66.5 billion (13 million newly subsidized exchange users with an average
subsidy of $4,948). The subsidy in the later case is so much higher even though there is no real change in the
initial economic well being of the workers who are receiving it because the trigger for a government subsidy is
based on an “affordability measure” that can be easily manipulated. That is, the law states that subsidies should
be such that the out of pocket costs of an individual are no more than some percent of household income. This
means that any increases in the employee’s premium are fully passed on to the government even though the
firm is simply restructuring the way that workers are paid rather than raising the real cost of health insurance.
In our two intermediate cases, the gross subsidy numbers fall somewhere in between since either the affordable
coverage rule is narrowed or the premium is not changed. Net subsidy costs would be lower by the sum of the
21
We show these alternative results since it is unlikely that the new exchanges will be able to provide health insurance of equal quality
to that provided by the ESIs at lower costs. It could be that the Kaiser silver plan appears lower than current ESI premiums because
current ESI plans may be more generous than the Kaiser silver plan (which has 70 percent actuarial value). Since the exchanges have
cost sharing subsidies that bring the actuarial value of the plans to 94 percent for families with income in the range of 100 to150
percent of the poverty line and to 70 percent for families at 250 to 400 percent of the poverty line, we use ESI premiums as an
alternative measure of future premium costs. The law stipulates the amounts that families will pay, thus the subsidies cover the
remainder of the premium. Since using a different premium affects the subsidy calculations, we have estimated the subsidies with the
ESI premiums as well. (The coverage outcomes do not change because the cost sharing is set independent of the exchange premiums).

21
fines collected from firms and the new taxes on the compensating wage differential of workers who previously
received ESI.22
Foregone subsidies. Table 8, reports on foregone subsidies— that is, the additional amount of taxpayer money
that would be spent on those workers who are income eligible for exchange premium subsidies, but are not able
to access them because they are either covered by an affordable ESI plan, or find it not in their financial interest
to obtain these subsidies because of the fines and/or the loss of tax subsidy to ESI.23
In our most dynamic case, the foregone subsidies are lowest ($1,620.76 on average, and $19.6 billion in total)
since the ACA firewalls have been overcome to the greatest degree—the affordable coverage rule is broad and
workers premiums are adjustable upward, so substantially more income eligible workers and their dependents
can gain access to the subsidies. As long as their total premium costs are high enough to overcome the broad
affordable coverage rule and the subsidies are high enough to overcome the $3,000 fine (for large firm full-time
workers) as well as the loss of their ESI tax treatment, they will move onto the exchanges. The total subsidy
foregone, even in this highly flexible case, is $19.6 billion. In contrast, in the most restrictive dynamic case
(narrow, no adjustment), there is $62 billion in foregone subsidies—three times the amount in the most dynamic
case. This corresponds to an average of $3,040 per enrollee.
We estimate that Medicaid expenditures will average $2,591 per enrollee using our administrative data and that
in the base case there are 3.5 million workers eligible for Medicaid. This increases to 8.8 million after the ACA
is implemented (numbers not explicitly shown in a table)—this value is the same in all static and dynamic cases
since we assume full Medicaid take-up in each. Thus we estimate the cost of ACA Medicaid expansions will be
$13.4 billion in total [(8,834,205 - 3,533,725)*($2,591)].24
These estimates are first approximations of the differences in the gross cost to taxpayers of ACA-related
financing of exchange premium subsidies and additional Medicaid expenditures in both our static and dynamic
22
Estimating net government subsidies are even more complicated. Some new exchange users will no longer receive the tax subsidies
that were tied to their employer health insurance because their additional income will reduce them. Additional government revenues
will also come from the fines that large employers will now pay for employees who no longer receive ESI. On the other hand, we do
not include in our subsidy calculation the government subsidies that would be provided for co-pays, and so on under exchange
coverage, which would tend to increase government spending on subsidies.
23
Although dependents (both worker dependents and others) are not included in our worker numbers, their additional costs are
included in our estimates for employers and exchanges. This is the case because the cost of dependents’ coverage is included in our
estimates of the cost of health insurance for all main policy-holder workers. 24
This stylized calculation can be thought of as the cost of avoiding disemployment effects. Without the expansion of Medicaid, we
would expect a substantially larger number of wage-constrained employees to be at risk of job loss. The Medicaid expansion
substantially lowers that risk, but it comes at a higher cost to taxpayers.

22
cases, assuming that all the behavioral changes we discuss in our dynamic scenarios fully played out in 2008.
We do not consider additional tax revenue or fines brought in from individuals who earn higher wages after
employer health insurance is dropped. However, we do consider what those higher wages do to the means-based
exchange subsidy for which they would qualify. On the other hand, we also do not add in the cost of cost-
sharing subsidies that would be additional government expenditures. We perform our cost change calculation to
focus on the importance of the two key assumptions surrounding the language of the ACA with respect to
affordable coverage rules and the behavior that the Act’s use of employee ESI premium payments as its
measure of affordability would induce.
We focus on these two key ACA assumptions to measure the effects on the way health insurance is provided in
the United States.25
The main cause of the substantial difference in who provides health insurance between the
most and least dynamic of our cases is a result of the unintended crowd-out of ESI brought on by the generous
exchange subsidies for workers living in families with incomes less than four times the poverty line that provide
sufficient money on the table to induce employers and their workers to change compensation packages.
DISCUSSION AND SUMMARY
The implementation of the ACA may cause large changes in the share of workers with ESI coverage and the
resulting distribution in the sources of health insurance coverage across the income distribution, depending on
two key factors. We show that predictions of the share of workers who will keep their current ESI are quite
sensitive to behavioral assumptions—an increase in ESI coverage from 74.29 to 78.62 percent in the static case
where no workers currently receiving ESI move to the newly created exchanges, to a drop from 74.29 to 65.89
percent in the most dynamic case. Furthermore, in the most dynamic case, the vast majority of those with ESI
coverage will now have incomes greater than four times the poverty line ($89,400 for a family of four in 2011),
most exchange users will have family incomes that are 1.33 to four times the poverty line, and all those with
family incomes below 1.33 of the poverty line will receive their health insurance via Medicaid. This huge swing
in predicted ESI coverage from 78.62 to 65.89 percent and its consequence of a much more segregated way of
25
We also modeled the story proposed by Holtz-Eakin and Smith (2010) to measure ESI crowd out with our work (Table A-2). Here,
workers in large firms are allowed to sort into firms based on whether they find it in their interest for the firm to offer health insurance
or not. In large firms a fine of $2,000 applies if the firm does not offer coverage. Workers in small firms do not face this fine so all
who would qualify for an exchange subsidy will go as long as the subsidy is at least as great as the tax deductibility they would lose of
ESI. When not offered coverage, workers and families can go to the exchange and receive subsidies to which they are entitled. As
shown in the appendix this results in a fall in ESI coverage in our population from 78.62 percent in our least dynamic case to 61.89
percent in the Holtz-Eakin and Smith case. This result assuming zero transactions cost and hence perfect sorting is not that much
greater than our most dynamic result with no job changes of 65.89 percent.

23
providing health insurance coverage by family income depends on two critical assumptions whose implications
are not well understood.
The first implication is common to any prediction. To what degree will behavior change because of a change in
the law? In this case, the degree firms and their workers will alter their current contractual relations with respect
to the share of the explicit ESI premium that workers pay. We have shown that the amount of ESI crowd out
that is possible is much larger than previous estimations have modeled. This is the case because they have not
explicitly modeled the ability of employers and employees to renegotiate their compensation agreements to
maximize the number of ESI covered workers who could be eligible for exchange premium subsidies. We find a
very large percentage of these family income eligible ESI covered workers would prefer to take these subsidies
with their employers’ approval. This would happen even though firms will be fined $3,000 for each worker
whose ESI is judged unaffordable and who obtains subsidized coverage. This is despite the fact that such
workers will have to pay their share of the exchange premium with post-tax dollars.
The second is the unsettled question of how the affordable coverage rule will be codified in the final ACA
regulations. The language in doubt is whether the affordable coverage rule applies to single coverage or family
coverage for workers with families. We show that this as yet uncodified interpretation of the language of the
ACA will dramatically affect the degree that the ACA crowds out ESI.
Our intention here is not to take a stance on what should happen with respect to codifying affordable coverage
language in the ACA or on how employers and employees will change their compensation agreements to take
advantage of the incentives in the ACA. Rather, it is to point out the potential importance of these ACA issues
on coverage patterns and gross exchange subsidy costs—potential implications that have received little attention
thus far.
We have primarily focused on the employment effects of the ACA which are likely to be small and on ESI
crowd-out effects that have the potential to be much more important. The total cost of exchange subsidies to tax
payers is $66 billion in our most dynamic case relative to $19 billion in our least dynamic case. Our findings
here echo those first suggested in Holtz-Eakin and Smith (2010) that if employees are fully able to sort across
large firms based on the demand for health insurance, exchange subsidies could be about three times as large as
estimated by the CBO. But our analysis using data from the CPS more clearly shows the distributional
consequences of these unintended effects across income, wage, and firm size. In fact, when we replicate the
Holtz-Eakin scenario with our method in Appendix Table 2, we find that full sorting across large firms would
24
lead to coverage rages around 62 percent. The corresponding subsidy costs (not shown in a table) to the
government come to about $75 billion.
In our models we show that even without costly sorting of workers into firms along health insurance lines, we
could have behavioral changes that lead to almost as large a loss in ESI as if workers were able to sort. Doing so,
we show that not accounting for these dynamic behaviors and depending on static models that ignore such
behavior could lead to a substantial underestimation of the number of workers who will move out of ESI plans
and into the subsidized exchanges. This will lead to much higher costs for taxpayers from these subsidies.
Although we do not have a comparable model or population to compare our most dynamic case results to the
CBO case, the fact that the assumptions about affordable coverage rules and premium adjustments we make in
the least dynamic case are the same as the CBO’s assumptions make a comparison of our two cases
informative.26
The magnitude of this understatement is such that in our static or least dynamic case, the
estimated cost of exchange subsidies is one third as much as we forecast for our most dynamic case. Our
findings show how sensitive predictions of the consequences of the Affordable Care Act of 2010 on ESI and
exchange coverage and costs are to assumptions made with respect to employer and employee responses to
exchange subsidies.
We provide two major contrasting examples—a static or least dynamic case that assumes little behavioral
change and a dynamic case where employers and employees take full advantage of the current subsidies under a
broad definition of the affordable coverage rule. It is not possible with certainty to know precisely what the
consequences of the implementation of the ACA will be.27
But what is clear is that estimates ignoring these
possible different interpretations of the affordable care rule and the flexibility in premium share adjustments,
will significantly understate the actual decline in ESI coverage and the growth of exchange coverage and
subsidy costs, if firms and workers take full advantage of the current subsidies.
26
There are many other differences between our approach and the CBO approach. To name a few, they use different samples (we use
a sub population of private sector workers while CBO uses the whole US population, different methods (we provide a simple and
transparent simulation calculation while the CBO uses a sophisticated utility based simulation model), the CBO (and Holtz Eakin and
Smith) assumes some crowd out due to employers dropping coverage, while we assume no firms will drop coverage. 27
In July 2007, Massachusetts was the first state to implement a package of reforms that included an expansion of public health
insurance, subsidized exchange coverage, and employer and individual fines. It is still too early to determine the full effect of these
reforms on strategic behavior of employers and employees, but very early evidence indicates no drops in employer coverage (Long
and Masi , 2008).

25
REFERENCES
Beacon Hill Institute, 2010. “Killing Jobs through National Health Care Reform,”
March, available at
http://www.atr.org/userfiles/BHI%20Health%20Care%20Reform%20as%20Job%20Killer(7).pdf.
Burkhauser, R. and K. Simon. 2008. "Who Gets What from Employer Pay or Play Mandates?" Risk
Management and Insurance Review. Vol 11, Issue 1, Pp.75-102.
Chow, M. and Bruce D. Phillips, 2009. Small Business Effects of a National Employer Healthcare Mandate,
Washington, DC: National Federation of Independent Business. Available at
http://www.nfib.com/Portals/0/PDF/AllUsers/NFIBStudy_HealthcareMandate.pdf
Congressional Budget Office (CBO) 2010: Letter from CBO Director Elmendorf to Nancy Pelosi. March 20
2010. Available at http://www.cbo.gov/ftpdocs/113xx/doc11379/AmendReconProp.pdf.
Congressional Budget Office (CBO) 2008: Key Issues in Analyzing Major Health Insurance Proposals
(December 2008).
Congressional Budget Office (CBO) 2007: Health Insurance Simulation Model: A Technical Description ,
(Oct. 2007).
Dubay, L. and A. Cook (2009). How Will the Uninsured be Affected by Reform? Available at
http://www.urban.org/uploadedpdf/411950_uninsured.pdf.
Holahan, J. and B. Garrett, 2011. How Will the Affordable Care Act Affect Jobs?
Available at http://www.urban.org/health_policy/url.cfm?ID=412319
Holtz-Eakin, Douglas and Cameron Smith. 2010 Labor Markets and Health Care Reform: New Results, May
2010. American Action Forum. www.americanactionforum.org. available at
http://americanactionforum.org/files/LaborMktsHCRAAF5-27-10.pdf.
Kessler, D. 2011” How Health Reform Punishes Work”. Wall Street Journal. Available at
http://online.wsj.com/article/SB10001424052748704628404576265692304582936.html
Long, S. and P. Masi. 2008. “How have Employers Responded to Health Reform in Massachusetts? Employees’
Views at the End of One Year,” Health Affairs, 27 no.6 w576-583 2008.
Simon, K. 2010 Implications of Health Care Reform for Employers: An Analysis of the Patient Protection and
Affordable Care Act. Prepared for the Center for American Progress.
Urban Institute (2010) http://www.kff.org/healthreform/upload/Medicaid-Coverage-and-Spending-in-Health-
Reform-National-and-State-By-State-Results-for-Adults-at-or-Below-133-FPL.pdf (p.8, method summary
section on participation rates).
U.S. Senate, 2009. “America’s Health Future Act of 2009” October 19. Calendar no 184., report 111-89.
Committee on Finance. Online version available at available at http://www.gpo.gov/fdsys/pkg/CRPT-
111srpt89/html/CRPT-111srpt89.htm (accessed August 2011)

Table 1. Insurance Status of Workers, by Firm Size, Income, and Wage Categories – Percent within Each Category
Source: CPS data estimated by the authors.
Notes:
1. The sample consists of private sector workers ages 17 to 64 years who were interviewed in the March 2009 Current Population Survey (CPS). We restrict the sample to those with wage data
available in the Outgoing Rotation Group questionnaire of March, April, May or June CPSs of 2009, and whose firm size was non missing. We lost 302 observations out of an initial 64,046 due to
improper merge results, 75 observations due to missing hours, 26,897 observations due to lack of wage data, and 649 observations due to missing firm size. See data appendix for further details. Half
of the workers in firm size 25-99 were randomly assigned to the large firm category (more than 50 workers) while the other half were randomly assigned to a small firm. All figures are weighted to
represent the US population by weights provided in the CPS March supplement. Workers are assigned to only one insurance status, using a hierarchy described in the text. Income to needs ratio is
calculated based on data reported for 2008. Workers whose wages appeared to be below the applicable state minimum wage were re-assigned to small firms so that the employer mandate did not
apply to them. This affected 827 observations.
All
(1)
Uninsured
(2)
Own Employer
(3)
Dependent
Employer
(4)
Non-group
(5)
Publicly
Insured
(6)
Weighted Percent
100.00 17.61 58.90 15.39 5.09 2.99
Number of Observations
36,950 6,047 21,619 6,276 1,809 1,242
Population Count
95,496,817 16,818,385 56,252,143 14,697,092 4,864,240 2,856,417
Row Percentages
Firm Size Small Firm 32.47 49.70 22.51 41.44 52.97 45.46
Large Firm 67.53 50.30 77.49 58.56 47.03 54.54
Total (all firms)
100.00 100.00 100.00 100.00 100.00 100.00
Income-to-needs ratio 100 or less 4.55 14.43 1.35 0.72 4.38 29.05
101-133 3.18 8.93 1.64 0.66 3.09 12.26
133-200 9.20 21.52 6.22 3.47 9.46 22.95
201-300 15.29 21.86 14.59 10.20 15.09 16.77
301-400 15.17 13.25 16.09 15.03 16.04 7.65
More than 400 52.62 20.02 60.12 69.92 51.94 11.31
Total (all incomes)
100.00 100.00 100.00 100.00 100.00 100.00
Wage category $0-$6.24 2.40 5.27 1.00 3.19 3.94 5.92
$6.25-$7.25 3.37 7.74 1.08 5.24 4.49 12.27
$7.26-$13.50 34.85 57.57 24.57 40.55 40.49 62.56
More than $13.50 59.38 29.42 73.35 51.02 51.08 19.25
Total (all wages)
100.00 100.00 100.00 100.00 100.00 100.00
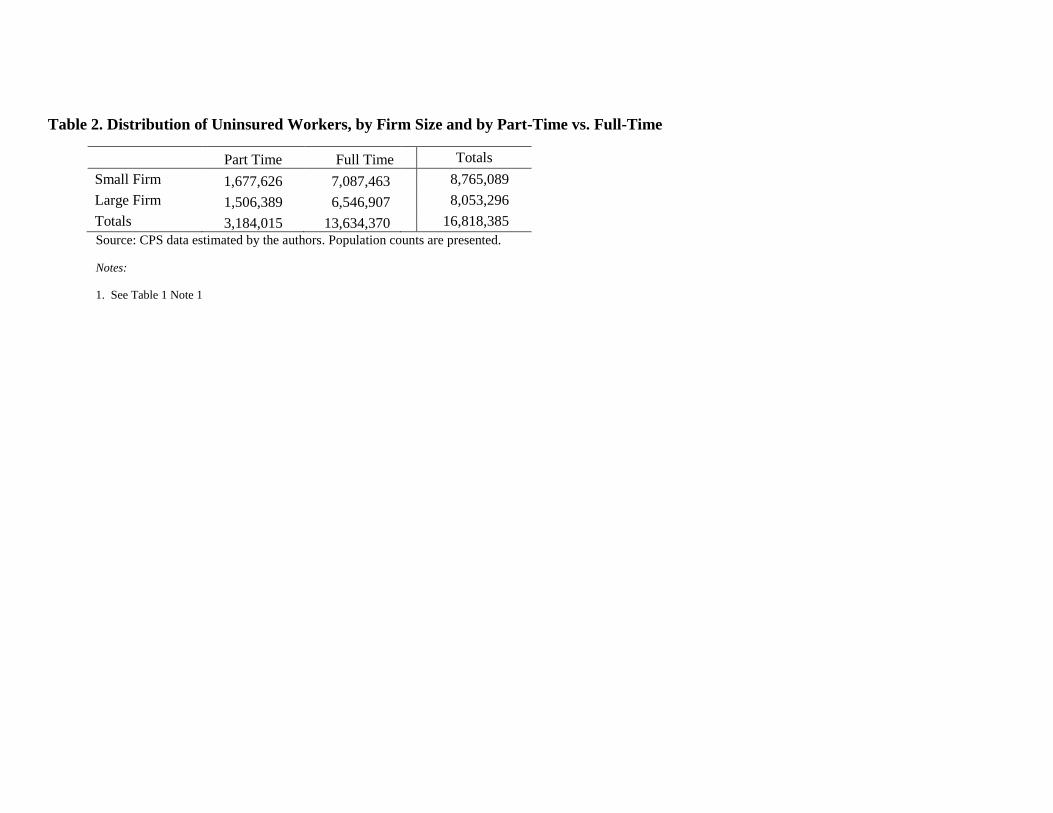
Table 2. Distribution of Uninsured Workers, by Firm Size and by Part-Time vs. Full-Time
Part Time Full Time Totals
Small Firm 1,677,626 7,087,463 8,765,089
Large Firm 1,506,389 6,546,907 8,053,296
Totals 3,184,015 13,634,370 16,818,385
Source: CPS data estimated by the authors. Population counts are presented.
Notes:
1. See Table 1 Note 1
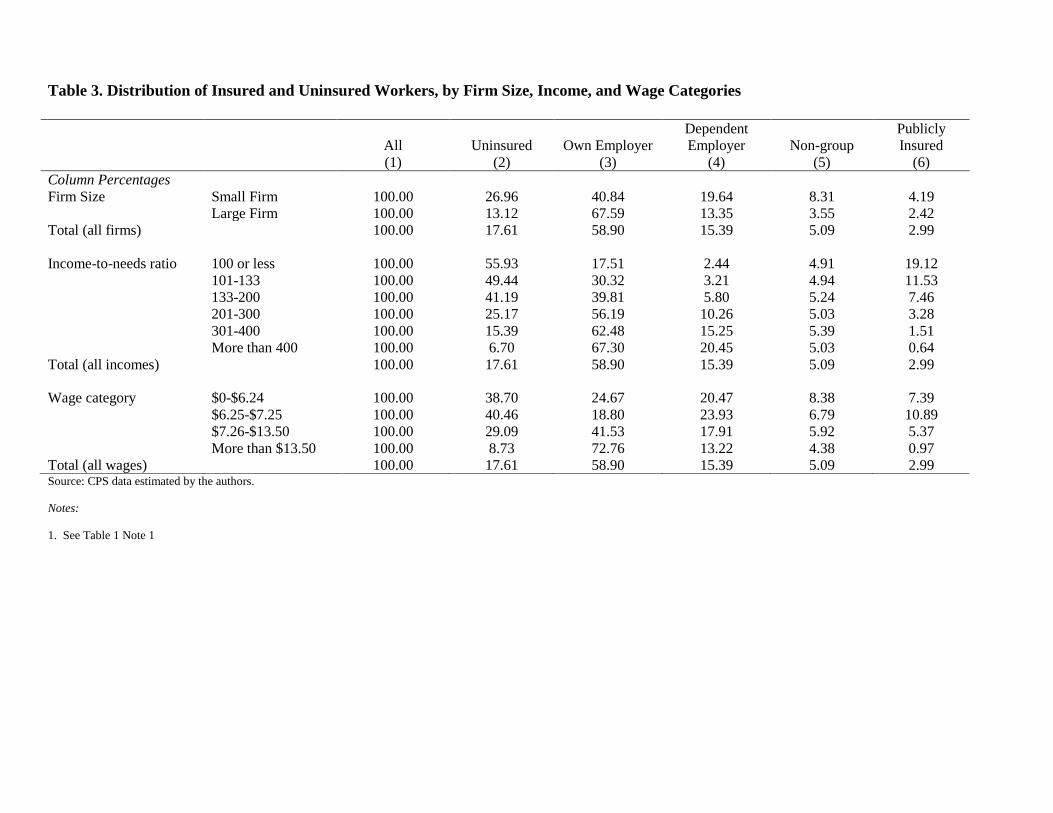
Table 3. Distribution of Insured and Uninsured Workers, by Firm Size, Income, and Wage Categories
Source: CPS data estimated by the authors.
Notes:
1. See Table 1 Note 1
All
(1)
Uninsured
(2)
Own Employer
(3)
Dependent
Employer
(4)
Non-group
(5)
Publicly
Insured
(6)
Column Percentages
Firm Size Small Firm 100.00 26.96 40.84 19.64 8.31 4.19
Large Firm 100.00 13.12 67.59 13.35 3.55 2.42
Total (all firms)
100.00 17.61 58.90 15.39 5.09 2.99
Income-to-needs ratio 100 or less 100.00 55.93 17.51 2.44 4.91 19.12
101-133 100.00 49.44 30.32 3.21 4.94 11.53
133-200 100.00 41.19 39.81 5.80 5.24 7.46
201-300 100.00 25.17 56.19 10.26 5.03 3.28
301-400 100.00 15.39 62.48 15.25 5.39 1.51
More than 400 100.00 6.70 67.30 20.45 5.03 0.64
Total (all incomes)
100.00 17.61 58.90 15.39 5.09 2.99
Wage category $0-$6.24 100.00 38.70 24.67 20.47 8.38 7.39
$6.25-$7.25 100.00 40.46 18.80 23.93 6.79 10.89
$7.26-$13.50 100.00 29.09 41.53 17.91 5.92 5.37
More than $13.50 100.00 8.73 72.76 13.22 4.38 0.97
Total (all wages)
100.00 17.61 58.90 15.39 5.09 2.99

Table 4. Percent of Workers Insured, by Firm Size, Income, and Wage Categories – After Simulated Static Reform Steps
Insured
(Base)
(1)
ESI
(Base)
(2)
Insured
(Employer
Mandate)
(3)
ESI
(Employer
Mandate)
(4)
Insured
(Medicaid
Expanded)
(5)
ESI
(Medicaid
Expanded)
(6)
Insured
(Uninsured
to Exchange)
(7)
ESI
(Uninsured
to Exchange)
(8)
Weighted Percent
82.39 74.29 89.99 81.97 92.73 78.62 99.12 78.62
Number of Observations
30,903 27,895 33,509 30,535 34,491 29,282 36,666 29,282
Population Count
(millions)
78,678,432 70,949,235 85,933,695 78,282,806 88,551,414 75,078,153 94,653,751 75,078,153
Row Percentages
Firm Size Small Firm 73.04 60.49 74.76 62.23 81.04 60.10 97.86 60.10
Large Firm 86.88 80.93 97.31 91.47 98.35 87.52 99.72 87.52
Total (all firms)
82.39 74.29 89.99 81.97 92.73 78.62 99.12 78.62
Income-to-needs ratio 100 or less 44.07 19.95 62.02 37.90 100.00 0.00 100.00 0.00
101-133 50.56 33.53 68.08 51.36 100.00 0.00 100.00 0.00
133-200 58.81 45.61 76.88 63.69 76.88 63.69 100.00 63.69
201-300 74.83 66.45 85.84 77.57 85.84 77.57 100.00 77.57
301-400 84.61 77.74 91.79 84.99 91.79 84.99 100.00 84.99
More than 400 93.30 87.76 96.70 91.24 96.70 91.24 98.32 91.24
Total (all incomes)
82.39 74.29 89.99 81.97 92.73 78.62 99.12 78.62
Wage category $0-$6.24 61.30 45.14 62.13 45.97 76.18 44.24 98.14 44.24
$6.25-$7.25 59.54 42.73 73.90 57.24 84.84 49.33 97.76 49.33
$7.26-$13.50 70.91 59.44 84.21 72.82 88.91 66.43 98.59 66.43
More than $13.50 91.27 85.98 95.41 90.20 96.09 88.82 99.54 88.82
Total (all wages)
82.39 74.29 89.99 81.97 92.73 78.62 99.12 78.62 Source: CPS data estimated by the authors.
Notes:
1. See Table 1 Note 1
2. Employer Mandate column reflects only the effect of having an employer mandate, the Medicaid Expansion column builds on the employer mandate by putting all persons at or below 133% FPL
into Medicaid, and the Uninsured to Exchanges column builds on this further by allowing uninsured individuals to access coverage via the exchange. We assumed that individuals value health
insurance at 10% of income, and became uninsured if what they paid for coverage exceeded this amount.

Table 5. Percent of Workers Insured, by Firm Size, Income, and Wage Categories – After Simulated Dynamic Reform Steps
Narrow, No Premium Adjustments Broad, Full Premium Adjustments
All Insured
(1)
ESI
(2)
Exchange
(3)
All Insured
(4)
ESI
(5)
Exchange
(6)
Weighted Percent 99.12 78.62 10.23 99.05 65.89 22.89
Number of Observations 36,666 29,282 3,474 36,640 23,734 8,996
Population Count (millions) 94,653,751 75,078,153 9,771,176 94,592,220 62,926,138 21,861,660
Row Percentages
Firm Size Small Firm 97.86 60.10 23.58 97.82 48.72 34.92
Large Firm 99.72 87.52 3.81 99.65 74.15 17.11
Total (all firms) 99.12 78.62 10.23 99.05 65.89 22.89
Income-to-needs ratio 100 or less 100.00 0.00 0.00 100.00 0.00 0.00
101-133 100.00 0.00 0.00 100.00 0.00 0.00
133-200 100.00 63.69 27.98 100.00 23.49 68.18
201-300 100.00 77.57 18.26 100.00 41.56 54.27
301-400 100.00 84.99 12.58 99.84 62.37 35.04
More than 400 98.32 91.24 5.62 98.25 91.07 5.71
Total (all incomes) 99.12 78.62 10.23 99.05 65.89 22.89
Wage category $0-$6.24 98.14 44.24 29.06 98.14 34.16 39.14
$6.25-$7.25 97.76 49.33 17.23 97.71 38.12 28.39
$7.26-$13.50 98.59 66.43 14.07 98.53 50.80 29.63
More than $13.50 99.54 88.82 6.82 99.47 77.61 17.97
Total (all wages) 99.12 78.62 10.23 99.05 65.89 22.89 Source: CPS data estimated by the authors.
Notes:
1. See Table 1 Note 1
2. The dynamic scenario allows individuals to choose ESI, exchange coverage or uninsurance, based on several rational decision rules.
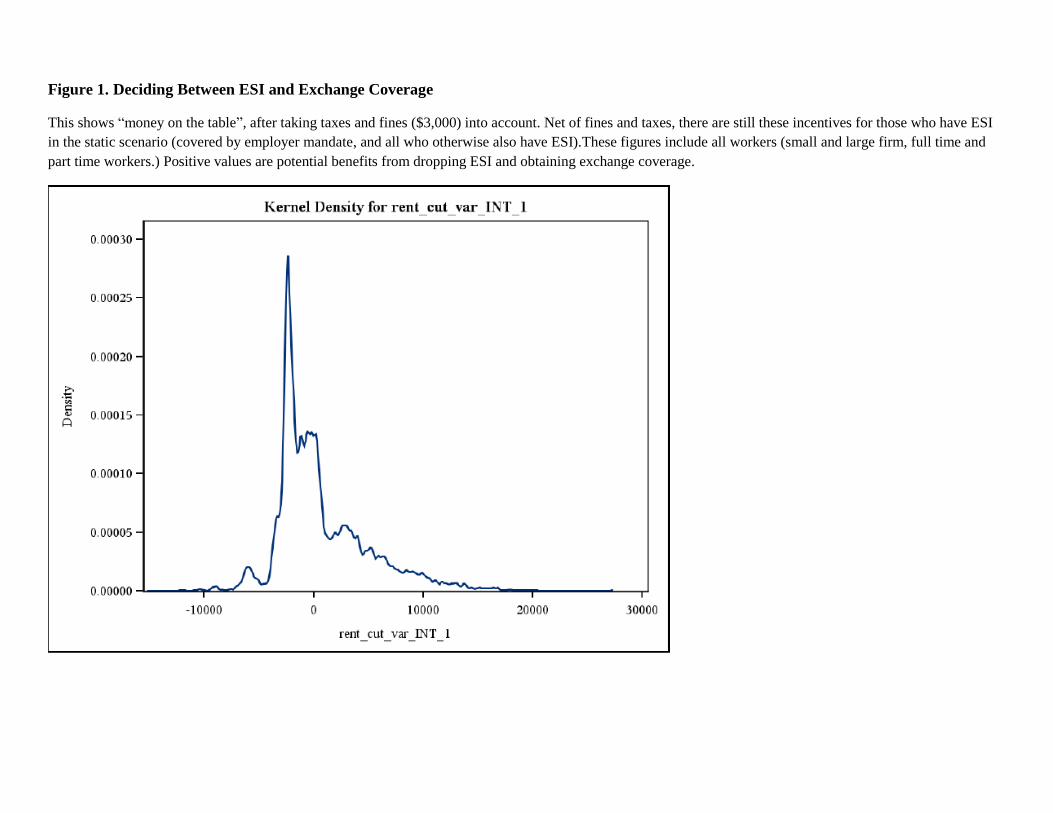
Figure 1. Deciding Between ESI and Exchange Coverage
This shows “money on the table”, after taking taxes and fines ($3,000) into account. Net of fines and taxes, there are still these incentives for those who have ESI
in the static scenario (covered by employer mandate, and all who otherwise also have ESI).These figures include all workers (small and large firm, full time and
part time workers.) Positive values are potential benefits from dropping ESI and obtaining exchange coverage.
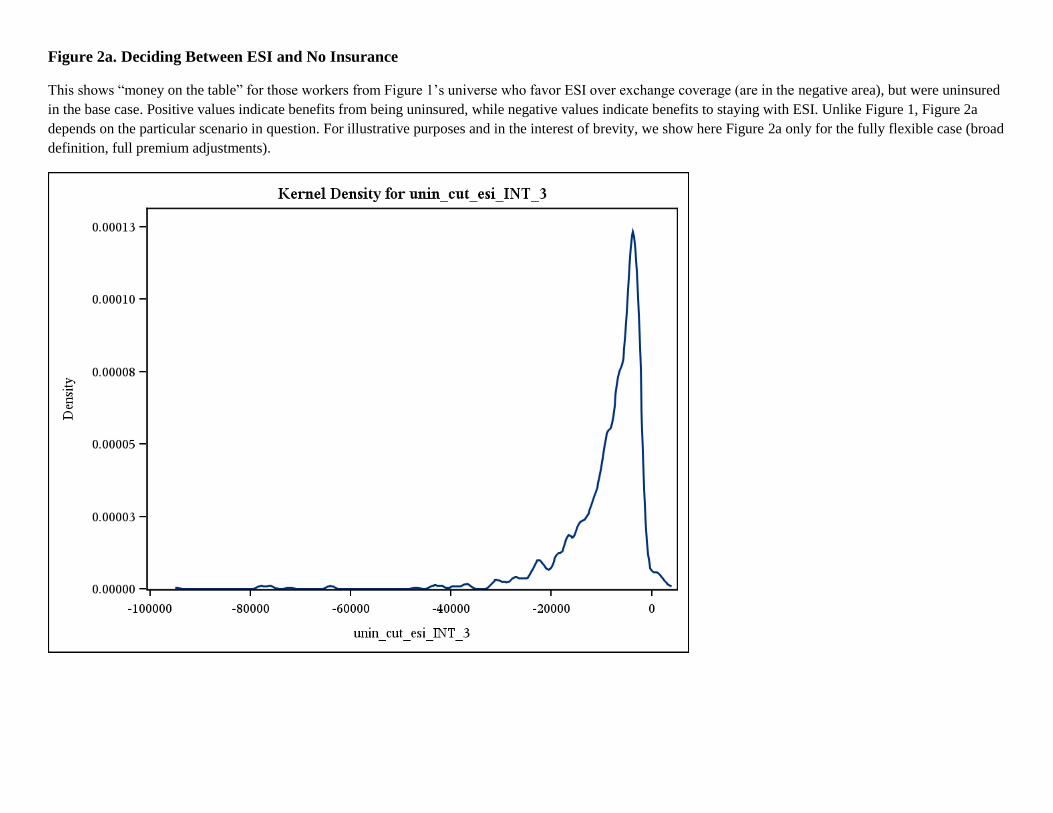
Figure 2a. Deciding Between ESI and No Insurance
This shows “money on the table” for those workers from Figure 1’s universe who favor ESI over exchange coverage (are in the negative area), but were uninsured
in the base case. Positive values indicate benefits from being uninsured, while negative values indicate benefits to staying with ESI. Unlike Figure 1, Figure 2a
depends on the particular scenario in question. For illustrative purposes and in the interest of brevity, we show here Figure 2a only for the fully flexible case (broad
definition, full premium adjustments).

Figure 2b. Deciding Between Exchange Coverage and No Insurance
This shows “money on the table” for those workers from Figure 1’s universe who favor exchange over ESI coverage (are in the positive area), but were uninsured
in the base case. Positive values indicate benefits from being uninsured, while negative values indicate benefits to staying with exchange coverage. Unlike Figure
1, Figure 2b depends on the particular scenario in question. For illustrative purposes and in the interest of brevity, we show here Figure 2b only for the fully
flexible case (broad definition, full premium adjustments).
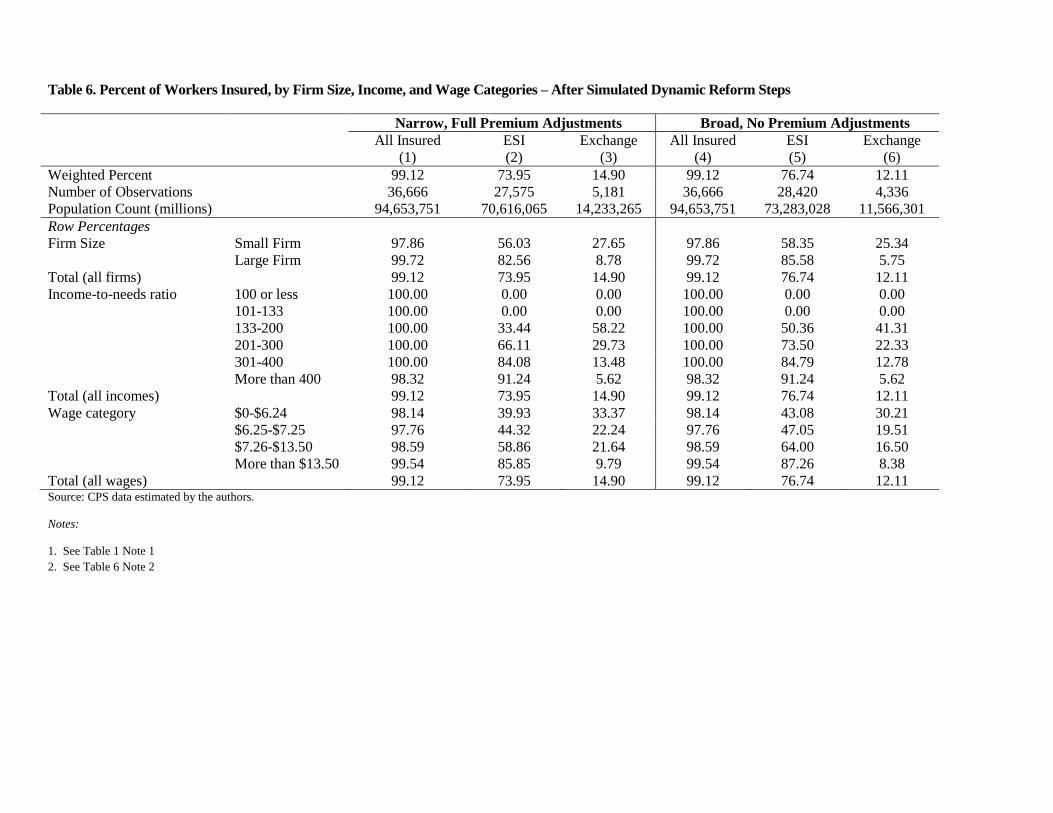
Table 6. Percent of Workers Insured, by Firm Size, Income, and Wage Categories – After Simulated Dynamic Reform Steps
Narrow, Full Premium Adjustments Broad, No Premium Adjustments
All Insured
(1)
ESI
(2)
Exchange
(3)
All Insured
(4)
ESI
(5)
Exchange
(6)
Weighted Percent 99.12 73.95 14.90 99.12 76.74 12.11
Number of Observations 36,666 27,575 5,181 36,666 28,420 4,336
Population Count (millions) 94,653,751 70,616,065 14,233,265 94,653,751 73,283,028 11,566,301
Row Percentages
Firm Size Small Firm 97.86 56.03 27.65 97.86 58.35 25.34
Large Firm 99.72 82.56 8.78 99.72 85.58 5.75
Total (all firms) 99.12 73.95 14.90 99.12 76.74 12.11
Income-to-needs ratio 100 or less 100.00 0.00 0.00 100.00 0.00 0.00
101-133 100.00 0.00 0.00 100.00 0.00 0.00
133-200 100.00 33.44 58.22 100.00 50.36 41.31
201-300 100.00 66.11 29.73 100.00 73.50 22.33
301-400 100.00 84.08 13.48 100.00 84.79 12.78
More than 400 98.32 91.24 5.62 98.32 91.24 5.62
Total (all incomes) 99.12 73.95 14.90 99.12 76.74 12.11
Wage category $0-$6.24 98.14 39.93 33.37 98.14 43.08 30.21
$6.25-$7.25 97.76 44.32 22.24 97.76 47.05 19.51
$7.26-$13.50 98.59 58.86 21.64 98.59 64.00 16.50
More than $13.50 99.54 85.85 9.79 99.54 87.26 8.38
Total (all wages) 99.12 73.95 14.90 99.12 76.74 12.11 Source: CPS data estimated by the authors.
Notes:
1. See Table 1 Note 1
2. See Table 6 Note 2
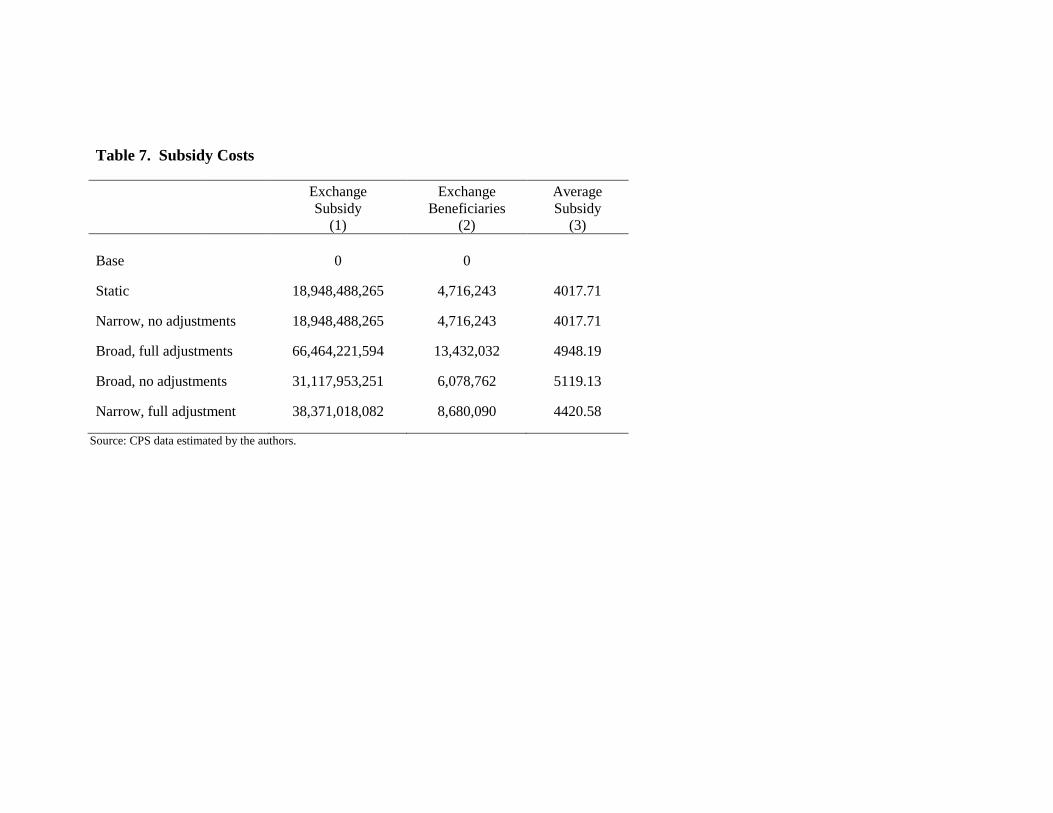
Table 7. Subsidy Costs
Exchange
Subsidy
(1)
Exchange
Beneficiaries
(2)
Average
Subsidy
(3)
Base
0 0
Static
18,948,488,265 4,716,243 4017.71
Narrow, no adjustments 18,948,488,265 4,716,243 4017.71
Broad, full adjustments 66,464,221,594 13,432,032 4948.19
Broad, no adjustments 31,117,953,251 6,078,762 5119.13
Narrow, full adjustment 38,371,018,082 8,680,090 4420.58
Source: CPS data estimated by the authors.
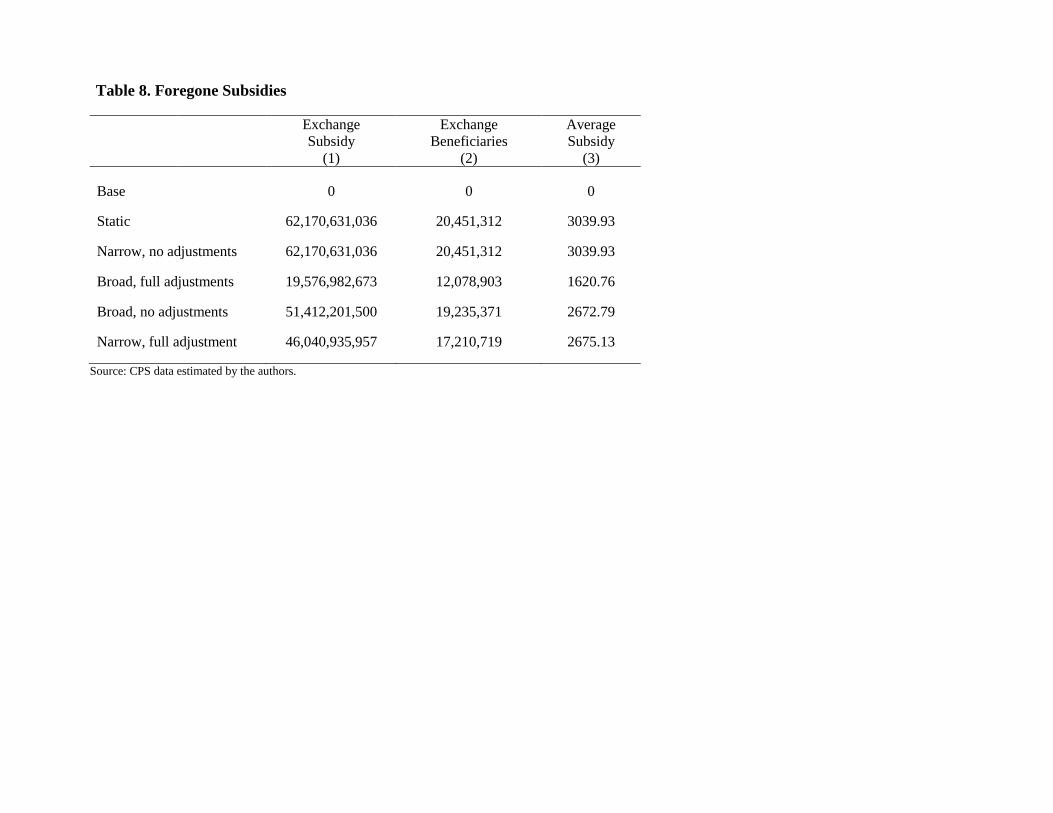
Table 8. Foregone Subsidies
Exchange
Subsidy
(1)
Exchange
Beneficiaries
(2)
Average
Subsidy
(3)
Base
0 0 0
Static
62,170,631,036 20,451,312 3039.93
Narrow, no adjustments 62,170,631,036 20,451,312 3039.93
Broad, full adjustments 19,576,982,673 12,078,903 1620.76
Broad, no adjustments 51,412,201,500 19,235,371 2672.79
Narrow, full adjustment 46,040,935,957 17,210,719 2675.13
Source: CPS data estimated by the authors.

Table A-1. Number of Workers: Firm Size, Income and Wage Categories by Insurance Status
All
(1)
Uninsured
(2)
Own Employer
(3)
Dependent
Employer
(4)
Non-group
(5)
Publicly
Insured
(6)
Weighted Percent 100.00 17.61 58.90 15.39 5.09 2.99
Number of Observations 36,950 6,047 21,619 6,276 1,809 1,242
Population Count 95,496,817 16,818,385 56,252,143 14,697,092 4,864,240 2,856,417
Firm Size Small Firm 31,006,012 8,359,146 12,663,940 6,090,728 2,576,803 1,298,432
Large Firm 64,490,805 8,459,239 43,588,202 8,606,365 2,287,436 1,557,984
Total (all firms) 95,496,817 16,818,385 56,252,143 14,697,092 4,864,240 2,856,417
Income-to-needs ratio 100 or less 4,340,427 2,427,547 760,036 105,781 213,180 829,831
101-133 3,036,811 1,501,296 920,877 97,430 150,095 350,066
133-200 8,786,121 3,618,571 3,497,625 509,901 460,379 655,600
201-300 14,604,018 3,675,763 8,205,781 1,499,029 734,001 479,154
301-400 14,482,678 2,228,727 9,049,458 2,209,096 780,170 218,567
More than 400 50,246,763 3,366,480 33,818,366 10,275,855 2,526,414 323,198
Total (all incomes) 95,496,817 16,818,385 56,252,143 14,697,092 4,864,240 2,856,417
Wage category $0-$6.24 2,289,247 885,871 564,704 468,659 191,741 169,176
$6.25-$7.25 3,218,338 1,302,258 605,120 770,182 218,553 350,447
$7.26-$13.50 33,281,578 9,682,068 13,823,305 5,960,226 1,969,456 1,787,043
More than $13.50 56,707,654 4,948,188 41,259,013 7,498,025 2,484,489 549,750
Total (all wages) 95,496,817 16,818,385 56,252,143 14,697,092 4,864,240 2,856,417 Source: CPS data estimated by the authors.
Notes:
1. See Table 1 Note 1
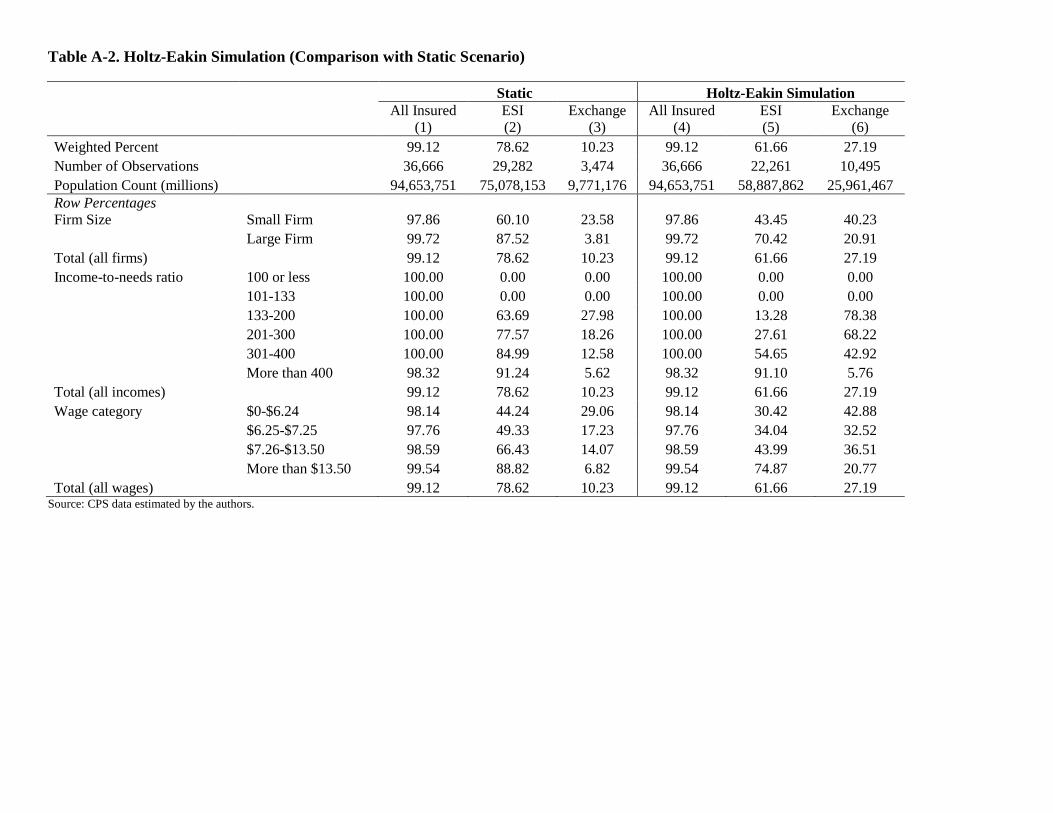
Table A-2. Holtz-Eakin Simulation (Comparison with Static Scenario)
Static Holtz-Eakin Simulation
All Insured
(1)
ESI
(2)
Exchange
(3)
All Insured
(4)
ESI
(5)
Exchange
(6)
Weighted Percent
99.12 78.62 10.23 99.12 61.66 27.19
Number of Observations
36,666 29,282 3,474 36,666 22,261 10,495
Population Count (millions)
94,653,751 75,078,153 9,771,176 94,653,751 58,887,862 25,961,467
Row Percentages
Firm Size Small Firm 97.86 60.10 23.58 97.86 43.45 40.23
Large Firm 99.72 87.52 3.81 99.72 70.42 20.91
Total (all firms)
99.12 78.62 10.23 99.12 61.66 27.19
Income-to-needs ratio 100 or less 100.00 0.00 0.00 100.00 0.00 0.00
101-133 100.00 0.00 0.00 100.00 0.00 0.00
133-200 100.00 63.69 27.98 100.00 13.28 78.38
201-300 100.00 77.57 18.26 100.00 27.61 68.22
301-400 100.00 84.99 12.58 100.00 54.65 42.92
More than 400 98.32 91.24 5.62 98.32 91.10 5.76
Total (all incomes)
99.12 78.62 10.23 99.12 61.66 27.19
Wage category $0-$6.24 98.14 44.24 29.06 98.14 30.42 42.88
$6.25-$7.25 97.76 49.33 17.23 97.76 34.04 32.52
$7.26-$13.50 98.59 66.43 14.07 98.59 43.99 36.51
More than $13.50 99.54 88.82 6.82 99.54 74.87 20.77
Total (all wages)
99.12 78.62 10.23 99.12 61.66 27.19 Source: CPS data estimated by the authors.

Table A-3: Static and Dynamic Case Definitions
Cases Type Definition
Static No individuals who are offered ESI attempt to
obtain subsidized exchange coverage.
Dynamic Narrow definition , current premiums Affordable coverage rule is defined as single
coverage only, and employer/employee ratio of
premiums cannot change.
Broad definition, new premiums Affordable coverage rule is defined as single or
family coverage as applicable to the workers
family situation and employer/employee ratio
of premiums can change.
Narrow definition, new premiums Affordable coverage rule is defined as single
coverage only, and employer/employee ratio of
premiums can change.
Broad definition, current premiums Affordable coverage rule is defined as single or
family coverage as applicable to the workers
family situation and employer/employee ratio
of premiums cannot change.
1090 Vermont Avenue, NW Suite 800Washington, DC 20005
www.EPIonline.org
Tel: 202.463.7650Fax: 202.463.7107


