An Open Science Community Approach to Observational Research: Lessons from the Observational Health Data Sciences and Informatics (OHDSI) collaborative Patrick Ryan, PhD Janssen Research and Development Columbia University Medical Center 12 July 2017
Transcript
An Open Science Community Approach to Observational Research: Lessons from the Observational Health Data Sciences and Informatics (OHDSI) collaborative
Patrick Ryan, PhDJanssen Research and DevelopmentColumbia University Medical Center
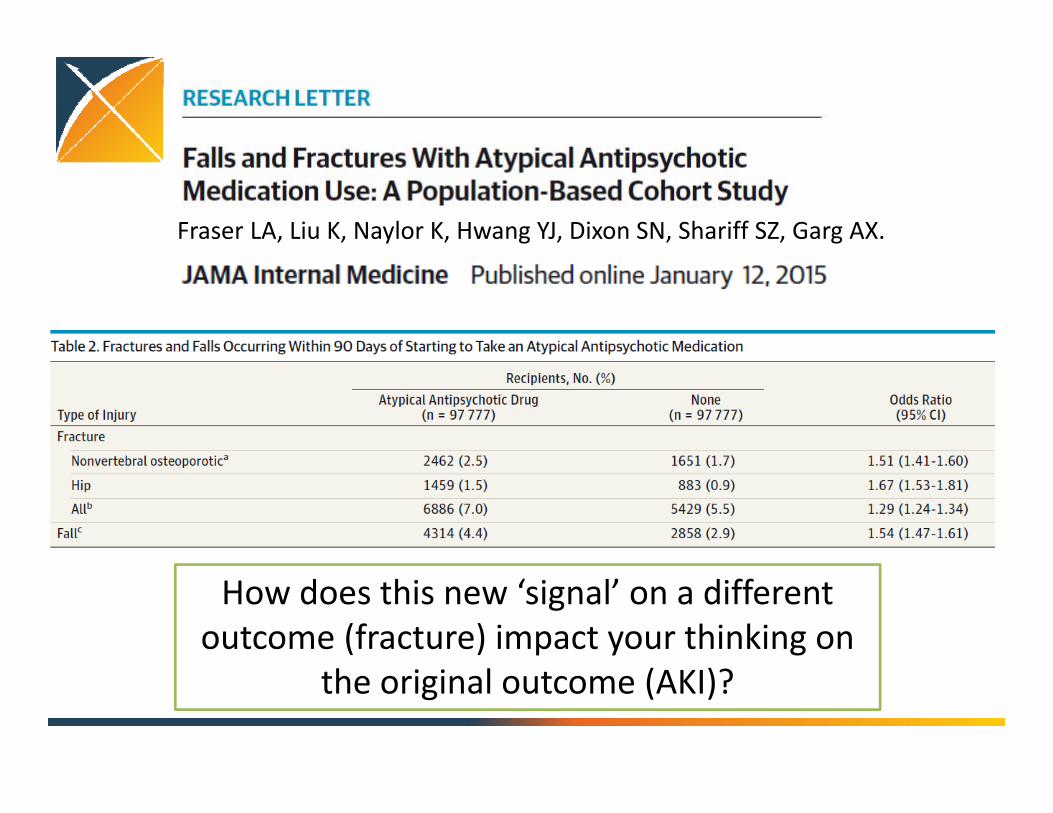
How does this new ‘signal’ on a different outcome (fracture) impact your thinking on
the original outcome (AKI)?
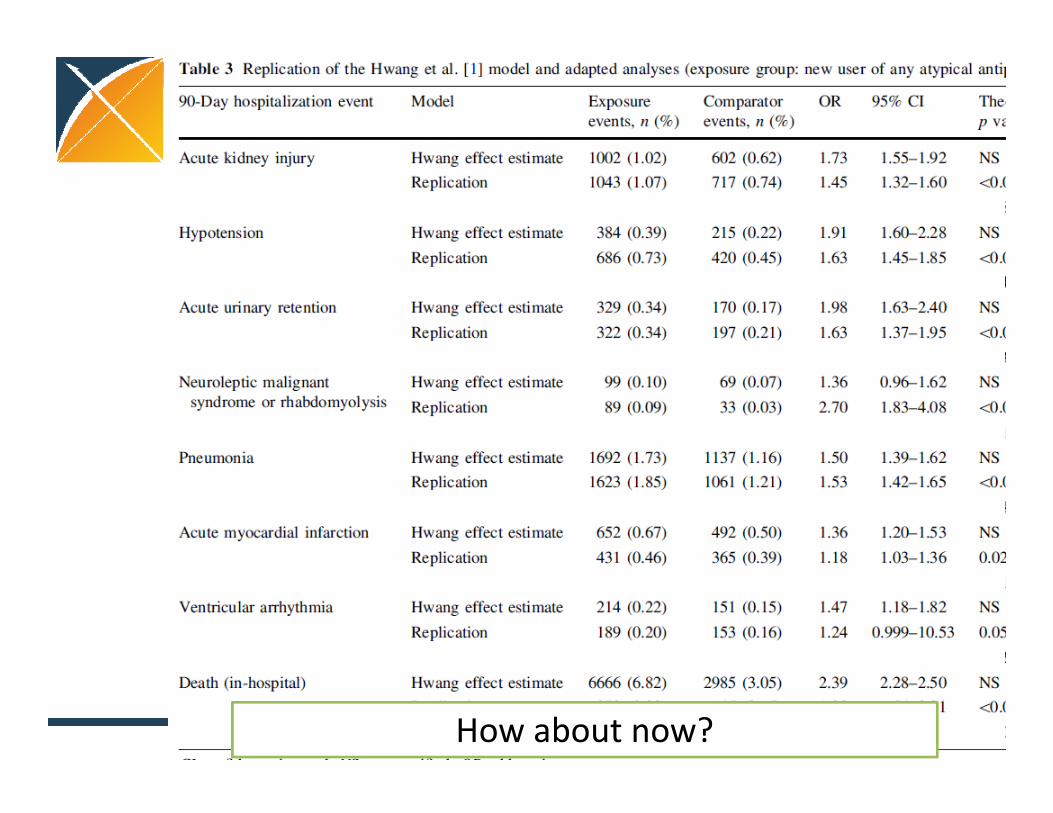
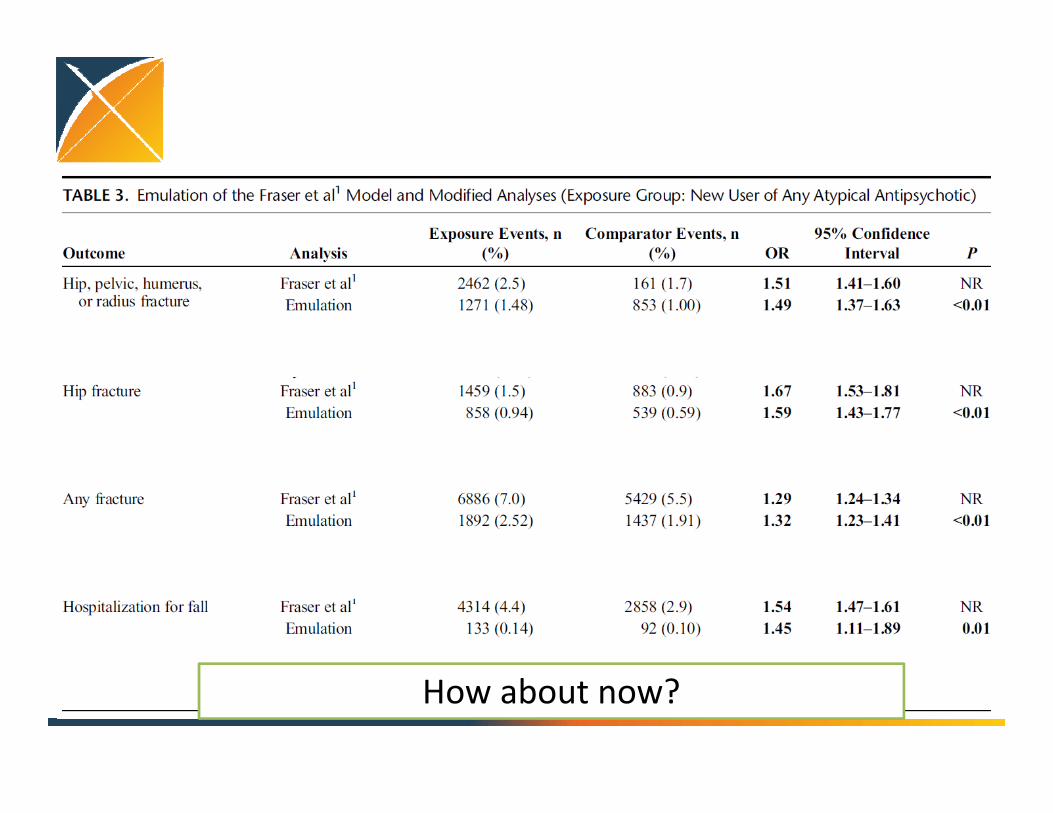
How about now?
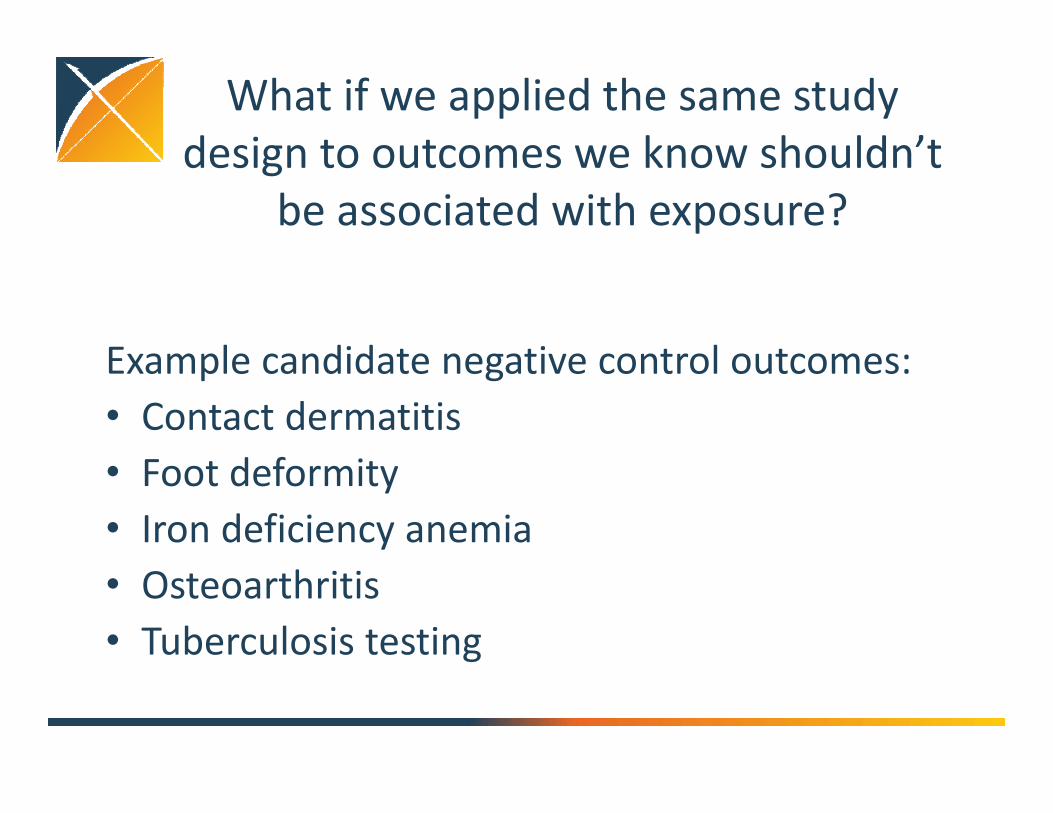
What if we applied the same study design to outcomes we know shouldn’t
be associated with exposure?
Example candidate negative control outcomes:• Contact dermatitis• Foot deformity• Iron deficiency anemia• Osteoarthritis• Tuberculosis testing
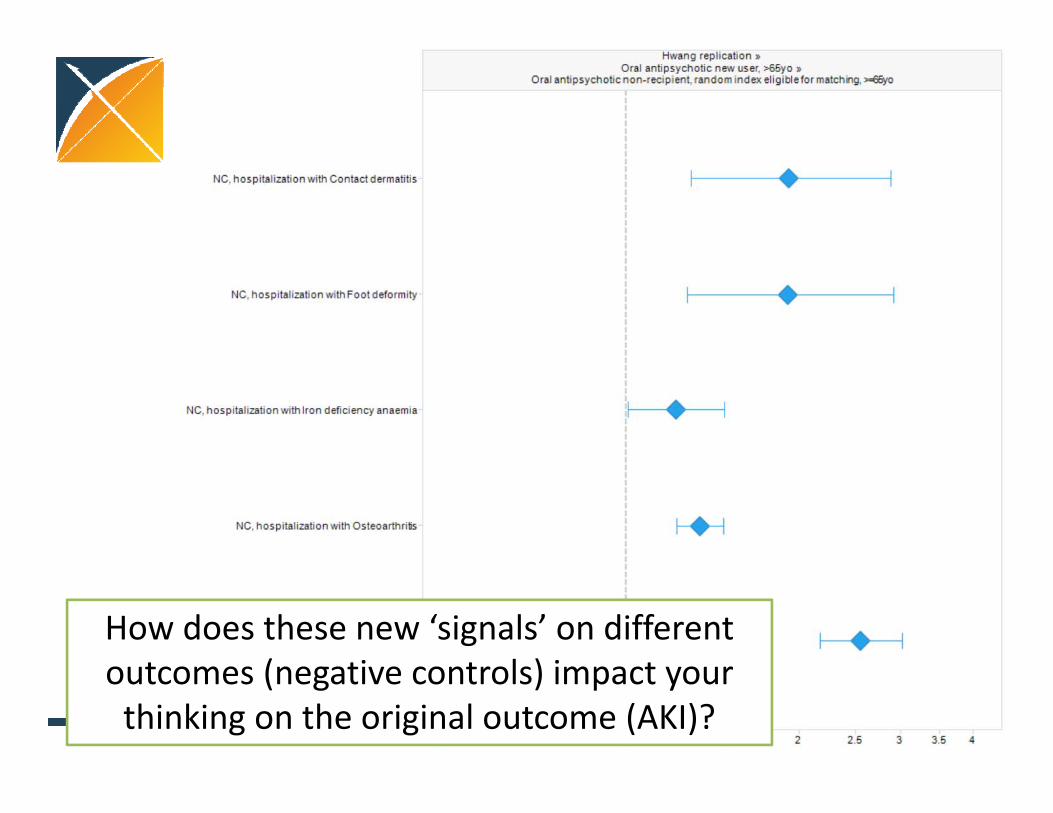
How does these new ‘signals’ on different outcomes (negative controls) impact your thinking on the original outcome (AKI)?
If I mix together the estimates of the ‘AKI‐related effects’ with the ‘negative control outcomes’, can you figure out which is
which?
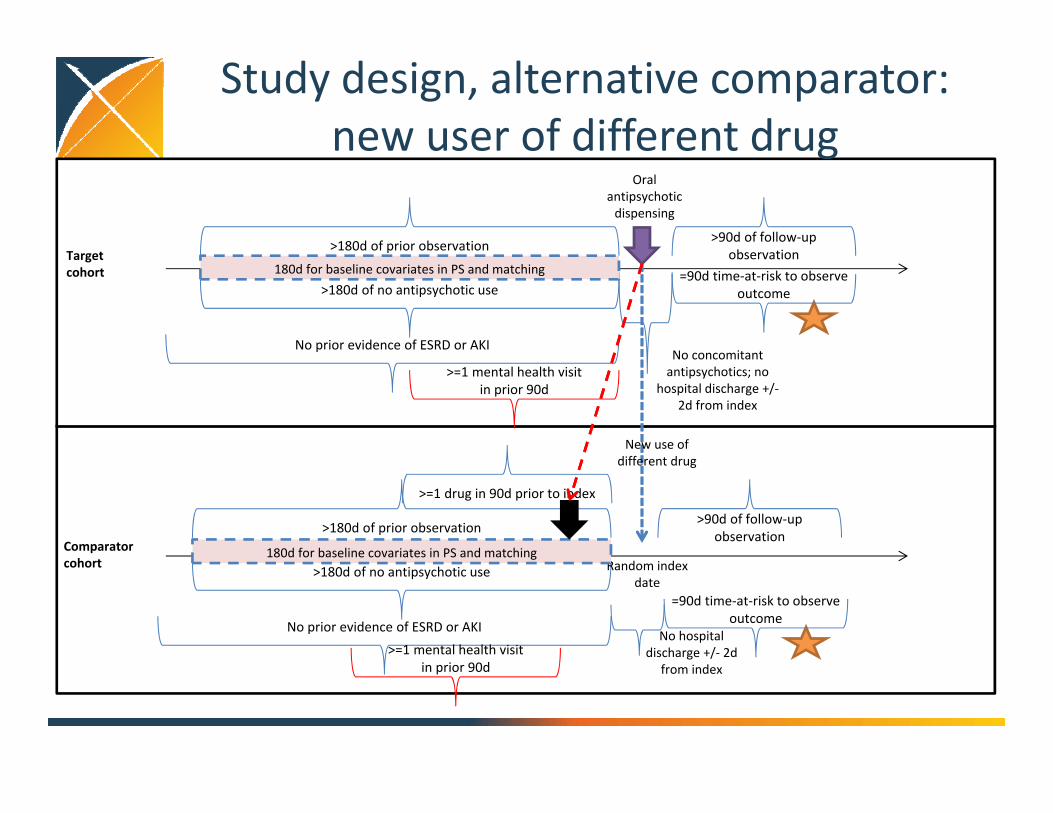
Study design, alternative comparator: new user of different drug
Target cohort
Oral antipsychoticdispensing
>180d of prior observation
>180d of no antipsychotic use
>90d of follow‐up observation
=90d time‐at‐risk to observe outcome
No prior evidence of ESRD or AKINo concomitant antipsychotics; no
hospital discharge +/‐2d from index
180d for baseline covariates in PS and matching
Comparator cohort
>180d of prior observation
>180d of no antipsychotic use
No prior evidence of ESRD or AKINo hospital
discharge +/‐ 2d from index
Random index date
>90d of follow‐up observation
180d for baseline covariates in PS and matching
=90d time‐at‐risk to observe outcome
>=1 drug in 90d prior to index
New use of different drug
>=1 mental health visit in prior 90d
>=1 mental health visit in prior 90d
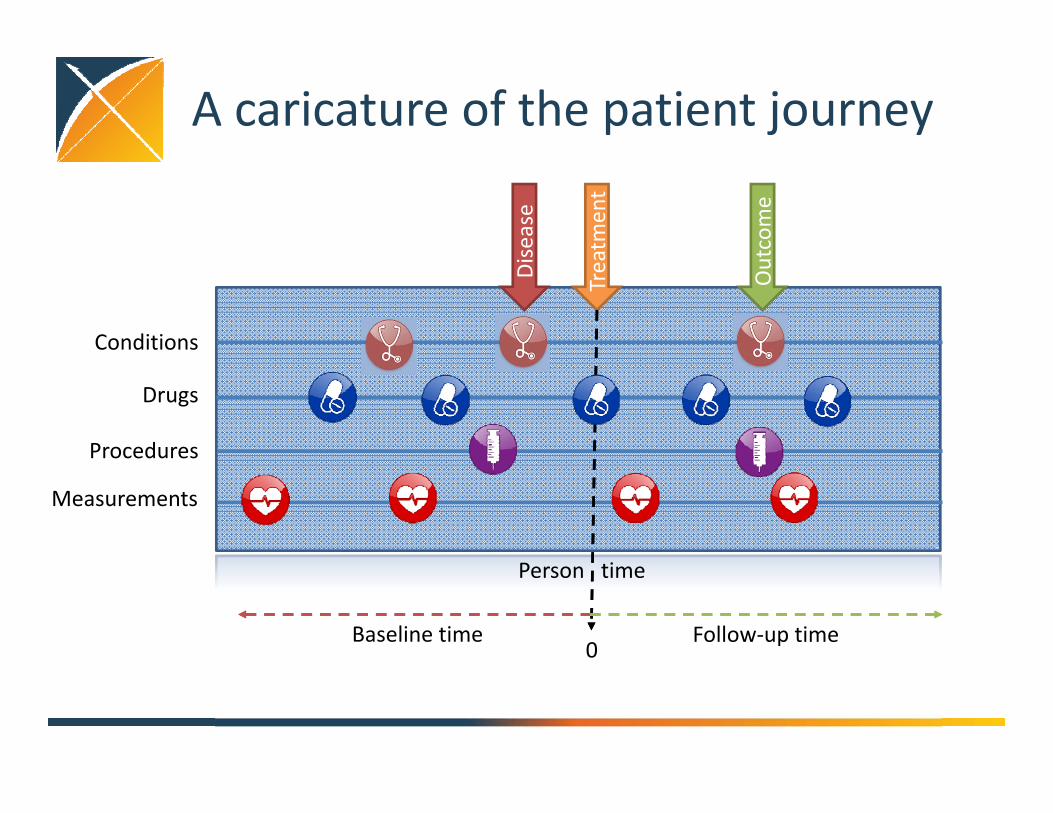
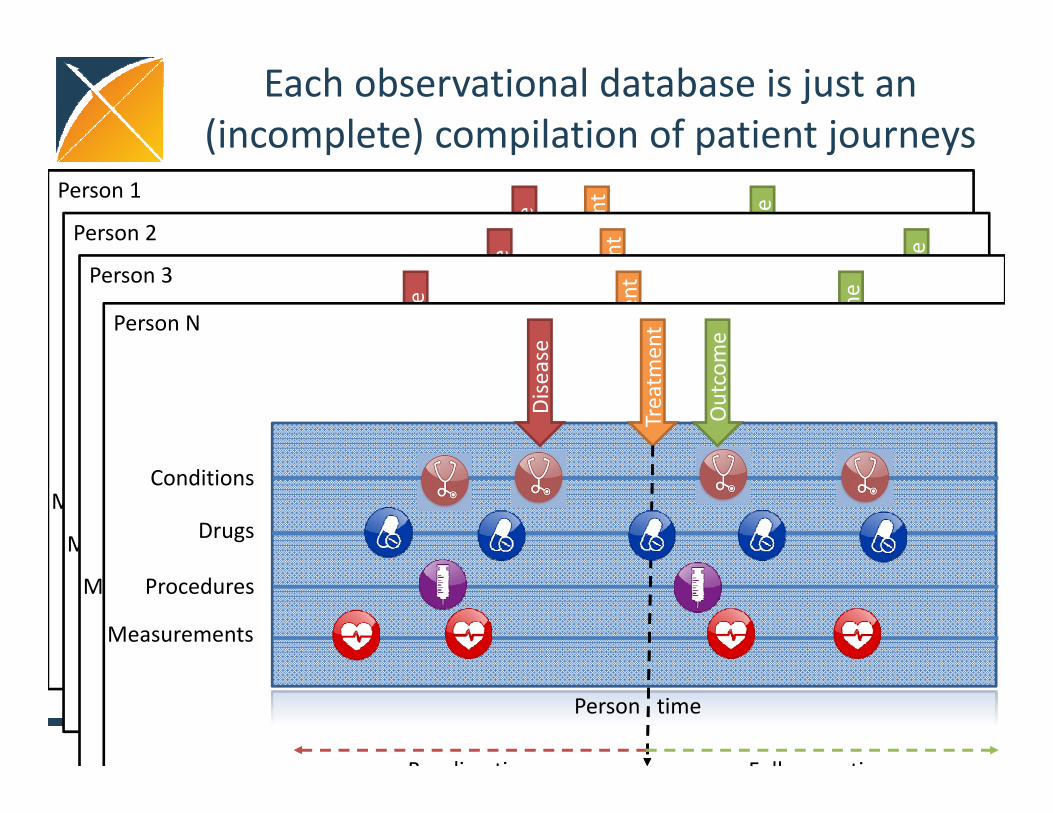
A caricature of the patient journey
Conditions
Drugs
Procedures
Measurements
Person time
Disease
Treatm
ent
Outcome
0Baseline time Follow‐up time
Each observational database is just an (incomplete) compilation of patient journeys
Person 1
Conditions
Drugs
Procedures
Measurements
Person time
Disease
Treatm
ent
Outcome
0Baseline time Follow‐up time
Person 2
Conditions
Drugs
Procedures
Measurements
Person time
Disease
Treatm
ent
Outcome
0Baseline time Follow‐up time
Person 3
Conditions
Drugs
Procedures
Measurements
Person time
Disease
Treatm
ent
Outcome
0Baseline time Follow‐up time
Person N
Conditions
Drugs
Procedures
Measurements
Person time
Disease
Treatm
ent
Outcome
Baseline time F ll ti
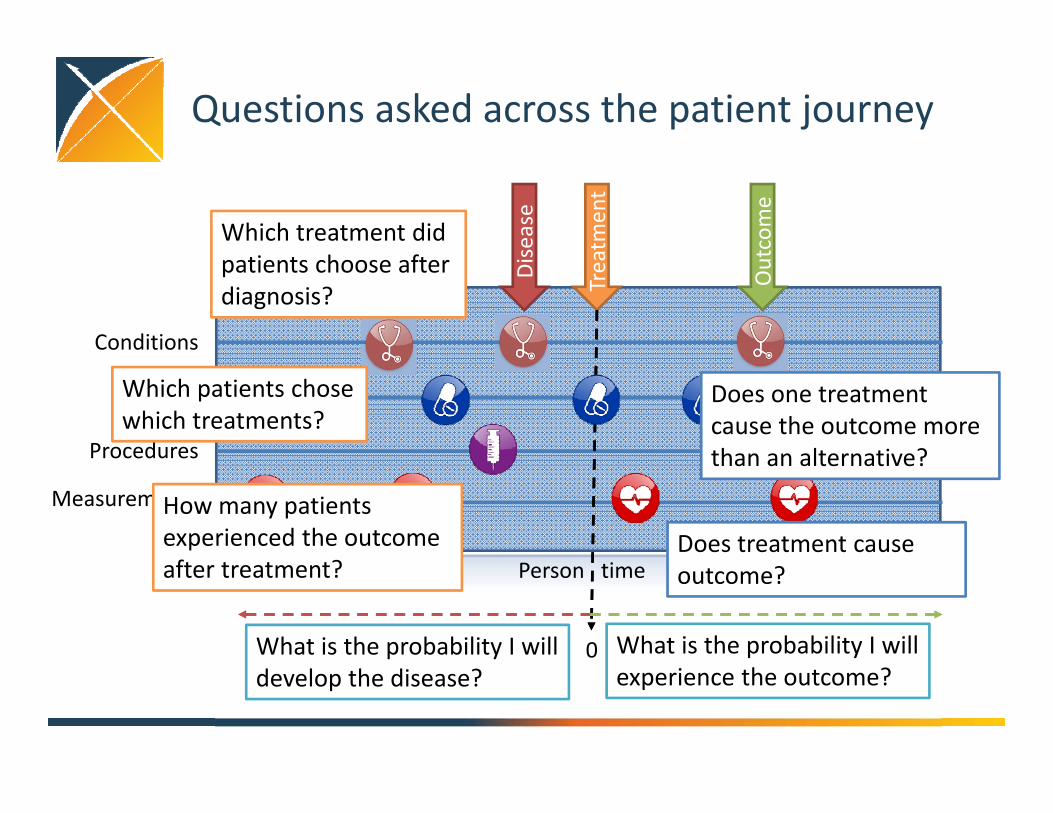
Questions asked across the patient journey
Conditions
Drugs
Procedures
Measurements
Person time
Disease
Treatm
ent
Outcome
0Baseline time Follow‐up time
Which treatment did patients choose after diagnosis?
Which patients chose which treatments?
How many patients experienced the outcome after treatment?
What is the probability I will experience the outcome?
Does treatment cause outcome?
Does one treatment cause the outcome more than an alternative?
What is the probability I will develop the disease?
Classifying questions across the patient journey
• Clinical characterization: What happened to them?– What treatment did they choose after diagnosis?– Which patients chose which treatments?– How many patients experienced the outcome after treatment?
• Patient‐level prediction: What will happen to me?– What is the probability that I will develop the disease?– What is the probability that I will experience the outcome?
• Population‐level effect estimation: What are the causal effects?– Does treatment cause outcome?– Does one treatment cause the outcome more than an alternative?
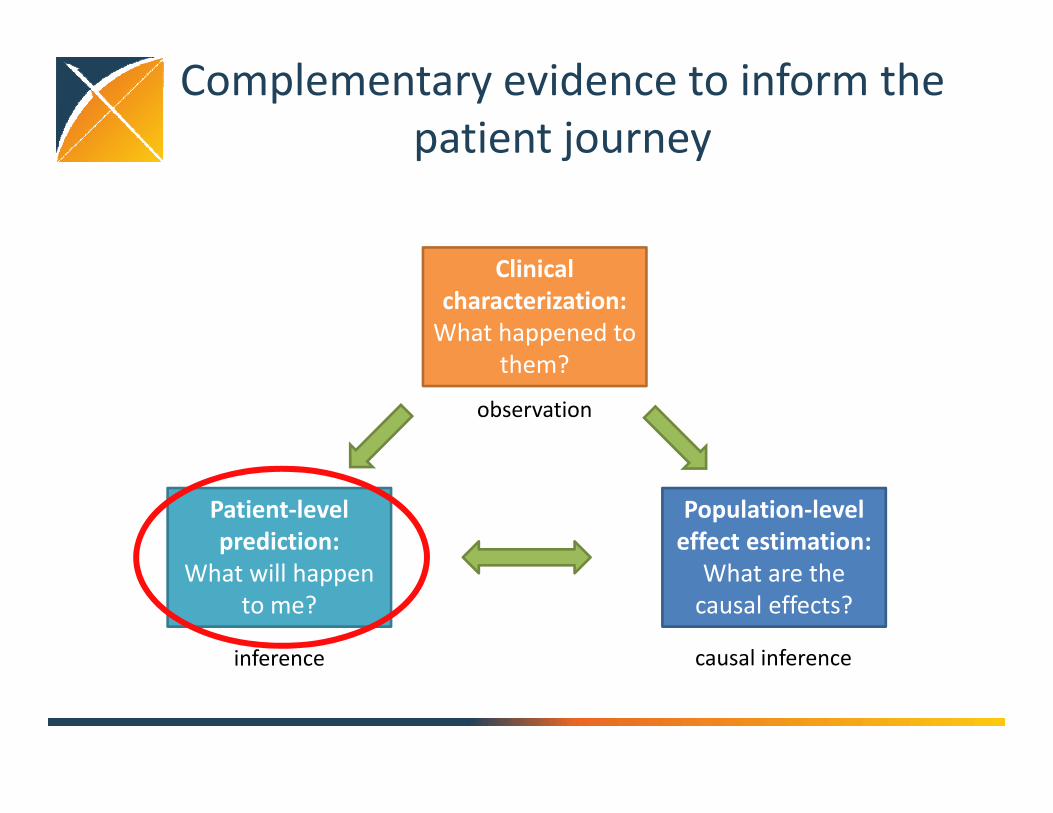
Complementary evidence to inform the patient journey
Clinical characterization:What happened to
them?
Patient‐level prediction:
What will happen to me?
Population‐level effect estimation:
What are the causal effects?
inference causal inference
observation
Introducing OHDSI
• The Observational Health Data Sciences and Informatics (OHDSI) program is a multi‐stakeholder, interdisciplinary collaborative to create open‐source solutions that bring out the value of observational health data through large‐scale analytics
• OHDSI has established an international network of researchers and observational health databases with a central coordinating center housed at Columbia University
http://ohdsi.org
OHDSI’s mission
To improve health, by empowering a community to collaboratively generate the evidence that promotes better health decisions and better
care.
http://ohdsi.org
What is OHDSI’s strategy to deliver reliable evidence?
• Methodological research– Develop new approaches to observational data analysis– Evaluate the performance of new and existing methods– Establish empirically‐based scientific best practices
• Open‐source analytics development– Design tools for data transformation and standardization– Implement statistical methods for large‐scale analytics– Build interactive visualization for evidence exploration
• Clinical evidence generation – Identify clinically‐relevant questions that require real‐world evidence– Execute research studies by applying scientific best practices through
open‐source tools across the OHDSI international data network– Promote open‐science strategies for transparent study design and
evidence dissemination
OHDSI community
OHDSI Collaborators:• >140 researchers in academia, industry, government, health systems• >20 countries• Multi‐disciplinary expertise: epidemiology, statistics, medical
informatics, computer science, machine learning, clinical sciencesDatabases converted to OMOP CDM within OHDSI Community:• >50 databases• >660 million patients
Drug safety surveillanceDevice safety surveillanceVaccine safety surveillance
Comparative effectivenessHealth economicsQuality of care Clinical research
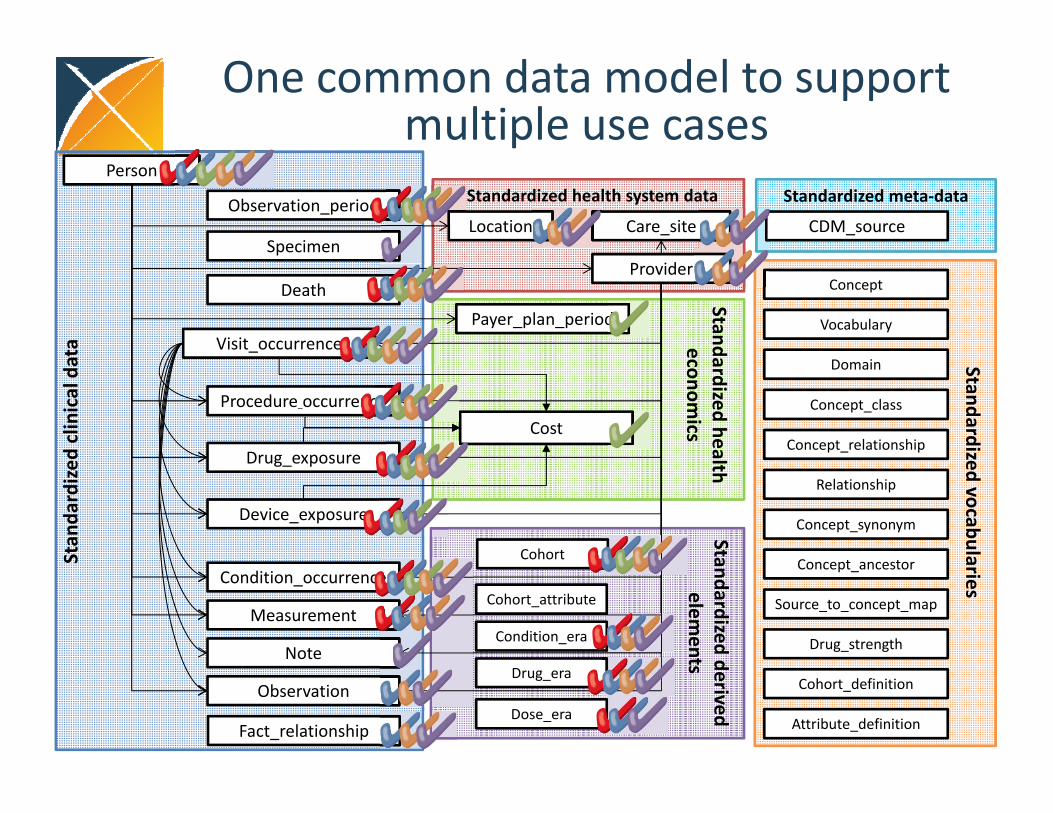
One common data model to support multiple use cases
Concept
Concept_relationship
Concept_ancestor
Vocabulary
Source_to_concept_map
Relationship
Concept_synonym
Drug_strength
Cohort_definition
Standardized vocabularies
Attribute_definition
Domain
Concept_class
Cohort
Dose_era
Condition_era
Drug_era
Cohort_attribute
Standardized derived elem
ents
Stan
dardize
d clinical data
Drug_exposure
Condition_occurrence
Procedure_occurrence
Visit_occurrence
Measurement
Observation_period
Payer_plan_period
Provider
Care_siteLocation
Death
Cost
Device_exposure
Observation
Note
Standardized health system data
Fact_relationship
SpecimenCDM_source
Standardized meta‐data
Standardized health econom
ics
Person
Complementary evidence to inform the patient journey
Clinical characterization:What happened to
them?
Patient‐level prediction:
What will happen to me?
Population‐level effect estimation:
What are the causal effects?
inference causal inference
observation
How should patients with major depressive disorder be treated?
How are patients with major depressive disorder ACTUALLY treated?
Hripcsak et al, PNAS, 2016
OHDSI participating data partnersCode Name Description Size (M)AUSOM Ajou University School of Medicine South Korea; inpatient hospital
EHR2
CCAE MarketScan Commercial Claims and Encounters
US private‐payer claims 119
CPRD UK Clinical Practice Research Datalink UK; EHR from general practice 11
CUMC Columbia University Medical Center US; inpatient EHR 4
GE GE Centricity US; outpatient EHR 33
INPC Regenstrief Institute, Indiana Network for Patient Care
US; integrated health exchange 15
JMDC Japan Medical Data Center Japan; private‐payer claims 3
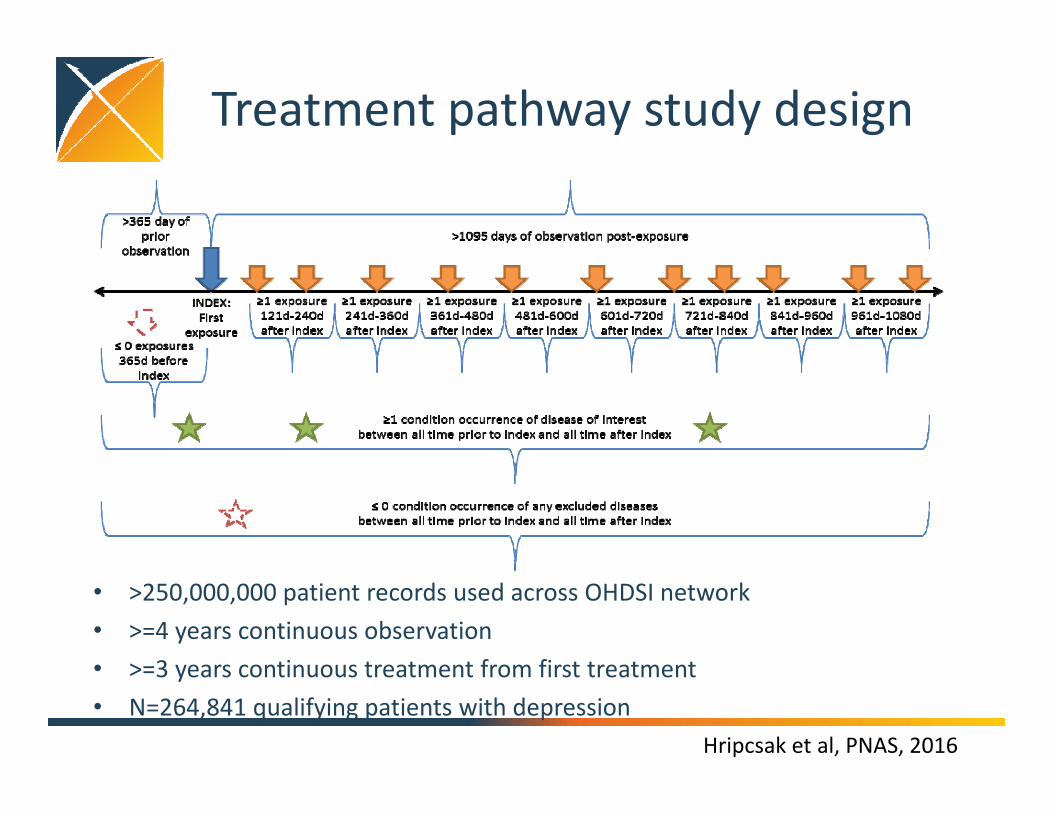
• >250,000,000 patient records used across OHDSI network• >=4 years continuous observation• >=3 years continuous treatment from first treatment• N=264,841 qualifying patients with depression
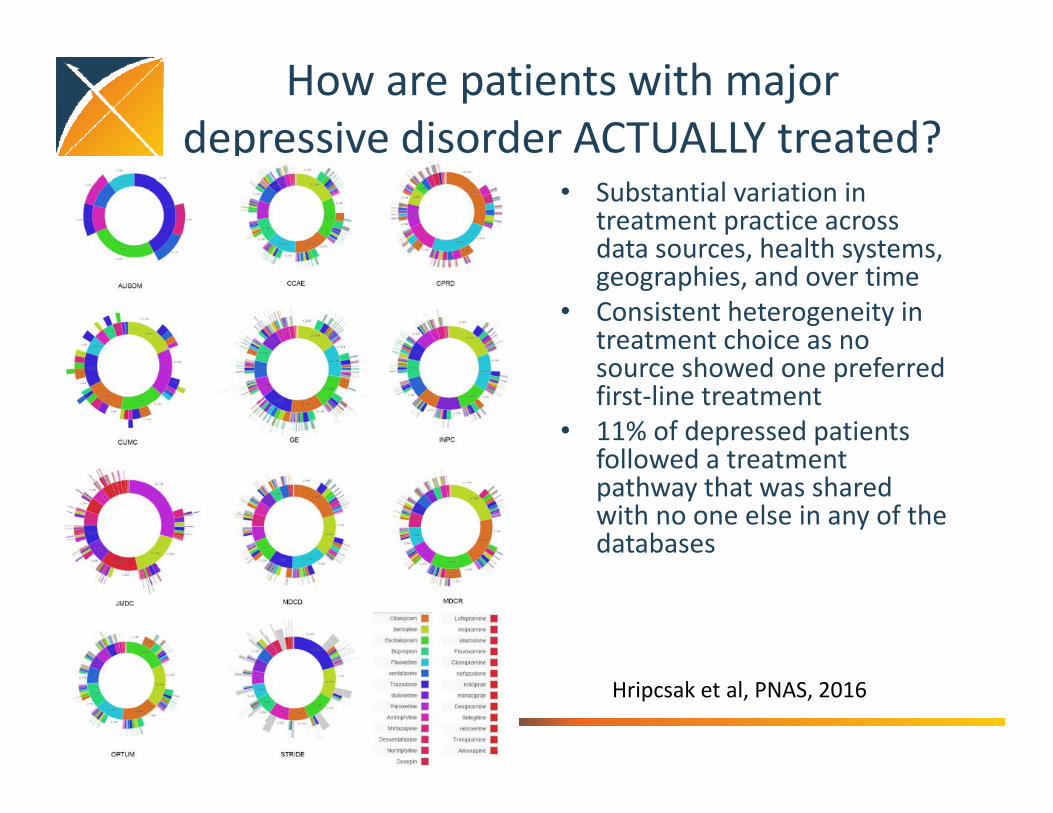
How are patients with major depressive disorder ACTUALLY treated?
• Substantial variation in treatment practice across data sources, health systems, geographies, and over time
• Consistent heterogeneity in treatment choice as no source showed one preferred first‐line treatment
• 11% of depressed patients followed a treatment pathway that was shared with no one else in any of the databases
Hripcsak et al, PNAS, 2016
Type 2 Diabetes Mellitus Hypertension Depression
OPTUM
GE
MDCDCUMC
INPC
MDCR
CPRD
JMDC
CCAE
One standardized approach can be applied to multiple clinical areas
Hripcsak et al, PNAS, 2016
Complementary evidence to inform the patient journey
Clinical characterization:What happened to
them?
Patient‐level prediction:
What will happen to me?
Population‐level effect estimation:
What are the causal effects?
inference causal inference
observation
Demo the current state of population‐level effect estimation in the literature
https://schuemie.shinyapps.io/ShinyApp/
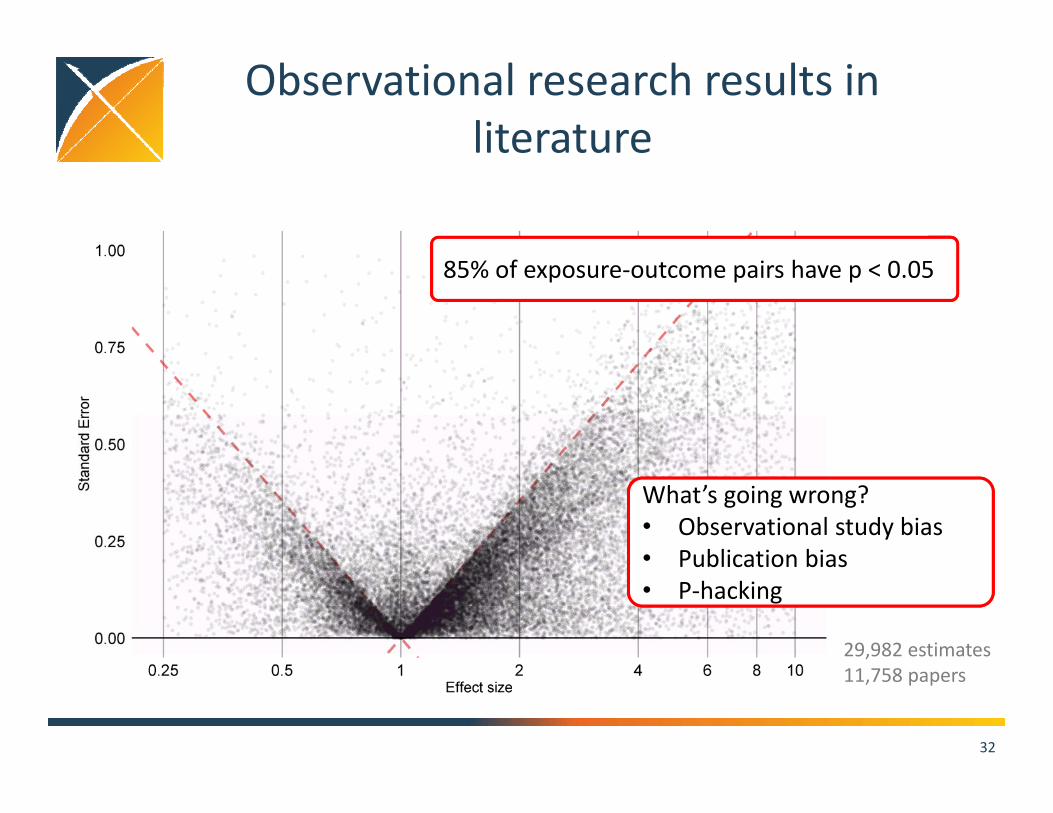
Observational research results in literature
32
85% of exposure‐outcome pairs have p < 0.05
29,982 estimates11,758 papers
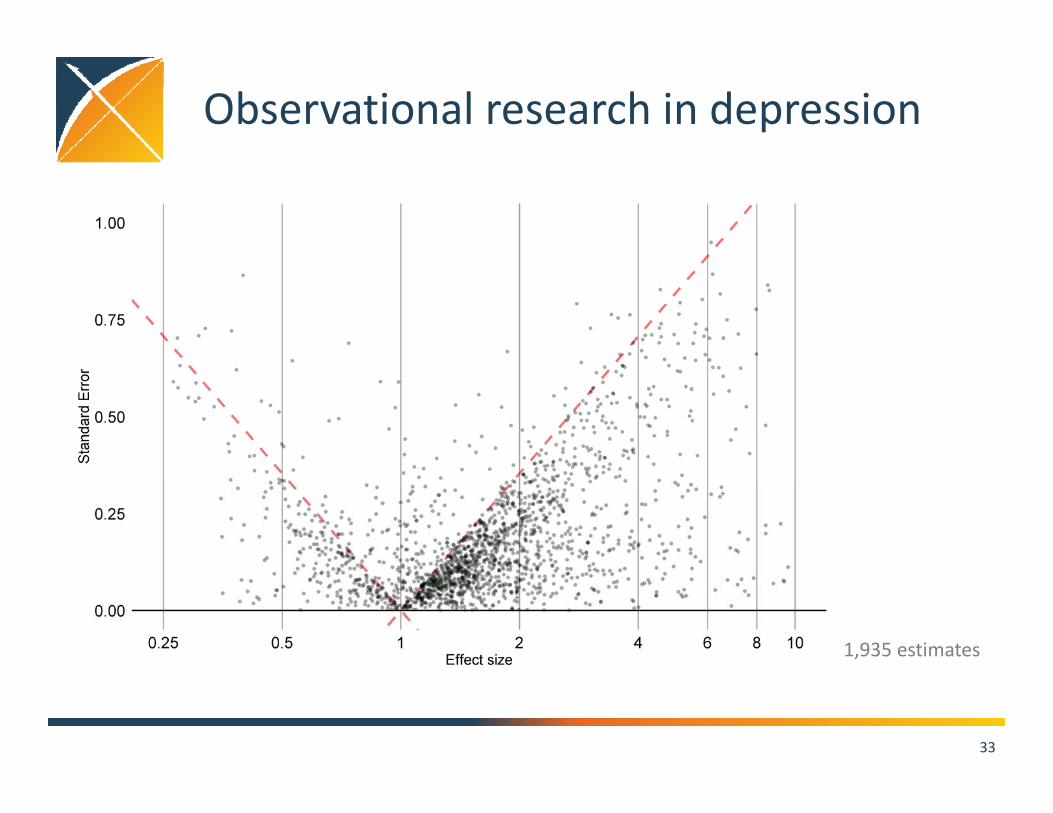
What’s going wrong?• Observational study bias• Publication bias• P‐hacking
Observational research in depression
33
1,935 estimates
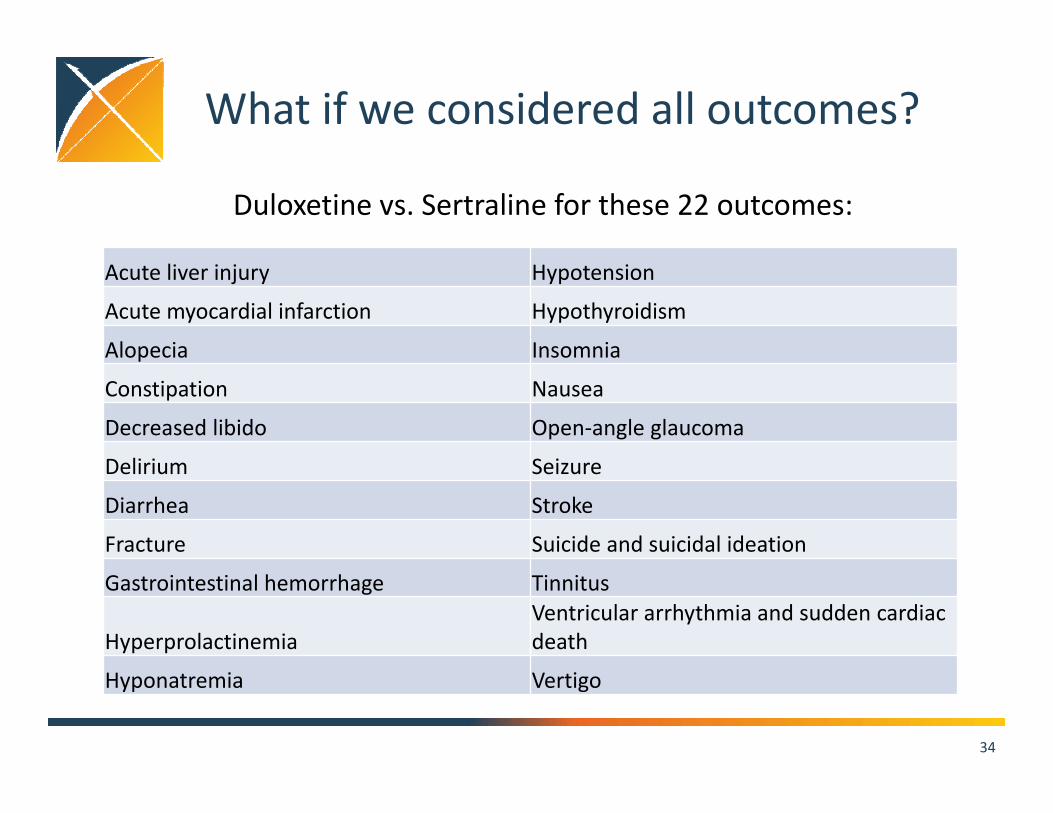
What if we considered all outcomes?
34
Acute liver injury Hypotension
Acute myocardial infarction Hypothyroidism
Alopecia Insomnia
Constipation Nausea
Decreased libido Open‐angle glaucoma
Delirium Seizure
Diarrhea Stroke
Fracture Suicide and suicidal ideation
Gastrointestinal hemorrhage Tinnitus
HyperprolactinemiaVentricular arrhythmia and sudden cardiac death
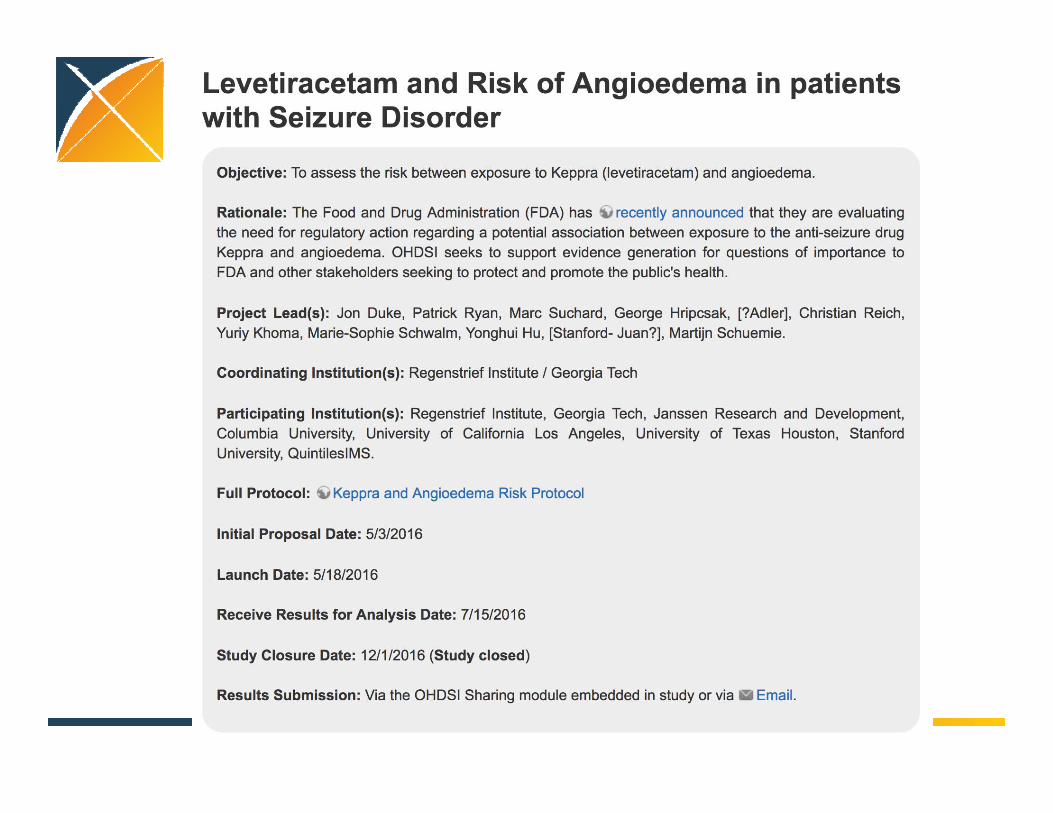
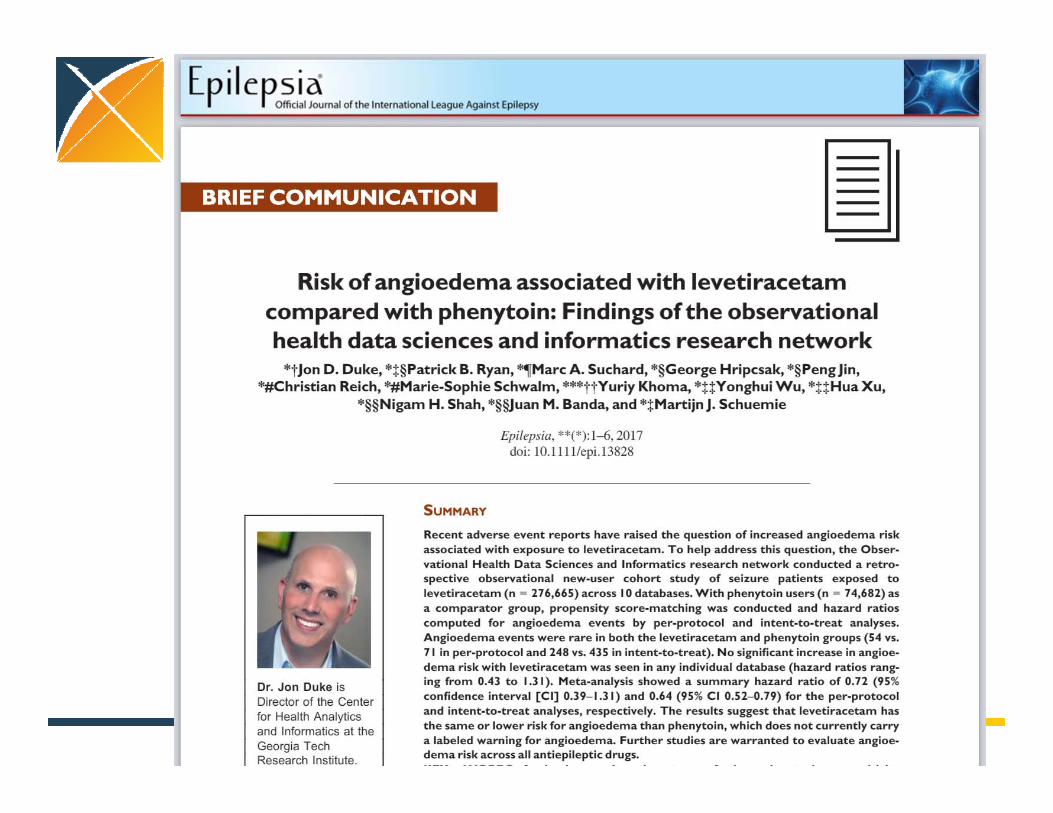
• To identify residual bias, calculated HRs for 100 negative controls in order to compute calibrated p‐values for angioedema in each dataset
• Performed meta‐analysis and evaluated heterogeneity between databases
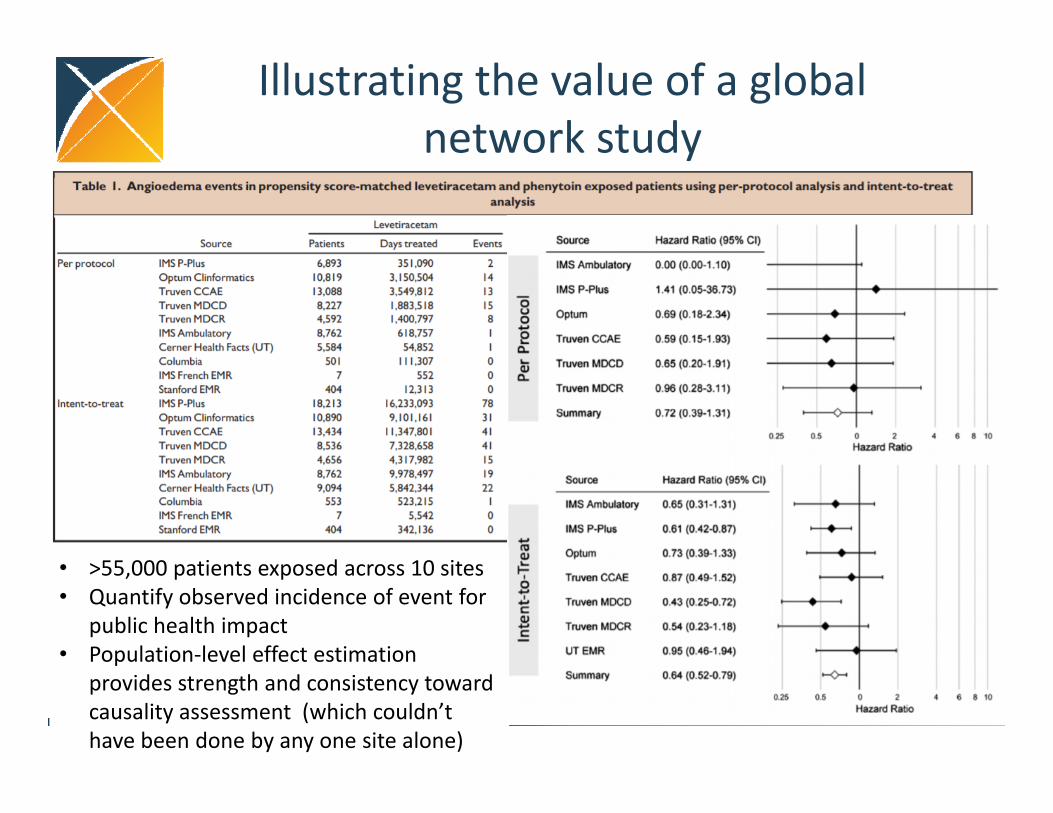
• >55,000 patients exposed across 10 sites• Quantify observed incidence of event for
public health impact• Population‐level effect estimation
provides strength and consistency toward causality assessment (which couldn’t have been done by any one site alone)
Illustrating the value of a global network study
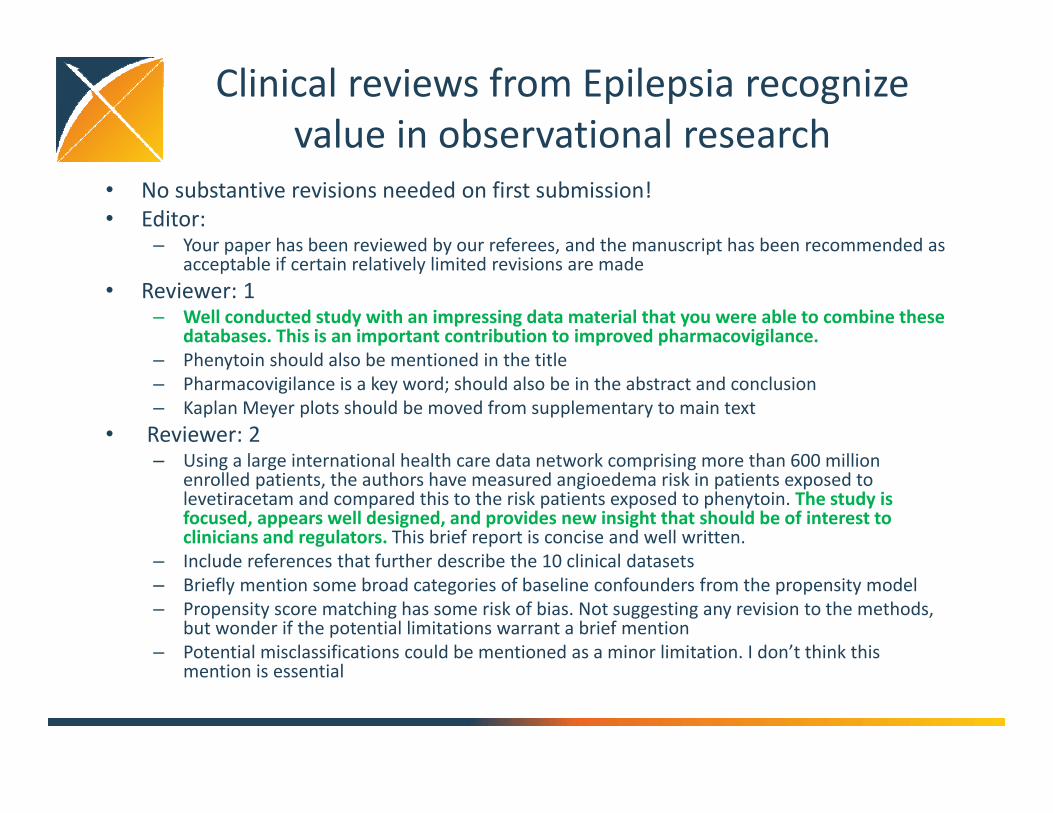
Clinical reviews from Epilepsia recognize value in observational research
• No substantive revisions needed on first submission!• Editor:
– Your paper has been reviewed by our referees, and the manuscript has been recommended as acceptable if certain relatively limited revisions are made
• Reviewer: 1– Well conducted study with an impressing data material that you were able to combine these
databases. This is an important contribution to improved pharmacovigilance.– Phenytoin should also be mentioned in the title– Pharmacovigilance is a key word; should also be in the abstract and conclusion– Kaplan Meyer plots should be moved from supplementary to main text
• Reviewer: 2– Using a large international health care data network comprising more than 600 million
enrolled patients, the authors have measured angioedema risk in patients exposed to levetiracetam and compared this to the risk patients exposed to phenytoin. The study is focused, appears well designed, and provides new insight that should be of interest to clinicians and regulators. This brief report is concise and well written.
– Include references that further describe the 10 clinical datasets– Briefly mention some broad categories of baseline confounders from the propensity model– Propensity score matching has some risk of bias. Not suggesting any revision to the methods,
but wonder if the potential limitations warrant a brief mention– Potential misclassifications could be mentioned as a minor limitation. I don’t think this
mention is essential
Complementary evidence to inform the patient journey
Clinical characterization:What happened to
them?
Patient‐level prediction:
What will happen to me?
Population‐level effect estimation:
What are the causal effects?
inference causal inference
observation
Populations can be used to accurately predict outcomes for individuals
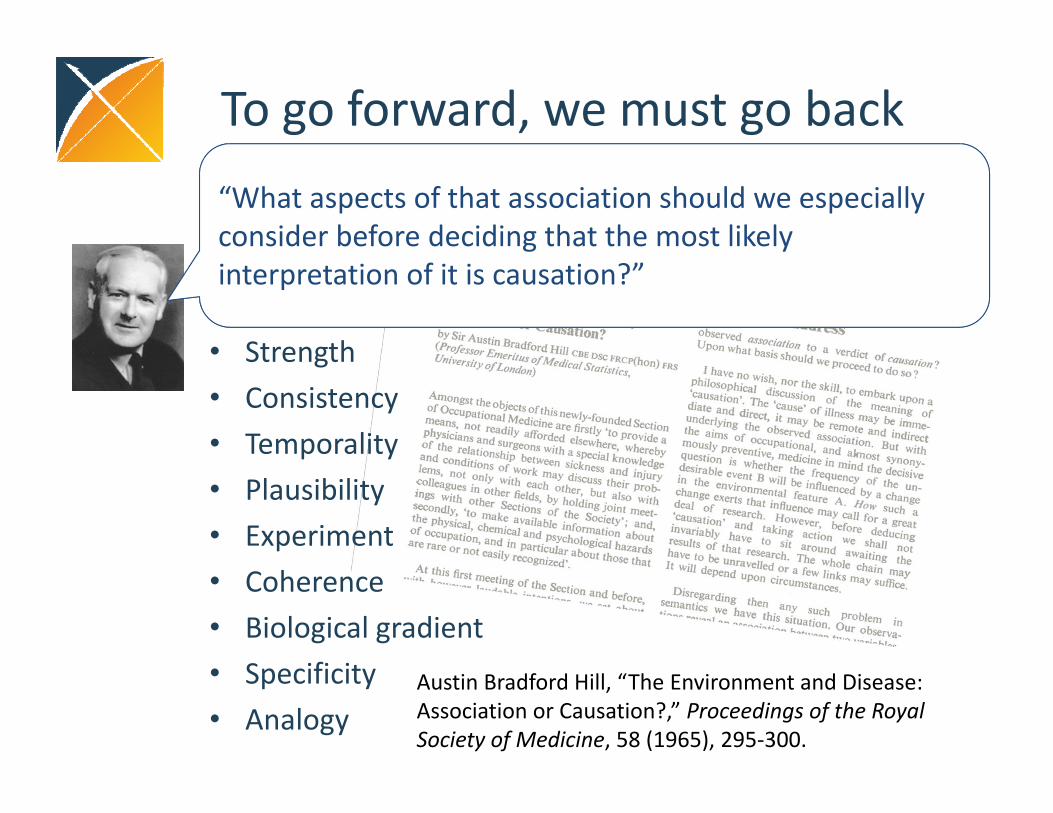
Austin Bradford Hill, “The Environment and Disease: Association or Causation?,” Proceedings of the Royal Society of Medicine, 58 (1965), 295‐300.
“What aspects of that association should we especially consider before deciding that the most likely interpretation of it is causation?”
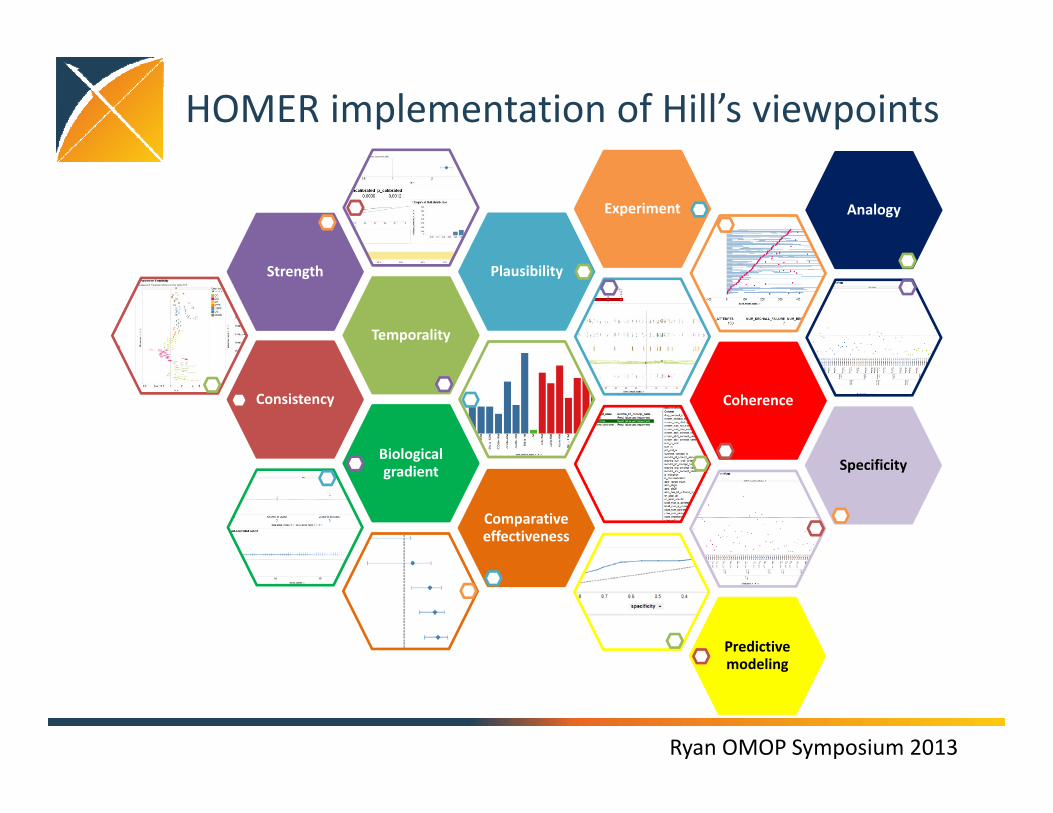
• Health Outcomes and Medical Effectiveness Research (HOMER) system
• Live, interactive evidence exploration system with fully functional implementations of all of the components of Sir Bradford Hill’s viewpoints for risk identification and assessment, plus some additional components designed by the OMOP team