Page 1
Free and Open Source Software for Geospatial (FOSS4G)Conference Proceedings
Volume 15 Seoul, South Korea Article 44
2015
An Open-Source WebGIS Platform for RapidDisaster Impact AssessmentRoya OlyazadehInstitute of Earth Sciences, University of Lausanne
Zar Chi AyeInstitute of Earth Sciences, University of Lausanne
Michel JaboyedoffInstitute of Earth Sciences, University of Lausanne
Marc-Henri DerronInstitute of Earth Sciences, University of Lausanne
Follow this and additional works at: https://scholarworks.umass.edu/foss4g
Part of the Geography Commons
This Paper is brought to you for free and open access by ScholarWorks@UMass Amherst. It has been accepted for inclusion in Free and Open SourceSoftware for Geospatial (FOSS4G) Conference Proceedings by an authorized editor of ScholarWorks@UMass Amherst. For more information, pleasecontact [email protected] .
Recommended CitationOlyazadeh, Roya; Aye, Zar Chi; Jaboyedoff, Michel; and Derron, Marc-Henri (2015) "An Open-Source WebGIS Platform for RapidDisaster Impact Assessment," Free and Open Source Software for Geospatial (FOSS4G) Conference Proceedings: Vol. 15 , Article 44.DOI: https://doi.org/10.7275/R5V1230NAvailable at: https://scholarworks.umass.edu/foss4g/vol15/iss1/44
Page 2
An Open-Source WebGIS Platform for Rapid Disaster Impact Assessment
Roya Olyazadeh, Zar Chi Aye, Michel Jaboyedoff and Marc-Henri Derron
Institute of Earth Sciences, University of Lausanne
Géopolis, UNIL-Mouline, 1015 Lausanne, Switzerland
Email: [email protected] ; [email protected] ; [email protected] ; [email protected]
ABSTRACT
Natural disaster impacts have increased worldwide in the past decades. Earthquake is
one of the disasters that have been studied for real-time analysis and crisis management.
Disaster-related losses have been examined by the damage extent of the houses,
infrastructures, fatalities and injuries converted to financial losses. WebGIS technologies
provide a wide range of solutions to map those damages, analyse data and publish the results.
Open-Source tools and data have been widely used today because they stay free and facilitate
access to data especially significant in developing countries. This research presents a WebGIS
prototype using Open-Source Geo-Spatial technologies such as PostGIS, Geoserver,
Geoexplorer and OpenStreetMap (OSM) to evaluate the rapid impact of naturally produced
disasters for the total damages. For this purpose, expert knowledge, such as earthquake
intensities and vulnerability inputs are imported into the system and the loss of the damage is
rapidly estimated. This work is part of a project for catastrophe modeling based on Open-
Source data and software. We hope that applying Open-Source knowledge and solutions will
decrease the time and efforts needed for rapid disaster and catastrophe management.
1. INTRODUCTION
Generally, disaster crisis happened with a complete mixture of human actions and natural
hazards that directly result in a vital change during a short period of time such as death, disease,
displacement including damage to infrastructure and economic loss (Wisner, et al. 2003).
During the past decades, hazard events, namely as earthquakes, droughts, floods, storms and
fires have produced significant loss of people, properties and environmental damage. By
understanding the past hazards and anticipating the future events, the risk disasters can be
minimized. As a result, disaster assessment should be a repetitive and remaining process
(International Federation of Red Cross 2000) including underlying causes, dynamic pressures
and unsafe conditions; this refers to a relationship between disaster, hazard and vulnerability
(Blaikie, et al. 1994). Different types of assessment are based on different type of disasters and
available resources. The initial assessment can be carried out quickly, and when more
information are available, this can be improved (International Federation of Red Cross 2000).
During the past years, more than 1,100 dense earthquakes have occurred, causing more
than 1,500,000 casualties and collapsing buildings of more than 90% (Lantada, Pujades and d
Barbat 2009). Recently, the available fundamental information immediately after an
earthquake is its magnitude, depth and epicenter provided by U.S. Geological Survey (USGS)
data (http://earthquake.usgs.gov). However, the damage patterns are not an easy process and it
requires more detailed information on-site (James and Pascale 2012). Besides, hazard map
production has long process and include lots of efforts, and therefore, they cannot be available
quickly and freely. Besides building and vulnerability information need a huge database. As a
regard, open data, such as OpenStreetMap (OSM) and USGS data, including shake maps can
218
Page 3
be integrated directly in the Web-GIS application and will decrease the time and efforts needed
for the analysis. This data will be used to estimate damage and loss of the event.
The WebGIS platforms, spatial data infrastructures, Geo visualization tools and GUI
(Graphical User Interface) in the field of risk management have been applied in numerous
related works (see (James and Pascale 2012), (van Westen, et al. 2014), (Aye, et al. 2015),
(FEMA 2008) and (Open Quake 2015) among others). The web-GIS systems can support
disaster assessment of an earthquake immediately and facilitate the analysis. In addition,
different GIS prototype systems ( (James and Pascale 2012) and commercial technologies (
(FEMA 2008), (Esri White Paper 2008), (Open Quake 2015) and (InaSAFE 2015) have been
proposed. Despite the variety of systems, there is no system which challenges the application
of open data like OSM in planning of rapid disaster assessment, combined with loss and risk
estimation based on available risk information, through the application of a web-GIS platform.
In this work, web-GIS technologies play a fundamental role both in rapid disaster
assessment and loss estimation mainly for earthquake. This prototype application calculates
loss of damage by importing data from OSM and adding other information such as earthquake
intensity, vulnerability and the value of the buildings. The application is implemented based
on the open source framework, namely OpenGeo (Boundless).
Section 2 of this paper begins with the methodology for rapid disaster assessment and
conceptual framework of the system. In section 3, the background architecture and
implementation are proposed, and section 4 is devoted to describing the data that has been used
to test the application and discuss an initial result of the development. In the last part, the
conclusion of this study and future works for the catastrophe management and modeling
platform are reported.
2 The Conceptual Framework
The central goal of this study is to develop an integrated system for catastrophe
management in case of an earthquake, focusing on rapid disaster impact assessment. The entire
system plans to improve rapid assessment when there is a lack of information and data. The
functions of the system are related to four main phases:
1. Hazard
2. Elements-at-risk
3. Vulnerability
4. Loss.
Intensity can be defined as a major disturbance created by a disaster. Dealing with
earthquake, general information does not give an indication about the frequency. Generally,
the hazard is stated in terms of the incidence rates of intensity values (Cardona, Ordaz and
Marula 2008). Additionally, vulnerability is the characteristics in terms of the ability to resist
and improve the effect of a hazard (Blaikie, et al. 1994). Vulnerability functions are extremely
hazard related. For example, some buildings can be very vulnerable to earthquake and less to
other hazards like floods (Cardona, Ordaz and Marula 2008). Likewise, the loss computation
for events like earthquake is problematic, because of the lacking vulnerability information of
buildings (objects at risk) or hazard intensity. Due to the uncertainties of this process, loss can
be known as a probabilistic distribution in the shaking area. This methodology contains
modules that permit building information such as area and prices to be added for object at risk
219
Page 4
(i), to estimate damage and loss, primarily using the shaking intensity (I(xi)) at the location of
the object i within the database. Using a probabilistic approach the loss of the ith object for one
simulation is defined by:
Lossi = P(0/1)i × fVi(I(xi, RND)) × Wi (1)
P(0/1): Probability of an object i to be affected (yes or no) depending on the knowledge
fVi(): Vulnerability function of the considered object depending on the intensity I
I(xi, RND):Intensity function depending on the location xi and a random value RND [0-1]
Wi: Value of the object at risk (mainly buildings)
The total loss:
TL = ∑ Lossi (2)
Figure 1 (The loss assessment flowchart ) allows the end users to visualize and
understand an integrated rapid disaster assessment framework.
Figure 1: The loss assessment process
1- Define the area of the
assessment
2- Adding Earthquake information
by Experts
3- Adding OSM data and
Administrative units
5- Adding Vulnerability by Experts
4- Importing type and value of the
buildings by Experts
6- Create a new loss assessment
220
Page 5
3. Implementation
The main features of the platform (Figure 2), containing: 1. Top panel that focuses on
user management and documentation. The user management module is used for creating,
assigning and managing user accounts and permissions. 2. Main panel that is divided to Map
view, Layer view, Legend and Data view in a table format. The map view panel is located in
the center with tools for zooming, searching locations, styling, drawing and editing features,
etc.; and Data view panel is located in the south to visualize feature information about the
particular (vector) layer on the map. The main features of the loss calculation module are added
to the top bar of Map view for adding a new shake map layer as well as for calculating loss.
The GIS system is designed to process multiple events with different magnitudes for
different epicenters. Considering the spatial data stored in the Geodatabase component, the
system has been structured to obtain earthquake information such as magnitude, epicenter,
intensity, vulnerability tables and OSM data. In this way, it is possible to have a preliminary
assessment of the damage. For this reason, the vulnerability has been imported in terms of
probabilistic percentage or damage function for different buildings.
Figure 2: The main view of the platform with admin login
3.1 Architecture
The GeoSpatial analysis and visualization plays a fundamental role in disaster and post-
event management. For this purpose, the GeoSpatial technologies have been combined into
the architecture as a Geo-Visualization interface. The information and maps are stored and
managed within a GeoSpatial database, therefore, it is possible to visualize and request the data
221
Page 6
by a map viewer. The designed global architect (Figure 3) is implemented by using free open
source software (FOSS). The platform consists of the following components:
1. Geo-database (PostgreSQL and PostGIS);
2. Geographic user interface, including maps (Extjs, OpenLayers and GXP)
3. Web-GIS server (Geoserver)
4. User management with SQL (UserCake: http://usercake.com/)
5. Data analysis and process in PHP
The user sends a request login to the Apache web server using the user interface of the web
browser. The request passes through the PHP to SQL server and login is succeeding.
Afterwards, the requests to the Geoserver are being handled (e.g. Layer query, overlay of
different layers, etc.). The data are being analyzed and processed on the web server and sending
back to the format into HTML pages. Lastly, the results are displayed in the forms of maps and
tables by using OpenLayers.
Figure 3: Architecture of the WebGIS platform
3.2 Procedures
The disaster assessment method includes four main phases (Table 1). Once the user enters
into the system, the first phase is to fill the information about earthquake, importantly epicenter,
depth and Magnitude. Then, the expert will update the intensity of each earthquake by
uploading a SHP file or drawing on the map canvas. Following, the OSM data will be uploaded
to the system as a SHP file layer. This data can be generated in QGIS and imported as spatial
database.
CL
IEN
T
SE
RV
ER
DA
TA
BA
SE
OpenLayers
/GXP JavaScript/
Html/CSS
WWW
Apache-Tomcat
GeoServer
SQL PostgreSQL
PostGIS UserCake
PHP
222
Page 7
Table 1: The main steps of the loss calculation in the platform
Before moving into the calculation phase, vulnerability information is required to be
linked to the building data. This data derive from a table in CSV file mentioning the type of
the building and damage probability or defining the probability of the damage area. The value
of each building is being calculated and added to the system for the final phase (Area multiply
Phase 1: Earthquake data
Input Data Tools Output
Upload or Draw
1. Shake Map
2. Earthquake
information
Phase 2: Building Data
Input Data Tools Output
Upload
1. OSM building
2. Administrative Units
Phase 3: Vulnerability
Input Data Tools Output
CSV file
1. Value of building
2. Damage probability
in the affected area
PostGIS
Phase 4: Loss estimation
Input Data Tools Output
1. Earthquake
2. Buildings
3. Type of damage
223
Page 8
to price per square meter). Consequently, the user can select earthquake layer, building layer
and vulnerability type after naming the calculation process. As a result, the loss is computed
for each building and in overall. Besides, the computed loss can be shown as a map layer in the
system. These procedures are the basic steps in the existing system, however, it is planned to
enhance more detailed data and information on how the system can simulate and estimate
intensity and vulnerability information for an improved analysis.
3.3 Data Model and GeoServer
Geodatabase is designed to integrate and incorporate Geo-spatial data delivered as an
input to the system, including the data linked to Earthquake (e.g., magnitude, epicenter and
intensity) and specific data connected to the area of interest (Building information, OSM data,
vulnerability tables). The FOSS technologies chosen to develop this component were
PostgreSQL/PostGIS (www.postgresql.org and http://postgis.net/).
The GeoServer component, in connection with Geodatabase (PostGIS), is provided to
process spatial analysis and visualization. This module delivers a complete and up-to-date
description of the different layers like earthquake layer, building layer and, as a result, the maps
of expected financial loss in that area. Consequently, the results are stored and visualized
through GeoServer WMS and WFS features (http://geoserver.org/)
4. Study Data and Results
As an example, the 2015 Nepal earthquake, which is the largest occurred during the last
50 years in this country, is applied to this study (Earthquake Track 2015). In April 2015, a
massive earthquake of 7.8 M happened in Nepal as a result of faulting between the India plate
and Eurasia plate. At least 8,702 people were killed, 22,493 injured (UNHCR 2015) 500,717
buildings were destroyed and 269,190 damaged in this earthquake and the M 7.3 aftershock on
May (USGS National Earthquake Information Center 2015). Despite Nepal is one of the
countries in the world with the lowest economy, the main source of economy is agriculture and
tourism. However, reports demonstrate that the loss affected by recent earthquakes could
considerably set back the economy of Nepal (Grossi 2015).
Figure 4 displays the location of the recent earthquake and the aftershocks in Nepal (Robertson
and Koontz 2015). The shake map of data for earthquake of 7.8 M was imported into the system
by drawing the area in a polygon format. This data can also be downloaded from USGS website
as different formats such as vector or raster (USGS 2015).
Figure 5 indicates the shaking intensity affected by the Earthquake of 7.8 M (Grossi
2015).
224
Page 9
Figure 4 . Magnitude 7.8 Earthquake in Nepal & Aftershocks (from (Robertson and Koontz 2015))
Figure 5: Shaking intensity map of Earthquake 7.8 M (from (Grossi 2015))
225
Page 10
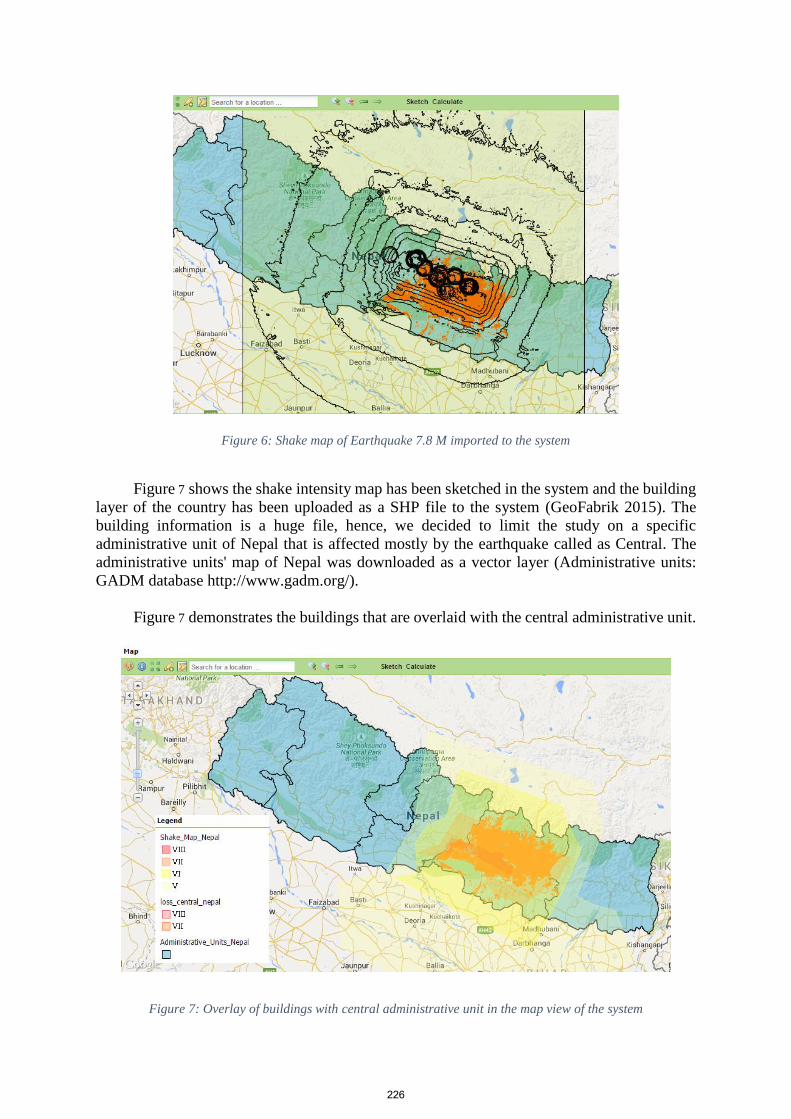
Figure 6: Shake map of Earthquake 7.8 M imported to the system
Figure 7 shows the shake intensity map has been sketched in the system and the building
layer of the country has been uploaded as a SHP file to the system (GeoFabrik 2015). The
building information is a huge file, hence, we decided to limit the study on a specific
administrative unit of Nepal that is affected mostly by the earthquake called as Central. The
administrative units' map of Nepal was downloaded as a vector layer (Administrative units:
GADM database http://www.gadm.org/).
Figure 7 demonstrates the buildings that are overlaid with the central administrative unit.
Figure 7: Overlay of buildings with central administrative unit in the map view of the system
226
Page 11
After adding all the layer maps, there is a requirement for the update of the building
information. The price per square meter in Nepal is estimated between 350 to 615 US dollars
(Numbeo 2015). By having the area of each building in the database, the price of each house
can be estimated roughly. Finally, the loss of each building and overall loss for the whole region
are calculated. Table 2 indicates the total number of houses that are exposed in the event as
well as the overall loss. This result is the preliminary result of the system based on open data
and expert knowledge. The authors, therefore do not recommend others to use this result.
According to the government, the earthquake destroyed 160,786 houses and more than 3
million houses were damaged (UN 2015). The result of this study shows that 3.1 million houses
were exposed in the earthquake and 124,000 of the houses were exposed to the higher risk or
in the absence of other information, the maximum loss shows 124 000 buildings were
destroyed.
Intensity Zones Number of Houses
Exposed in the area
Loss
Price: Minimum
cost per square
meter 350 $
Loss
Price: Maximum
cost per square
meter 615 $
VIII 124 000 2.1 3.6
VII 957 000 12.2 21.3
V and VI 2 000 000 13.3 23.3
Overall 3 100 000 27.6 Billions 48.2 Billions
Table 2: Overall Loss for different intensity layers of the shake map
5. Conclusion
Even though different tools have evolved in this field, their practice is restricted due to
the complex design of the systems, flexibility and usability. There are many challenges in
developing a WebGIS system. The most important ones are the lack of information and data.
In order to utilize GIS and other Geo-Spatial technologies, a variety of spatial data is required.
The elements-at-risk information is critical for disaster impact assessment and in this study,
OSM data are used. Though this data is not a complete set, it provides a basic and more
information can be added based on expert and local knowledge. Besides the estimation of loss
by using open data (e.g., OSM, USGS, Numbeo and GADM database) do not involve extensive
collection and can be performed fast with a modest budget. The more accurate loss estimation
requires an extensive inventory at additional cost to the end user and can be employed in future
works. To be mentioned, stories of the house, lifelines like water supply and transportations
were not considered in this study and will be applied in further stages of this system. This paper
presented the initial implementation and the background framework of a web-based GIS
system for rapid impact assessment and demonstrated a preliminary result of the case study
area in Central Nepal for the recent earthquake on April 2015. The full functional system is
still under development in order to fulfill the lack of information, the user requirements and
skilled knowledge of the earthquake experts.
227
Page 12
References
Aye, Zar Chi, Michel Jaboyedoff, M. H Derron, C. J van Westen , H. Y Hussin, R. L Ciurean, S Frigerio,
and A Pasuto. 2015. "An interactive web-GIS tool for risk analysis: a case study in the Fella
River Basin, Italy." Nat. Hazards Earth Syst. Sci. Discuss 4007-4057.
Blaikie, P, T Cannon, I Davis, and B Wisner. 1994. At Risk: Natural Hazards, People’s Vulnerability,
and Disasters. London: Routledge.
Cardona, Omar D, Mario G Ordaz, and Mabel C Marula. 2008. "Estimation of Probabilistic Seismic
Losses and the Public Economic Resilience—An Approach for a Macroeconomic Impact
Evaluation." Journal of Earthquake Engineering 60-71.
Earthquake Track. 2015. Biggest Earthquakes Near Nepal. Accessed July 2015.
http://earthquaketrack.com/p/nepal/biggest.
Esri White Paper. 2008. "Geographic Information Systems Providing the Platform for Comprehensive
Emergency Management."
FEMA. 2008. HAZUS-MH Estimated Annualized Earthquake Losses for the United States .
GeoFabrik. 2015. OpenStreetMap Data Extracts. http://download.geofabrik.de/.
Grossi, Patricia. 2015. "The Nepal Earthquake: What We Know So Far." The RMS blog. April 29.
Accessed July 15, 2015. http://www.rms.com/blog/2015/04/29/the-nepal-earthquake-what-we-
know-so-far/.
InaSAFE. 2015. . http://inasafe.org/en/.
International Federation of Red Cross. 2000. Disaster Emergency Needs Assessment. Disaster
Preparedness Training Programme.
James, Valentina, and Carmine Pascale. 2012. "Emergency, Open source GIS Tools to Map Earthquake
Damage Scenarios and to Support." The Fourth International Conference on Advanced
Geographic Information Systems, Applications, and Services. GEOProcessing. 152-157.
Lantada, N, L. G Pujades, and A. H d Barbat . 2009. "Vulnerability index and capacity spectrum based
methods for urban seismic risk evaluation." Nat Hazards 501-524.
Numbeo. 2015. Cost of Living in Nepal. July. http://www.numbeo.com/cost-of-
living/country_result.jsp?country=Nepal.
Open Quake. 2015. GLOBAL EARTHQUAKE MODEL. January 21. Accessed July 15, 2015.
http://www.globalquakemodel.org/openquake/about/platform/.
Robertson, Jessica, and Heidi Koontz. 2015. Magnitude 7.8 Earthquake in Nepal & Aftershocks
(USGS). May. Accessed July 2015.
http://www.usgs.gov/blogs/features/usgs_top_story/magnitude-7-8-earthquake-in-nepal/.
UN. 2015. Nepal earthquake: More than 3,00,000 houses damaged, says UN report. May.
http://www.firstpost.com/world/nepal-earthquake-more-than-300000-houses-damaged-says-
un-report-2224632.html.
UNHCR. 2015. Nepal: 2015 Earthquakes. June. Accessed July , 2015. http://data.unhcr.org/nepal/.
USGS. 2015. Earthquake Hazards Program: Shake map. Accessed July 2015.
http://earthquake.usgs.gov/earthquakes/shakemap/global/shake/20002926/.
USGS National Earthquake Information Center. 2015. USGS. April. Accessed July 2015.
http://earthquake.usgs.gov/earthquakes/eventpage/us20002926#general_summary.
van Westen, C.J, W.H Bakker, V Andrejchenko, K Zhang, J Berlin, I Cristal, and R Olyazadeh. 2014.
"User Guide: RiskChanges: a Spatial Decision Support System for analysing changing hydro-
meteorological risk." Accessed 2015. http://www.changes-
itn.eu/RiskChanges/UserGuide/tabid/159/Default.aspx.
Wisner, Ben, Piers Blaikie, Terry Cannon, and Ian Davis. 2003. At Risk: natural hazards, people’s
vulnerability and disasters (Second Edition). UNDP.
228