AN ORDINATION OF THE UPLAND FOREST COMMUNITIES OF SOUTHERN WISCONSIN J. ROGER BRAY t AND J. T. CURTIS Departrnent of Botany, Universtty of Mtnnesota, Minneapolis,Minnesota Departrnent of Botany, Universtty of Wisconstn, Madison, Wisconsin TABLE OF CONTENTS PAGE INTRODUCTION . ..... .. . .. ........... ....... .. . 325 PAGE .......... ......... 331 Application of the method .. * @ * @ o e w j Literature review............. Previous treattnent of the uplar of Wisconsin............... Source of data................ tREATMENT 0F THE DATA......... Nature of approaeh........... Use of score sheets............ Indexof similarity............ The ordination nzethod........ 325 RESULTS ................... ................ .................. ............... 333 - n e d ncL loresl DISCUSSION ........ . ........ ..... ........ ..... 338 ................ ............. 326 ....... .... ..... 326 The mechanical validity of the ordination 338 The biologie validity of the ordination 340 ................. ............. 327 ........................ Thenature of the gradients 342 .... ........ 327 Further uses of the ordination 346 F F . * * X o o 9 * * B . v s s w w w e 6 w w b F @ @ . * @ * _ 327 328 329 SUMMARY ..................................... ............................................... 346 LITERATIJRE CITED. . .... 347 INTRODUCTION A renewed interest in objeetive and quantitative approaehes to the elassifieation of plant communities has led, within the past decade, to an extensive ex- alllinationof systematic theory and technique. This examination, ineludingthe work of Sorenson (1948), Motyka et al. (1950), Curtis & McIntosh (1951), Brown & Curtis (1952), Ramensky (1952), Whit- taker (1954, 1956), Goodall (1953a, 1954b)?deVries (1953), Guinoehet (1954, 1955), Webb (1954), Eughes (1954) and Poore (1956) has acconlpanied theoretiestudies in taxonomy [Fisher (1936), Wom- ble (1951), Clifford& Binet (1954), Gregg (1954)] and in statisties (Isaaeson 1954). It is a Gonclusion of many of these studies that nature of unit variation is a naajor problenlin systematies,and that whether this variation is diserete, continuous, or in some other form, there is a need for appliGation of (uantitative and statistical methods. In eeologic elassifieation, an inereased use of ordinate systellls, sr hiGh has been stimulated by the developnlent of more effieient sampling teehniques and the collection of stand data on a large seale, has prompted the pro- posal of the term "ordination" ( Goodall 1953b ) . Goodall (1954a) has defined ordination as "an ar- rangenlent of units in a uni- or multi-dinlensional order" as synonylllouswith "Ordnung," (Ramensky * This sork was supported, in part, by the Researeh Committee of the Graduate School of the University of Wiseonsin, frolll funds supplied by the Wisconsin Alumni Research Foundation. The Junior F. Hayden Fund of the University of Minnesota provided partial support of publication eosts. t Present address: Department of Botany, University of Toronto, Toronto, Canada. 1930), and as opposed to "a elassifieation in whieh UllitS are arrangedin diserete elasses." The present study is an attempt to examine the upland forests of southern Wiseonsin in relation to a suspected nlultidimensional community structure by the use of ordination method and in so doing, to review the theoretie position neeessary to suGh an examination. LITERATURE REVIEW The application of quantitativeteehniques to com- munity elassifieation has been based, in part, upon the assulllpt on that quantitative eommunity com- position, as determined by suitablesaluplingmethods, ean be a primarybasis for the buildingof ordination systellls. This assulxption was emphasized by Gleason (1910) in an exanlination of the relationship between hiotie and physiGal faetors. Gleason quoted Spalding (1909), "The establishluent of a plant in the place whieh it oeeupies is Gonditioned quite as muGh by the influenee of other plants as by that of the physical environment," and coneludedfrom his own observa- tions, ". . . the differentiationof definite associa- tions is lllainly due to the interrelationof the com- ponent plants; and the phvsieal environncent is as often the result as the eause of vegetation." Further emphasis upon vegetation in itself was made by Clements & Goldsmith(1924), and lmore recently, by A¢itsudera (1954), who regard the Gommunity as an instrunlentwhiGh, if properly exalmined and luanip- ulated, nlight be a key to the relation of biotie and physieal phenomena. Cain (1944), Goodall (1954a, 1954b), Whittaker (1954) and Williams (1954) have questioned the relevaneeof considering single physi- eal environmental faetors apart from an environmental eonaplex. Insistence upon the study of vegetation on This content downloaded from 198.199.136.46 on Sun, 01 Mar 2015 21:47:20 UTC All use subject to JSTOR Terms and Conditions
Transcript
AN ORDINATION OF THE UPLAND FOREST COMMUNITIES OF SOUTHERN WISCONSIN
J. ROGER BRAY t AND J. T. CURTIS
Departrnent of Botany, Universtty of Mtnnesota, Minneapolis, Minnesota Departrnent of Botany, Universtty of Wisconstn, Madison, Wisconsin
INTRODUCTION A renewed interest in objeetive and quantitative
approaehes to the elassifieation of plant communities has led, within the past decade, to an extensive ex- alllination of systematic theory and technique. This examination, ineluding the work of Sorenson (1948), Motyka et al. (1950), Curtis & McIntosh (1951), Brown & Curtis (1952), Ramensky (1952), Whit- taker (1954, 1956), Goodall (1953a, 1954b)? deVries (1953), Guinoehet (1954, 1955), Webb (1954), Eughes (1954) and Poore (1956) has acconlpanied theoretie studies in taxonomy [Fisher (1936), Wom- ble (1951), Clifford & Binet (1954), Gregg (1954)] and in statisties (Isaaeson 1954). It is a Gonclusion of many of these studies that nature of unit variation is a naajor problenl in systematies, and that whether this variation is diserete, continuous, or in some other form, there is a need for appliGation of (uantitative and statistical methods. In eeologic elassifieation, an inereased use of ordinate systellls, sr hiGh has been stimulated by the developnlent of more effieient sampling teehniques and the collection of stand data on a large seale, has prompted the pro- posal of the term "ordination" ( Goodall 1953b ) . Goodall (1954a) has defined ordination as "an ar- rangenlent of units in a uni- or multi-dinlensional order" as synonylllous with "Ordnung," (Ramensky
* This sork was supported, in part, by the Researeh Committee of the Graduate School of the University of Wiseonsin, frolll funds supplied by the Wisconsin Alumni Research Foundation.
The Junior F. Hayden Fund of the University of Minnesota provided partial support of publication eosts.
t Present address: Department of Botany, University of Toronto, Toronto, Canada.
1930), and as opposed to "a elassifieation in whieh UllitS are arranged in diserete elasses." The present study is an attempt to examine the upland forests of southern Wiseonsin in relation to a suspected nlultidimensional community structure by the use of ordination method and in so doing, to review the theoretie position neeessary to suGh an examination.
LITERATURE REVIEW The application of quantitative teehniques to com-
munity elassifieation has been based, in part, upon the assulllpt on that quantitative eommunity com- position, as determined by suitable salupling methods, ean be a primary basis for the building of ordination systellls. This assulxption was emphasized by Gleason (1910) in an exanlination of the relationship between hiotie and physiGal faetors. Gleason quoted Spalding (1909), "The establishluent of a plant in the place whieh it oeeupies is Gonditioned quite as muGh by the influenee of other plants as by that of the physical environment," and coneluded from his own observa- tions, ". . . the differentiation of definite associa- tions is lllainly due to the interrelation of the com- ponent plants; and the phvsieal environncent is as often the result as the eause of vegetation." Further emphasis upon vegetation in itself was made by Clements & Goldsmith (1924), and lmore recently, by A¢itsudera (1954), who regard the Gommunity as an instrunlent whiGh, if properly exalmined and luanip- ulated, nlight be a key to the relation of biotie and physieal phenomena. Cain (1944), Goodall (1954a, 1954b), Whittaker (1954) and Williams (1954) have questioned the relevanee of considering single physi- eal environmental faetors apart from an environmental eonaplex. Insistence upon the study of vegetation on
This content downloaded from 198.199.136.46 on Sun, 01 Mar 2015 21:47:20 UTCAll use subject to JSTOR Terms and Conditions
its own level has been reiterated in many studies xvith reeent examples in Shreve (1942), Curtis & MeIn- tosh (1951), Brown & Curtis (1952), and Ramensky (Pogrebnjak 1955). Ineluded in infornlation on community structure are two basie relationships: that of individual speeies to eaeh other, and that of stands or plots as a whole to eaGh other. These relationships have determined the development of two complementary but separate approaches to the problem of elassifieation. The species approaeh stresses the degree of mutual oeGurrenee of a speeies with other speeies. This ap- proach received an early quantitative background in the work of Forbes (1907a&b, 1925) who proposed a eoeffieient of associate oecurrence whith he applied to the study of bird and fish eommunities. Further development of the concept of assoeiate occurrenee led to the elaboration of indexes of interspeeifie association (Dice 1948; Cole 1949; Nash 1950) and to the construction of indexes of relative species oGeurrence (deVries, 1953, 1954; Bray 1956a). In- dexes of interspeeifie assoeiation have been applied, in elassifieation, (1) to correlate species with host speeifieity or with environment ( Agrell 1945; Hale 1955), (2) to determine community groupings by the seleetion of groups of species with high inter- specifie correlations (Stewart & Keller 1936; Tuomi- koski 1942; Sorenson 1948; Goodall 1953a; Hosokawa 1955-1956) and (3) to determine degree of ampli- tudinal overlap of speeies as an indication of kind of eommunity variation (Gilbert & Curtis 1953). Indexes of relative species oGeurrence have been used as the basis for a spatial ordination of the species (deVries 1953, 1954) or for an objective assignment of speties adaptation values (Bray 1956a).
The second basic approach, that of correlation among stands as a whole, can be roughly divided into three methods. The first uses information other that that derived from the vegetation in order to establish a primary series of gradients or regimes along whieh a subsequent vegetation alignment is undertaken (Wiedemann 1929; Vorobyov & Pogrebn- jak 1929; Pogrebnjak 1930; Ranlensky 1930; Han- sen 1930; Whittaker 1956). These regimes do not usually represent direet physieal environmental factors, but nlore often express environmental com- plexes of interrelated faetors, sueh as soil moisture, or they follow environmental eontrols, such as eleva- tion, whieh determine a eomplex of factors. Ramen- sky, for example, used previously established soil moisture and soil nutrient reginzes to eonstruet a pri- mary stand ordination fronl which "Funetional Averages" were extracted by a series of eliminations of aberrations in the eompositional stand data. These averages were considered the median conditions of the biocoenosis and served as bases for final stand orientation. The work of Ramensky ineluded some of the first intergrading bell-shaped speeies distribu- tions to be demonstrated along vegetational gradients. The second stand method is the use of objective teehniques to show relationships among stands whieh
have previously been classified into diserete units, usually within the Braun-Blanquet system. This 1lse was given an early formulation in the work of Lorenz (1858) who was apparently the first to apply quantitative methods in eommunity elassifiea tion when he compared various kinds of moors on the basis of "per eent of speeies similarity." Later techniques, ineluding those of Kulezynski (1929 ), Motyka et al. (1950), Raabe (1952) and Hanson (1955) use Jaecard's Coeffieient of Community or one of its quantitative modifieations to show the eorn- positional similarity of units on various hierarehieal elassifieation levels.
The third method attempts, from a direct analysis of quantative vegetational data, to demonstrate degree of relationship by the oonstruction of compositional gradients which are independent of environmental or other eonsiderations. The use of the various teehniques of factor analysis ( Goodall 1954b ), of stand weighting deviees based on the assignment of species adaptation values (Curtis & MeIntosh 1951; Brown & Curtis 1952; Parmalee 1953; Kucera & MeDermott 1955; Horikawa & Okutomi 1955 ), and of attempts to utilize directly indexes of quantitative coeffleients of community ( Whittaker 1952; Bray 1956a) or indexes of octurrenee probability (Kato et al. 1955 ) are examples of the above approaeh. PREVIOUS TREATMENT OF THE UPLAND FOREST 01?
WISCONSIN
A linear ordination of the stands of the upland forest of southern Wisconsin was presented by Curtis & McIntosh (1951). Subsequent studies 7ere made in whieh soil fungi (Tresner et al. 1954) were arranged along this ordination and in which cortic- olous eryptogams were related in part to the ordina- tion and in part to host speeifieity (Hale 1955). Other studies were made of the forest herbs (Gilbert 1952), of auteeologieal charaeteristies of herbs (Rand- all 1951), and of the savanna transition into prairie ( Bray 1955 ) . Limitations to a linear presentation beeame ap- parent from eontinued Wiseonsin field work. One was the observation of eeological substitution in whiGh two separate speeies alternated in sharing what appeared to be identieal ranges of environmental toleranee (McIntosh 1957). Further reason to suspect the existence of a possible multidimensional strueture eame from a growing realization of the im- portanee of past history in determining the eomposi- tion of any stand.
SOURCE OF DATA All of the 59 stands of this study were sampled by the same methods. The trees were measured by the random pairs technique (Cottam & Curtis 1949) using 40 points and 80 trees per stand. The charae- ters here used are absolute number of trees per aere and total basal area per acre, both on a species basis. The shrubs and herbaceous plants were sampled by 20 quadrats, each 1 m. sq., laid at e+rery other point. The eharacter used is simple frequen8Y-
This content downloaded from 198.199.136.46 on Sun, 01 Mar 2015 21:47:20 UTCAll use subject to JSTOR Terms and Conditions
UPLAND FOREST COMMUNITIES OF SOUTHERN WISCONSIN 327 October, 1957
The stands employed were seleeted from the large number available by a stratified random procedure, so devised as to give an equal number of stands from eaeh major geographic portion of the southwestern one-half of Wiseonsin. All stands were at least 15A in size, were on upland sites upon whieh rain water did not aecumulate, and were in reasonably undis- turbed condition. As actually applied? this last criterion meant that the stands were ungrazed, had not been subject to fire within the recent past, and had never been logged to such an extent as to create large openings in the eanopy. In most cases, a few trees had been removed at various intervals in the past, as witnessed by an oGeasional stump. The limited log- ging probably created serious errors in the measured amounts of Jqtglans ntyra, sinee this high-value speeies was deliberately searched for on an intensive seale during World War I. It is believed that the population densities of the remaining speeies did not vary greatly fronl those whieh would normally be produced by natural death and windthrow. A very few stands were totally undisturbed for at least the past 50 yrs.
The sampling methods employed for both the trees and the understory were not, as eould be expected, completely free from error. Estimates of sampling error were made by repeated sampling of the same stand, using different investigators in both the same and in different years. Two extensive series of suGh tests, in a maple woods and an oak woods, showed a standard error of 10.8 % for the individual tree species and 7.1% for the understory plants. On this basis a Gonservative estimate of over-all error in the individual stand measures of about 10% seems reason- able. Obviously, this error would be muGh less for the most common speeies and greater for the rare speeies (Cottam et at. 1953).
We are indebted to Dr. Orlin Anderson, Dr. R. T. Brown, Dr. Margaret L. Gilbert, Dr. George H. Ware, Dr. Riehard T. Ward, and especially to Dr. R. P. MeIntosh for their aid in the eollection of the original data. Professor Grant Cottam of the University of Wisconsin and Professor J. W. Tukey of Prineeton University were very generous with their time and advice on various problems.
Taxonomie nomenelature in the present paper is after Gleason (1952).
TREATMENT OF THE DATA NATURE OF THE APPROACH
The ordination approaGh was selected for the pres- ent study in order to provide statelnents (1) which depiet, with a suffieient degree of quantitative exaet- ness, the compositional strueture of a Gommunity and (2) which might be able to give some initial indiGa- tion of the over-all patterns of interaction between biologic and physieal phenomena. The possibility of using ordination statements to suggest causal re- aetions is dependent on the eoncept of physical and biotie faetors interaeting in a relationship in which each faetor is, to some degree, mutually determined
by the others. There is, therefore, as is often noted in eeologic writing, no simple cause and effeet rela- tionship between physical phenomena (as primarily causal) and biotic phenomena (as primarily effectu- al ), espeeially in the more complex environments. There is, rather, instead of a domain which is deter- mined by a small number of independent faetors (that is, a system of meehanist eausality), a field of inter- related units and events ( configurational causality) . The ordination of this field is, then, a plotting of the changes in some biotic and/or physical features from area to area within the system, or in another sense, a mapping of its complexity, Such a mapping indi- eates, by the relative proximity of different features and their varying spatial patterns, the degree to which the features may participate in a mutually determined complex of factors. With the completion of this mapping, it may then be possible to apply statistical tools whiGh indiGate more fully the eausal interaetions in any one part of the ordination.
Of the two major approaches to ordination study, that of stand or of species orientation, it was decided to use a technique whieX gave theoretic spatial relations of stands as a first result. With such a framework, the distribution patterns of indi- vidual speeies ean be easily studied by directly plot- ting some measure of their behavior in eaGh stand. A similar plotting can be made for measures of environmental or historie factors in each stand, or for general deseriptive features. If the ordination is originally based upon species rather than stand relationships, then the location of relative stand position ( and as a consequence, correlation with environmental features) becomes more difScult.
USE 0F SCORE SHEETS If the degree of similarity of stands, one to
another, is to be assessed, then some decision must be made as to what criteria are to be used in judging this similarity. There is wide agreement amongst temper- ate-zone ecologists that Gommunity comparisons must be made on a floristic basis and that environmental or other features are not valid for primary comparisons. Unfortunately, this agreement does not extend much beyond the general idea of floristies. Clements and the Anglo-American sehool generally reGommend the use of the dominants as the main criterion of eom- munity or stand relationship, while Braun-Blanquet and his adherents use eharacteristic speeies of high fidelity, even though these may be small, rare or otherwise dynamiGally insignifieant members of the assemblage. Lippmaa (1939), Daubenmire (1954) and others use synusia, either singly or in eombina- tion, for their eharaeterization of eommunity re- semblanee. In no ease has the total flora of a given stand been used, sinee the determination of all of the bacteria, soil fungi, soil algae, liverworts, mosses, lichens and vaseular plants is usually beyond the faeilities at the command of ecologists. The principle is well recognized, therefore, that the entire species complement is not needed for meaningful statements about community composition. The disagreement lies
This content downloaded from 198.199.136.46 on Sun, 01 Mar 2015 21:47:20 UTCAll use subject to JSTOR Terms and Conditions
328 J. ROGER BRAY AND J. T. CURTIS Ecological Monographs
Vol. 27, No 4 in the question of where to draw the line short of the total fora. In the similarly complex problem of soil elassi-
fieation, it is possible that the degree of resemblance between a series of soil samples naight be determined br applyingva single test to each sample. Sueh tests nlight measure the texture of the soil, its pereentage eontent of sand, or some other simple eharaeter. It would then be possible to arrange the group in deseending order, as from very sandy through sandy- loalll to non-sandy. The sandy loams in the eenter would have eertain features in eommon and would differ greatly from the two extremes, but they might well inelude soils whieh differed widely among them- selves. The applieation of a seeond test to the samples, such as fertility level, would serve to dif- ferentiate soils whieh were of similar texture, but, even so, the resulting groups might not be homo- geneous they might differ in organie matter Gontent, pH, eolor, or other eharaeters. A similar problem was reeognized by Pirie (1937), "In an earlier part of this essay the transition from living to non-living was eolupared to the transition from green to vellow or from aeid to alkaline. If this eomparison were valid, it would be possible to lay down a preeise but arbitrary dividing line. But as it has been shown that "life" eannot be defined in terms of one variable as eolours ean, the eomparison is not strietly valid and any arbitrary division would have to be made on the basis of the sum of a number of variables any one of whieh might be zero." The best approaeh might therefore be to apply a series of tests, eaeh examining some pertinent or important aspeet of soil makeup. A study of the results of the series of tests would give a firm basis for eomparison of the original group and would easily piek out the soils most nearly related to eaeh other and least elosely related to others. It might be desirable to weight the test results, in order of their importanee. The caleiunz eontent is luore important than the sodiunl eontent in most temperate forest soils and its results might be appropriately weighted to show this impOrtance. Statistieally, the degree of relation- ship could be shown by a suitable measure of the correlation between the sets of test values for any two soil samples. The same proeedure ean be employed in the floristic
analysis of plant Gommunities. A standard series of tests ean be applied to eaeh stand and the results for pairs of stands Gorrelated with each other. If this is done for all stands in the series, then similar stands should have high nlutual correlation values, but dissimilar stands should show low correlation. If an appropriate measure of Gorrelation is used, then the resulting index should give a linear measure of the differenee between any two stands. One test of the similarity of two stands could be the quantity of Aceqt saccharqxrn that each contains, analogous to a deterluination of the caleium eontent of soil samples. A series of sueh tests, using other dominants, would inerease the preeision of the com-
parison. Similarly, a series of herbs and shrubs, ehosen to inelude some which were restrieted to the forma\tion under study and others known to be sensitive to the varying conditions present in different stands of the formation, eould be added to the list of tests.
In the eurrent studies, measurements of 26 species were used as the tests. Twelve of these speeies were dominant trees, while the remainder were herbs and shrubs. The trees ineluded all of the speeies with a presenee value above 33°<0 in the 59 stands studied. The herbs and shrubs were chosen at random in bloeks along the original continuum gradient from anong those speeies which were neither overly Gom- mon nor rare and whiGh had shown elear GUt distri- bution patterns in previous studies. Weighting of the 12 dominant tree speeies was aecomplished by using two separate measurements of eaeh speeies ( absolute density per acre, and absolute donlinanee per acre) as independent tests.
There were, thus, 38 tests employed for eaGh stand: frequeney (in 1 m quadrats) of 14 speeies of herbs and shrubs, density of 12 speeies of trees, and dominance (in square inehes of basal area at breast height) of the same 12 trees. The results of the tests for each stand were reGorded in a separate SGore sheet for that stand. (Of Gourse, many of the test seores on a given sheet were zero, when one ol more test species was missing from that stand.) The test scores were in different units, since the original measurements were made in three different elasses. This diserepaney was reetified by expressing eaeh score as a pereentage of the maximum value attained by that test on any of the sheets. These eorrected seores thus indiGated, in comparable units, the be- havior of eaGh test speeies in relation to its optimum behavior in the entire series. Sinee the number of test seores and the sum of these scores varied fronl stand to stand, the scores for eaeh stand were adjusted to a relative basis. They finallv indicated, therefore, the relative amount contributed by each test organism to the combined seore for the stand. In one stand, for example, species A may contribute 17.1% of the total score while speeies B may rep- resent only 1.9%. The adjusted scores on a relative basis appear to offer the best basis for making Golln- parisons between stands ( Whittaker 1952 ) .
INDEX 0F SIMIIJARITY The choice of a suitable index is largely dependent on the ehoice of an ordination technique. There are,
however, several charaeteristies of available indexes whiGh should be examined. The standard correlation Goeffieient, "r," ineorporates a square transformation which leads to the weighting of the importanee of entries with high values. Thus, if a pair of stands have one or two species in common which have high seore values, the stands will have a high correlation Goeffieient regardless of the relative similarity or dissimilarity of their lesser species. It ean be shown that high values of "r" Gover a wide range in in- terstand variation and are relatively insensitive in
This content downloaded from 198.199.136.46 on Sun, 01 Mar 2015 21:47:20 UTCAll use subject to JSTOR Terms and Conditions
the medium to high areas of stand similarity. There is a high sensitivity in the lower range of eoeffieient values of "r," but this sensitivity lies in an area where the ecologie differences between stands are not very signifieant due to the residue of widely plastic species which inhabit many of the stands of any geographic area. Of the available indexes of simi- larity employed in phytosociology, both Gleason's quantitative modifieation of Jaceard's Coeffieient of Community ( Gleason 1920 ) and Kulezynski's index (1927) ean be shown to have a greater ability to differentiate stands within the area of medium to high similarity than has the eorrelation eoeffieient. When the sum of score values is relative and equals 100, both Gleason's and Kulezynski's eoeffieients can he expressed in the terms later used by Motyka et al.
(1950) as C= + b where a is the sum of the quanti-
tative measures of the plants in one stand, b is the similar sum for a seGond stand, and w is the sum of the lesser value for only those species whiGh are in Gommon between the two stands ( Oosting 1956 ) . Thus, if two stands by ehanee had exaetly the same seores for exactly the same species, the index would be 1.00, sinee (a) and (b) would be equal and both would equal (w). If there were no speeies in com- mon, then the index would be zero. The range from no resemblance to complete identity is appropriate- ly Govered by the range from 0 to 1. This index appears to be the best approximation yet available to a linear measure of relationship.
As used in the present study, the index reduees simply to (w), or the sum of the lesser seores for those species which have a seore above zero in both stands. This is due to the use of relative scores, suGh that (a) plus (b) is always 2.00 in every pair
of stands and 2 00 =w. In praetice, the score sheets
were so arranged that the final adjusted seores were recorded in the last column on the extreme edge of the sheet. One sheet Gould then be superimposed, in turn, on every other sheet in a slightly offset position, and the lesser values added on a maehine for all tests where a positive value was present on both sheets.
When a large number of stands are studied, the ealeulation of the w index beeomes burdensome, sinee
n-1 there are n x-2 Gomparisons to be made. Thus,
for 10 stands, 45 comparisons are needed, while for 100 stands, 4950 are required. In suGh eases, re- course should be had to eleetronie ealeulators? using punch cards as seore sheets. In the present case, a eomplete Gomparison was made by hand for 59 stands, resulting in 1711 values of the w index. These values were arranged by stand number in a matrix. We would be happy to eorrespond with anyone who is interested in obtaining a copy of the matrix for further work.
TXE ORDINATION METHOD The use of stand data and of a summation of a
series of tests of these stands has been outlined as the quantitative basis for the present study. Of the ordination teehniques which were reviewed, many depend upon the use of a previous knowledge and sometimes elassifieation of either the vegetation or physieal environment. Although this use is not neces- sarily undesirable in ordination studies, it is apparent that a technique which can extract an ordination directly from the available data would be best suited to the present study. One quantitative and com- pletely objective technique whiGh makes this extrac- tion is faetor analysis.
Faetor analysis seeks to dranT "funetional unities" (faetors) from an oriented table (i.e. matrix) of eorrelation eoeffieients. These eoeffieients can be ealeulated, as in Goodall (1954b), froma eorrelation among speeies, whieh are Gorrespondent to tests in faetor analysis; or, if the relationship among stands is needed, the use of direet interstand eorrelation is permissible ( Tueker 1956 ) . In either ease, the standard teehniques of faetor analysis are applicable. The extraction of a funetional unity is followed, in most faetor teehniques, by the cornputation of a new matrix, ealled the residual matrix, from whieh the next unity can be obtained. This series of extractions results in a number of linear vectors, ealled the faetor matrix, and an attempt is then nlade to identify eaGh veetor with an underlying cause. Faetor analysis is used in areas where no hypotheses are available about the eausal nature of the domain, and is based upon the assumption, aceording to Thurstone (1947), that ". . . a variety of phenomena within a domain are related and that they are determined, at least in part, by a relatively small number of fune- tional unities or faetors." When applied to ordina- tion study, however, these funetional unities are not, as is emphasized by Goodall (1954b), direct environ- mental forees but are rather, soeiologie faetors. A soeiologie faetor is defined as "an element in the de- seription of the eomposition of the vegetation,' and it tnay or may not be related to environmental faetors.
The application of faetor analysis to the present study was earefully eonsidered, but was rejeeted for the following reasons: (1) the heavy Gomputa- t onal load involved in handling 59 stands, (2) the disadvantages, whieh have been diseussed above, in applying "r" (the eorrelation eoeffieient) to stand data, and ( 3 ) a hesitaney in interpreting faetor anaylsis when applied to stand cla ta espeeially in regard to the diffieulties noted by Goodall (1954b), "though the faetors may be statistiGallv orthogonal, they are not biolog eally independent; the inter- pretation thus becomes more GonlfpliGated." The Gonstruction of a preliluinary empirie method with the following eriteria therefore seemed desirable: ( 1 ) vegetation strueture is regarded as a possible key to the nature of the interaetion of faetors, and, as such, must be studied on its own level, (2) an extraction of
This content downloaded from 198.199.136.46 on Sun, 01 Mar 2015 21:47:20 UTCAll use subject to JSTOR Terms and Conditions
J. ROGER BRAY AND J. T. CURTIS Ecological Monographs Vol. 27, No, 4 3v30
an ordination direetly from objectively derived data without previous elassifieation would be desirable.
The basis of a teehnique which might satisfy the above criteria is the same as that for ordination systems in general: the degree of phytosoeiologic relationship between stands can be used to indicate the distance by whiGh they should be separated with- in a spatial ordination. The degree of relationship of vegetation units has usually been measured by some estimate of the similarity of stand Gomposition, with a high degree of similarity signifying a elose spatial proximity. The technique whiGh will be outlined attempts, therefore, to extract from a matrix of measurements of interstand similarity, a spatial pattern in whiGh the distanee between stands is related to their degree of similarity.
Given a matrix of values of distance between points in Euelidean space, it is possible, without a prior knowledge of thelir loeation, to reGonstruct their spatial placement ( Torgerson 1952 ) . This reGon- struetion depends upon simple teehniques in whiGh, in two dimensional spaee, for example, 3 points not in the same loGation and not on the same line, are used to loGate the other points by their relation- ship to the 3 referenee points. If, for example, there were in a matrix, 4 points, of which A, B, and C were each separated by a distance of 40 units and point D was separated from A and B by 20 units and from C by 34.64 units, then the position of these points could be established, with A, B, and C forming the apieies of an equilateral triangle and D oGeurring midway on line AB.
When Goeffieients of eommunity are used, however, as indiGators of spatial distanee, then exact interstand distances are not available, sinee the position of a stand in relation to another stand oGeurs within an area of uncertainty originating in the sampling error made in surveying the stands. F'urthermore, it is likely that stands oeeupy plroximate instead of exact theoretic positions in relation to each other. The oGeurrenee of stands within an area of uneertainty results in a matrix of estimated proximate distances. If such proximate distances are available, then the location of stand D in the previous example might be in a different position relative to reference stands A, B, and C as Gompared to three other reference stands (if exaet interstand distanees were available, the positions would be the same regardless of the ohoiee of referenee stands ) . The teehnique to be developed, therefore, is a preliminary attempt to derive an ordination from estimates of proximate interstand distanee whiGh gives a single spatial con- figuration most elosely approximating the matrix listanees.
This teehnique depends upon the selection of a pair of referenee stands for the determination of stand positions on any one axis. Given proximate interstand distanees, the ehoiee of referenGe stands is of erucial importanee. In making this ehoice? it is evident that referenee stands are comparable, in part, to sighting points as used in plane-table surveying
and that those stands which are furthest apart will be more aecurate for judging interstand distance than those which are in elose proximity. This aceuracy is espeeially desirable beeause of the area of uncertainty in which eaGh stand fluctuates relative to the positions of neighboring stands. If these fluetuations are greater than the actual distanee apart of the referenee stands, then the resulting ordination will reveal only these fluctuations. It is neeessary for anx ordination that the sphere of fluetuation for any stand be small in relation to the space oGeupied by the ordination as a whole. The ehoiee of reference stands should be, therefore, of those stands which are furthest apart and as a Gonsequence, have the greatest sensitivity to over-all compositional ehange.
AXIS CONSTRUCTIOX
The ordinate location of points in spaGe by the use of reference stands is illustrated by the ordination of five points whose hypothetical interstand distanees are shown in the lower-left of Table 1. The distanees, although hypothetiGal, represent exact spatial dis- tanees. They were determined by inverting the estimates of stand similarity whiGh appear in the upper-right of the table so that a high degree of similarity was represented by a low degree of spatial separation. The inversions were aceomplished by subtracting each index of similarity from a maximula similarity value of 100.
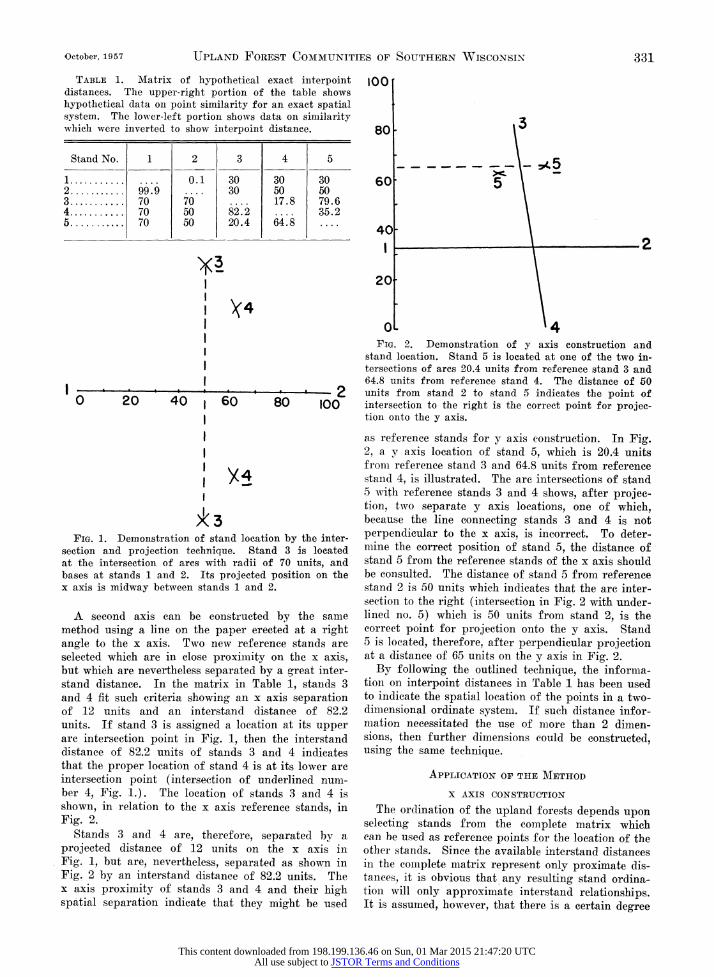
To locate stands between a pair of selected reference stands, a line eonneeting the reference stands is drawn to seale on a piece of blank paper, and the position of every other stand is projected onto this line. The projeetion is aecomplished bv rotating two ares representing the distance of the projeeted stand from eaGh of the referenee stands, and then projeeting the point of are intersection perpendicularly onto the axis. Applying the criterion of the greatest degree of spatial separation as deter- mining the ehoice of referenee stands, Table 1 shows stands number 1 and 2 to have a maximum separation of 99.9 units. These stands were seleeted, therefore, as the x axis reference stands and are placed in Fig. 1 at a distance of 99.9 units. Stand 3 in Table 1 is 70 units from referenee stand 1 and the same distanee from reference stand 2. Stand 3 is loeated in Fig. 1, therefore, at the interseetion of ares with radii of 70 units and bases at points 1 and 2. Two such inter- seetions are possible in a two dimensional ordination, and the points of intersection are projeeted perpen- dicularly onto the x axis, as shown in Fig. 1, to give an x axis loGation of 50 units. Stand 4 ean also be loGated along the x axis by the are interseetion and projeetion teehnique; it oceurs at 62 units along the x axis. Stand 5 is similarly loGated, after intersee- tion and projeetion, at 62 x axis units. It ean be proven geometrically that a constellation of points in n spaGe can be projected perpendieularly onto the line Gonnecting the two referenee points whieh are furthest distant in the eonstellation by using the above technique.
This content downloaded from 198.199.136.46 on Sun, 01 Mar 2015 21:47:20 UTCAll use subject to JSTOR Terms and Conditions
TABLE 1. AIatris of hypothetieal exact interpoint distances. The upper-right portion of the table shows hypothetieal data on point similarity for an exact spatial system. The lower-left portion shows data on similarity ^7hieh were inverted to show interpoint distance.
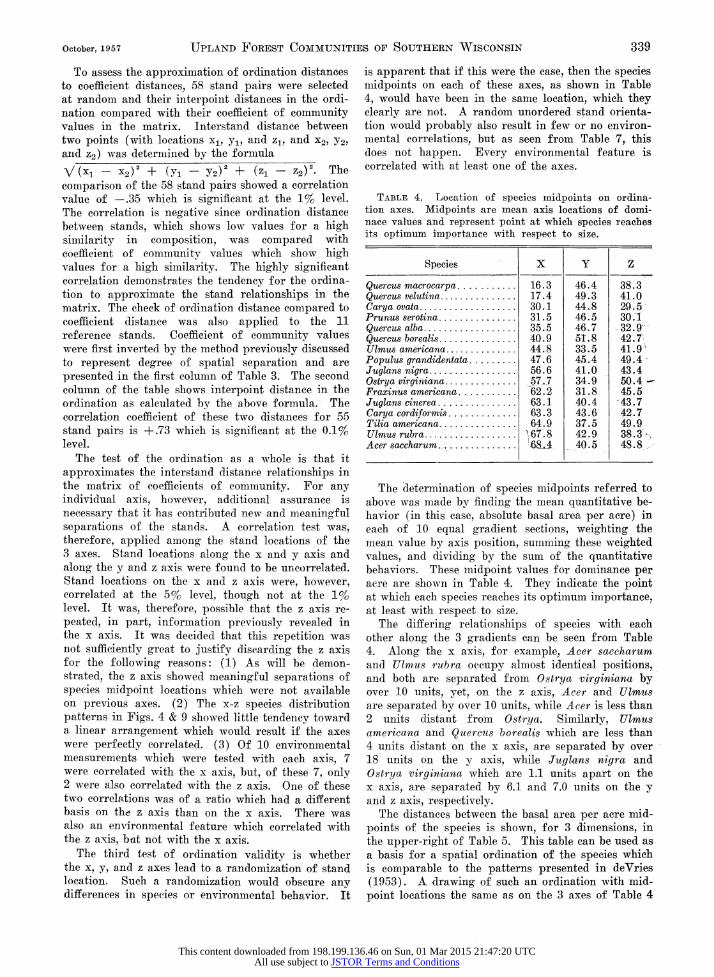
FIG. 2. Demonstration of y axis construction and stand location. Stand 5 is located at one of the two in- telsections of arcs 20.4 units from reference stand 3 and 64.8 units from reference stand 4. The distance of 50
$ 2 units from stand 2 to stand 5 indicates the point of 80 100 intersection to the right is the correct point for projec-
tion onto the y axis.
as reference stands for y axis eonstruction. In Fig. 2, a y axis location of stand 5, whieh is 20.4 units fronl reference stand 3 and 64.8 units from referenee stand 4, is illustrated. The are interseetions of stand 5 with reference stands 3 and 4 shows, after projee- tion, t+^o separate y axis locations, one of which, beeause the line eonnecting stands 3 and 4 is not
on by the inter perpendicular to the x axis, is ineorrect. To deter- d 3 is located mine the eorrect position of stand 5, the distance of ff 70 units, and stand 5 from the reference stands of the x axis should position on the be consulted. The distance of stand 5 from referenee 2. stand 2 is 50 units whieh indieates that the are inter-
seetion to the right (interseetion in Fig. 2 with under- by the same lined no. 5) which is 50 units from stand 2, is the
ted at a right correet point for projection onto the y axis. Stand nce stands are 5 is loGated, therefore, after perpendicular projection on the x axis, at a distance of 65 units on the y axis in Fig. 2. z a great inter- By following the outlined teehnique, the informa- le 1, stands 3 tion on interpoint distances in Table 1 has been used
tXis separation to indieate the spatial location of the points in a two- tance of 82.2 diluensional ordinate system. If such distance infor- tn at its upper mation necessitated the use of more than 2 dimen- the interstand sions, then further dimensions eould be eonstructed, nd 4 indicates using the same teehnique. lt its lower are Lderlined nUnl- APPLICATION OF THE 3fETHOD
Ids 3 and aI is x AXIS CONSTRUCTION
Znee stands, in The ordination of the upland forests depends upon seleeting stands from the complete matrix whiGh
bparated by a ean be used as referenee points for the loeation of the the x axis in other stands. Since the available interstand distances d as shown in ill the eolllplete matrix represent only proximate dis- '.2 units. The tanees, it is obvious that any resulting stand ordina- rnd their high tiOll will only approximate interstand relationships. might be used It is assumed, however, that there is a certain degree
l 60 0 20 40 1
l W
3 FIG. 1. Demonstration of stand loeati
section and projection technique. Stan at the interseetion of ares with radii of bases at stands 1 and 2. Its projeeted x axis is midway between stands 1 and z
A seGond axis ean be constructed method using a line on the paper eree angle to the x axis. Two new refere] seleeted which are in elose proximity but which are nevertheless separated by stand distance. In the matrix in Tab and 4 fit such criteria showing an x a of 12 units and an interstand disl units. If stand 3 is assigned a loeatio are intersection point in Fig. 1, then distanee of 82.2 units of stands 3 al that the proper location of stand 4 is a interseetion point ( intersection of un ber al, Fig. 1. ) . The location of stan shown, in relation to the x axis refere Fig. 2.
Stands 3 and 4 are, therefore, se projected distance of 12 units on t Fig. 1, but are, nevertheless, separatez Fig. 2 by an interstand distanee of 82 x axis proximity of stands 3 and 4 E spatial separation indiGate that they ]
80
60
: \
ze. \ i5
40
This content downloaded from 198.199.136.46 on Sun, 01 Mar 2015 21:47:20 UTCAll use subject to JSTOR Terms and Conditions
332 J. ROGER BRAY AND J. T. CURTIS Ecological Monographs Vol. 27, No. 4
of order within the matrix and that the interstand distances are not a series of random numbers. Only a limited number of stand positions for any one stand should, therefore, be possible. As noted before, these positions should fluctuate within a narrow area if an ordination is to present a meaningful approxi- mation of the matrix measurements.
Before the reference stands for the first axis ean be selected, coeffieient of community values, as found in the complete matrix, must be inverted so that a low coefScient of community value represents a relatively greater spatial separation and a high value represents a elose proximity. Although the coeffieient has a range from 0 to 100, the error involved in sampling a stand makes it unlikely that any of a series of replicate samples from the same stand will show the maximum value. Two stands were sampled, eaGh 7 times, using the field methods deseribed earlier, and coeffieients of community were ealculated among these samplings. The mean eoeffieient of eommunity within eaGh of the 7 repliGations was 82 whieh indicated a mean error of index reproducibility of around 20 index units. A value of 80 was, there- fore, considered to represent the maximum coeffieient value, that is, the value for two indentiGal stands; the highest value actually found in the complete matrix for 59 stands was 79. 'r
To convert coeffieients of community to interpoint distance values, an inversion was aeGomplished by subtraeting each coeffieient value from the fixed maxi- mum of 80. Stands whieh had a coefBeient of 0 were separated, therefore, by a maximum distance of 80 units. All subsequent mention of stand inter- point distanees refers to the inverted eoeffieients of
* .
commumty.
Using the eriterion of the greatest spatial separa- tion for the ehoiee of reference stands, an examina- tion of the inverted values showed 3 pairs of stands, numbers 35 and 136, 00 and 137, and 33 and 138, to be separated by the maximum distanee of 80 units. sinee these 3 stand pairs eaGh showed coeffieients of eommunity of zero indiGating no similarity, their relationship to the other stands in the study was examined to determine whether they were eompletely unrelated to the other stands. It is suggested that a stand pair with a 0 Goeffieient of community be used as a reference pair only if eaeh member of the pair shows a value greater than 0 with all stands whieh are not members of referenee pairs. By establishing this eriterion, the ehoiee of a stand pair member whieh shows no relationship to other stands, and whieh, therefore, contributes nothing to a knowl- edge of their relative spatial location, will be avoided. This criterion ean be met in relation to stand pairs 35-136, 00-137, and 33-138 eaeh member of whieh shows a relation greater than 0 to every other stand in the study.
The stand pairs selected above appear to repre- sent 2 sets of related stands, numbers 136, 137 and 138 and numbers 00, 33, and 35. The index values between each of the menlbers of eaGh set were highly
signifieantly correlated, as tested with r. Eaeh of the 3 pairs of reference stands were used, therefore, to ordinate stands along the x axis on the supposition that the use of several sets- of stand data might inelude more information from the matrix than if a separate set were used, and might reduce the flUctua- tions from non-exaet distance measurements.
Since each of the 3 pairs of referenee stands were separated by the maximum distance of 80 units, a line of 80 units was drawn connecting eaeh of the referenee pairs. The ordination was aecomplished by the technique outlined above of are rotation and of the projection of the point of are interseetion onto the x axis. Stand 89, for example, showed a coeffieient of community of 39 and 17 with stands 00 and 137. The inverse of these values, representing spatial separation, is 41 and 63, and stand 89 was located, therefore, at the intersections of ares with radii of 41 and 63, respectively. These interseetions were projeeted perpendicularly onto the x axis at a position of 25.5 units from reference stand 00 and of 54.5 units from reference stand 137.
The final x axis position of a stand was determined as the median position for the stand in relation to the three pairs of reference stands. There was a elose similarity in the x axis positions of the stand in re- lation to the three pairs of reference stands. Stand 89, for example, had x axis positions of 54.5, 48.5, and 46.5, and was assigned an x axis location of 48.5. The final median values presenting x axis loeation are shown in column 1 of Table 2.
UPLAND FOREST COMMUNITIES OF SOUTHERN WISCONSIN October, 1957
333 as in the GhoiGe of the y axis reference stands, and a pair of stands, numbers 89 and 107 were found to give the highest value. Stands 89 and 107 were separated by an interstand distance of 41 units and by projeeted distances of 0.5 on the x axis and of 8.5 on the y axis for a test value of 32.5. The line eonnecting reference stands 89 and 107, although not perpendieular to the y axis and, therefore, not exact- ly parallel to the z axis was, nevertheless, used as a base line onto which to project the are intersections. This was neeessary since the sampling error involved in the area of uncertainty surrounding each stand made it impossible to apply formulae whieh would eorreet the effect of a non-perpendicular axis. This error also prohibited the Gonsultation of distances to the x or y axis reference stands, since some stands to be projected onto the z axis were found to be equidistant from the x and y reference stands. No choice could, therefore, be nlade (as is illustrated in the loeation of stand 5 in Fig. 2) between upper and lower intelssection points. Are intersections were, therefore, projected directly onto the line conneeting reference stands 89 and 107. The projeetions onto this line were Gonsidered z axis stand locations, and are shown in eolumn 3 of Table 2.
RESULTS Using the values in Table 2, each of the 59 stands
studied was loGated on a two dimensional graph by the interseetion of its values on any two of the three axes. In Fig. 3, for exanlple, eaGh point on the graph
72 ;°O%
1 @4
61- /_ 4 2.@5 759^
/ _ f21 / - / ,3
/, / *6 5 0 - /.10
x - / . 15 ° _ / .z .8
>39--- 1 X50%
7 . * l. , 1 4 1 9 34 49 64 79
X - axis }'IG. 3. Demonstration of dominance distribution of
Tilta arnertcana within the x-y ordillation. Each circle or dash represents a stand location. Aetual dominance figures in basal area per 100 sq. in. per aere at breast height are given beside eaeh stand loeation. Values in the upper 25 % are represented by the largest circle, values in the 50 to 26 % quartile by medium sized cireles, values in the 75-51% quartile by small eireles, and values in the 100 to 76% quartile by dots. Contour lines are drawn around the 4 quartile lower limits in such a manner as to inelude all examples of the indicated size elass whether or not lesser size class values are present.
Y AXIS CONSTRUCTION
The choiee of reference stands for the seeond axis is based upon eriteriaC whith are, in part, similar to those used in the choice of the first dimension reference stands: stands separated by the greatest interpoint distanee and by the least projected x axis distance ean be expeeted, if chosen as reference stands, to give the greatest spatial separation to the other stands. Stand pairs whieh most elosely fit the above eriteria are likely to be eentral in axis loeation sinee by the meehanies of the are inter- seetion and projection teehnique, the more nearly stands are found toward the eenter of any axis, the greater is the probability that they will have spatial separation in the new dimension of a relatively great distanee. Conversely, stands loeated towards one of the ends of the axis are less likely to be distantly related, sinee by sharing a relatively high relation- ship with the re:ference stands towards whiGh they are found, they are, therefore, more likely to be related to each other.
A test is suggested for the selection of y axis referenee stands in whiGh the value of stand separa- tion on previous axes is subtracted from the index value of interpoint distance, with the highest value Gonsidered to be the most suitable. SuGh a test weights a low separation on previous axes as of equal inaportance with a high degree of interpoint distanee. The importanee of ehoosing reference stands in elose proximity on previous axes is illustrated in subse- quent z axis Gonstruetion in which the Gondition of non-exact interpoint distances makes it impossible to correet for non-perpendicular axes. This test was applied to the 59 stands in the study and stand pair 111 and 185, whiGh are separated by a projeeted x axis distanee of O units (Table 2) and by an inter- point distance value of 47 ( as inverted from a coeffieient o f eommunity of 33 ), gave a maxinlum value o f 47. Another stand pair, 26 and 185, also gave a high value (46.5) by the above test, with separations of 0.5 and 47 respectively. Stands 26 and 111 were found to be highly signifieantly Gor- related in their relationship to the other stands, and the use of several referenee sets again appeared feasible. Stands 26 and 185, and 111 and 185 were, therefore, selected as y axis referenee stands. Sinee these two sets of stands were separated by only 0.5 and 0.0 units respeetively on the x axis, projections after are rotation were made direetly onto the line conneeting eaGh reference pair, and this line was con- sidered the y axis. Final y axis loGation for eaGh stand was determined by taking the mean position for eaGh stand on the two construeted axes. These axis positions are shown in Golumn 2 of Table 2.
.
Z AXIS CONSTRUCTION
With the eompletion of the y axis, a seareh was nlade for stands which had relatively siinilar x and y axis positions, but whiGh were, nevertheless, separated by relatively great interstand distances. The same test of maxilllum axis separation was made
This content downloaded from 198.199.136.46 on Sun, 01 Mar 2015 21:47:20 UTCAll use subject to JSTOR Terms and Conditions
J. ROGER BRAY A: ND J. T. CURTIS Ecological Monographs
from each axis. The actual Gonstruction of three- dimensional models is very time consuming (Fig. 7).
Once the stands are loGated in a two- or three dimensional Gonfiguration, it beeomes easy to study the behavior of individual species within the stands. In Fig. 3, for example, the aetual basal area per acre for Titia artericana is plotted on the :x-y
334
represents a stand with its loeus determined by its values in Table 2 for the x and y axes. Similar plottings were made for the stand loeations on the :x and z axes and the y and z axes. These 3 graphs can be thought of as 3 views (front, top, and side) of a three-dimensional eube, within which the stations are located at the interseetions of lines projeeted
z y z
z z
z z
z
This content downloaded from 198.199.136.46 on Sun, 01 Mar 2015 21:47:20 UTCAll use subject to JSTOR Terms and Conditions
UPLAND FOREST COMMUNITIES OF SOUTHERN WISCONSIN October, 18 57 335
Frawinilc amorieena
o *. .
- *
o e .o
ooo . o
o
y
y z
Ostryo virginiono
o
o o
o e oM
o o
oe
t oS
* ch o
oz y
o
o o o
o : oo
o' o *
.
oo
y 2
x x
FIG. 4. Dominance behavior of the 8 most important tree species (other than Ttlia americana) within each of the 3 views of the ordination. Size of circle corresponds to the quartile size elass distribution illustrated in FIG. 3. Dominance per acre at the 50% level in sq. in. is as follo+^ s: Scer saccharurn 8,- 000; Garya ovata 1,000; Franrinus americana 2,200; Ostrya virginiana 400; Quercus alba 5,700; Quercus borealts 7,600; Quercus velutiyna 4,000; 171mqhs rubra 3,200.
This content downloaded from 198.199.136.46 on Sun, 01 Mar 2015 21:47:20 UTCAll use subject to JSTOR Terms and Conditions
w w Z - s - r 5 . Z z h - s s s w - X w w w f w - w B - w w
HvdroDhvilum virainionum
*o @
OO o o
o o
oo
o o
o
o
o
o
o * o
o o
o * o o
o
FIG. 5. Frequency behavior of store herbs (12 species) within the x-y ordination. Size of circle corre- sponds to the quartile size class distribution illustrated in FIG. 3. Frequeney at the 50% level is as follows: Apocynuqn androsaemifoliutrn 10; Arisaerna trifoliurn 30; Desmodium glutinosum 40; Frayaria ?nirpiniana 25; Galiu?n aparine 50; Galiuxn concinnum 47; IIydrophyllurn virginianum 25; Eystrix patula 10; Phrywma lepto- stachya 30; Pteridium aqilintln 27; Sanputnaria canadensis 35; Viola pubescens 37.
Apocynum androsaemifoiium
This content downloaded from 198.199.136.46 on Sun, 01 Mar 2015 21:47:20 UTCAll use subject to JSTOR Terms and Conditions
graph. The values at eaeh point are the measured basal areas for Til1,a as taken from the field data for each stand. Those stands in which Tilta was absent are indicated by a dash. The basal areas have been put into size elasses, as indicated by the eireles of different size. In this and all similar figures in the paper, the largest eirele ineludes the top 25 % of all of the values; the next size, the third 25%; the smallest eirele, the seGond 25 %; and the solid points, the first or lowest 25% of the values. At a glanee, therefore, it is apparent that Ttlia reaGhes its highest inlportanee in a very small portion of the possible area and that the stands with lesser domi-
nanee of this species are spread out from it in a
pattern of deereasing oGeurrenee. The contour lines on Fig. 3 have been drawn in sueh a way as to include all examples of the indiGated size elass, regardless of whether lesser size elasses are also present. They, therefore, indiGate the area within whiGh the speeies nlay reaeh the indicated level of domination.
Similar graphs were nlade for all axis combina- tions for all species used on the test sheet and for a large number of speeies not used in the ordination. Fig. 4 illustrates the 3 views for the 8 most important tree species, while Fig. 5 shows x-y views only for
This content downloaded from 198.199.136.46 on Sun, 01 Mar 2015 21:47:20 UTCAll use subject to JSTOR Terms and Conditions
338 J. ROGER BRAY AND J. T. CURTIS E Vological Monographs
the 12 herbs used on the score sheet. Nine species not The complexity of stand relationship and of the used in constructing the ordination are shown in forces which influence community structure is of such Fig. 6 in x-y views. magnitude that a matrix of comparative distance
A three-dimensional representation of the behavior cannot, as previously noted, be oriented in a single of Quercus borealis is given in Fig. 7. The 3 sizes of exact configuration. The complexity of stand rela- spheres indicate the top 3 quartiles of dominance per tionship is not chaotic, however, and it is assumed acre. No differentiation is made between the lowest that each stand fluctuates within a fairly limited area quartile and the stands not containing the species; in its compositional (and spatial) relationships, al- both are indicated by holes which appear as dots in though this area is enlarged by the sampling error of the figure. A comparison of Fig. 7 with the ap- the techniques used in field survey. The ordination propriate views of Q. borealis in Fig. 4 will show is further based on the assumption that by establish- how these separate presentations may be used to gain ing a set of exact criteria for stand selection, the num- a visual image of the ordinations in three-dimensional ber of interdependent causal complexes acting within space. the community can be limited. This limitation in-
creases the/probability that reference stands can be selected which are oriented along the lines of major changes in community structure, but it does not necessarily prevent a certain loss of matrix informa- tion by the selection of reference stands which reflect, in part, independent causal happenings which are unrelated to the major complexes. It is evident, therefore, that the validity of the ordination should be tested on its ability to approximate (but not exactly
T i1 !! 1> ; Em ̂ A_ reproduce) the estimates of stand similarity, and W i jI %1 ttperhaps to show stand alignments which correlate with
ijEP \T | 0lit~i j 18 X~l fhe available estimates of physical environmental
'Ii. ~~~~~features. TABLE 3. Interstand distances of the reference stands
_\ 1 31 > from matrix and ordination. The first column lists all pair combinations of reference stands; second column
interpoint distance; third column shows distances be- tween the stands in the ordination.
FIG. 7. Three-dimensional model of the dominance Ordina- Ordina- behavior of Quercas borealis within the ordination. The Stand Matrix tion Stand Matrix tion 3 sizes of spheres indicate the top 3 quartiles of domi- Pairs Distance Distance Pairs Distance Distance nance per acre. Stands of the lowest quartile and with- - _ _ _ _ out the species are represented with holes which appear 00- 35 16 06 89-107 41 41 as dots in the figure. The x axis is on base of model 00- 33 25 12 89-111 35 30 at front from left to right; y axis on base from front 00-1097 347 42 89-18265 438 338 to rear; z axis in vertical plane from below to above. 00-1ii 48 42 89-136 64 50
00-185 49 37 89-138 64 49 Certain measures of the environment, including 00- 26 58 42 89-137 63 44 00-136 79 72 107-111 25 15 soil analyses made upon a pooled sample from 3 ran- 00-138 78 72 107-185 46 43
doin collections of A1 layer in each stand are given 00-137 80 73 107- 26 25 13 in Table 6 for the stands used in the study. The 35- 33 21 11 107-136 57 41 soil nutrient analvses were made by the State Soils 35- 89 55 42 107-138 58 45 Laboratory, Madison, Wisconsin. Water retaining 35-111 58 38 111-185 47 45 capacity was determined by the method outlined by 35-185 55 37 II1- 26 21 03 Partch ( 1949 ) . 35- 26 55 38 111-136 53 41
THE MECHANICAL VALIDITY OF THE ORDINATION 33- 89 52 33 185-136 64 49 THE ORDINATION ~~~~~~~~~33-107 51 35 185-138 61 45
The biologic and environmental results of the 33-111 56 32 185-137 69 46 ordination in Table 2 should be assessed by criteria 33-185 63 39 26-136 64 41 which are consistent with the assumptions upon which 33- 26 61 33 26-138 59 45 the ordination technique is based. The first of these 33-138 80 67 136-138 42 09 assumptions is that the degree of compositional 33-137 78 68 136-137 34 24 similarity between stands can be used as comparative 138-137 30 18 distances to indicate spatial locations for these stands. I I I I
This content downloaded from 198.199.136.46 on Sun, 01 Mar 2015 21:47:20 UTCAll use subject to JSTOR Terms and Conditions
UPLAND TIOREST COMMUNITIES OF SOUTHERN WISCONSIN October, 19 5 7
To assess the approximation of ordination distances to coeffieient distances, 58 stand pairs were selected at random and their interpoint distances in the ordi- nation compared with their eoeffieient of community values in the matrix. Interstand distance between two points (with locations x1, Y1, and z1, and x2, Y2, and Z2) was determined by the formula
t (x1 - x2)2 + (Y1 - y2)2 + (z1 - z2)2. The comparison of the 58 stand pairs showed a correlation value of -.35 whieh is signifieant at the 1% level. The correlation is negative since ordination distance between stands, which shows low values for a high similarity in composition, was compared with eeeffieient of Gommunity values which show high values for a high similarity. The highly signifieant correlation demonstrates the tendeney for the ordina- tion to approximate the stand relationships in the matrix. The eheek of ordination distanee compared to coeffieient distanee was also applied to the 11 referenee stands. Coeffieient of Gommunity values were first inverted by the method previously diseussed to represent degree of spatial separation and are presented in the first eolumn of Table 3. The seeond Golumn of the table shows interpoint distance in the ordination as caleulated by the above formula.- The eorrelation eoeffieient of these two distanees for 55 stand pairs is +.73 whiGh is signifieant at the 0.1% level.
The test of the ordination as a whole is that it approximates the interstand distanee relationships in the matrix of eoeffieients of eommunity. For any individual axis, however, additional assuranee is neeessary that it has eontributed new and meaningful separations of the stands. A Gorrelation test was, therefore, applied among the stand loGations of the 3 axes. Stand loeations along the x and y axis and along the y and z axis were found to be uneorrelated. Stand loGations on the x and z axis were, however, Gorrelated at the 5% level, though not at the lCo
level. It was, therefore, possible that the z axis re- peated, in part, information previously revealed in the x axis. It was decided that this repetition was not suffieiently great to justify disearding the z axis for the following reasons: ( 1 ) As will be demon- strated, the z axis showed meaningful separations of speeies midpoint loeations whieh were not available on previous axes. (2) The x-z speeies distribution patterns in Figs. 4 & 9 showed little tendenev toward a linear arrangement whieh would result if the axes were perfeetly eorrelated. ( 3 ) Of 10 environmental measurements which were tested with eaGh axis, 7 were eorrelated with the x axis, but, of these 7, only 2 were also eorrelated with the z axis. One of these two eorrelations was of a ratio which had a different basis on the z axis than on the x axis. There was also an ensironmental feature whiGh Gorrelated with the z asis, but not with the x axis.
The third test of ordination validity is whether the x, y, and z axes lead to a randomization of stand location. Sueh a randomization would obseure any differenees in speeies or environmental behavior. It
is apparent that if this were the case, then the speeies 339 midpoints on eaeh of these axes, as shown in Table 4, would have been in the same loeation, whieh they elearly are not. A random unordered stand orienta- tion would probably also result in few or no environ- men-tal eorrelationsn but as seen from Table 7, this does not happen. Every environmental feature is correlated with at least one of the axes.
TABLE, 4. Location of speeies midpoints on ordina- tion axes. Midpoints are mean axis loeations of domi- nace values and represent point at whieh speeies reaches its optimum importanee with respect to size.
The determination of speeies midpoints referred to above was made by finding the mean quantitative be- havior (in this case, absolute basal area per aere) in each of 10 equal gradient sections, weighting the mean value by axis position, summing these weighted values, and dividing by the sum of the quantitative behaviors. These midpoint values for dominance per aere are shown in Table 4. They indicate the point at whiGh each speeies reaGhes its optimum importance, at least with respect to size.
The differing relationships of species with each other along the 3 gradients can be seen from Table 4. Along the x axis, for example, Acer saccharurn and Ulretqxs }4uhWa OGGUpy almost identical positions, and both are separated from Ostrya vrgtnzana by over 10 units, yet, on the z axis, Acer and Ulrnqxs are separated by over 10 units, MThile Acer is less than 2 units distant from Ostrya. Similarly, Ulrnus amertcana and Qxercus boqealzs which are less than 4 units distant on the x axis, are separated by over 18 units on the y axis, while J?glans ntyra and Ostrya tvirg1,ntocna whieh are 1.1 units apart on the x axis, are separated by 6.1 and 7.0 units on the y and z axis, respectively.
The distances between the basal area per aere mid- points of the speeies is shown, for 3 dimensions, in the upper-right of Table 5. This table can be used as a basis for a spatial ordination of the species which is comparable to the patterns presented in deVries (1953). A drawing of suGh an ordination with mid- point locations the same as on the 3 axes of Table 4
This content downloaded from 198.199.136.46 on Sun, 01 Mar 2015 21:47:20 UTCAll use subject to JSTOR Terms and Conditions
340 J. ROGER BRAY AND J. T. CURTIS Eeological Monographs Vol. 27, No. 4
TABI.E 5. Species midpoints interpoint distanees in three dimensions. The upper-right of the table shows the distanees between the dominance midpoints of speeies in three dimensions. The lower-left indicates whether there was greatest separation of midpoints in the first, second, or third dimension.
tion on the y or z axis than on the x axis. These . * . separatlons, ln many eases, Gomplemented the results of field observations, and gave indiGation that a bio- logie interpretation of the meaning of the axes might be possible.
THE BIOLOGIC VALIDITY 0:F THE ORDINATION The ordination, thereforen by the use of a technique
whiGh is open to mod;fieation, gave one (but eertainly not the only possible) approximation to the informa- tion on stand similarity in the matrix of eoeffieients of eommunity. This approximation was made in 3 dimensions which were demonstrated to give species locations and environmental Gorrelations whiGh were non-random and non-repetitive. The ultimate test of the value of the ordination is, however, a biologic one, and sueeeeding discussion will attempt to utilize the ordination in examining the nature of the Gom- munity and of its faetorial relationships.
The views of speeies distribution in Figs. 4, 5, and 6 can be used in ereating a mental image of the speeies as they appear in three dimensions, an image whiGh will reveal the same effeet as that of the 3 di- mensional pattern in Fig. 7. From these visualiza- tions and from Fig. 7, it is evident that eaeh speeies shows all or part of an atmospheric distribution, that is, one in which there is an inereasing concentra- tion ( number of points ) and importanee ( size of points) of the speeies as the eenter of the distribution is reaGhed. Away from the eenter, the deerease in numbers and sizes of the points is not always uni- form in all direetions but the speeies distributions, nevertheless, suggest that an idealized distribution would show a eoneentration and size of points di- minishing outward in all direetions from a dense center to an area beyond a sparse peripherOr where the points no longer oecur.
An atluospheric distribution is a form whieh ean be expected from an extension of the frequently expressed concept of ecologie amplitude into more than 2 dimensions. This eoneept postulates a m-ini-
z
FIG. 8. Three-dinzensional drawing of the center point locations of dominance behavior of tree speeies. Dcter- mination of eenter point locations explained in text. Point on frame closest to reader is lowest value for all 3 axes. The traditioIlal pOSitiOll of the axes nras ehanged to prevent the hiding of some speeies in the dravving.
is presented in Fig. 8. Both the upper-right of Table 5 and Fig. 8 show comnlunity relationships of species by suggesting an estimate of the relative correspondence of their stand loeations; the less distant is the degree of midpoint separation, the more likely are the speeies to occur in the same stands.
The lower left of Table 5 lists the axis for each stand pair on which there is the greatest spatial separation in their dominance midpoints. In spite of the greater importance of the x axis (with a maximum distance between midpoints of 52.1 as eompared to 20.0 and 20.9 for the y and z axes) there are 33 of a total of 120 stand pairs which give a greater separa-
This content downloaded from 198.199.136.46 on Sun, 01 Mar 2015 21:47:20 UTCAll use subject to JSTOR Terms and Conditions
October, 1957 UPLAND FOREST COZIMUNITIES OF SOUTHERN WISCONSIN- 341 TABLE 6. Environmental measurements by stands. Average eanopy estimates from a number of stations
within eaeh stand. Soil analyses from pooled samples of 3 random colleetions of the A1 layer in eaeh stand. Nutrient values in pounds per aere at a soil depth of 7 in.; W.R.C. is v.ater retaining eapaeity; OM is organie matter.
This content downloaded from 198.199.136.46 on Sun, 01 Mar 2015 21:47:20 UTCAll use subject to JSTOR Terms and Conditions
(1955), Poore (1956), and Hewetson (1956). It is suggested that evidenee for the individualist theory of speeies distribution and for the continuum nature of community structure is now suffitiently compelling to require studies concerned with community structure to examine the relative continuity or discontinuity of their terial and to use quantitative nlethods which will permit this examination. At a minimum, the examination would include a sampling of at least one analytie tharacter in a suffieient number of stands to allow comparisons of quantitative compo- sition. If an apparent grouping of stands into a dis crete unit ( i.e. assoeiation, ete. ) is suspected then this unit should be tested against samples of related vegetations to determine whether there are separate groups of stands with a eertain range of variation within each group, or whether this variation is great enough to obseure the boundaries between the groups. If the latter is true, the application of ordination methods is necessary. A reasonable approach to the treatment of phytosoeiologie nlaterial about whieh little is known might be to eheek earefully the hotno- geneity of eath stand, and then to apply an ordination tethnique. If clumps of stands are shown along the resultant gradients, it would then be possible to regard these elumps as castes (assoeiations, ete.) and deter- mine the suitable parameters neeessary for the future elassifieation of eaGh easte.
One reason for reexamining the upland hardwoods of Wiseonsin was the diversity of interpretations whiGh various readers gave the original paper. Thus, some Gorrespondents questioned if the linear eon- tinuum was not a statistically advanced restatement of sueeession, while others ( Horikawa & Okutomi 1955) regarded it as a demonstration of relationships whiGh were independent of suecession. The eon- tinuous compositional variation whiGh was demon- strated was at times assumed to apply to spatial transition as seen in the field ( Churchill 1955 ), as contrasted to theoretic variation in the strueture of Gommunities regardless of their mierogeographie relationships. In clarifieation of the above interpre- tations, it should be evident from the present study that the dimensions of the ordination are purely eompositional and eannot necessarily be direetly re- lated to faetors or to Gomplexes of factors. Su(ees- sional ehange is only one among many eausal forees arhieh have shaped the speeies distribution patternS of Figs. 4 through 6. The dimensions represent an approximation of the ehanges in conlpositional strueture which are present within the eommunitY and are not spatial transitions as they esist in the field, although, as noted by Gleason (1926) and as is evident to many field workers, there are often natural areas where the salient features of a Gontinuum can be observed.
T HE NATURE 0F THE GRADIENTS It is likely that the degree to which there are
separations in more than one dimension was in part dependent upon the qualifieations used to differenti- ate the eommunity initially. Had suffieient knowledge
mum, optimum, and maximum behavior for eaeh speeies in relation to the dynamies of community structure, and has often been demonstrated in 2 dimensions by eontour-shaped ("solid normal") pat- terns and in one dimension by bell-shaped ("normal") patterns. It can be shown that a compression of an atmospheric distribution into 2 dimensions will give contour-shaped patterns as shown in Fig. 3 and in Wiedemann (1929), Ramensky (1930), Pogrebnjak (1955), and Whittaker (1956). Further compres- sion into one dimension will yield the bell-shaped patterns demonstrated in the original linear treat- ment of the upland forest ( Curtis and MeIntosh 1951) .
Fig. 6, which shows species patterns similar in form to the two preceding figures, demonstrates the relevance of the ordination to the entire plant popu- lation of the upland hardwoods. The 9 speeies in Fig. 6 inelude all of the minor tree species for which adequate data were available and an unbiased selection of shrub and herb species. Although none of the species in Fig. 6 eontributed to the placement of stands in the ordination, they, nevertheless, show the same atmospheric distributions outlined above. The ability of the ordination to give meaningful patterns to species not used in its construction is considered as both a basie test of the usefulness of the ordination and as a demonstration of the feasibility of gradient eonstruetion by the Gonsideration of les than the total speeies Gomplement.
Figs. 4 through 6 show eaGh species to have an individual pattern, different in size and loeation, although fairly similar in shape to those of other species. The distribution and the relationship of the patterns avithin the ordination is elearly one of continuous variation, as was previously demonstrated in the linear continuunl of Curtis and McIntosh. The species used in the ordination, as well as those in lfig. 6 which were examined after the ordination was eolllpleted, ean be deseribed, therefore, as having patterned, non-random distributions within the pre- seribed geographie, environmental, and physiognomie limits of the study. Eaeh of these distributions moves outward from eentral areas of high densitv to peripheral areas of sparse density, and this move- ment reveals along 1, 2, or 3 dimensions correspond- ing bell-shaped, eontou-r-shaped, or atnlospheric distributions. Eaeh speeies has a separate area of loGation, and within this area its distribution is interspersed to varying degrees with other speeies distributions so that there is a eontinuous ehange in stand composition from any part of the ordination to any other part.
The above deseription supports, to a large degree, conelusions from work eompleted in a dilTersity of geographic regions and vegetations, ineluding the studies of Gleason (1926), Vorobyov & Pogrebnjak (1929), Ramensky (1930), Sorenson (1948), Sjors ( 1950 ), Curtis & McIntosh ( 1951 ), Whittaker ( 1951 ), deVlies (1953 ), Goodall (1954a), Guinoehet (1954), Webb (1954), Churchill (1955), Horikawa & Okutomi
This content downloaded from 198.199.136.46 on Sun, 01 Mar 2015 21:47:20 UTCAll use subject to JSTOR Terms and Conditions
TABLE 7. Envirollmental eorrelations vvith three ordination axes. A1 is depth of A1 in illehes; W.R.C. is water retaining eapacity; O.M. is organic matter; Values in body of table are the probability that there is no eorrelation.
.1 Ca Percent Canopy A1 pH W.R.C. Ca K P NH4 O.M. K
UPLAND FOREST COMMUNITIES OF SOUTHERN WISCONSIN October, 1957
been available before the study was begun, it might have been possible to eliminate those stands from the study which had relatively poor subsoil drain- age and one of the additional dimensions might, thereby, have been eliminated. On the other hand, had there been an expansion of the data to inelude poorly drained forests and those subjeet to inunda- tion, then a more complete pieture of the southern forest as a whole eould have been given. The view of Ashby (1948), that the most important aspect of community study is the original delineation of the study area, is very applicable to the present study.
As previously noted, the 3 dimensions of the ordination repr. esent eompositional gradients which are not likely to be related to any single causal ageney. The probability that every factor is a constant influenee on the structure of a stand, and the interrelated nature of biotic and physical faetors, prohibits the identifieation of single causal meeha- nisms. In spite of these limitations, however, certain over-all patterns are evident in the 3 axes, patterns which relate to broad bio-physical complexes and to history. It is noteworthy that some of these patterns of species and of enviromnental features had not been suspeeted before the applieation of multidimensional teehnique.
Thus, in general, the x axis duplieates the original linear Gontinuum of Curtis & McIntosh and shows a conlplex of conditions which inelude gradients from higher to lower light intensity and evaporation, gradients from lower to higher soil moisture and relative humidity, and gradients from more to less widely fluctuating soil fand air temperature. The order of species along the x axis is basically deter- mined by an over-all linear direction in the many paths of community development within the upland forest. These paths follow a network of suecessional patterns which are mainly related neither to primary nor seGondary sueeession but to reGovery from past disturbance. This disturbanee, in the form of fire, reduced the forest in many plaees to a savanna or barrens condition in which there were seattered oaks and/or oak brush and roots ( Cottam 1949; Bray 1955 ) . During this reduetion, the more terminal speeies which were also the more fire suseeptible, were replaced by less terminal and by initial species whieh were the least fire suseeptible. The coinci- dence that Qquercus nsacrocarpa is both the most initial and fire resistant species, and that Acer sacchartemJ is the most terminal and fire suseeptible
species, suggests that the ultimate explanation for the 343 composition of a forest stand in upland Wisconsin is largely an historie one. The longer a stand has been free of fire (and other disturbanee forees) and the more favorable the habitat in which it oGeurs, the more likely it ean develop to a maple-basswood forest. The x axis shows, therefore, mainly the relationship of the community to major past dis- turbance factors and to its own developmental re- eovery from these factors.
To examine correlations with physical measure- ments of the environment, a cheek was made. using r, the correlation coeffieient, of all available environ- mental data with each of the three dimensions. The results are shown in Table 7. Since both environ- mental data and stand locations showed approximate- ly normal distributions, the signifieanee of correlation was cheeked with the t test by examining the hypothesis that correlation (p) =0. The values in Table 7 are the probability that p=O, and that there is, therefore, no correlation. Thus, a probability of <.01 is a basis for rejecting the hypothesis and is considered a highly signifieant correlation. A value of <.05 is Gonsidered a signifieant correlation, while values of >.05 are considered to represent no signifi- cant correlation. By the above interpretation, for example, pereent canopy is positively correlated with the x axis at a highly signifieant level, while it is not eorrelated with either the y or z axis.
The values in Table 7 show a highly signifieant cor- relation between pereent canopy, depth of A1, organic
matter, pH, Ca, P, * K and the x axis. VVater re-
taining capacity, K and NE are not, however, eorrelated with the x axis. An examination of the values in Table 6 indiGated the majority of the fea- tures related to the x asis, were positively eorrelated with each other. It is highly probable that these Gorrelations represent the measured aspeets of an inereasingly mesic environment which aecompany the suecessional recovery of the forest from past dis- turbance. While only a general interpretation can be made of this recovery at present, it is elear that the dynamies of faetorial interrelationships along the x axis offer a broad area for future researeh.
The y axis seems to be Gorrelated, in part, with the influenee of surfaGe and sub-surfaGe drainage, and, eonsequently, with a soil moisture Gonlplex, with internal soil air space and aeration probably also
This content downloaded from 198.199.136.46 on Sun, 01 Mar 2015 21:47:20 UTCAll use subject to JSTOR Terms and Conditions
erease in internal drainage and in soil oxygen along the y axis, there is a proportional inerease in nitrify ing bacteria and, therefore, an indirect inerease in NH4. The y axis, therefore, appears to represent a complex of internal soil drainage and aeration factors which is eoineident with a eliseral historic faetor refleeting post-glacial vegetational changes.
The z axis apparently represents, in part, tlle influence of reeent disturbanee, with speeies whiGh benefit by disturbanee being separated from the speeies with whieh they are proximate on other axes. Both Carya ovata and Prqxnus serottna at the lower end of the z axis are gap phase speeies (Watt 1947, Bray 1956b) whieh take advantage of oak wilt gaps and of grazing in initial forests. Po pqzws grandi- dexta.ta is another gap phase speeies and is found toward the upper end of the z axis. Its abilitzy to enter areas opened by fire has long been noted (Chamberlin 1877) and observed in the field. Ulrnus rwbra, and to a lesser extent Carys6 cordtf orvtis, apparently do well in some disturbed intermediate and early terminal forests and, as a result, are pulled away from tlleir proximity to Acer sacehaqgqxm to whiGh they are elosely adjacent on the previous axes. Qxere?s alba and Q?erevs borealis are separated on the z axis to a greater extent than on the x or y axes, a separation whiGh might be related to the ability of red oak to inerease in importanee ill maple-basswood forests whiGh have been burned, forests from whiGh white oak had been eliminated earlier by sueeessional developments.
The values in Table 7 show 3 environmentail fea-
tures, K, O.M., and K to be eorrelated with the z
axis. Potassium shows a signifieant negative eor- relation which might be related to amount and Gontent of loess, in that K is oharaeteristiGally high in loessial soils in the Middle West and stands towards tlle upper end of the z axis might have an inereasingly shallow or absent loessial layer. The highly signifi-
eant positive correlation between the ratio K ancl
the z axis is illustrated by values whiGh more than double from one end of the axis to the other. This Gorrelation is the result of a Ca Gontent whiGh is not Gorrelated along the axis coupled with the deereasing K Gontent noted above. There is, therefore, a con- sequent inerease in the ratio. Along the x axis there
.lCa 1S a slnallar K Gorrelation, but it is produeed by an
uneorrelated K Gontent whiGh is aeGompanied by an inereasing Ca Gontent. No connection is directly apparent between this ratio and the growth of plants although it may refleet amount of available K. Thus, availability of K is eonsiderably deerease with inereased Ca, if K is tending toward low levels of fertility (Lutz & Chandler 1946). Such low £ertility levels are possible in the deereasing K con- eentration along the z axis which is accompanied bY a uniformly high Ca level. A similar non-availability
TS
344 J. SOGER BRAY
influential. The 3 tree species with midpoints to- wards the lower end of the y axis in Table 4 are Fraxtnxxs slnertcana, Ulmas am ertcana, and Ostrya zv1rgtntana and are, of the species oGeurring in the upland forests, the most tolerant of poor drainage and aeration. Speeies whiGh are found toward the upper end of the y axis are predominantly oaks, such as Qqxercus borealis, Q. alba, 2. macrocafpa, and Q vel?ttna, whiGh are intolerant of inundation and poor aeration. Speeies with midpoints towards the center of the axis, suGh as Acer saccharum, Juylc6ns nigra, Ulrngs r¢bra, and Caq^ya cordiformts are mesie species with an intermediate tolerance of poor drainage and aeration.
Two environmental features, W.R.C. and NH show a highly signifieant positive Gorrelation with the y axis. Water retaining eapaGitv is represented with its highest values oGeurring towards the upper end of the axis assumed above to have the better internal drainage. The anomaly of high W.R.C. assoeiated with good drainage is perhaps explained by the dif- ferenees in past history of the stands along the y axis. It was found that W.R.C. has a signifieant negative eorrelation with depth of the A1 layer. This Gorrelation is apparently related to the eircumstance that stands with high water-retaining eapaGities have a sharply demareated boundary between the A1 and A2 layers, while the opposite stands tend to have a diffuse boundary, with the organie matter gradually deereasing in amount. These differenees represent trends towards mor humus and typical podzols on the one hand and mull humus and gray-brown podzolic or brown forest soils on the other. They probably re- fleet past history to the extent that stands at the upper end of the y axis (mor humus, high W.R.C.) have been oGeupied by mixed Gonifer-hardwood forests in more reeent postglaneial times than stands at the other end, whieh nlay have developed on savannas or grasslands with a deep layer of incor- porated humus. Substantiating evidenee for this was seen in the distribution patterns of Dierttlla lonteearce, Goodye^a npabescens, Maianthem?Xw cana- dense, Pterid1Mn aqvtltnqxm and Pyrolct elltpttca which elosely matched the distribution of the higher values of water retaining capaGity. All of these speeies eurrently reaGh their optimum in the conifer forests of northern Wiseonsin and are onlv ineidental mem- bers of the southern forest under diseussion. The mean W.R.C. in stands in which 3 or more of the above speeies oGeurred in the quadrat samples is 103 as Gompared to a mean of 78 for the remaining stands.
The strong positive correlation of NH4 with the y axis is not related to pH, since these two features show no correlation with each other. There is, how- ever, a likelihood that the NH4 correlation is, in part, Gontrolled by the soil moisture and aeration complex diseussed above in relation to tree distribution. The assumed poorly aerated soils towards the lower part of the y axis have, perhaps, a relatively higher proportion of denitrifying bacteria. VVith an in-
This content downloaded from 198.199.136.46 on Sun, 01 Mar 2015 21:47:20 UTCAll use subject to JSTOR Terms and Conditions
UPLAND FOREST COMMUNITIES OF SOUTHERN WISCONSIN 345
Oetober, 1957
Wlsconsin Dominnce / Acre
X axis
* s * Tilia sp.
- Acor seccherum
....... ..... Quercus veltGna
+ + + * +++ Quercus alba
Qucrcus borcalis
Carya cordiformis
FIG. 9. View of contour drawing of trees within the x-z ordination compared with nomograms of the same or similar species in the Smoky Mountains (Whittaker 1956). Contour lines in the Wiseonsin ordinations are made at the 25% (upper) size class level. Dominance values at this level isl sq. ill. are as follows: jlcer saccharv7n 12,000; Carya cordtformts 400; Qu,ercus vIba 8,500; Qmberc?6s borealis 11,400^ Qlsereqzs vel?htvina 6,- 000; Tilta americana 5,700.
of K correlated with the x axis is not as likely, sinee the non-eorrelated K eoncentration along this axis indioates there is no area where low K values are eonsistently found with high Ca values.
The reasons for the signifieant positive z axis correlation with organic matter are not readily ap- parent. The overwhelming probability that all the mea,sured environmental factors plus numerous non- llleasured faetors are interaeting with each other and with biotic forees, and that plants are responding to the interactions rather than to single factors indi- eates that attempts to pinpoint the a,xes too elosely are doomed to failure.
The diffieulty of assigning definite faetorial mean- ings to the ordination axes is further emphasized by a con,sideration of Fig. 9. This represents a comparison of the two-dimensional behavior pat- terns of a series of tree speeies which oeeurred in the Wiseonsin study and also in Whittaker's 1956 analysis of the Great Smoky Mountains vegetation. The speeies of Tilia are slightly different in the two regions. The patterns on the Great Smoky graph are taken from Whittaker's nomograms. They portray either the 10% Gontour of speeies density or the highest value attained by the species i£ it was less than lO% and thus represent favorable or opti- mum conditions for growth. The patterns on the WATisconsin graph are the contours of the top quartile of dominanees per acre. The absolute levels in square inehes per acre for this 75% level are indi- cated in the legend of the figure. Thi,s may seem an unfair comparison sine,e only seleeted e,ontours a,re used, but a study of the full set of eurves in Whit-
taker's original graphs in rela.tion to the full dia- grams for the Wiseonsin data. only strengthens the Gompar.ison.
With the exGeption of Quercus albGl, the patterns in the two graphs are remarkably similar, espeeially if the axes of the Wisconsin graph are rotated slightly to the right. The exa,et meaning of this eoincidenee is not elea.r. A relationship between the x axis and Whittaker's moisture gradient seems reasonable enough, but there is no immediately evident eonnection between the factors usually a.s- sociated xvith elevation and any possible interpreta- tion of the z a.xis. All of the stands in the Wiscon- sin study were within a. few hundred feet of ea,eh other in eleva.tion and did not differ signifieantly in average temperature as measured by nearby weather stations.
The similarity in speeies distribution patterns be- tween Wiseonsin and Tennessee suggests that the biotic forees within a G,ommunity have a high degree of homeostatie stability in their interactions with other eausal agencies. Sueh stability is a. feature of the dynamies of open ,systems in which? although a wide variety of factorial eonfigurations m.ay exist, there are apparently only a limited number of system struetures which are possible. In biotic eommunities a limitation in strueture means each speeies is con- fined to a definite Gommunity position in relation to other species with the unlikehood that all combina- tions of speeies can oceur. It is the limited number of stand Gompositions whiGh permits the applieation of quantitative methods to eommunity classifieation.
This content downloaded from 198.199.136.46 on Sun, 01 Mar 2015 21:47:20 UTCAll use subject to JSTOR Terms and Conditions
FURTHER USES O:F THE ORDINATION Although the main purpose of the study wa.s to
investigate the phytosoeiology of community strueture, the ordination results can be used a.s a basis. for further research and for investigations in related fields. The value of the original upland hardwoods continuum in animal ecology ( Bond 1955 ) and in plant ecology (Tresner, BaGkus & Curtis 1954; Gil- bert & Curtis 1953; Hale 1955 ) has been demon- strated. The construction of additional dimensions should facilitate any further work whiGh is done by providing a more complex pattern of eommunity structure. Thus, studies of life histories of individual species can be given an exact community background against which to correlate those changes in the morphology, vitality, manner and means of dissemi- nation, and perhaps taxonomy and phenology of the species which are determined by differenees in Gom- munity composition. Other important phytosociologic fea.tures which can be direetly related to differenees in community structure are (1) the distribution patterns of speeies, both as to variation in population means and in manner of dispersion, as demonstrated in Whit- ford (1949) a.nd (2) the variation in interspeeifie assoeiation relationships.
The nature of the eausal role of faetors shaping a conlmunity is an ultinlate goal in eGoloty. The de- termination of community strueture, as was suggested earlier, is perhaps a key to these ea.usal relationsh;ps. Goodall ( 1954b ) notes, "It is the high eorrelation between different environmental faetors that often suggests a deeeptively simple lnelationship between plant distribution and the environment. There is muGh to be. said for the view that the Gorrlplexes of environmental faetors deternaining plant distribution ean be indiGated and mea.sured better indireetly, through the plants themselves, than b+T direet physiGal measurements; this is, of eourse, the idea behind the use of "phytometers" in agrieultural meteorology, and the attention devoted tn phenologAT." By separat- ing unlike stands along several different eompositional gradients, possible extremes in eausal reaetions are determined and the loGation of erueial junetures of ehange in eommunity strueture is possible. Elaborate and expensive tests ean then be made at these june- tures whiGh would have been impossible to apply to the Gommunity as a whole. A further interpretation of the southern upland hardwoods would then, per- ha..ps, be able to demonstrate the interaetive nature of a series of faetors as they ehange the strueture of the eommunity and, in turn, are Ghanged in their own expression.
SUMMARY The relationships of 59 stands of upland hardwood
forest in southern WiseDnsin were studied by llzeans of a new ordination teehnique. Quantitat;Te mea.sure- ments of 26 different speeies were used as the basis of the ordination. These 26 speeies ineluded the 12 most important trees and 14 herbs and shrubs. The quantitative eharaeters used a^ere absol1lte densit+T
per aere and absolute basal area per acre for the trees and simple frequeney for the herbs and shrubs. These measurements were arranged on a "score" sheet for each stand after having been put on a eomparable and relative basis. The degree of phytosociologie similarity of any stand to eaeh of the other stands was assessed by Gleason's eoeffieient of communitT. Sueh eoeffieients were caleulated for each stand with each other stand (1711 values).
It was Gonsidered that the degree of similarity of two stands as shown by their GoeffieIient could be translated into a spatial pattern in which the inverse of the coef0eient was equated with linear distanee. Using groups of stands whiGh were least similar as end points of an axis, the relative positions of all other stands were loeated along this axis by a geo- metrie technique of are projeetion, with the radii of the ares given by the inverted Goeffieients of simi- larity. When this was done, it was seen that some stands were equidistant from the two end groups but nevertheless were themselves unlike. Using the most distantly related of these, a seGond axis was ereeted by the same method as the first. The position of all stands on this new axis was then determined. Further inspeetion revealed that a few stands were about equally spaGed between the ends of both the new axis and the first axis but were still dissimilar. These were used to produee a third axis. The three axes were at light angles to eaGh other, so the posi- tions of any given stand on eaGh axis eould be pro- jeeted to give a three-dimensional 10GUS for that stand. When all stands were thus loGated in three- dinlensional spaGe, a highly signifieant Gorrelation was found between their aetual, measured spa eings and the original eoeffieient of Gommunitv alues between thenl.
Given the franlework of the spatial distributiorz of the stands, the behavior of individual speeies +X-as readily examined by plotting a measured phvtosoei- ologie value of a speeies at the loci of the stands of its oGeurrenee. It was found that all speeies (inelucl- ing an unbiased seleetion of those not used in the orig- inal 26 on whiGh the ordinationwwas based), forxed atmnspherie distributions with high or optimum values in a restrieted portion of the array, surrounded lv deereasing values in all direetions. No two speeies showed the same loGation, but eaeh was interspersed to varving *legree with other speeies, in a eontinuollslv ehanging pattern.
The three axes of the ordination are GoInpositionaI gradients, and their strueture is interpreted as not the result of a elausal determination by the physienI environment but of an interaetion between organislus and environment. A preliminary attempt mras made to deseribe patterns of this interaetion although an exaet deseription remains for future study. Thus, the lllajor (x) axis appeared to represent, in part, patterns of developmental reGovery from major past disturbanees. This reGovery was Gorrelated with fea- tures of an inereasingly shaded and mesie environ- ment ineluding canopy cover and the following soiI features: depth of Al layer, organie natterS lH,
This content downloaded from 198.199.136.46 on Sun, 01 Mar 2015 21:47:20 UTCAll use subject to JSTOR Terms and Conditions
UPLAND FOREST COMMUNITIES OF SOUTHERN WISCONSIN 347 October, 1957
Ca, P, and K . The second axis was related, in
part, with surface and subsurfa,ee drainage and with soil aeration and it showed correlation with soil water retaining capacity and NH4. The third axis was ap- parently related to recent di,sturbance and the in- fluence of gap phase replacement, and it showed
correlation with the soil feautres of K,- K ' and
organic matter. The possibility that the axes may have different interac,tion patterns than suggested above is evident in the similarity between the two- dimensional distributionls of a number of tree species in the Wisconsin stands and in Whitta,ker's Smoky Mountain stands whieh were arranged along topo- graphie a,nd altitudinal gradients.
LITERATURE CITED
Agrell, I. 1945. The C'ollemboles in nests of +0-arm-
blooded animals, with a method for soeiologieal anal-
ysis. Kungl. Fysiograf. Sallisk, Handl. 56: 1-19.
Ashby, E. 1948. Statistical eeology. II-A reassess-
ment. Bot. Rev. 14: 222-234.
Bond, R. R. 1955. Eeologieal distribution of breeding
birds in the upland f orests of southern Wiseonsin. Ph.D. Thesis. Univ. of Wisc.
Bray, J. R. 1955. The savanna vegetation of Wisconsin
and an applieation of the eoneepts order and eoln-
plexity to the field of ecology. Ph.D. Thesis. Univ. of
wiS.
. 1956a. A study of mutual oecurrenee of plant
speeies. Eeology 37: 21-28.
1956b. Gap phase replaeemellt in a maple-bass-
wood forest. Ecology 37: 598-600.
Brown, R. T. & J. T. Curtis. 1952. The upland eollifer-
hardwood forests of northern Wiseonsin. Eeol. Monog.
22: 217-234.
Cain, S. A. 1944. Foundations of plant geography.
Near York.
Chamberlin, T. C. 1877. Native vegetation of eastern
Wisconsin. In ChamberliIl 's Geology of Wiseonsin. 2: 176-187.
Churchill, E. D. 1955. Phytosoeiologieal and environ-
mental eharaeteristies of some plant eommunities in the
Umiat region of Alaska. Eeology 36: 606-627.
Clements, F. E. & G. W. Goldsmitll. 1924. The pllytom-
eter method in eeology; tlle plant alld comlBullity as
instruments. Carnegie Inst. Wash. Publ. 336.
Clifford, H. T. & F. E. Binet. 1954. A quantitative , study of a presumed hybrid sverarm between Eql,calypt?l,s elaeophora and E. gontocatyr. Austral. Jour. Bot. 2:
325-337.
Cole, L. C. 1949. The measurement of interspeeifie as-
soeiation. Ecology 30: 411-424.
Cottam, G. 1949. The phytosociology of an oak woods in south+vestern Wiseonsin. Ecology 30: 271-287.
Cottam, G. & J. T. Curtis. 1949. A method for makillg
rapid surveys of woodlands by means of pairs of
randomly seleeted trees. Ecology 30: 101-104.
Cottam, G., J. T. Curtis, & B. W. Hale. 1953. Some
sampling tharacteristies of a population of randomly
dispersed individuals. Eeology 34: 741-767.
Curtis, J. T. & R. P. McIntosh. 1951. An upland forest continuum in the prairie-forest border region of Wisconsin. Ecology 32: 476-496.
Daubenmire, R. 1954. Vegetation elassifieation. Verof- fentl. des Geobot. Inst. Rubel. 29: 29-34.
deVries, D. M. 1953. Objeetive eombinations of speeies. Aeta Bot. Neerlandiea 1: 497-499.
1954. Constellation of frequent herbage plants, ba sed on their eorrelation in oeeurrenee. Vegetatio 5 & 6: 105-111.
Dice, L. R. 1948. Relationship between frequeney in- dex and population density. Eeology 29: 389-391.
Fisher, R. A. 1936. The use of multiple measurements in taxonomie problems. Ann. Eugen., Lond. 7: 179- 188.
Forbes, S. A. 1907a. An ornithological eross-seetion of Illinois in autumn. Ill. State Lab. Nat. Hist. Bull 7: 305-335.
1907b. On the loeal distribution of eertain Illinois lSshes: An essay in statistieal ecology. Ill. State Lab. Nat. Hist. Bull. 7: 273-303.
. 1925. Method of determining and measuring the assoeiative relations of speeies. Seience 61: 524.-
Gilbert, M. L. 1952. The phytosoeiology of the ander- story vegetation of the upland forests of Wiseonsin. Ph.D. Thesis. Univ. of Wise.
Gilbert, M. L. & J. T. Curtis. 1953. Relation of the understory to the upland forest in the prairie-forest border region of Wiseonsin. Wise. Aead. Sei. Arts Lett. Trans. 42: 183-195.
Gleason, H. A. 1910. The vegetation of the inland sand ileposits of Illinois. Ill. State Lab. Nat. Hist. Bull. 9: 23-174.
1920. Some applications of the quadrat method. Torrey Bot. Club Bull. 47: 21-33.
1926. The individualistie eoncept of the plant association. Torrey Bot. Club Bull. 53: 7-26.
. 1952. The new Britton and Brown illustrated flora of the northeastern Ullited States and adjacent Canada. Laneaster, Penna.: Laneaster Press.
Goodall, D. W. 1953a. Objeetive methods for the classi- fieation of vegetation. I. The use of positive inter- specifie correlation. Austral. Jour. Bot. 1: 39-63.
1953b. Factor analysis in plant sociology. Paper read to Third Internat. Biometric Conf. in Bel- lagio. Sept. 4, 1953.
1954b. Objeetive methods for the classifiea- tion of vegetation. III. An essay in the use of factor analysis. Austral. Jour. Bot. 2: 304-324.
Gregg, J. R. 1954. The language of taxonomy. Ne+r York.
Guinochet, M. 1954 Sur les fondemellts statistiques de la phytosociologie et quelques unes de leurs eonse- quences. VerofEentl. des Geobot. Inst. Rubel. 29: 41-67.
1955. Logique et dynamique du peuplement -egetal. Paris: Masson et Cie.
Hale, M. E., Jr. 1955. Phytosoeiology of cortieolous elA-ptogams in the upland forest of southern Wis- consin. Ecology 36: 45-63.
This content downloaded from 198.199.136.46 on Sun, 01 Mar 2015 21:47:20 UTCAll use subject to JSTOR Terms and Conditions
3+8 J. ROGER BRAY AND J. T. CURTIS Ecological Monographs Vol. 27, No. 4
Hansen, H. M. 1930. Studies on the vegetation of Iceland. In The Botany of Ieeland ( ed. Rosenvinge & Warming). 3(10) :1-186. Copenhagen.
Hanson, H. C. l9aS. Charaeteristies of the Sttpa comata-Boltteloua gracilts-Botlteloua cxrtipendxla as- sociation in northern Colorado. Ecology 36: 269-280.
Hewetson, C. E. 1956. A diseussion on the "elimax" coneept in relation to the tropieal rain and deeiduous forest. Empire Forestry Rev. 35: 274-291.
Horikawa, Y. & K. Okutomi. 1955. The continuum of the vegetation on the slopes of Mt. Shiroyama, Iwa- kuni City, Prov. Suwo. The Seibutsugakkaishi 6: 8-17. (Japanese, English summary. )
Hosokawa, T. 1955-1956. Antintroduetion of 2 x 2 table methods into the studies of the structure of plant communities (on the strueture of the beeeh forests, Mt. Hiko of S. W. Japan ) . Jap. Jour. Ecol. 5: 58-62; 93-100; 150-153. (Japanese, English summary.)
Hughes, R. E. 1954. The applieation of multivariate analysis to (a) problems of elassifieation in eeology; ( b ) the study of the interrelationships of the plant community and environment. Congr. Int'l. de Bot. Rap. et Comm. 8: (seet. 7/8): 16-18.
Isaacson, S. L. 1954. Problems in classifying popula- tions. In Statisties alld Matheluaties ill Biology. (O. Kempthorne, et al., eds.). Ames, Iowa.
Kato, M., M. Toriumi & T. Matsuda. 1955. Mosquito larvae at Mt. Kago-bo near Wakuya, Miyagi Pre- fecture, with speeial referenee to the habitat segrega- tion. Eeol. Rev. 14: 35-39. (Japanese, English sum- mary. )
Kucera, C. L. & R. E. McDermott. 1955. Sugar maple- basswood studies in the forest-prairie transition of eentral Missouri. Amer. Midland Nat. 54: 495-503.
Kulczynski, S. 1927. Zespoly roslill w Pieninaeh (Die Pflanzenassoziation der Pieninen ) . Internat. Aead. Polon. Sei., Lettr. Bull., Classe Sei. Math. et Nat., ser. B. Sci. Nat. Suppl. 2: 1927: 57-203.
Lippmaa, T. 1939. The unistratal eoneept of plant communities. Amer. Midland Nat. 21: 111-145.
Lorenz, J. R. 1858. Allgemeine Resultate aus der pflanzengeographisehen und genetisehen Untersuchung der Moore in praalpinen Hiigellande Salzburg's. Flora 41: 209 et seq.
Lutz, H. J. & R. F. Chandler. 1946. Forest soils. New York.
/ McIntosh, R. P. 1957. The York Woods, a ease history of forest sueeession in southern Wisconsin. Eeology 38: 29-37.
Mitsudera, M. 1924. Stuclies on phytometer II-Phytom- eter method ill commullities. Jap. Jour. Eeol. 4: 113-120. (Japanese, English summary.)
Motyka, J., B. Dobrzanski & S. Zawadzki. 1950. Wstepne badania nad lagami potudniowowschodniej Lubelszezyzny. (Preliminary studies on meadows in the southeast of the provinee Lublin.) Univ. Mariae Curie-Sktodowska Alln. Seet. E. 5 (13): 367-447.
Nash, C. B. 1950. Assoeiations between fish speeies in tributaries and shore waters of western Lake iErie. Ecology 31: 561-566.
hosting, H. J. 1956. The study of plant eommunities. 2d ed. San Fralleiseo: FreenzallL.
Parmalee, G. W. 1953. The oak upland eoznmunity in southern Miehigan. Eeol. Soe. Amer. Bull. 34: 84. ( Abst. ) .
Partch, M. L. 1949. Habitat studies of soil moisture in relation to plants and plant eommunities. Ph.I). Thesis. Univ. of Wise.
Pirie, N. W. 1937. The meaninglessness of the terms ' life n and ' living '. In Perspeetives in Biothemistry (eds. J. Needham & D. E. Green). Cambridge.
Pogrebnjak, P. S. 1930. uber die Methodik der Stand- ortsuntersuehungen in Verbindung mit den Waldty- pen. Internatl. Congr. Forestry Exp. Stations, Stoek- holm Proc. 1929: 455-471.
1955. OSI10Vi lesnoj tipologie (Foundations of forest typology). Publ. Aead. of Sei. of the Ukrainian S. S. R., Kiev.
Poore, M. E. D. 1956. The use of phytosoeiologieal methods in eeologieal investigations. IV. General discussion of phytosoeiologieal problems. Jour. Ee()l. 44: 28-50.
Raabe, E. W. 1952. uber den "Affinitatswert" in der Pflanzensoziologie. Vegetatio 4: 53-68.
Ramensky, L. G. 1930. Zur Methodik der vergleichenX den Bearbeitung und Ordnung von Pflanzenlisten und anderen Objekten, die dureh mehrere, versehiedenartig +rirkende Faktoren bestimmt werden. Beitr. z. Biol. der Pflanz. 18: 269-304.
. 1952. On some prineipal aspeets of present clay geobotany. Bot. Zhur. 37: 181-201. (Russian.)
Randall, W. E. 1951. Interrelations of auteeologieal eharaeteristies of woodland herbs. Ecol. Soe. Amer. Bull. 32: 57. (Abst. )
Shreve, F. 1942. The desert vegetation of North Ameriea. Bot. Rev. 8: 195-246.
Sjors, H. 1950. Regional studies in North Swedish mire vegetation. Botaniska Notiser. I9rao (2): 173- 222.
Sorenson, Th. 1948. A method for establishing groups of equal magnitude in plant soeiology based on simi- larity of speeies eontent. Aeta K. Danske Vidensk. Selsk. Biol. Skr. J. 5: 1-34.
Spalding, V. M. 1909. Probls'" of loeal distribution in arid regions. Amer. Nat. 43: 472-486.
Stewart, G. & W. Keller. 1936. A eorrelative lnethod for eeology as exemplified by studies of native desert vegetation. Eeology 17: 500-514.
Thurstone, L. L. 1947. Multiple-factor analysis. Chica- go: The Univ. of Chicago Press.
Torgerson, W. S. 1952. Multidimensional sealing: I. Theory and method. Psyehometrika 17(4): 401-419.
Tresner, H. D., M. P. Backus & J. T. Curtis. 1954. Soil mierofungi in relation to the hardwood f orest continuum in southerll Wisconsin. Mycologia 46: 314-333.
Tucker, L. G. 1956. Personal eommunieation. Tuomikoski, R. 1942. Untersuehunger uber die Unter-
vegetation der Bruckmoore in Ostfinnland. I. Zur Methodik der pflanzensoziologischen Systematik. Soe. Zool.-Bot. DEenn. Vanamo. Ann. Bot. 17: 1-203.
Vorobyov, D. V. & P. S. Pogrebnjak. 1929. Lisovyi tipologitchnyi visnatehnik ukrainskogo polissya. (A key to Ukrainian forest types.) Trudi z lisovoi dosvi doni spravy na Ukraini 11.
-Watt, A. S. 1947. Pattern and proeess in the plant colnmunity. Jour. Eeol. 35: 1-22.
This content downloaded from 198.199.136.46 on Sun, 01 Mar 2015 21:47:20 UTCAll use subject to JSTOR Terms and Conditions
UPLAND FOREST COMMUNITIES OF SOUTHERN A5i ISCONSIN 349 October, 19 a 7
Webb, D. A. 1954. Is the classification of plant com- munities either possible or desirable @ Bot. Tidsskr. 51: 362-370.
Whitford, P. B. 1949. Distribution of woodland plants in relation to suecession and clonal growth. Ecology 30: 199-208.
Whittaker, R. H. 1951. A criticism of the plant as- soeiation and elimatic elimax concepts. Northw. Sci. 25: 17-31.
. 1952. A study of summer foliage illsect com- munities in the Great Smoky Mountains. Ecol. Monog. 23: 1-44.
1954. Plant populations and the basis of plant indication. Angewandte Pflanzensoziologie, Wien. Festsehrift Aiehinger 1: 183-206.
. 1956. Vegetation of the Great Smoky Moun- tains. EGO1. Monog. 26: 1-80.
Wiedemann, E. 1929. Die ertragskundliehe und wald- bauliche Brauchbarkeit der Waldtypen naeh Cajander im sachsiseher Erzgebirge. Allgemeine Forst und Jagd-Zeitung. 105: 247-254.
Williams, C. B. 1954. The statistical outlook in rela- tion to eeology. Jour. Ecol. 42: 1-13.
Womble, W. H. 1951. DifEerential systematics. (3cience 1 14: 315-322.
This content downloaded from 198.199.136.46 on Sun, 01 Mar 2015 21:47:20 UTCAll use subject to JSTOR Terms and Conditions