31
Melbourne Law School An outrageous idea (or two) Basic income funded by a wealth tax Professor Miranda Stewart (paper with David Ingles and Ben Phillips) 30 May, 2019
Melbourne Law School
An outrageous idea (or two) Basic income funded by a wealth tax
Professor Miranda Stewart
(paper with David Ingles and Ben Phillips)
30 May, 2019
Various reasons given for basic income(or Guaranteed Minimum Income, or Negative Income Tax, or demogrant)
• The robots are coming
• Rising inequality of income
• Rising inequality of wealth
• To address poverty
• We have reached the limits of means tested conditionality
• To support the artists and the painters and the carers
• Freedom
2

Australia’s income inequality is not as low as some might thinkGini on disposable income after tax-transfers (OECD 2019)
3
(Equivalised household disposable income: https://data.oecd.org/hha/household-disposable-income.htm
https://data.oecd.org/inequality/income-inequality.htm
Australia (2014): Gini (market income) 0.483 (disposable income) 0.337

Australia’s wealth inequality much more unequal than income (and intergenerational)
4Chart by Ben Phillips; See further Ryan and Stone 2016 Reserve Bank (ABS and HILDA 14.0)

Henderson Poverty inquiry (1975) in Australia favoured a Guaranteed Minimum Income (GMI) because:
5
• “To emphasise that the right to a minimum income and the obligation to pay tax are but two sides of the same coin.
• To reduce the emphasis placed on special categories in the determination of entitlements and obligations.
• To provide minimum income levels such that Australians do not find themselves in poverty.
• To assure all citizens of a logical sequence of income retention rates as private income increases [i.e. remove high effective marginal tax rates, or ‘poverty traps’]
• To favour neither those whose private income fluctuates nor those whose private income is steady.
• To lighten the administrative load of social security and taxation.
• To achieve all this without markedly worsening the position of any person compared with the present system.”

Design issues for basic income are as important as the fundamental goals
6
Structural features of Australia’s tax-transfer system (context for reform matters…)
• High reliance on progressive income tax
• Tightly targeted (means tested) transfer system
• Relatively low and somewhat narrowly based consumption tax
• Relatively low tax on capital income and gains especially superannuation (incl. refundable franking credits) and the home
• Low, poorly designed land taxation
• No direct wealth tax, but• age pension asset test is an indirect wealth tax on pensioners
• stamp duty is an (inaccurate) upfront tax on land wealth (entry fee)
7

Australia’s social security system is more targeted than any other OECD countryRatio of transfers received by poorest 20% to those received by richest 20%Source: Calculated from Table s 3 and 5, OECD , 2014, http://www.oecd-ilibrary.org/economics/economic-growth-from-the-household-perspective_5jz5m89dh0nt-en
Chart by Peter Whiteford
This means it is difficult to deal with higher needs (ageing population, etc) by more targeting, without pushing (many more) people into poverty

Fundamentals of a BI with tax financing• Assume an equal payment to all citizens• Proportional (flat, or linear) tax rate on private income
(could have sur-tax at the top)• No tax on BI
9
Disposable income= BI + (private income * (1 – Tax Rate))
• So, the BI is taxed back as income rises; the Required Tax Rate to finance it is crucial
• This is equivalent to tapering or phasing out the BI at the tax rate

Example of BI with proportional tax rate
10
Can we afford a basic income?
11
• Henderson estimated for basic GMI at poverty line, proportional tax rate needs to be 50% on private income
• Dawkins et al (1998) suggest proportional tax rate above 50%
• Scutella (2004) models proportional rate of 55% or even higher
• Quiggin more recently speculated about a 40% tax rate on the BI and market income
• Ben Phillips modelled age pension level BI for every adult, and payment for every child, financed by adding 33% to every progressive tax rate in the system, i.e. rates from 33% up to 75% in the income tax
Are these rates too high for you?
i.e. What is the required tax rate on private income to finance a specified level of payment?
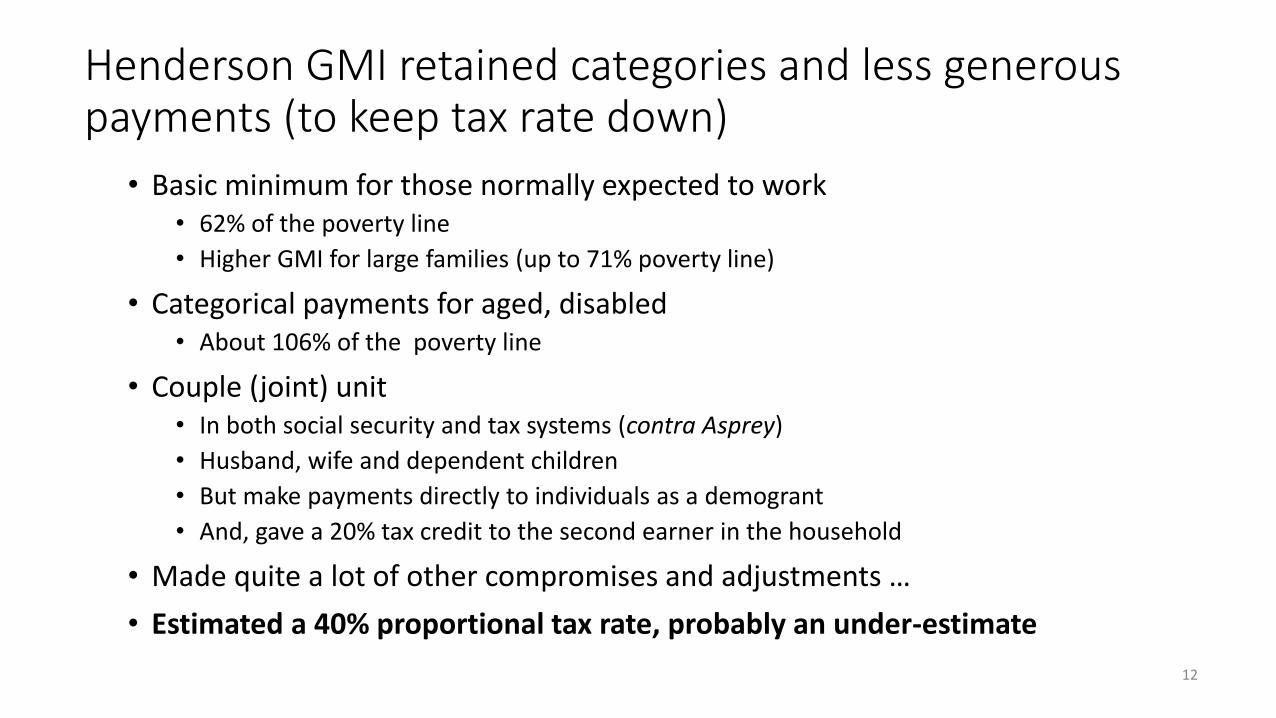
Henderson GMI retained categories and less generous payments (to keep tax rate down)
• Basic minimum for those normally expected to work• 62% of the poverty line
• Higher GMI for large families (up to 71% poverty line)
• Categorical payments for aged, disabled• About 106% of the poverty line
• Couple (joint) unit• In both social security and tax systems (contra Asprey)
• Husband, wife and dependent children
• But make payments directly to individuals as a demogrant
• And, gave a 20% tax credit to the second earner in the household
• Made quite a lot of other compromises and adjustments …
• Estimated a 40% proportional tax rate, probably an under-estimate
12

Can we afford a basic income?What about broadening the tax base?
13
• Troy Henderson and Spies-Butcher suggest taxing the family home
• David Ingles suggested broadening and raising the GST and introducing a payroll tax
• Richard Holden and Rosalind Dixon suggest a carbon tax with a ‘carbon dividend’
We modelled four options for a BI today starting from our current system
• To finance it, we model a net wealth tax and estimate the required tax rate on earned income
• A wealth tax of 2% on net assets is approximately equal to deeming income at a rate of return of 5 per cent and taxing at about 40%
14
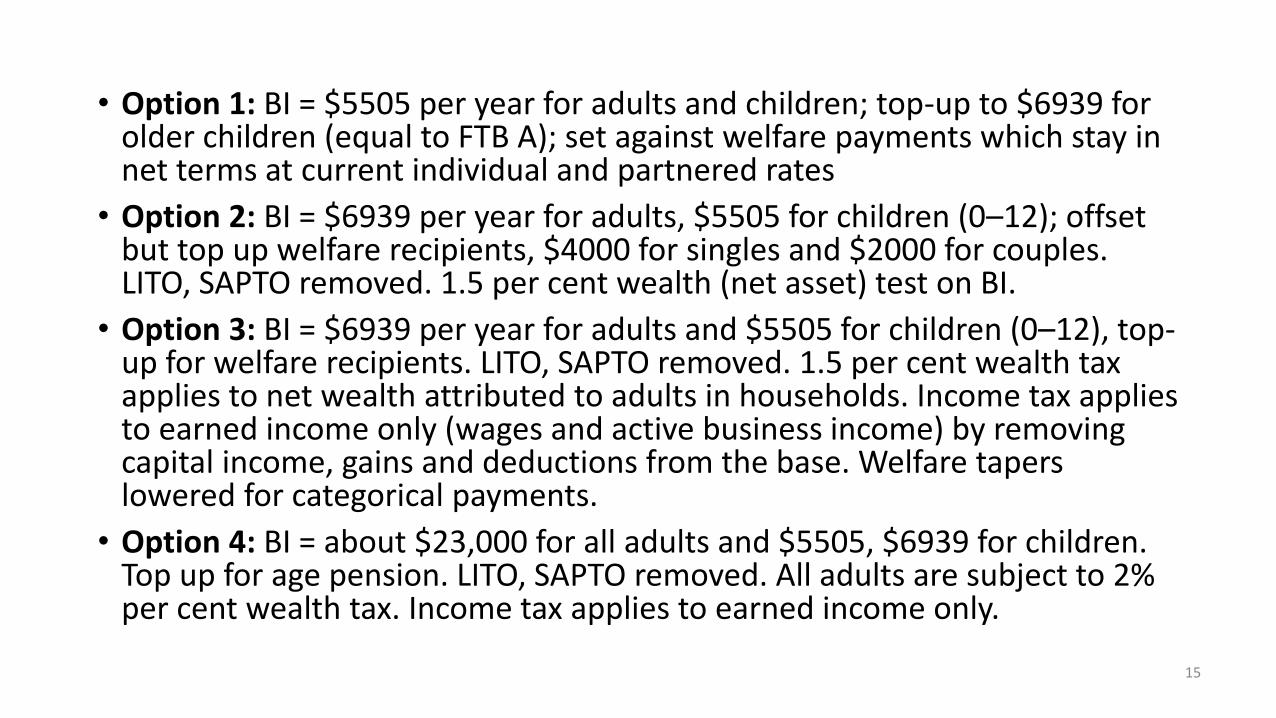
• Option 1: BI = $5505 per year for adults and children; top-up to $6939 for older children (equal to FTB A); set against welfare payments which stay in net terms at current individual and partnered rates
• Option 2: BI = $6939 per year for adults, $5505 for children (0–12); offset but top up welfare recipients, $4000 for singles and $2000 for couples. LITO, SAPTO removed. 1.5 per cent wealth (net asset) test on BI.
• Option 3: BI = $6939 per year for adults and $5505 for children (0–12), top-up for welfare recipients. LITO, SAPTO removed. 1.5 per cent wealth tax applies to net wealth attributed to adults in households. Income tax applies to earned income only (wages and active business income) by removing capital income, gains and deductions from the base. Welfare tapers lowered for categorical payments.
• Option 4: BI = about $23,000 for all adults and $5505, $6939 for children. Top up for age pension. LITO, SAPTO removed. All adults are subject to 2% per cent wealth tax. Income tax applies to earned income only.
15
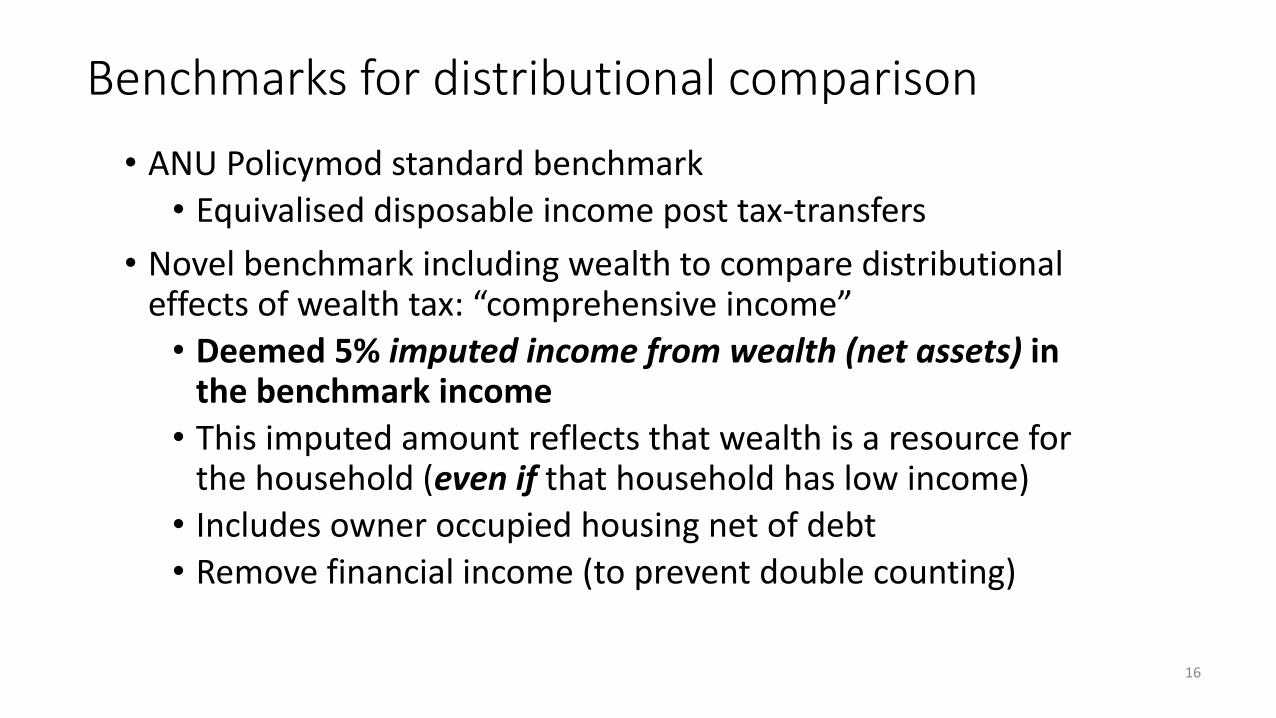
Benchmarks for distributional comparison
• ANU Policymod standard benchmark
• Equivalised disposable income post tax-transfers
• Novel benchmark including wealth to compare distributional effects of wealth tax: “comprehensive income”
• Deemed 5% imputed income from wealth (net assets) in the benchmark income
• This imputed amount reflects that wealth is a resource for the household (even if that household has low income)
• Includes owner occupied housing net of debt
• Remove financial income (to prevent double counting)
16
• Option 1: BI = $5505 per year for adults and children; top-up to $6939 for older children (equal to FTB A); set against welfare payments which stay in net terms at current individual and partnered rates. Abolish FTB B.

Option 1 – Low payment; income tax
18Source: Policymod (2018)
RTR = 32% first dollar of income up to $37,000; standard PIT rates above that. Fiscal cost $90 billion
-10.0%
-8.0%
-6.0%
-4.0%
-2.0%
0.0%
2.0%
4.0%
6.0%
8.0%
10.0%
Couple, Children Couple Only Lone Person Single Parent
% Change in disposable income, by comprehensive Income (Broad)
Q1 Q2 Q3 Q4 Q5

• Option 2: BI = $6939 per year for adults, $5505 for children (0–12); offset but top up welfare recipients, $4000 for singles and $2000 for couples. LITO, SAPTO removed. 1.5 per cent wealth (net asset) test on BI only.
19

Option 2
20Source: Policymod (2018)
Option 2: RTR = 19% first dollar of income up to $37,000; standard PIT rates. 1.5% asset test on BI. Fiscal cost $40 billion
-20.0%
-15.0%
-10.0%
-5.0%
0.0%
5.0%
10.0%
15.0%
20.0%
Couple, Children Couple Only Lone Person Single Parent
% Change in disposable income, by Comprehensive Income (Broad)
Q1 Q2 Q3 Q4 Q5
• Option 3: BI = $6939 per year for adults and $5505 for children (0–12), top-up for welfare recipients. LITO, SAPTO removed. 1.5 per cent wealth tax applies to net wealth attributed to adults in households. Income tax applies to earned income only (wages and active business income) by removing capital income, gains and deductions from the base. Welfare tapers lowered for categorical payments.
21
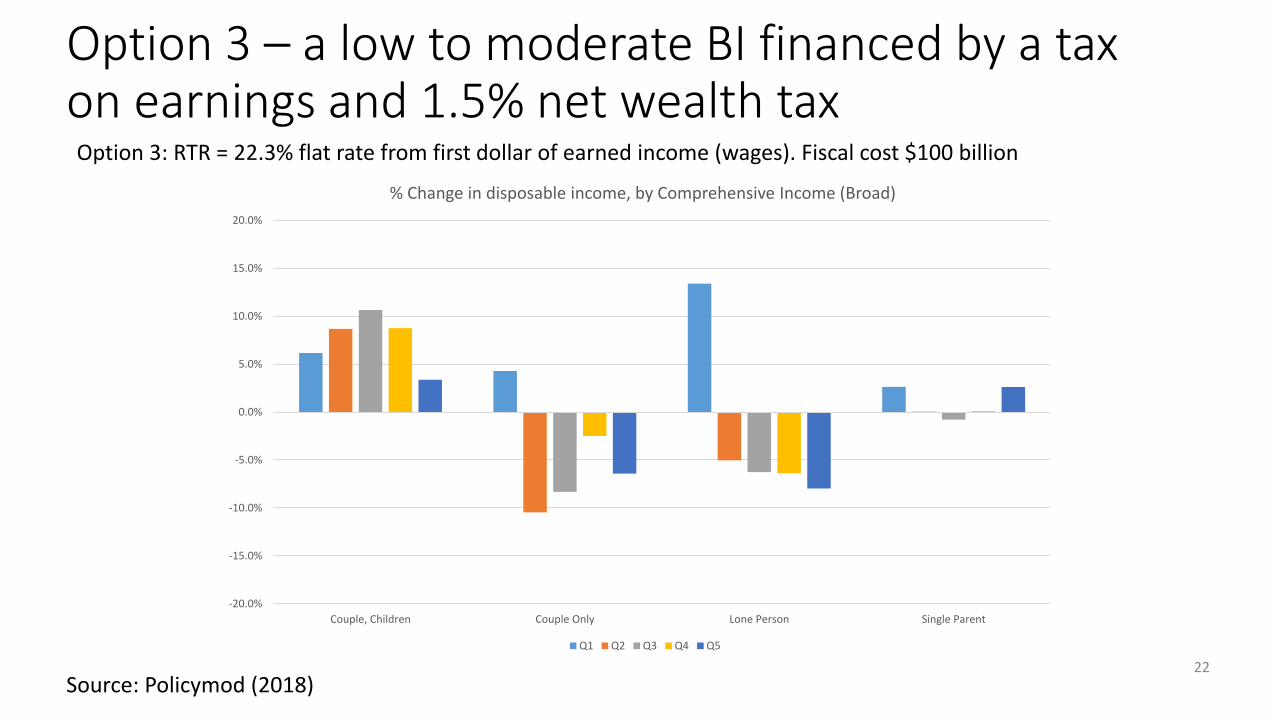
Option 3 – a low to moderate BI financed by a tax on earnings and 1.5% net wealth tax
22
Source: Policymod (2018)
-20.0%
-15.0%
-10.0%
-5.0%
0.0%
5.0%
10.0%
15.0%
20.0%
Couple, Children Couple Only Lone Person Single Parent
% Change in disposable income, by Comprehensive Income (Broad)
Q1 Q2 Q3 Q4 Q5
Option 3: RTR = 22.3% flat rate from first dollar of earned income (wages). Fiscal cost $100 billion
• Option 4: BI = about $23,000 for all adults and $5505, $6939 for children. Top up for age pension. LITO, SAPTO removed. All adults are subject to 2% per cent wealth tax. Income tax applies to earned income only.
23

Option 4 – a generous BI financed by 2% wealth tax and a moderate tax on earnings
24Source: Policymod (2018)
-20.0%
-15.0%
-10.0%
-5.0%
0.0%
5.0%
10.0%
15.0%
20.0%
Couple, Children Couple Only Lone Person Single Parent
% Change in disposable income, by comprehensive income (Broad)
Q1 Q2 Q3 Q4 Q5
Option 4: RTR = 38.3% flat rate from first dollar of earned income (wages). Fiscal cost $264 billion
To conclude this outrageous discussion:
• You can finance a low universal BI by ‘cashing out’ the tax-free threshold and bottom marginal rates, taxing quite a few people more, keeping categories and keeping Newstart where it is now …
• You can finance a generous universal BI with a moderate tax rate on earned income – and a whopping net wealth tax• This would be much more redistributional, would minimise high effective
marginal tax rates and would shift people out of poverty
• So … What are you waiting for ?!
25

Thank you

EXTRA SLIDES

Microsimulation of BI proposals:ANU PolicyMod
• Static microsimulation model of Australian tax and social security systems
• Simulate existing system and proposed BI variations
• Based on microdata updated annually• Records of individual people or households
• Each proposed BI ‘policy world’ is compared with ‘current world’ for each of the 17,000 families in the ABS survey file.
• Shows impact of policy changes• Fiscal (revenue and expenditure) on government budget
• Distributional (winners and losers) by quintile
• Effective marginal tax rates
2828
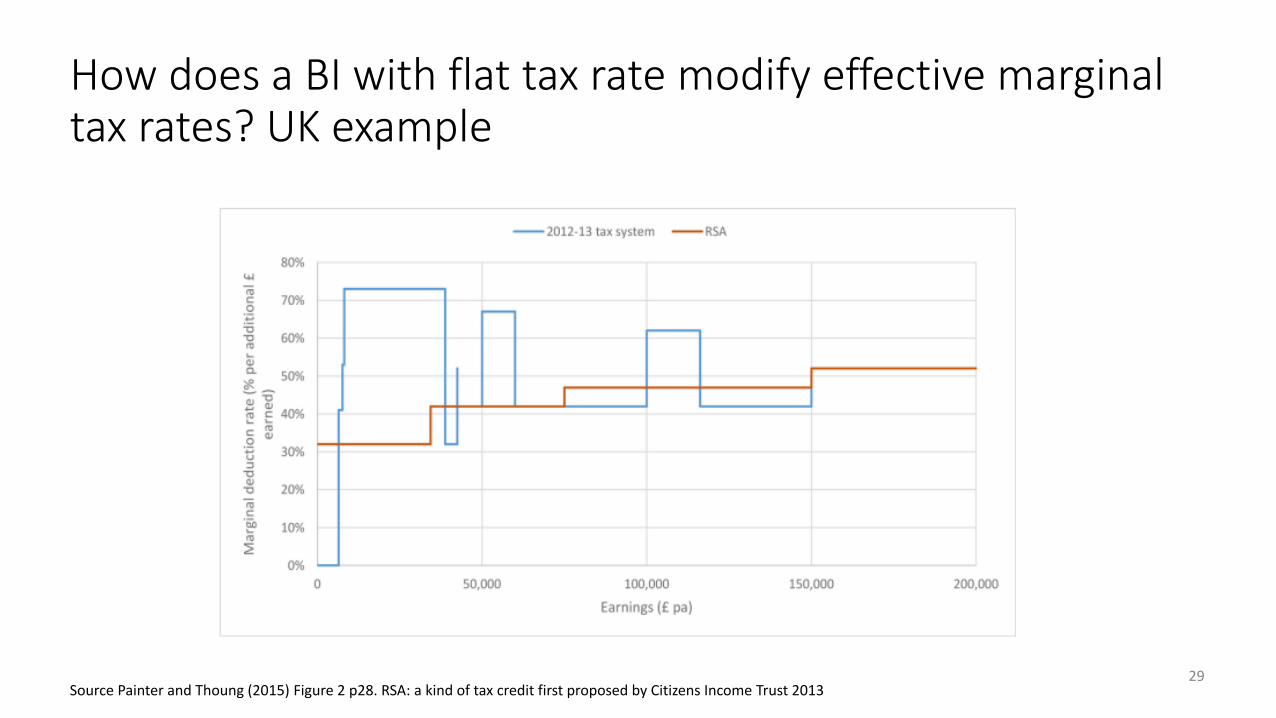
How does a BI with flat tax rate modify effective marginal tax rates? UK example
29Source Painter and Thoung (2015) Figure 2 p28. RSA: a kind of tax credit first proposed by Citizens Income Trust 2013
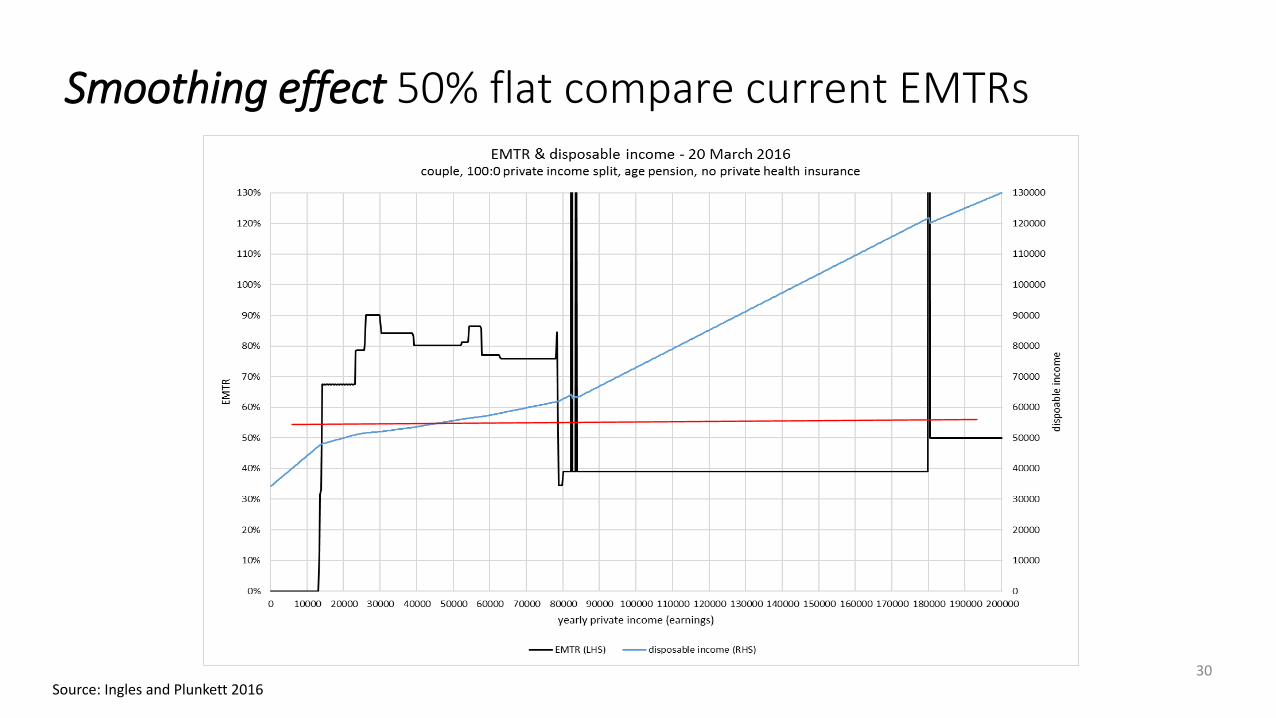
30Source: Ingles and Plunkett 2016
Smoothing effect 50% flat compare current EMTRs
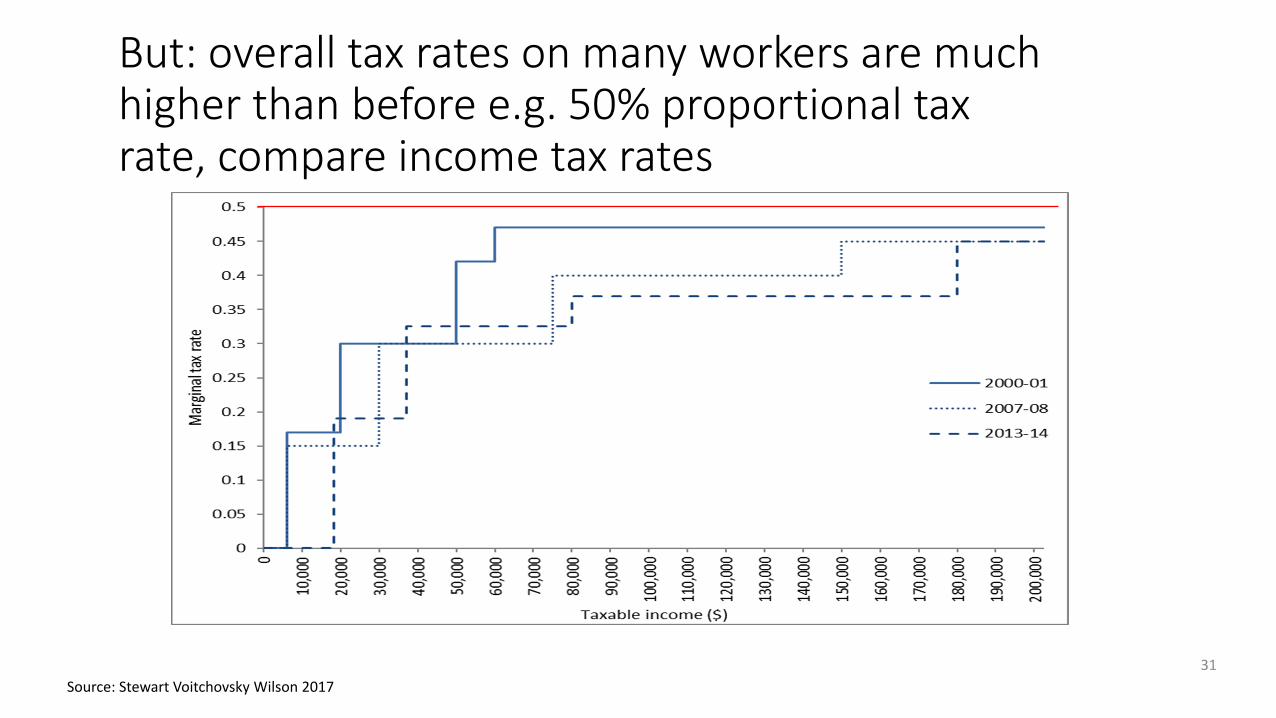
But: overall tax rates on many workers are much higher than before e.g. 50% proportional tax rate, compare income tax rates
31
Source: Stewart Voitchovsky Wilson 2017


