Page 1
An overview about monitors colors rendering
TOADERE FLORIN, NIKOS E. MASTORAKIS
INCDTIM Cluj Napoca Str. Donath, nr. 65-103,
Cluj Napoca, 400293, ROMANIA [email protected]
WSEAS Research Department
Agiou Ioannou Theologou 17-23
Zografou, 15773, Athens, GREECE
[email protected]
Abstract: - The goal of this paper is to study how different TV technologies work, and to compare them. We
analyze three different situations: a CRT monitor, a LCD monitor and a LEDs monitor. Using the different
monitors’ spectral power distributions, we propose a six steps spectral image processing algorithm which
converts the spectral image in to XYZ standard and then in to the RGB standard. Finally we colour balance the
RGB image in order to eliminate the monitors unwanted render colours hues. On the monitors displays we
expect to see the same colours text image. Also we present the monitor’s colours properties like: colours
saturation, brightness, contrast and sharp.
Key-Words: - spectral image, CRT, LCD, LED monitors, monitors spectral power distribution, render image
colors properties.
1 Introduction In recent years multimedia technologies gained a lot
of popularity, and during these years has appeared
different new TV technologies. The most important characteristic of a TV is the colors rendering. A
display device is an output device for presentation of
information for visual and additive perception,
which was transmitted in various forms. When the
input information is supplied as an electrical signal,
the display is called electronic display [19]. A
monitor display is a piece of electrical equipment
which displays images generated by devices such as
computers, without producing a permanent record.
The monitor comprises the display device, circuitry,
and an enclosure. The display device in modern
monitors is typically a thin film transistor liquid
crystal display (TFT-LCD), while older monitors
use a cathode ray tube (CRT). More general the
display technologies can be characterized as:
emissive (CRT, gas plasma), Transsmitive (Liquid
Crystal Displays (LCD), Liquid Crystal on Silicon
(LCOS)) and Reflective Displays (Digital Light
Processing (DLP), Organic Led Displays (OLED))
[6, 19].
In this paper our goal is to analyze from each
category of display technology a representative TV
display and to make a comparison between
monitors’ colors rendering possibilities. We analyze
the CRT, the LCD and the LEDs monitors. In order
to do that we use an illumination algorithm in which
we use as input data the displays’ spectral power distribution. In function of the monitor spectral
power distribution, for the color checker input text
image, we obtain the brut monitor colors render for
each monitor. In order to obtain the final monitor
render image we make the color balance. We expect
to see on each monitor the same input colors image
without any color differences.
After the TV or the monitor is tested, peoples use
to watch television or to work on computers and
they appreciate the quality parameters of the colors
render images like: luminosity, colors saturation,
contrast, brightness and sharpness [2,4-6,10,11,14].
We image simulate the colors render image
properties, that can be easily modified using a
remote control or the adjustments buttons form TV
and computer monitors.
2 The monitors colors rendering Color vision is the capacity of an organism or
machine to distinguish objects based on the
wavelengths of the light they reflect or emit. Color
derives from the spectrum of light (in our case the
display light emission) interacting in the eye with
the spectral sensitivities of the light receptors. The
WSEAS TRANSACTIONS on CIRCUITS and SYSTEMS Toadere Florin, Nikos E. Mastorakis
ISSN: 1109-2734 32 Issue 1, Volume 9, January 2010
Page 2
nervous system derives color by comparing the
responses to light from the three types of cone
photoreceptors in the eye L, M, S (long, medium
and short) equivalent to R, G, B (red, green and
blue) colors [9-12,18]. Reflected color can be
measured using a reflectometer, which takes
measurements in the visible region of a given color
sample. If the custom of taking readings at 3.7
nanometer increments is followed, the visible light
range of 400-700nm will yield 81 readings [13].
These readings are typically used to draw the
sample's spectral reflectance curve. The color
checker spectral image is defined as a 496X256X81.
In order to render colors on a display we use an
algorithm that convert the spectral image in to XYZ
standard, and then in to the RGB standard in
function of each monitor spectral power distribution
[3,6,18]. Each monitor has a different spectral power
distribution consequently we expect to have on each
display the same image with different colors hues.
Finally we make the white balance in order to
perceive a more realistic colors image. The white
balance is the process of removing unrealistic color
casts, so that objects which appear white in person
view are rendered white on the display image. Human vision is sensitive to visible light, that
part of the electromagnetic spectrum with
wavelengths from about 400 to 700 nm.
Complementary displays render colors images in the
visible wavelength band, in order to be perceived by
human eyes. In our analysis color rendering means
the ability of display or monitor to show true colors
as they are seen outdoors in sunlight (or indoor
under different bulbs illumination) by the normal
human eyes. Our system consists of a spectral image [13]
which is used as the text image (the color checker
image), and the CRT, the LCD and the LEDs
monitors which render the illuminate image. We see
the color checker text image on the monitors’
screens. The monitors have different spectral power
distributions [3,6,12,15] and in function of these we
see the text image having different hues. In order to
eliminate the image colors hues, we color balance
the image.
2.1 The spectral image processing algorithm In this paper we use a spectral image under the
Spectral Binary File Format (.spb). This format has
the following characteristics: file identifier is a 3
letter string SPB (Spectral Binary file) located at the
beginning of the file. Image dimensions and
wavelength values are stored in file header.
Dimensions (x, y and n) are stored in uint32 format
and wavelength values in foat32 format. Spectral
image values are reflectance values stored as float32.
Spectral image values are scaled between 0 and 1,
where 1 describes maximum reflectance. Image data
is written to the file in column order and values are
stored in little endian form [13].
If we perceive light that is reflected from a
surface, instead of light that is directly emitted from
a light source, our eyes receive result of the scalar
product of reflectance and radiance spectrum. In
continuous case human eye response is:
λλλλλ
λ
dlrSc ii )()()(max
min
∫= i = S, L, M (1)
)(λiS is the function of sensitivity of the i-th type
of cones,
)(λr is the fraction of the reflected illuminant
energy,
)(λl is the spectral distribution of light,
L, M, and S are the responses of the long, medium,
and short cones of the eye [9-12,14-18].
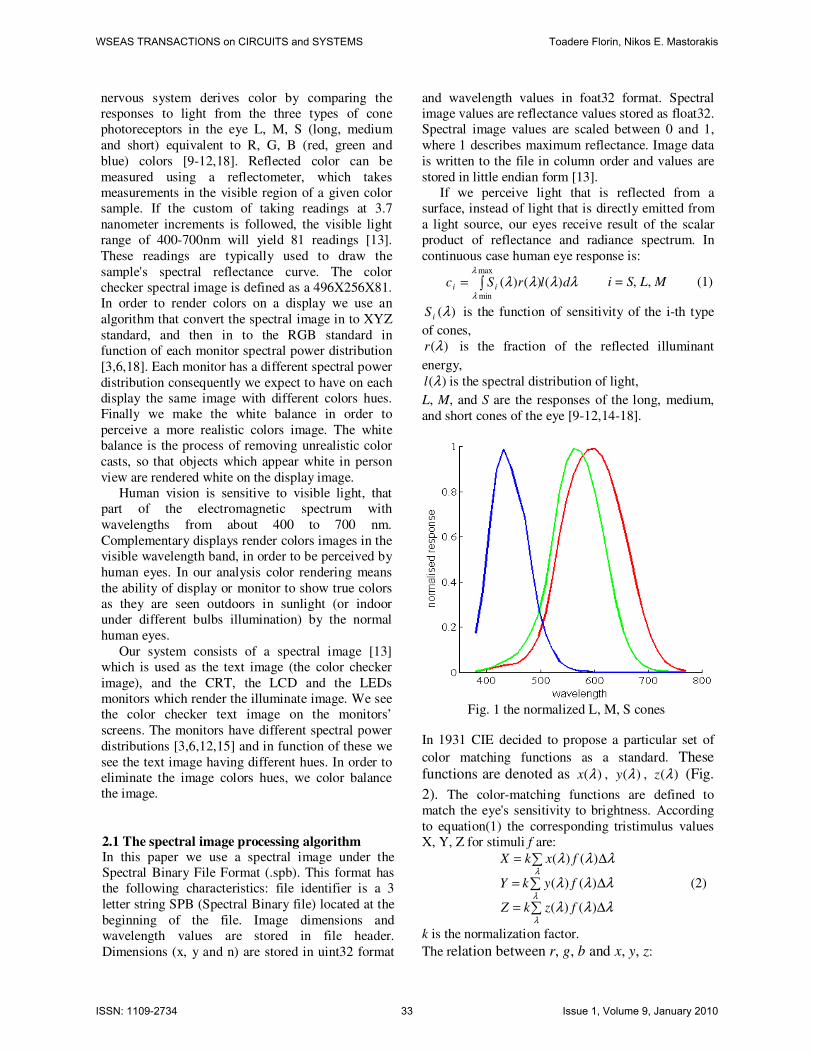
Fig. 1 the normalized L, M, S cones
In 1931 CIE decided to propose a particular set of
color matching functions as a standard. These functions are denoted as )(λx , )(λy , )(λz (Fig.
2). The color-matching functions are defined to
match the eye's sensitivity to brightness. According
to equation(1) the corresponding tristimulus values
X, Y, Z for stimuli f are:
∑
∑
∑
∆=
∆=
∆=
λ
λ
λ
λλλ
λλλ
λλλ
)()(
)()(
)()(
fzkZ
fykY
fxkX
(2)
k is the normalization factor.
The relation between r, g, b and x, y, z:
WSEAS TRANSACTIONS on CIRCUITS and SYSTEMS Toadere Florin, Nikos E. Mastorakis
ISSN: 1109-2734 33 Issue 1, Volume 9, January 2010
Page 3
⋅
=
b
g
r
z
y
x
95.011.001.0
072.0715.0212.0
180.0357.0412.0
. (3)
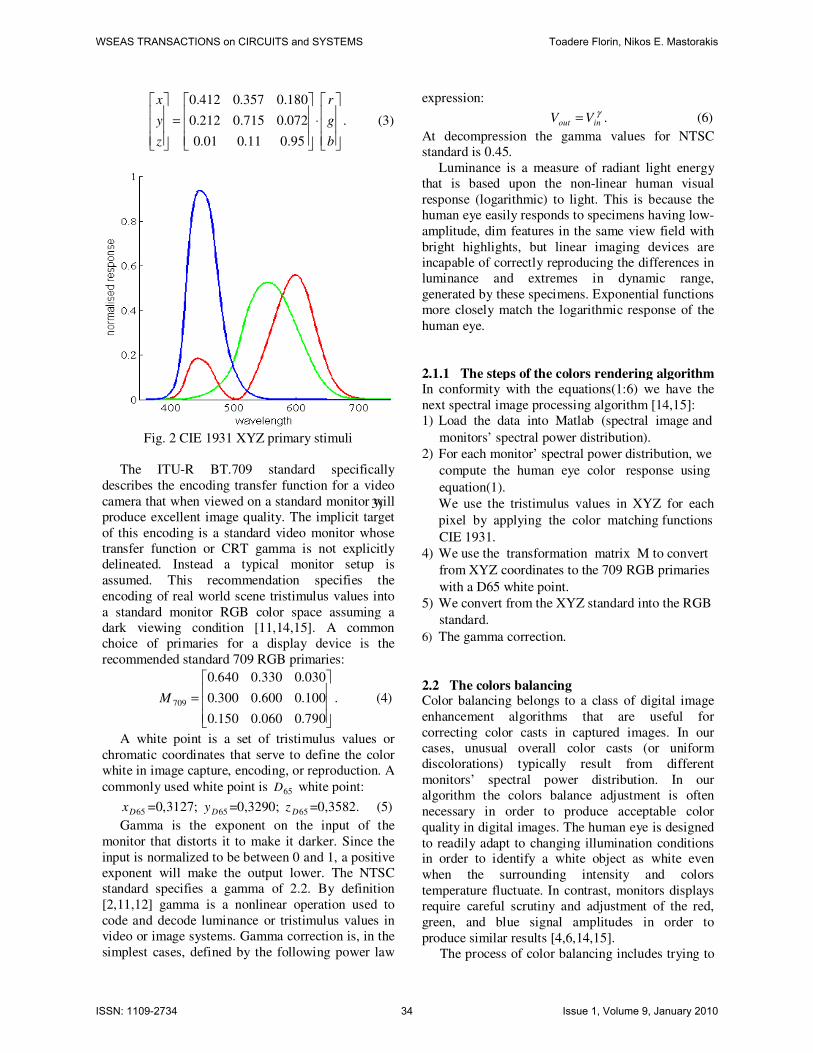
Fig. 2 CIE 1931 XYZ primary stimuli
The ITU-R BT.709 standard specifically
describes the encoding transfer function for a video
camera that when viewed on a standard monitor will produce excellent image quality. The implicit target
of this encoding is a standard video monitor whose transfer function or CRT gamma is not explicitly delineated. Instead a typical monitor setup is
assumed. This recommendation specifies the
encoding of real world scene tristimulus values into
a standard monitor RGB color space assuming a dark viewing condition [11,14,15]. A common choice of primaries for a display device is the
recommended standard 709 RGB primaries:
=
790.0060.0150.0
100.0600.0300.0
030.0330.0640.0
709M . (4)
A white point is a set of tristimulus values or
chromatic coordinates that serve to define the color
white in image capture, encoding, or reproduction. A
commonly used white point is 65D white point:
65Dx =0,3127; 65Dy =0,3290; 65Dz =0,3582. (5)
Gamma is the exponent on the input of the
monitor that distorts it to make it darker. Since the
input is normalized to be between 0 and 1, a positive
exponent will make the output lower. The NTSC
standard specifies a gamma of 2.2. By definition
[2,11,12] gamma is a nonlinear operation used to
code and decode luminance or tristimulus values in
video or image systems. Gamma correction is, in the
simplest cases, defined by the following power law
expression:
γinout VV = . (6)
At decompression the gamma values for NTSC
standard is 0.45.
Luminance is a measure of radiant light energy
that is based upon the non-linear human visual
response (logarithmic) to light. This is because the
human eye easily responds to specimens having low-
amplitude, dim features in the same view field with
bright highlights, but linear imaging devices are
incapable of correctly reproducing the differences in
luminance and extremes in dynamic range,
generated by these specimens. Exponential functions
more closely match the logarithmic response of the
human eye.
2.1.1 The steps of the colors rendering algorithm In conformity with the equations(1:6) we have the
next spectral image processing algorithm [14,15]:
1) Load the data into Matlab (spectral image and
monitors’ spectral power distribution).
2) For each monitor’ spectral power distribution, we
compute the human eye color response using
equation(1).
3) We use the tristimulus values in XYZ for each
pixel by applying the color matching functions
CIE 1931.
4) We use the transformation matrix M to convert
from XYZ coordinates to the 709 RGB primaries
with a D65 white point.
5) We convert from the XYZ standard into the RGB
standard.
6) The gamma correction.
2.2 The colors balancing Color balancing belongs to a class of digital image
enhancement algorithms that are useful for
correcting color casts in captured images. In our
cases, unusual overall color casts (or uniform
discolorations) typically result from different
monitors’ spectral power distribution. In our
algorithm the colors balance adjustment is often
necessary in order to produce acceptable color
quality in digital images. The human eye is designed
to readily adapt to changing illumination conditions in order to identify a white object as white even
when the surrounding intensity and colors
temperature fluctuate. In contrast, monitors displays
require careful scrutiny and adjustment of the red,
green, and blue signal amplitudes in order to
produce similar results [4,6,14,15].
The process of color balancing includes trying to
WSEAS TRANSACTIONS on CIRCUITS and SYSTEMS Toadere Florin, Nikos E. Mastorakis
ISSN: 1109-2734 34 Issue 1, Volume 9, January 2010
Page 4
determine what the illuminant of a particular scene
(display) is and then adjusting the intensities of the
red, green, and blue channel of the image, in order to
recover the original color characteristics of the
scene. Since for most images, we can not accurately
determine the scene illuminant, we considered a
Mean and Standard Deviation algorithm [4, 14]. We
noticed that many of the images seem to be lacking
in contrast, making them appear hazy. They also
appeared to be quite dark in color, an indication of
low mean channel values. Therefore, in addition to
adjusting the standard deviation values we adjust the
mean of each channel as well. To compensate for
these shortcomings in the original image, we adjust
the mean of each channel to be 0.5, and we also set
the standard deviation of each to be roughly 0.27 (or
70 on a 256 value scale).
3 The display overview Image rendering electronic displays can be divided
into projective displays and reflective displays.
Projective displays can be of two types emissive and
transsmitive. Emissive displays are those in which
the image-forming element also serves as the source
of light, while transsmitive displays modulate some
aspect of an extrinsic illumination source. There are
currently a large number of display technologies for
rendering electronic images; the cathode ray tube
(CRT) is the dominant emissive technology while
the liquid crystal display (LCD) is the pervasive
transsmitive technology. Also, nowadays they are
light emitting diodes (LEDs) screens which
represent the reflective displays [6-8,19]. The
purpose of the display characterization is to specify
the relationship between the values that control the
input into the display and the light emitted by the
display. The output is characterized by the monitors’
SPD and the input by the monitors’ frame buffers. In our paper each display is characterized by
its own spectral power distribution. The spectral
power distribution of a display represents the power radiated by the screen at the various wavelengths of
the visible spectrum. In order to see how the
monitors render colored text image, we use the
monitors’ spectrums as input data in our spectral
image processing algorithm. The spectral power
distribution of each of the individual channel adds
linearly when combinations of the color channels
are turned on. We compare the SPD of the white
channel at specific channel color values with the
sum of the SPD of the individual R, G, and B
channels at the same channel color values. The
results in (Fig. 3,5,7) show that there is very little
discrepancy between the SPD of combinations of
different channel color values to the corresponding
sum of the SPD of the individual color values [12]. The primary roles of the frame buffer are the
storage, conditioning, and output of the video
signals that drive the display device. Gamma
(equation 6) gives the relationship between the
frame buffer values and the intensity of the display
primaries. Each type of monitor has its own gamma
function, which has a very different shape in
comparison with the other monitors gamma
functions.
3.1 The CRT monitor’s operating principle In a CRT monitor an electron beam hits a phosphor
screen exciting it to emit a visible photon. Video
input voltages are applied to each electron gun
assembly, which includes control grids for modulating the beam current flowing from the
cathodes as well as electrodes to accelerate, shape
and focus the electron beams on the phosphor-
coated faceplate. The electrons that pass through the
shadow-mask apertures excite the R, G, and B
phosphors. The phosphors absorb electrons which
cause the light emission in a process called
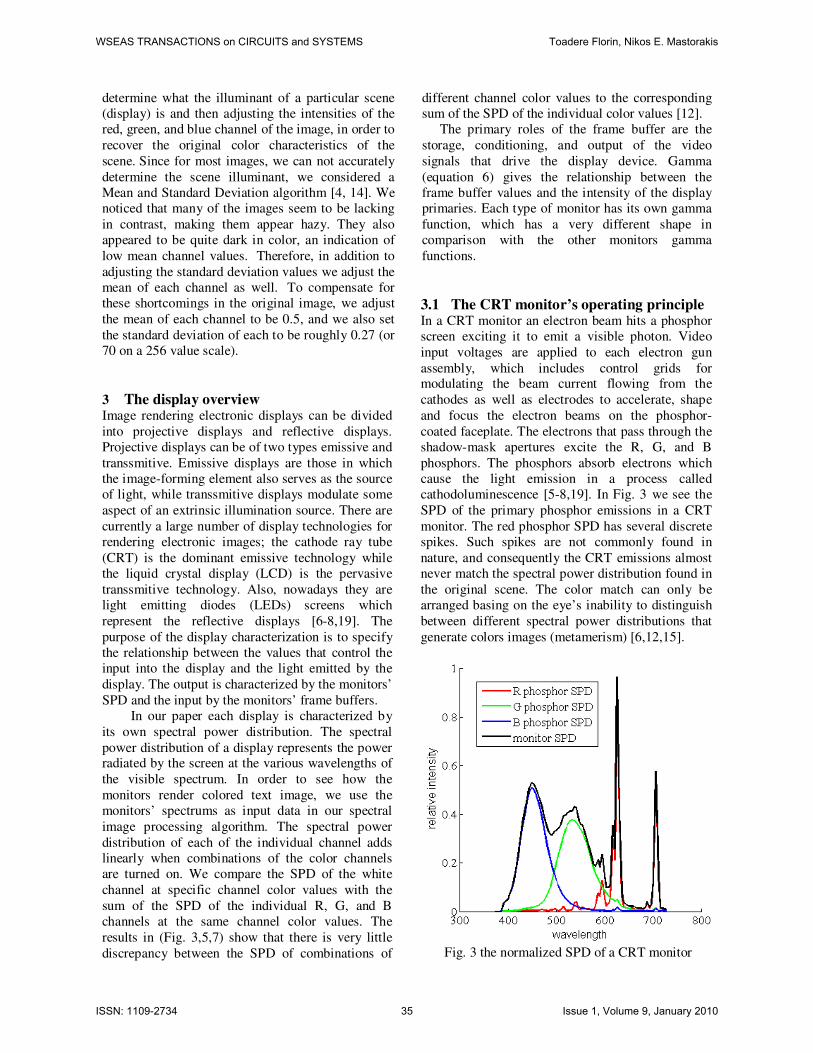
cathodoluminescence [5-8,19]. In Fig. 3 we see the
SPD of the primary phosphor emissions in a CRT
monitor. The red phosphor SPD has several discrete
spikes. Such spikes are not commonly found in
nature, and consequently the CRT emissions almost
never match the spectral power distribution found in
the original scene. The color match can only be
arranged basing on the eye’s inability to distinguish
between different spectral power distributions that
generate colors images (metamerism) [6,12,15].
Fig. 3 the normalized SPD of a CRT monitor
WSEAS TRANSACTIONS on CIRCUITS and SYSTEMS Toadere Florin, Nikos E. Mastorakis
ISSN: 1109-2734 35 Issue 1, Volume 9, January 2010
Page 5
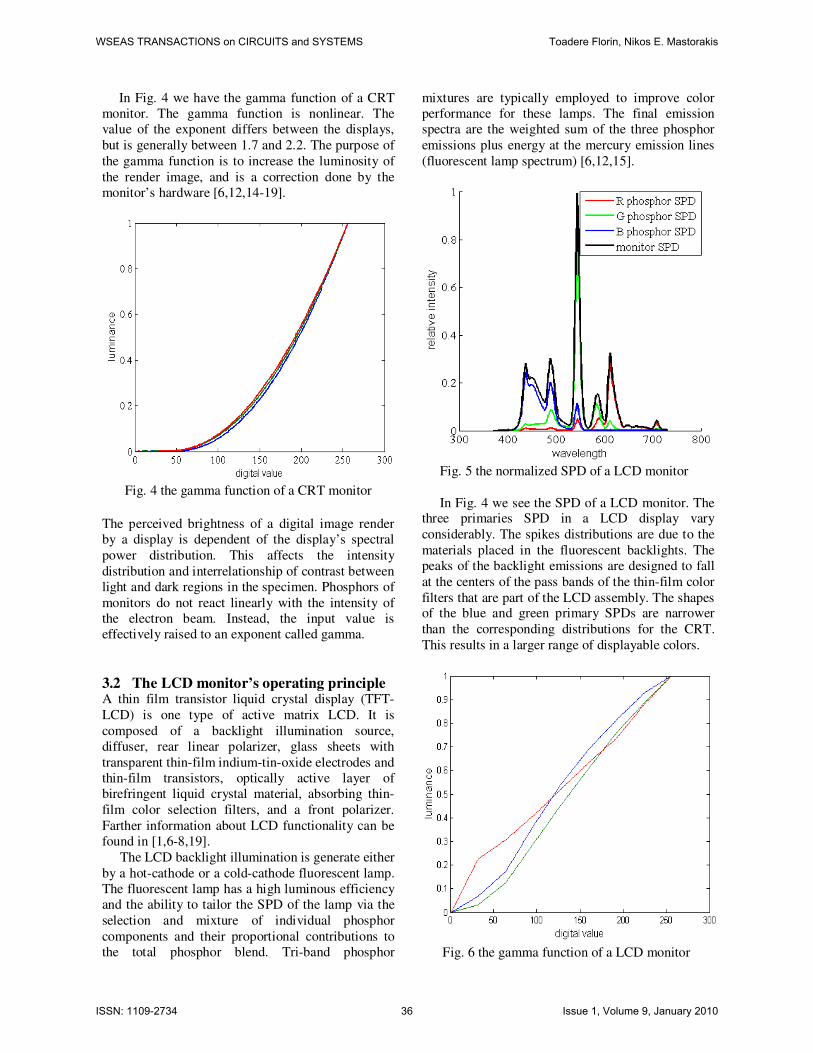
In Fig. 4 we have the gamma function of a CRT
monitor. The gamma function is nonlinear. The
value of the exponent differs between the displays,
but is generally between 1.7 and 2.2. The purpose of
the gamma function is to increase the luminosity of
the render image, and is a correction done by the
monitor’s hardware [6,12,14-19].
Fig. 4 the gamma function of a CRT monitor
The perceived brightness of a digital image render
by a display is dependent of the display’s spectral
power distribution. This affects the intensity
distribution and interrelationship of contrast between
light and dark regions in the specimen. Phosphors of
monitors do not react linearly with the intensity of
the electron beam. Instead, the input value is
effectively raised to an exponent called gamma.
3.2 The LCD monitor’s operating principle A thin film transistor liquid crystal display (TFT-
LCD) is one type of active matrix LCD. It is
composed of a backlight illumination source,
diffuser, rear linear polarizer, glass sheets with
transparent thin-film indium-tin-oxide electrodes and
thin-film transistors, optically active layer of
birefringent liquid crystal material, absorbing thin-
film color selection filters, and a front polarizer.
Farther information about LCD functionality can be
found in [1,6-8,19]. The LCD backlight illumination is generate either
by a hot-cathode or a cold-cathode fluorescent lamp.
The fluorescent lamp has a high luminous efficiency
and the ability to tailor the SPD of the lamp via the
selection and mixture of individual phosphor
components and their proportional contributions to
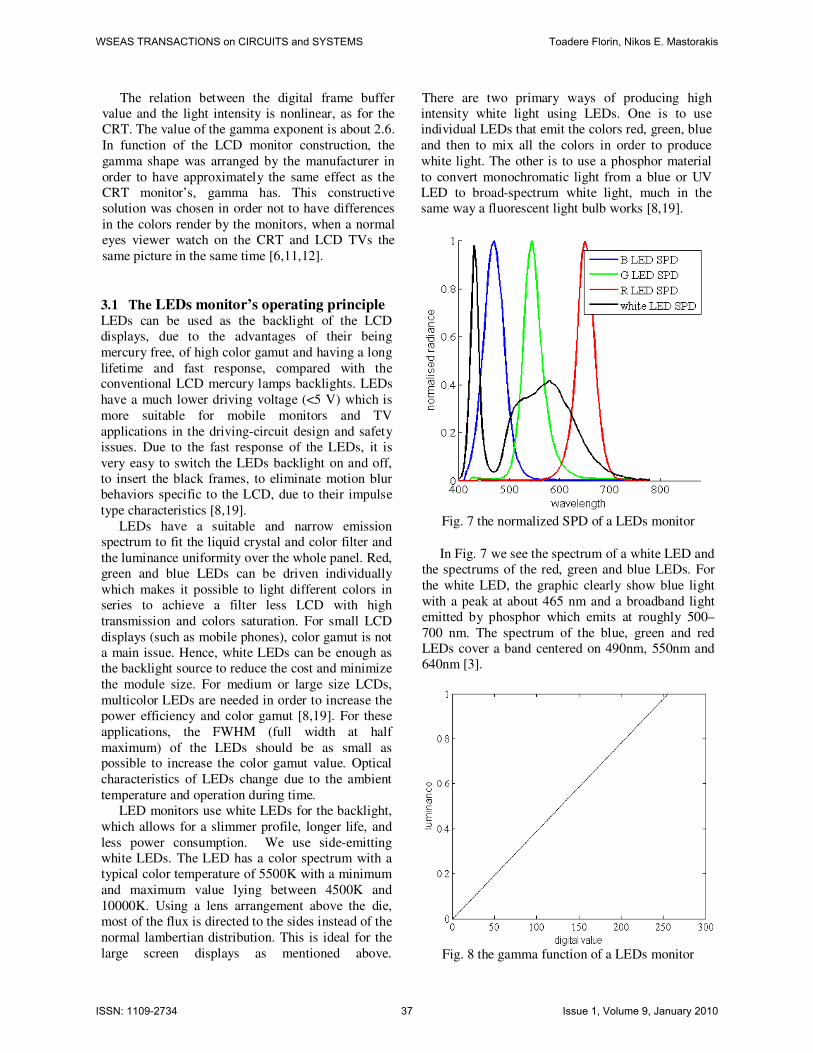
the total phosphor blend. Tri-band phosphor
mixtures are typically employed to improve color
performance for these lamps. The final emission
spectra are the weighted sum of the three phosphor
emissions plus energy at the mercury emission lines
(fluorescent lamp spectrum) [6,12,15].
Fig. 5 the normalized SPD of a LCD monitor
In Fig. 4 we see the SPD of a LCD monitor. The three primaries SPD in a LCD display vary
considerably. The spikes distributions are due to the
materials placed in the fluorescent backlights. The
peaks of the backlight emissions are designed to fall
at the centers of the pass bands of the thin-film color
filters that are part of the LCD assembly. The shapes of the blue and green primary SPDs are narrower
than the corresponding distributions for the CRT.
This results in a larger range of displayable colors.
Fig. 6 the gamma function of a LCD monitor
WSEAS TRANSACTIONS on CIRCUITS and SYSTEMS Toadere Florin, Nikos E. Mastorakis
ISSN: 1109-2734 36 Issue 1, Volume 9, January 2010
Page 6
The relation between the digital frame buffer
value and the light intensity is nonlinear, as for the
CRT. The value of the gamma exponent is about 2.6.
In function of the LCD monitor construction, the
gamma shape was arranged by the manufacturer in
order to have approximately the same effect as the
CRT monitor’s, gamma has. This constructive
solution was chosen in order not to have differences
in the colors render by the monitors, when a normal
eyes viewer watch on the CRT and LCD TVs the
same picture in the same time [6,11,12].
3.1 The LEDs monitor’s operating principle
LEDs can be used as the backlight of the LCD
displays, due to the advantages of their being
mercury free, of high color gamut and having a long
lifetime and fast response, compared with the conventional LCD mercury lamps backlights. LEDs
have a much lower driving voltage (<5 V) which is
more suitable for mobile monitors and TV
applications in the driving-circuit design and safety
issues. Due to the fast response of the LEDs, it is
very easy to switch the LEDs backlight on and off,
to insert the black frames, to eliminate motion blur
behaviors specific to the LCD, due to their impulse
type characteristics [8,19].
LEDs have a suitable and narrow emission
spectrum to fit the liquid crystal and color filter and
the luminance uniformity over the whole panel. Red,
green and blue LEDs can be driven individually
which makes it possible to light different colors in
series to achieve a filter less LCD with high
transmission and colors saturation. For small LCD
displays (such as mobile phones), color gamut is not
a main issue. Hence, white LEDs can be enough as
the backlight source to reduce the cost and minimize
the module size. For medium or large size LCDs,
multicolor LEDs are needed in order to increase the
power efficiency and color gamut [8,19]. For these
applications, the FWHM (full width at half
maximum) of the LEDs should be as small as possible to increase the color gamut value. Optical
characteristics of LEDs change due to the ambient
temperature and operation during time.
LED monitors use white LEDs for the backlight,
which allows for a slimmer profile, longer life, and
less power consumption. We use side-emitting
white LEDs. The LED has a color spectrum with a
typical color temperature of 5500K with a minimum
and maximum value lying between 4500K and
10000K. Using a lens arrangement above the die,
most of the flux is directed to the sides instead of the
normal lambertian distribution. This is ideal for the
large screen displays as mentioned above.
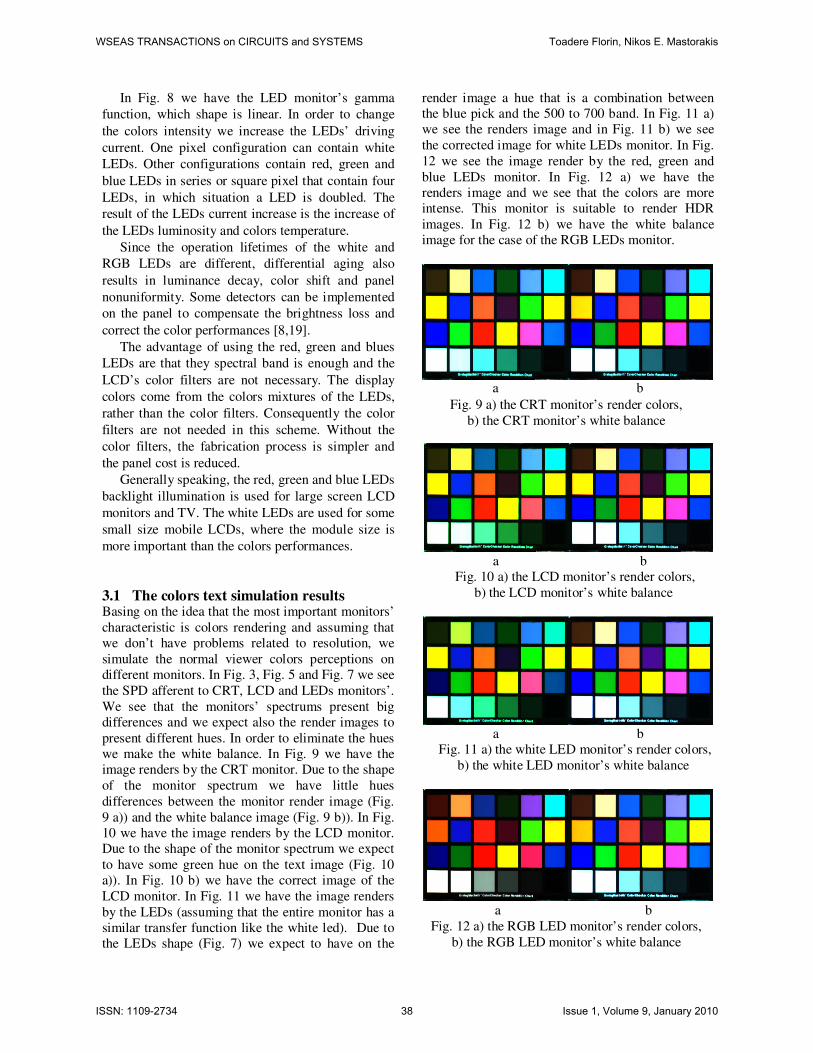
There are two primary ways of producing high
intensity white light using LEDs. One is to use
individual LEDs that emit the colors red, green, blue
and then to mix all the colors in order to produce
white light. The other is to use a phosphor material
to convert monochromatic light from a blue or UV
LED to broad-spectrum white light, much in the
same way a fluorescent light bulb works [8,19].
Fig. 7 the normalized SPD of a LEDs monitor
In Fig. 7 we see the spectrum of a white LED and
the spectrums of the red, green and blue LEDs. For
the white LED, the graphic clearly show blue light
with a peak at about 465 nm and a broadband light
emitted by phosphor which emits at roughly 500–
700 nm. The spectrum of the blue, green and red
LEDs cover a band centered on 490nm, 550nm and
640nm [3].
Fig. 8 the gamma function of a LEDs monitor
WSEAS TRANSACTIONS on CIRCUITS and SYSTEMS Toadere Florin, Nikos E. Mastorakis
ISSN: 1109-2734 37 Issue 1, Volume 9, January 2010
Page 7
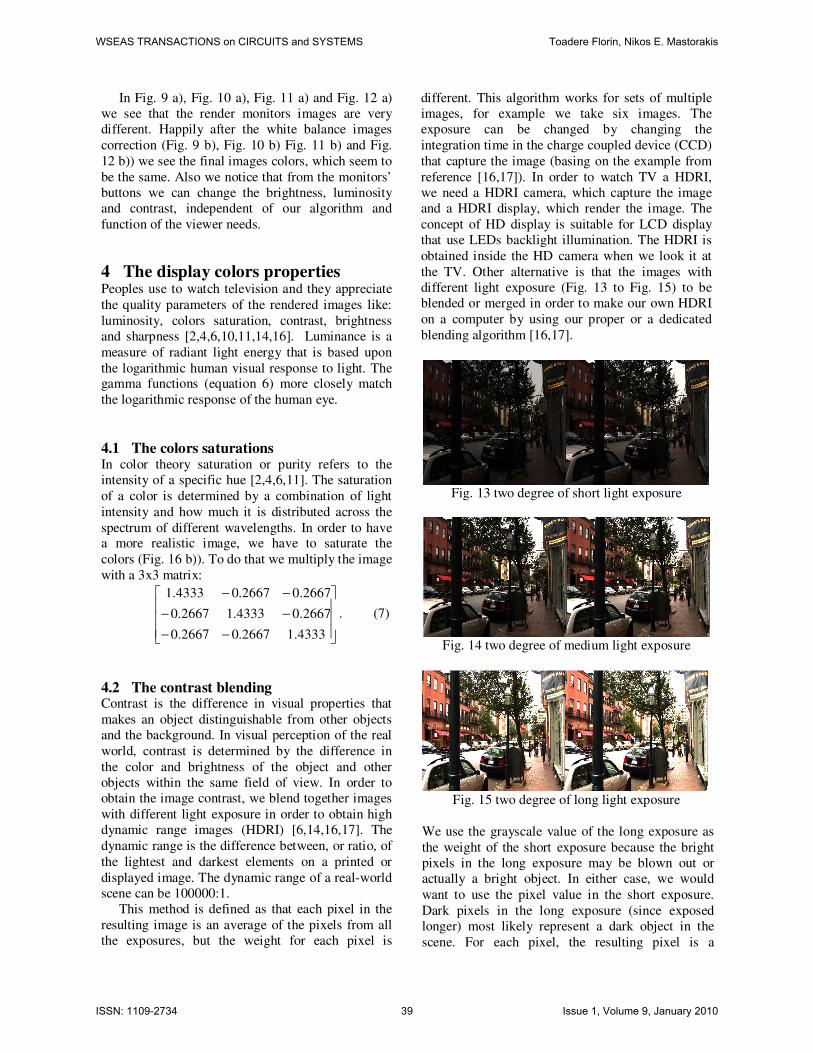
In Fig. 8 we have the LED monitor’s gamma
function, which shape is linear. In order to change
the colors intensity we increase the LEDs’ driving
current. One pixel configuration can contain white
LEDs. Other configurations contain red, green and
blue LEDs in series or square pixel that contain four
LEDs, in which situation a LED is doubled. The
result of the LEDs current increase is the increase of
the LEDs luminosity and colors temperature.
Since the operation lifetimes of the white and
RGB LEDs are different, differential aging also
results in luminance decay, color shift and panel
nonuniformity. Some detectors can be implemented
on the panel to compensate the brightness loss and
correct the color performances [8,19].
The advantage of using the red, green and blues
LEDs are that they spectral band is enough and the
LCD’s color filters are not necessary. The display
colors come from the colors mixtures of the LEDs,
rather than the color filters. Consequently the color
filters are not needed in this scheme. Without the
color filters, the fabrication process is simpler and
the panel cost is reduced.
Generally speaking, the red, green and blue LEDs
backlight illumination is used for large screen LCD
monitors and TV. The white LEDs are used for some
small size mobile LCDs, where the module size is
more important than the colors performances.
3.1 The colors text simulation results Basing on the idea that the most important monitors’
characteristic is colors rendering and assuming that
we don’t have problems related to resolution, we
simulate the normal viewer colors perceptions on
different monitors. In Fig. 3, Fig. 5 and Fig. 7 we see
the SPD afferent to CRT, LCD and LEDs monitors’.
We see that the monitors’ spectrums present big
differences and we expect also the render images to
present different hues. In order to eliminate the hues
we make the white balance. In Fig. 9 we have the
image renders by the CRT monitor. Due to the shape
of the monitor spectrum we have little hues
differences between the monitor render image (Fig.
9 a)) and the white balance image (Fig. 9 b)). In Fig.
10 we have the image renders by the LCD monitor.
Due to the shape of the monitor spectrum we expect
to have some green hue on the text image (Fig. 10
a)). In Fig. 10 b) we have the correct image of the
LCD monitor. In Fig. 11 we have the image renders
by the LEDs (assuming that the entire monitor has a
similar transfer function like the white led). Due to
the LEDs shape (Fig. 7) we expect to have on the
render image a hue that is a combination between
the blue pick and the 500 to 700 band. In Fig. 11 a)
we see the renders image and in Fig. 11 b) we see
the corrected image for white LEDs monitor. In Fig.
12 we see the image render by the red, green and
blue LEDs monitor. In Fig. 12 a) we have the
renders image and we see that the colors are more
intense. This monitor is suitable to render HDR
images. In Fig. 12 b) we have the white balance
image for the case of the RGB LEDs monitor.
a b
Fig. 9 a) the CRT monitor’s render colors,
b) the CRT monitor’s white balance
a b
Fig. 10 a) the LCD monitor’s render colors,
b) the LCD monitor’s white balance
a b
Fig. 11 a) the white LED monitor’s render colors,
b) the white LED monitor’s white balance
a b
Fig. 12 a) the RGB LED monitor’s render colors,
b) the RGB LED monitor’s white balance
WSEAS TRANSACTIONS on CIRCUITS and SYSTEMS Toadere Florin, Nikos E. Mastorakis
ISSN: 1109-2734 38 Issue 1, Volume 9, January 2010
Page 8
In Fig. 9 a), Fig. 10 a), Fig. 11 a) and Fig. 12 a)
we see that the render monitors images are very
different. Happily after the white balance images
correction (Fig. 9 b), Fig. 10 b) Fig. 11 b) and Fig.
12 b)) we see the final images colors, which seem to
be the same. Also we notice that from the monitors’
buttons we can change the brightness, luminosity
and contrast, independent of our algorithm and
function of the viewer needs.
4 The display colors properties Peoples use to watch television and they appreciate
the quality parameters of the rendered images like:
luminosity, colors saturation, contrast, brightness
and sharpness [2,4,6,10,11,14,16]. Luminance is a
measure of radiant light energy that is based upon
the logarithmic human visual response to light. The gamma functions (equation 6) more closely match
the logarithmic response of the human eye.
4.1 The colors saturations In color theory saturation or purity refers to the
intensity of a specific hue [2,4,6,11]. The saturation
of a color is determined by a combination of light
intensity and how much it is distributed across the
spectrum of different wavelengths. In order to have a more realistic image, we have to saturate the
colors (Fig. 16 b)). To do that we multiply the image
with a 3x3 matrix:
−−
−−
−−
4333.12667.02667.0
2667.04333.12667.0
2667.02667.04333.1
. (7)
4.2 The contrast blending Contrast is the difference in visual properties that
makes an object distinguishable from other objects
and the background. In visual perception of the real
world, contrast is determined by the difference in
the color and brightness of the object and other
objects within the same field of view. In order to
obtain the image contrast, we blend together images
with different light exposure in order to obtain high
dynamic range images (HDRI) [6,14,16,17]. The
dynamic range is the difference between, or ratio, of
the lightest and darkest elements on a printed or
displayed image. The dynamic range of a real-world
scene can be 100000:1.
This method is defined as that each pixel in the
resulting image is an average of the pixels from all
the exposures, but the weight for each pixel is
different. This algorithm works for sets of multiple
images, for example we take six images. The
exposure can be changed by changing the
integration time in the charge coupled device (CCD)
that capture the image (basing on the example from
reference [16,17]). In order to watch TV a HDRI,
we need a HDRI camera, which capture the image
and a HDRI display, which render the image. The
concept of HD display is suitable for LCD display
that use LEDs backlight illumination. The HDRI is
obtained inside the HD camera when we look it at
the TV. Other alternative is that the images with
different light exposure (Fig. 13 to Fig. 15) to be
blended or merged in order to make our own HDRI
on a computer by using our proper or a dedicated
blending algorithm [16,17].
Fig. 13 two degree of short light exposure
Fig. 14 two degree of medium light exposure
Fig. 15 two degree of long light exposure
We use the grayscale value of the long exposure as
the weight of the short exposure because the bright
pixels in the long exposure may be blown out or
actually a bright object. In either case, we would
want to use the pixel value in the short exposure.
Dark pixels in the long exposure (since exposed
longer) most likely represent a dark object in the
scene. For each pixel, the resulting pixel is a
WSEAS TRANSACTIONS on CIRCUITS and SYSTEMS Toadere Florin, Nikos E. Mastorakis
ISSN: 1109-2734 39 Issue 1, Volume 9, January 2010
Page 9
weighted average of the short and long exposure
pixel where the grayscale value of the long exposure
pixel is the weight for the short pixel. The pixel is
scaled such that energy of the pixels is not increased.
This easily extends to multiple images. First, blend
the two images with the longest exposure as
described. This is repeated until all the images are
used. This method works well, is computationally
easy and in general does a pretty good job at
blending the multiple exposures.
4.3 The brightening Brightness is an attribute of visual perception in
which a source appears to emit a given amount of
light. In other words, brightness is the perception
elicited by the luminance of a visual target. This is a
subjective property of an object being observed. In the RGB color space, brightness can be thought as
the arithmetic mean of the red, green, and blue color
coordinates. In order to obtain the image brightness
we multiply each color coordinate with a gauss
function [2,6,11,14].
4.4 The sharpening Some time images can be blurred, due to the
camera’s defocus or movement. A good monitor should have the possibility to correct this deficiency.
In order to correct the blur and to preserve the
impression of depth, clarity and fine details we have
to sharp the image using a Laplacian filter
[2,6,11,14,16,17]. A Laplace filter is a 3x3 pixel
mask:
−−−
−−
−−−
=
111
181
111
L . (8)
In order to restore the blurred image we subtract the
Laplacian image from the original image.
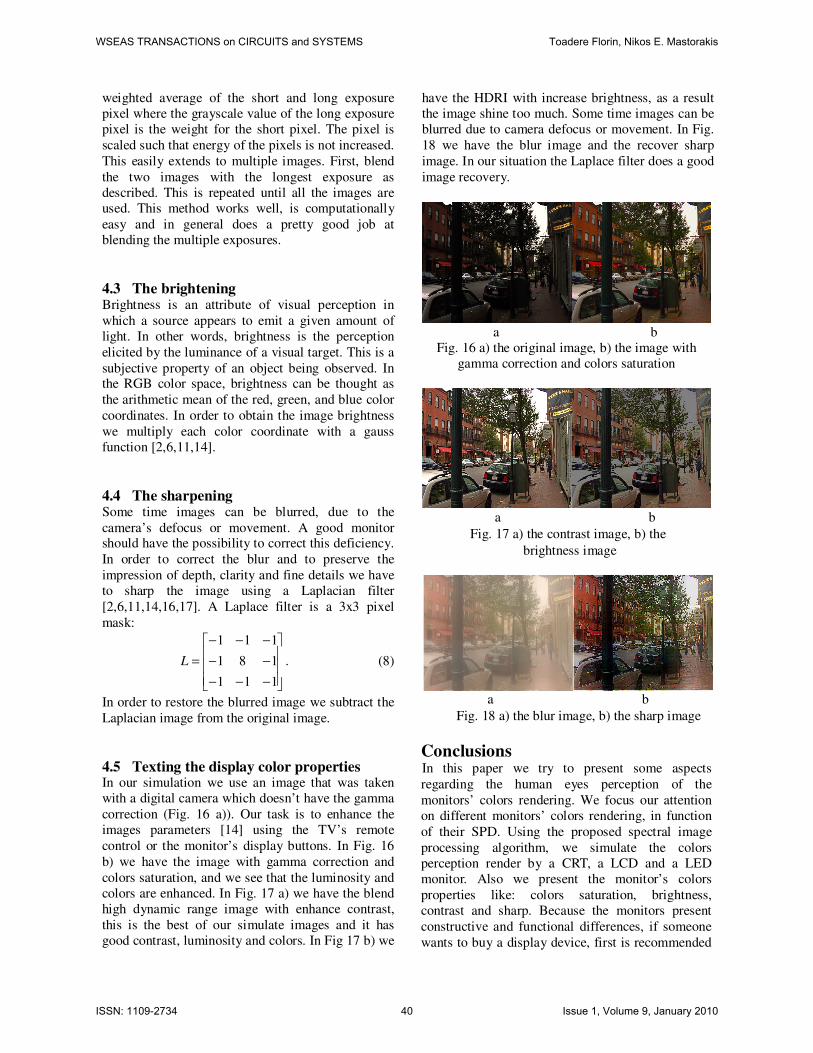
4.5 Texting the display color properties In our simulation we use an image that was taken
with a digital camera which doesn’t have the gamma
correction (Fig. 16 a)). Our task is to enhance the
images parameters [14] using the TV’s remote
control or the monitor’s display buttons. In Fig. 16
b) we have the image with gamma correction and
colors saturation, and we see that the luminosity and
colors are enhanced. In Fig. 17 a) we have the blend
high dynamic range image with enhance contrast,
this is the best of our simulate images and it has
good contrast, luminosity and colors. In Fig 17 b) we
have the HDRI with increase brightness, as a result
the image shine too much. Some time images can be
blurred due to camera defocus or movement. In Fig.
18 we have the blur image and the recover sharp
image. In our situation the Laplace filter does a good
image recovery.
a b
Fig. 16 a) the original image, b) the image with
gamma correction and colors saturation
a b
Fig. 17 a) the contrast image, b) the
brightness image
a b
Fig. 18 a) the blur image, b) the sharp image
Conclusions In this paper we try to present some aspects
regarding the human eyes perception of the
monitors’ colors rendering. We focus our attention
on different monitors’ colors rendering, in function
of their SPD. Using the proposed spectral image
processing algorithm, we simulate the colors
perception render by a CRT, a LCD and a LED
monitor. Also we present the monitor’s colors
properties like: colors saturation, brightness,
contrast and sharp. Because the monitors present
constructive and functional differences, if someone
wants to buy a display device, first is recommended
WSEAS TRANSACTIONS on CIRCUITS and SYSTEMS Toadere Florin, Nikos E. Mastorakis
ISSN: 1109-2734 40 Issue 1, Volume 9, January 2010
Page 10
to read carefully the display characteristics which
are presented in a device profile file. The CRT
monitors represent an old technology. The LCD
monitors are the nowadays technologies. The LEDs
monitors represent an interesting approach for future
technologies development.
References
[1] http://www.avdeals.com/classroom/what_is_tft_
l cd.htm
[2] R. Gonzales, R. Wood, S. Eddins, Digital Image
Processing Using MATLAB. Gatesmark
Publising, 2009.
[3]http://home.earthlink.net/~pubspectra/#SpectralD
ata_Links
[4] M. Ebner, Color Constancy. Willey, 2007.
[5] R.W.G. Hunt, The reproduction of colors. John
Wiley & Sons Ltd, 2004.
[6] http://cs.haifa.ac.il/hagit/courses/ist/
[7] M. A. Karim, Electro-optical Displays, Marcel
Dekker, 1992.
[8] J. H. Lee, D. N. Liu, S. T. Wu, Introduction to
Flat Panel Display, John Wiley & Sons Ltd,
2008.
[9] D. Malacara, Color Vision and Colorimetry
Theory and Applications, SPIE Press, 2004
[10] H. C. Lee, Introduction to color imaging
science. Cambridge, 2005.
[11] G. Sharma, Ed. Digital Color Imaging
Handbook. CRC Press, 2003.
[12] S. K. Shevell, The science of color. Elseiver,
2003.
[13] http://spectral.joensuu.fi/index.php?page=spi
[14] F. Toadere, E. Szopos., “A method to enhance
colors in a digital image”, 2008 IEEE- TTTC
Quality and Testing, Robotics AQTR 2008,
May 22-25, Vol 3, pp. 356-370, Cluj Napoca,
Romania.
[15]F. Toadere, N. Mastorakis: “A comparison
between a CRT and a LCD monitors colors
rendering” The 8th WSEAS International
Conference on Circuits, Systems,Electronics,
Control & Signal Processing CSECS2009,
Canary Island, Spain, December 14-16, 2009.
[16] F. Toadere, N. Mastorakis: Simulation the
functionality of a web cam image capture system,
WSEAS Transaction on Circuits and Systemas,
Vol. 8, 2009.
[17] F. Toadere, N. Mastorakis: Imaging the optical
part of a web cam, Signal Processing,
Computational Geometry and Artificial Vision,
ISCGAV 2009, August 20-22, Moscow, Russia.
[18] B.Wandell, Fundation of vision. Sinauer, 1995.
[19] http://en.wikipedia.org/wiki/Computer_monitor
WSEAS TRANSACTIONS on CIRCUITS and SYSTEMS Toadere Florin, Nikos E. Mastorakis
ISSN: 1109-2734 41 Issue 1, Volume 9, January 2010