An Overview of ArcNLET and Associated Tools for Estimating Nitrogen Load from Septic Systems to Surface Water Bodies Ming Ye ([email protected]) Department of Scientific Computing Florida State University March 12, 2015 Presentation to FDEP 1
Transcript
An Overview of ArcNLET and Associated Tools for Estimating
Nitrogen Load from Septic Systems to Surface Water Bodies
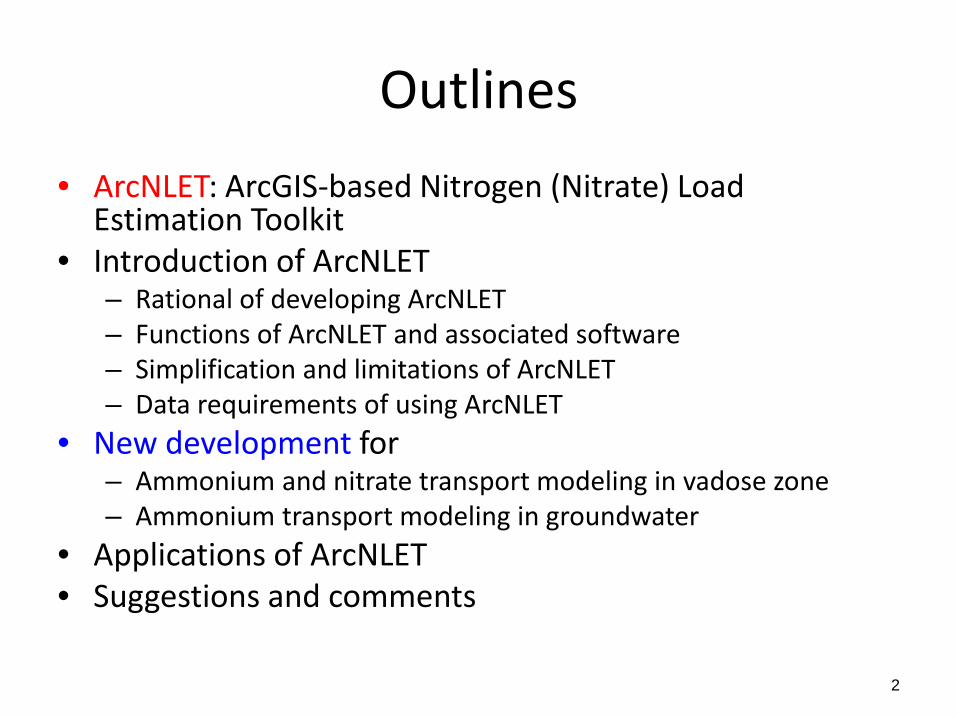
– Rational of developing ArcNLET– Functions of ArcNLET and associated software– Simplification and limitations of ArcNLET– Data requirements of using ArcNLET
• New development for – Ammonium and nitrate transport modeling in vadose zone– Ammonium transport modeling in groundwater
• Applications of ArcNLET• Suggestions and comments
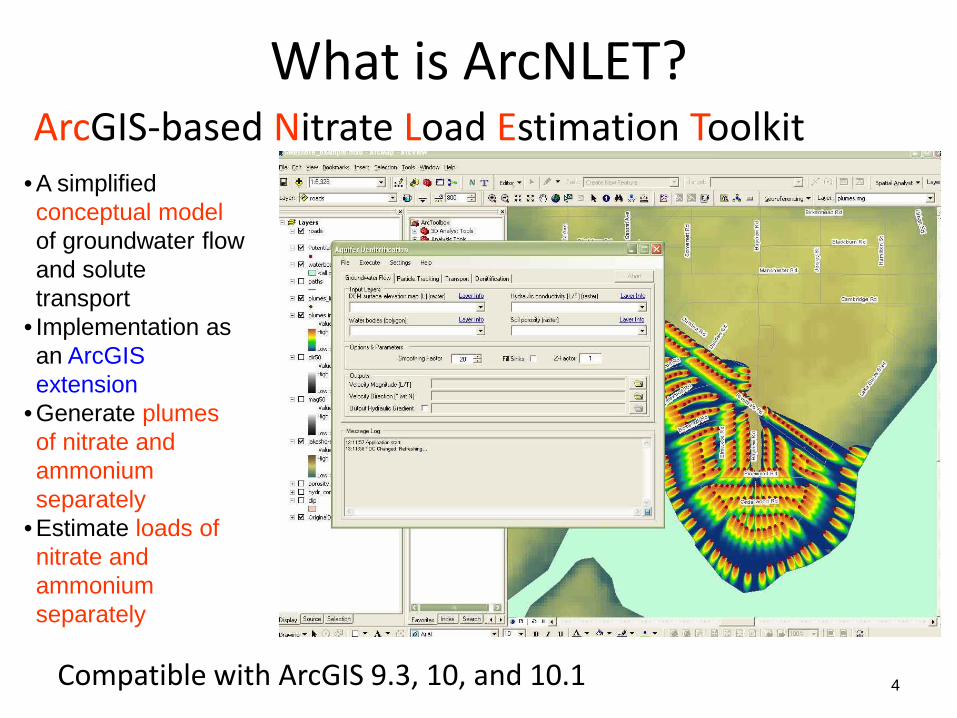
What is ArcNLET?ArcGIS-based Nitrate Load Estimation Toolkit
Compatible with ArcGIS 9.3, 10, and 10.1
• A simplified conceptual modelof groundwater flow and solute transport
• Implementation as an ArcGIS extension
• Generate plumes of nitrate and ammonium separately
• Estimate loads of nitrate and ammonium separately
4
ArcNLET Functions
From Heatwole and McCray (2007)
Vadose Zone Processes: • Unsaturated flow (1-D)• Ammonium and nitrate
transport with sorption, nitrification, and denitrification
Groundwater Process:• Groundwater flow (2-D)• Ammonium and nitrate
transport with sorption, nitrification, and denitrification
Surface processes for failed septic tanks have not been considered. 5
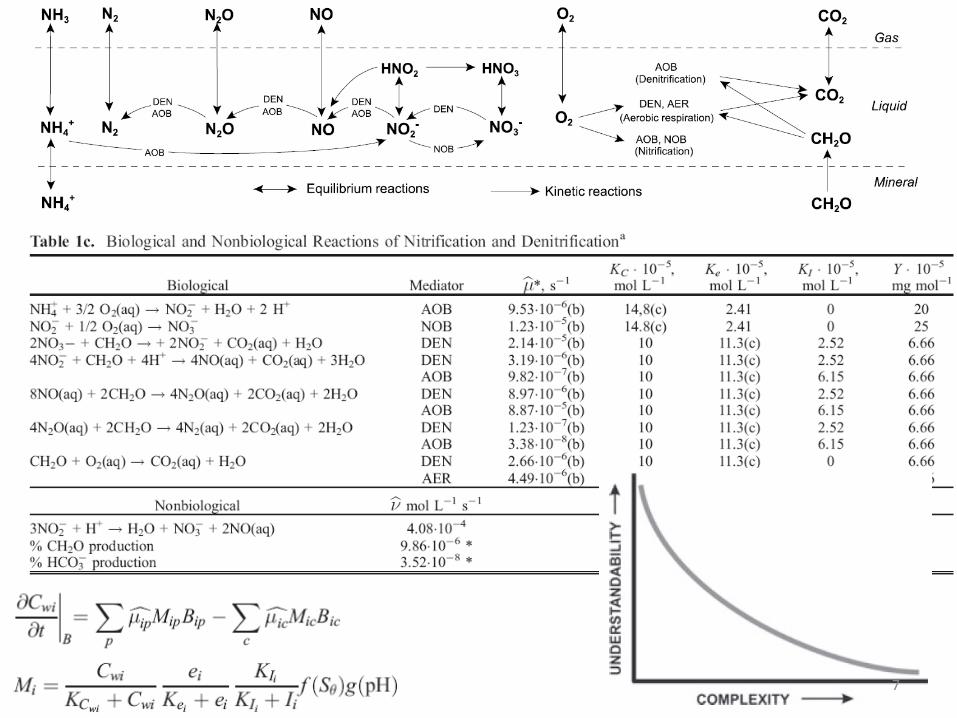
Why Developing ArcNLET? • There is no suitable tool for estimating nitrate load to meet TMDL
requirements and perform Nitrogen BMAP. • Existing tools are either too simple or too complex. • An example of simple model (an empirical model):
– Nitrogen Load Model (NLM) by Valiela et al. (1997, 2000)– nitrogen load is evaluated as nitrogen released per person per year ×
people/house × number of houses × 60% not lost in septic tanks and leaching fields × 66% not lost in plumes × 65% not lost in aquifer.
– While the coefficients can be adjusted for different sites based on literature data, field data, and best engineering judgment, NLM does not consider spatial variability of hydrogeological conditions and processes.
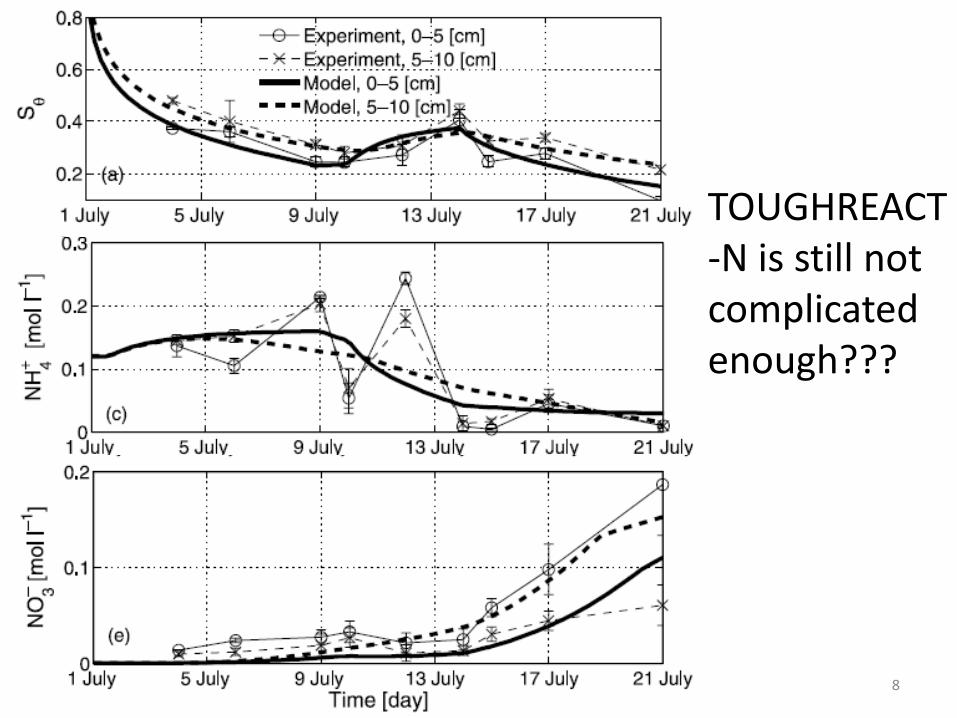
• An example of complex model (a mechanical model): – TOUGHREACT-N by Maggi et al. (2008): Simulate coupled processes of
advective and diffusive nutrient transport, multiple microbial biomass dynamics, and equilibrium and kinetic chemical reactions in soil and groundwater
– Difficult to set up the model for TMDL due to lack of data– Time consuming to run the execute
6
7
TOUGHREACT-N is still not complicated enough???
8
Why Developing ArcNLET? • Develop a simplified model that
– Considers key hydrogeologic processes of groundwater flow and nitrogen fate and transport
– Handles spatial variability of hydrogeological parameters and processes– Provides estimates of quantities needed for TMDL and BMAP
• Implement the model by developing a user-friendly ArcGIS extension to– Use ArcGIS functions to handle spatial variability during pre- and post-
processing of ArcNLET modeling– Simulate flow and nitrogen fate and transport within the ArcGIS
environment but invisible to users– Provide a management and planning tool for environmental management
and regulation• Disseminate the software and conduct technical transfer to FDEP
staff and other interested parties.
9
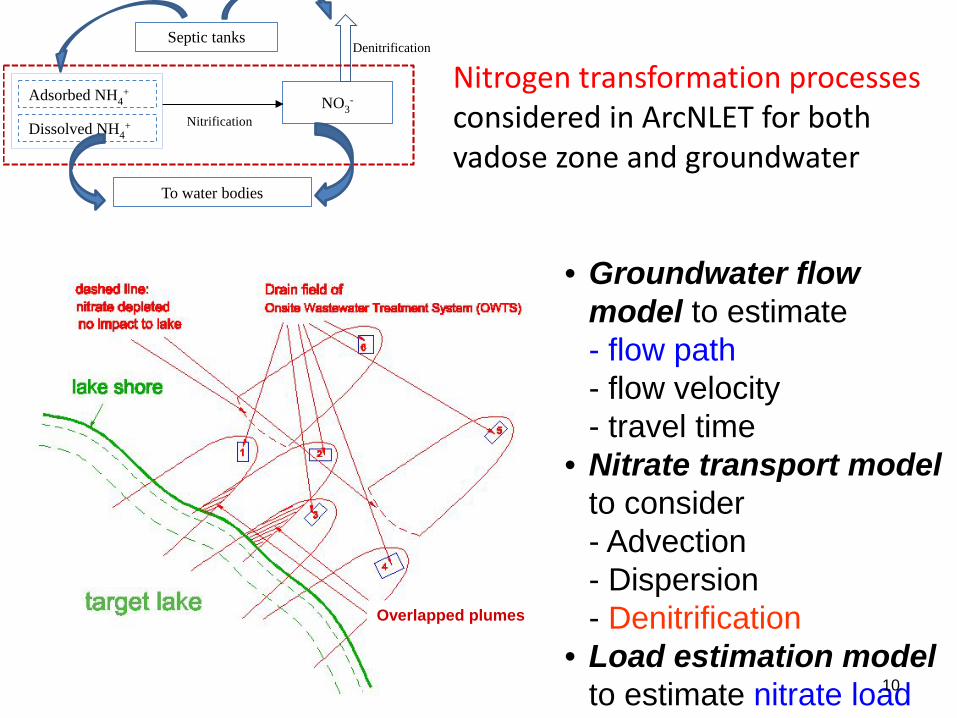
Nitrogen transformation processes considered in ArcNLET for both vadose zone and groundwater
• Groundwater flow model to estimate - flow path- flow velocity- travel time
• Nitrate transport modelto consider- Advection- Dispersion- Denitrification
• Load estimation modelto estimate nitrate load
Overlapped plumes
Dissolved NH4+
NO3-
Nitrification
Denitrification
To water bodies
Septic tanks
Adsorbed NH4+
10
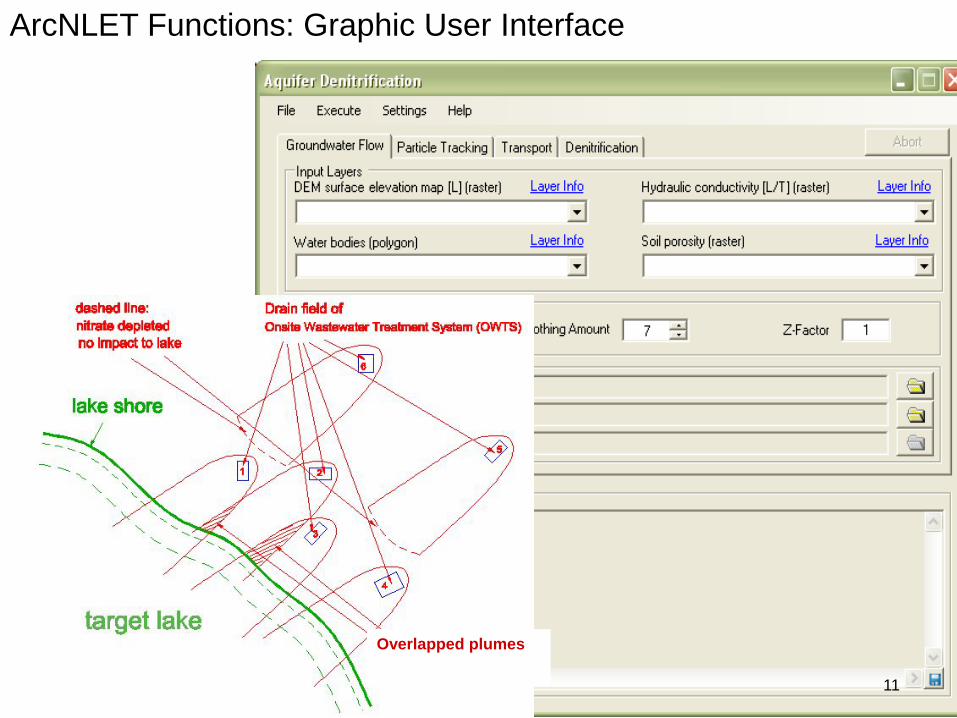
ArcNLET Functions: Graphic User Interface
Overlapped plumes
11
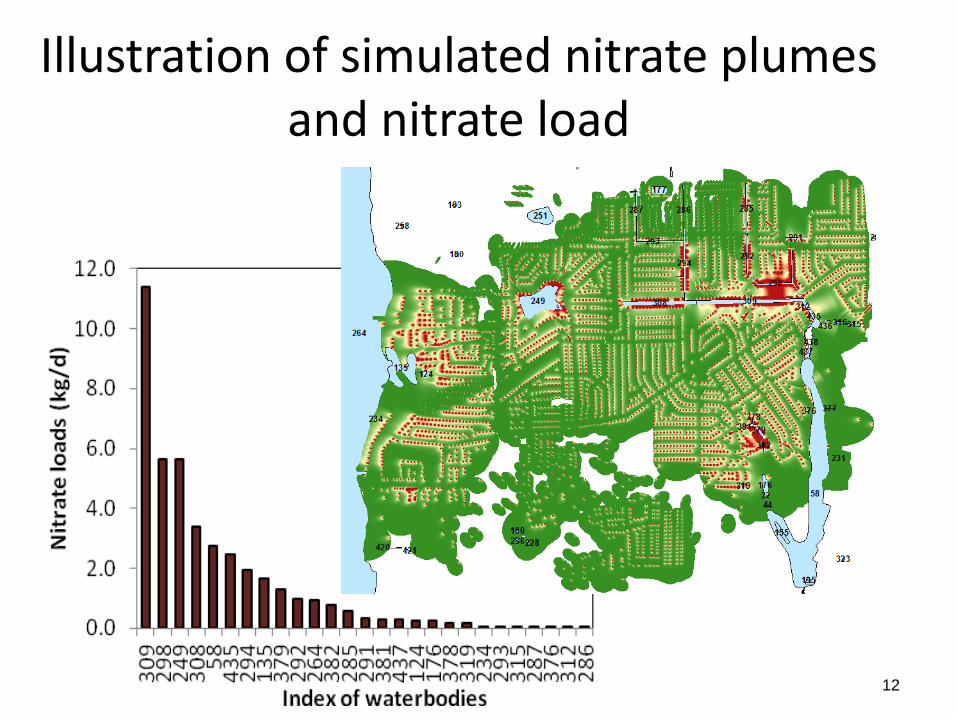
Illustration of simulated nitrate plumes and nitrate load
12
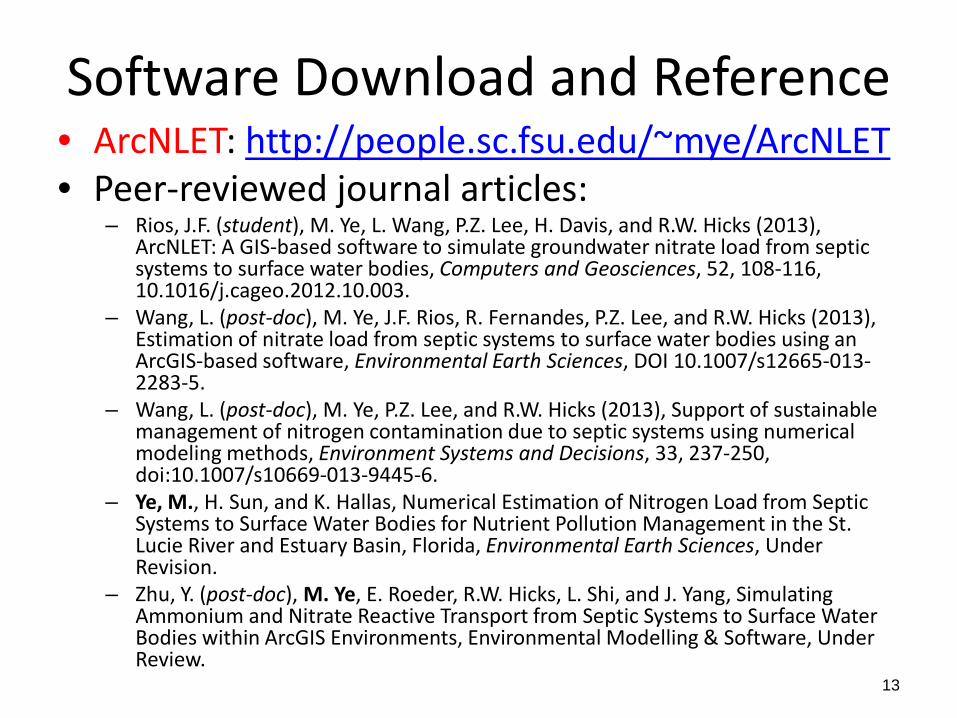
Software Download and Reference• ArcNLET: http://people.sc.fsu.edu/~mye/ArcNLET• Peer-reviewed journal articles:
– Rios, J.F. (student), M. Ye, L. Wang, P.Z. Lee, H. Davis, and R.W. Hicks (2013), ArcNLET: A GIS-based software to simulate groundwater nitrate load from septic systems to surface water bodies, Computers and Geosciences, 52, 108-116, 10.1016/j.cageo.2012.10.003.
– Wang, L. (post-doc), M. Ye, J.F. Rios, R. Fernandes, P.Z. Lee, and R.W. Hicks (2013), Estimation of nitrate load from septic systems to surface water bodies using an ArcGIS-based software, Environmental Earth Sciences, DOI 10.1007/s12665-013-2283-5.
– Wang, L. (post-doc), M. Ye, P.Z. Lee, and R.W. Hicks (2013), Support of sustainable management of nitrogen contamination due to septic systems using numerical modeling methods, Environment Systems and Decisions, 33, 237-250, doi:10.1007/s10669-013-9445-6.
– Ye, M., H. Sun, and K. Hallas, Numerical Estimation of Nitrogen Load from Septic Systems to Surface Water Bodies for Nutrient Pollution Management in the St. Lucie River and Estuary Basin, Florida, Environmental Earth Sciences, Under Revision.
– Zhu, Y. (post-doc), M. Ye, E. Roeder, R.W. Hicks, L. Shi, and J. Yang, Simulating Ammonium and Nitrate Reactive Transport from Septic Systems to Surface Water Bodies within ArcGIS Environments, Environmental Modelling & Software, Under Review.
Simplifications and Limitations in Groundwater Flow Modeling
Simplifications:• Treat water table as subdued replica of topography
(Process topographic to approximate shape of water table)
• Use Dupuit assumption to simulate 2-D, horizontal groundwater flow
Limitations:• Steady-state flow• 2-D flow instead of fully 3-D flow
14
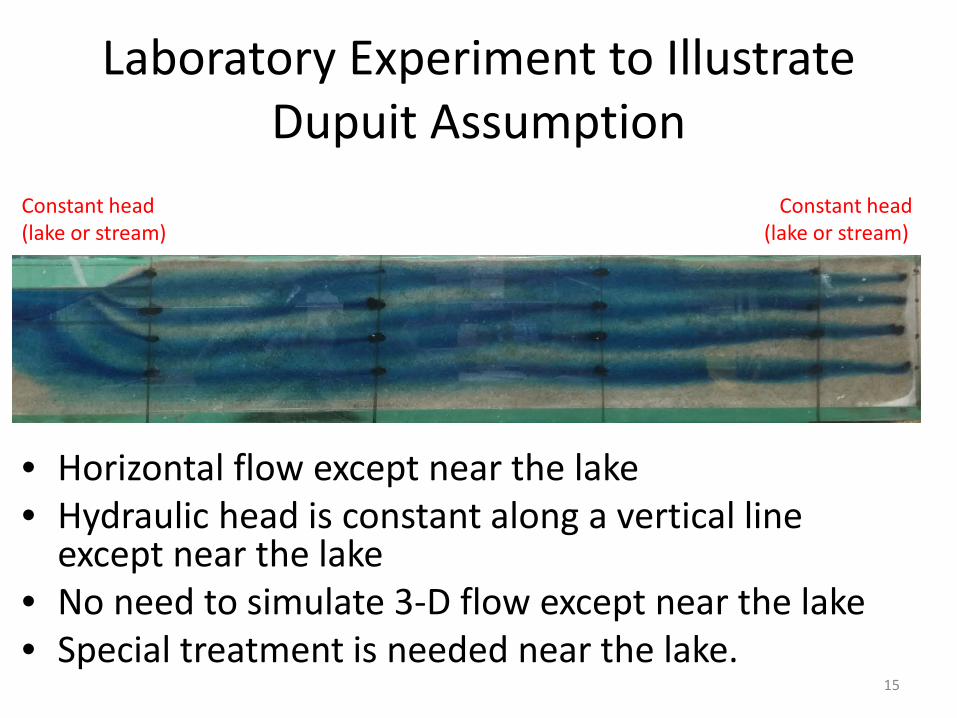
Laboratory Experiment to Illustrate Dupuit Assumption
• Horizontal flow except near the lake• Hydraulic head is constant along a vertical line
except near the lake• No need to simulate 3-D flow except near the lake• Special treatment is needed near the lake.
Constant head Constant head(lake or stream) (lake or stream)
15
Simplifications and Limitations in Nitrate Transport Modeling
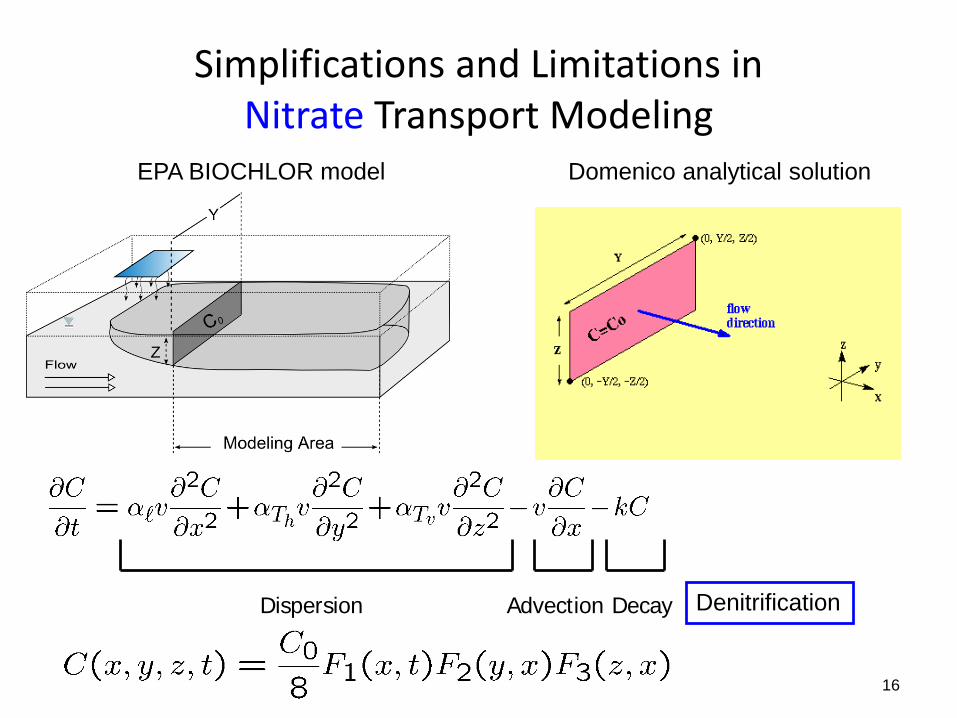
EPA BIOCHLOR model
Dispersion Advection Decay
Domenico analytical solution
Denitrification
16
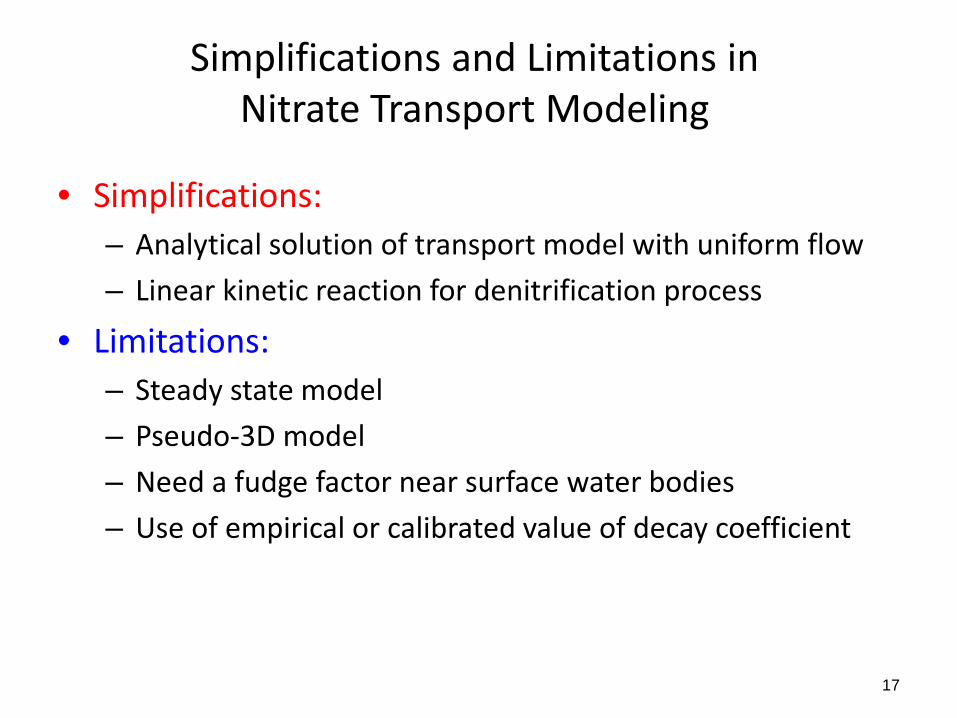
Simplifications and Limitations in Nitrate Transport Modeling
• Simplifications:– Analytical solution of transport model with uniform flow– Linear kinetic reaction for denitrification process
• Limitations:– Steady state model– Pseudo-3D model– Need a fudge factor near surface water bodies– Use of empirical or calibrated value of decay coefficient
17
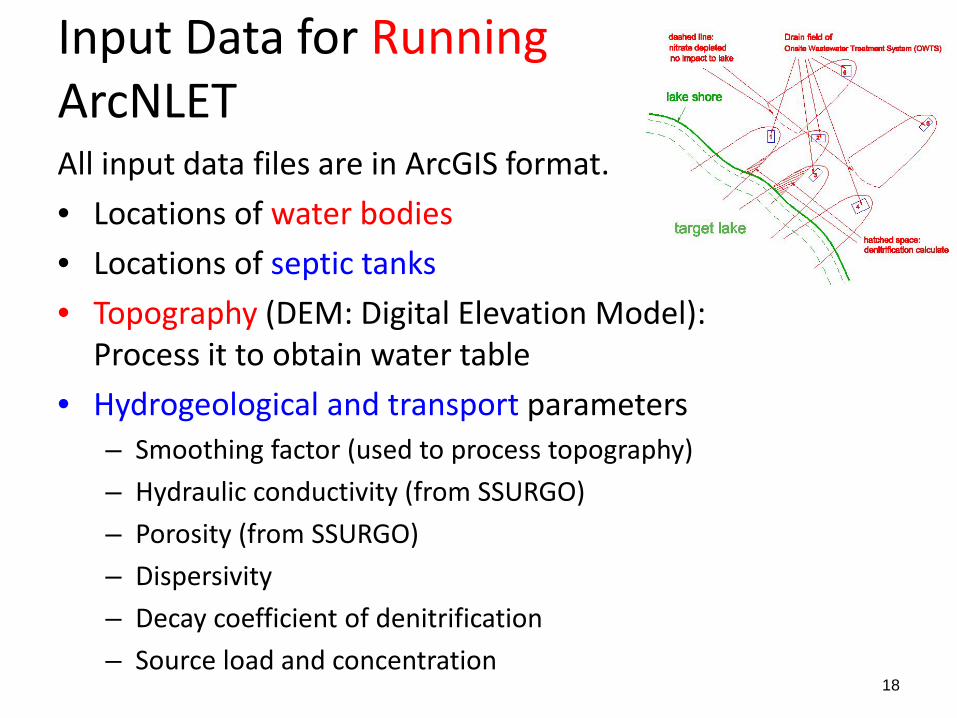
Input Data for RunningArcNLETAll input data files are in ArcGIS format.• Locations of water bodies • Locations of septic tanks• Topography (DEM: Digital Elevation Model):
Process it to obtain water table• Hydrogeological and transport parameters
– Smoothing factor (used to process topography)– Hydraulic conductivity (from SSURGO)– Porosity (from SSURGO)– Dispersivity– Decay coefficient of denitrification– Source load and concentration
18
Input Data for ArcNLET Site-Specific Modeling
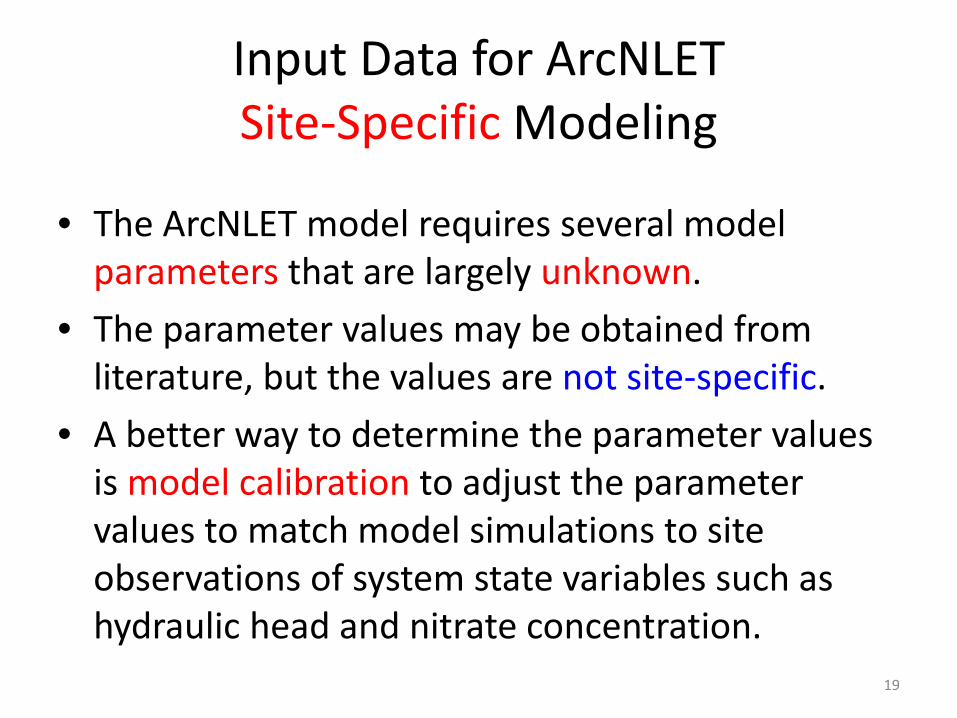
• The ArcNLET model requires several model parameters that are largely unknown.
• The parameter values may be obtained from literature, but the values are not site-specific.
• A better way to determine the parameter values is model calibration to adjust the parameter values to match model simulations to site observations of system state variables such as hydraulic head and nitrate concentration.
19
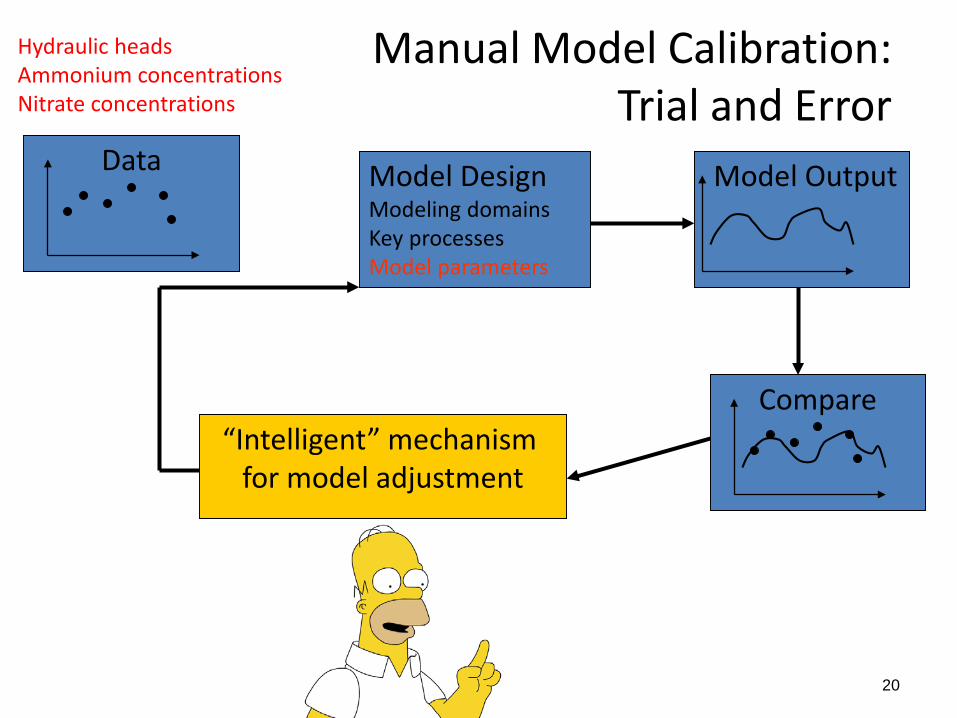
Manual Model Calibration: Trial and Error
Data Model Output
Compare“Intelligent” mechanism
for model adjustment
Model DesignModeling domainsKey processesModel parameters
For each site, whenever site-specific data are available,• Compile historical data to understand groundwater flow and
nitrogen transport at the modeling sites. • Select/collect calibration data of hydraulic head and nitrogen
concentration to estimate ArcNLET flow and transport model parameters.
• Calibrate the ArcNLET model. • Simulate nitrogen transport at the modeling site, using the
calibrated model. • Estimate the nitrogen load. • Conduct Monte Carlo simulation to quantify uncertainty in
the load estimates due to uncertainty in model parameters.
21
Requirements on Potential Users
• The GUI make it relatively easy for people with little experience in analyzing groundwater transport problems to apply a solute-transport model to a field problem.
• Users of ArcNLET need to have– Basic knowledge of hydrogeology such as concepts of groundwater flow
and solute transport – Intermediate level of ArcGIS skills for preparing input files and visualizing
software output files• The model (simple or complex) is not an end in itself, but a tool to
organize one’s thinking and engineering judgment.• Interpretation and improvement of ArcNLET results require
– Fundamental understanding of groundwater flow and solute transport– Familiarity with site-specific information such as geology and hydrogeology
• A model or a software is not a magic box, and it cannot tell what we do not know.
22
ArcNLET Application
• ArcNLET for nitrate only– Jacksonville– St. Lucie River and Estuary Basin (Port St. Lucie,
City of Stuart, and Martin County)– Lakes Marshall, Roberts, Weir, and Denham
• ArcNLET for both ammonium and nitrate– Jacksonville– Indian River County (on-going)
23
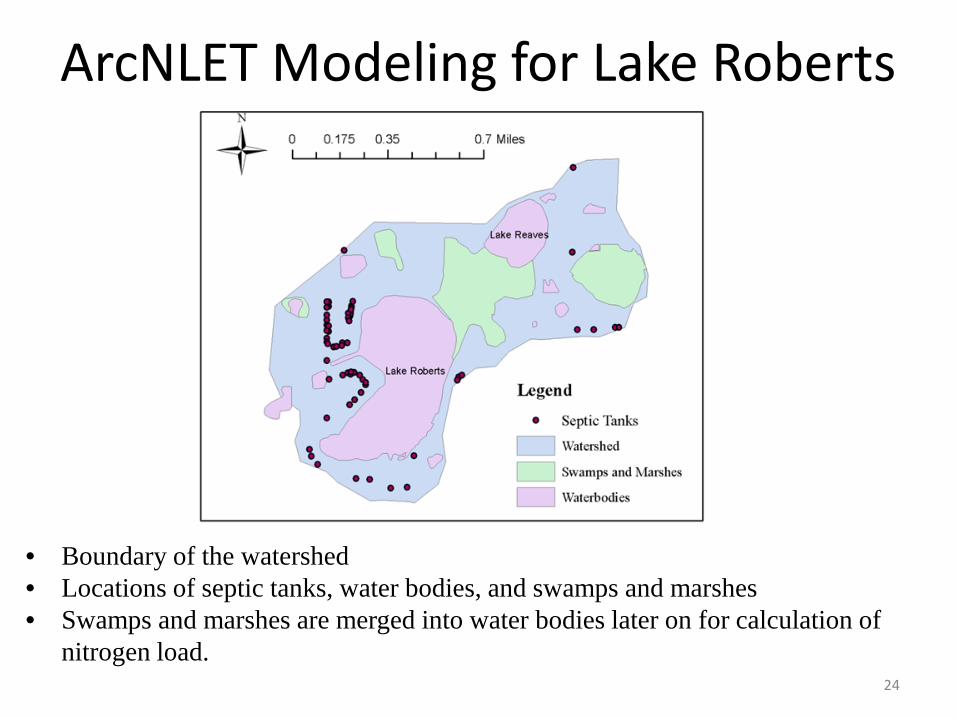
ArcNLET Modeling for Lake Roberts
• Boundary of the watershed • Locations of septic tanks, water bodies, and swamps and marshes• Swamps and marshes are merged into water bodies later on for calculation of
nitrogen load.24
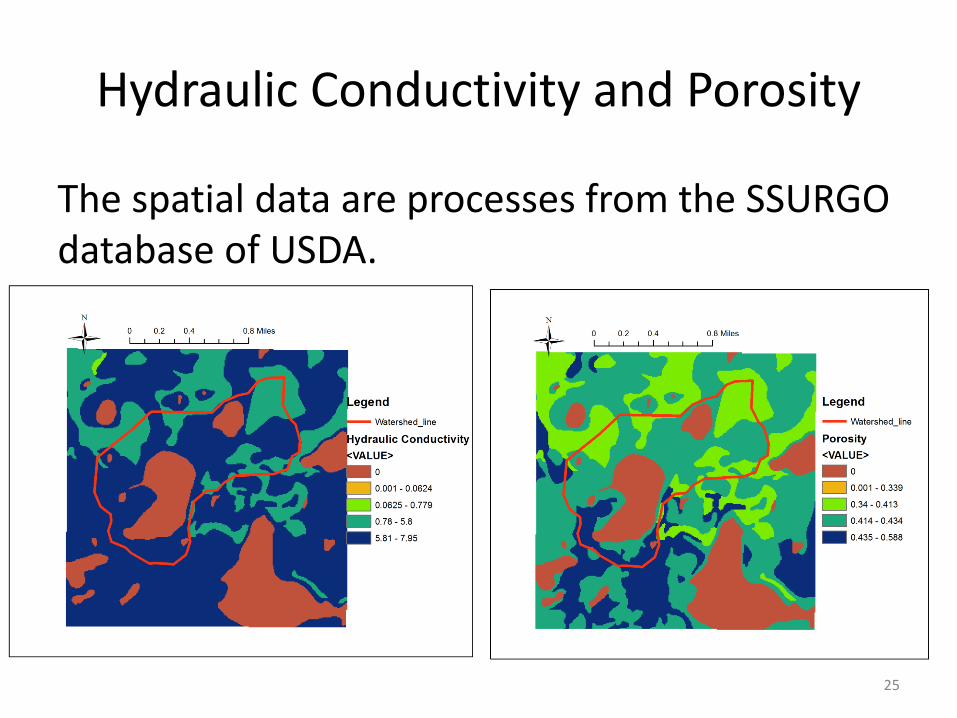
Hydraulic Conductivity and Porosity
The spatial data are processes from the SSURGO database of USDA.
25
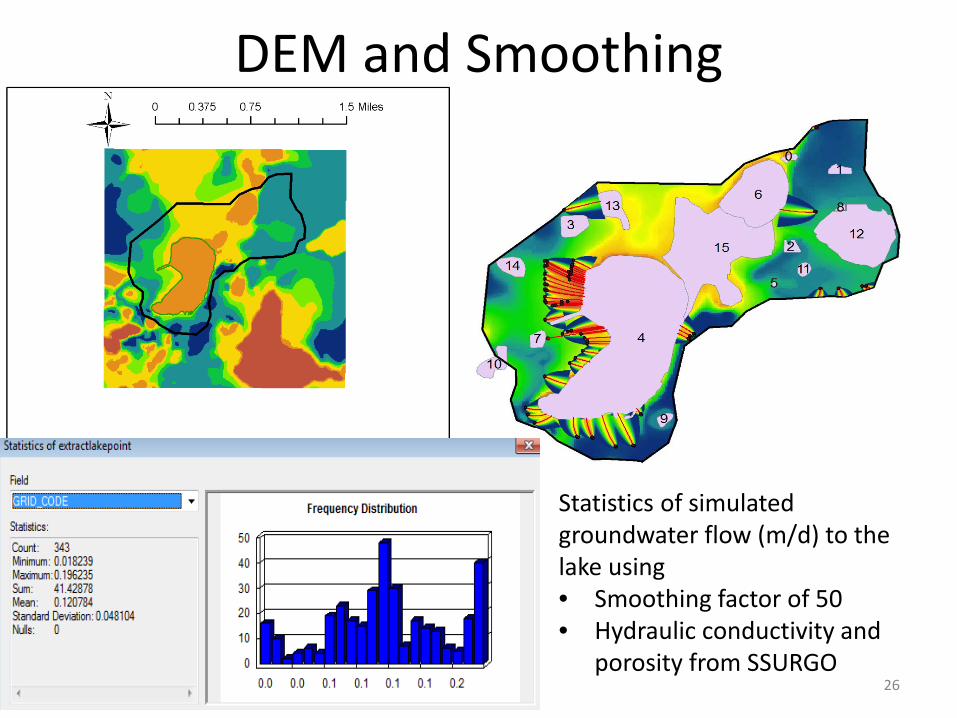
DEM and Smoothing
Statistics of simulated groundwater flow (m/d) to the lake using • Smoothing factor of 50• Hydraulic conductivity and
porosity from SSURGO26
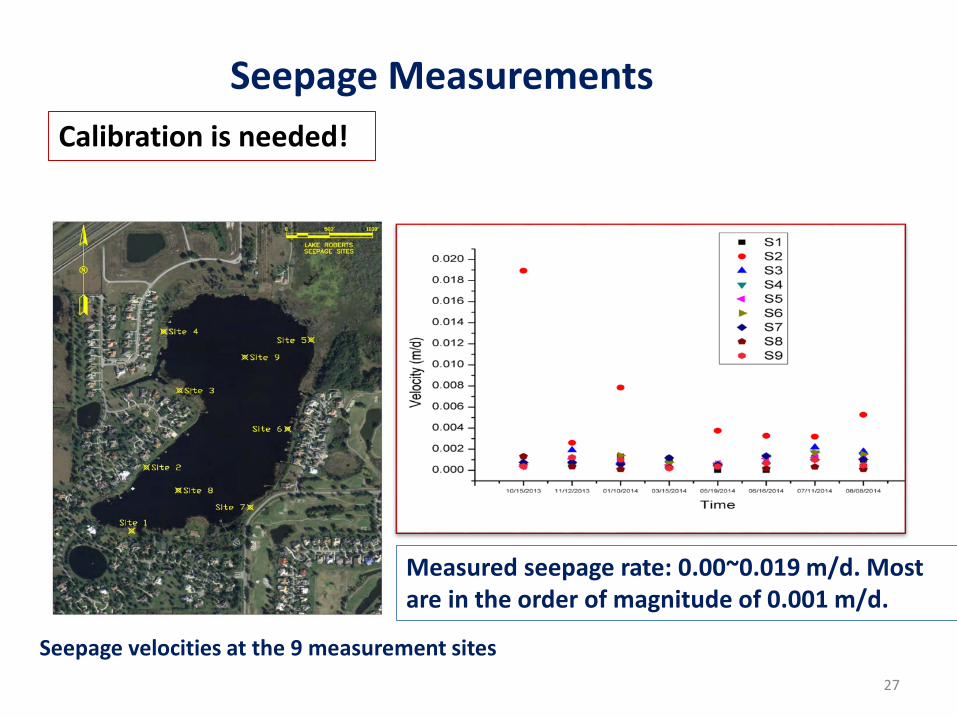
Seepage MeasurementsCalibration is needed!
Seepage velocities at the 9 measurement sites
Measured seepage rate: 0.00~0.019 m/d. Most are in the order of magnitude of 0.001 m/d.
27
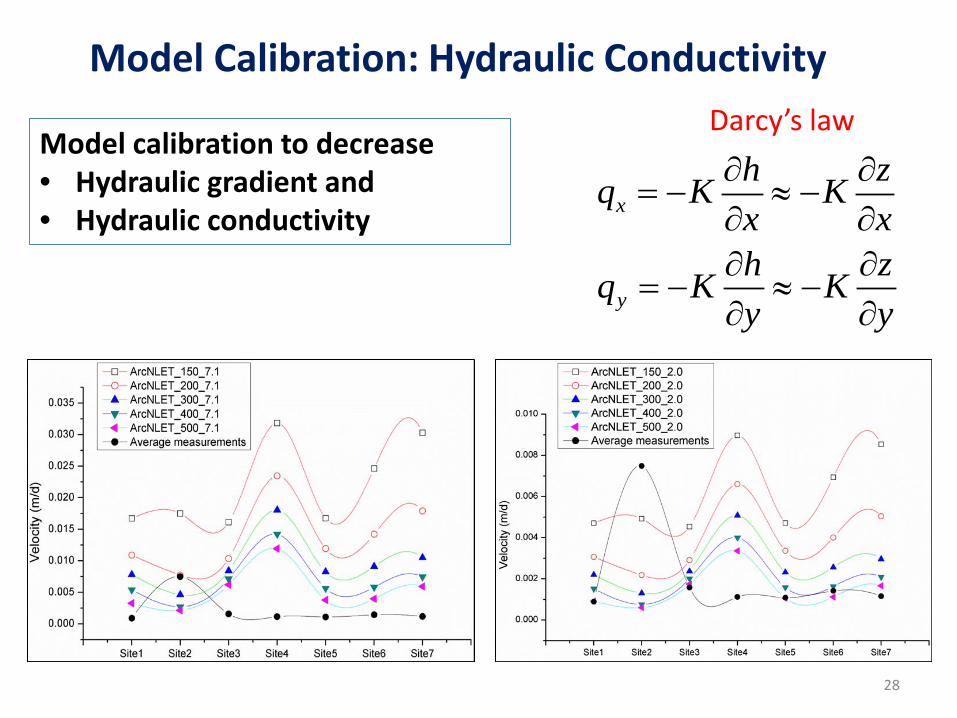
Model Calibration: Hydraulic Conductivity
Model calibration to decrease• Hydraulic gradient and• Hydraulic conductivity x
y
h zq K Kx xh zq K Ky y
∂ ∂= − ≈ −
∂ ∂∂ ∂
= − ≈ −∂ ∂
Darcy’s law
28
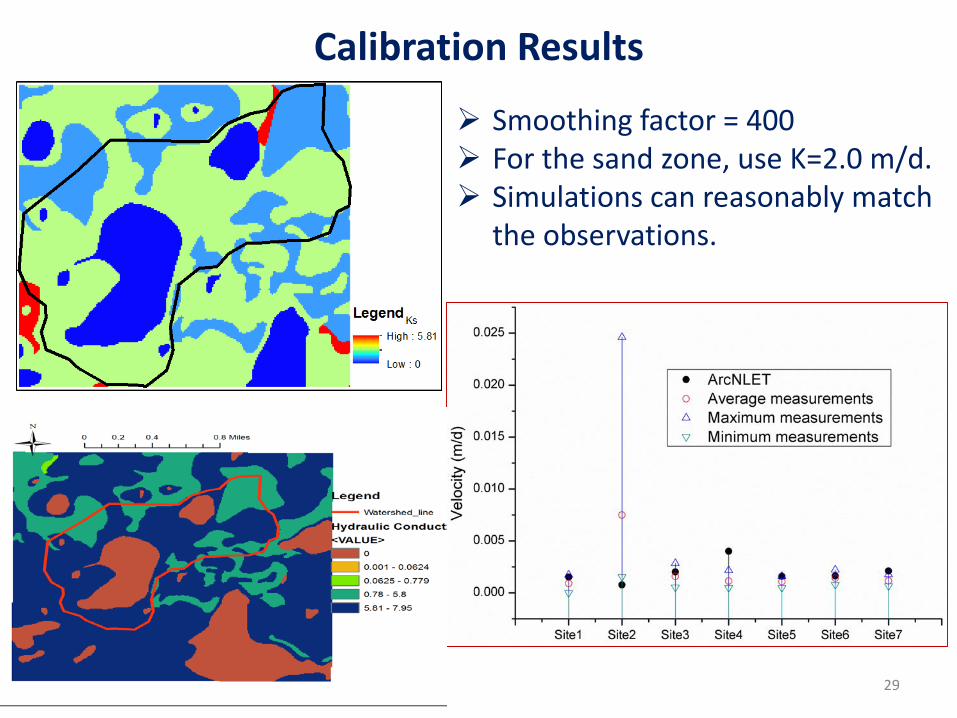
Calibration Results
Smoothing factor = 400 For the sand zone, use K=2.0 m/d. Simulations can reasonably match
the observations.
29
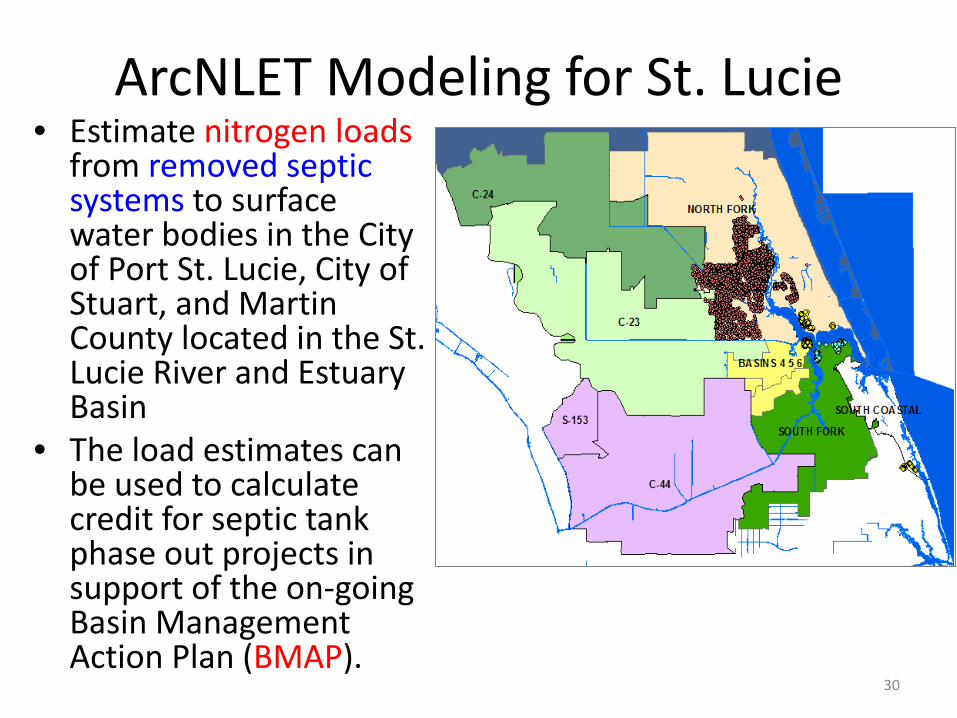
ArcNLET Modeling for St. Lucie• Estimate nitrogen loads
from removed septic systems to surface water bodies in the City of Port St. Lucie, City of Stuart, and Martin County located in the St. Lucie River and Estuary Basin
• The load estimates can be used to calculate credit for septic tank phase out projects in support of the on-going Basin Management Action Plan (BMAP).
30
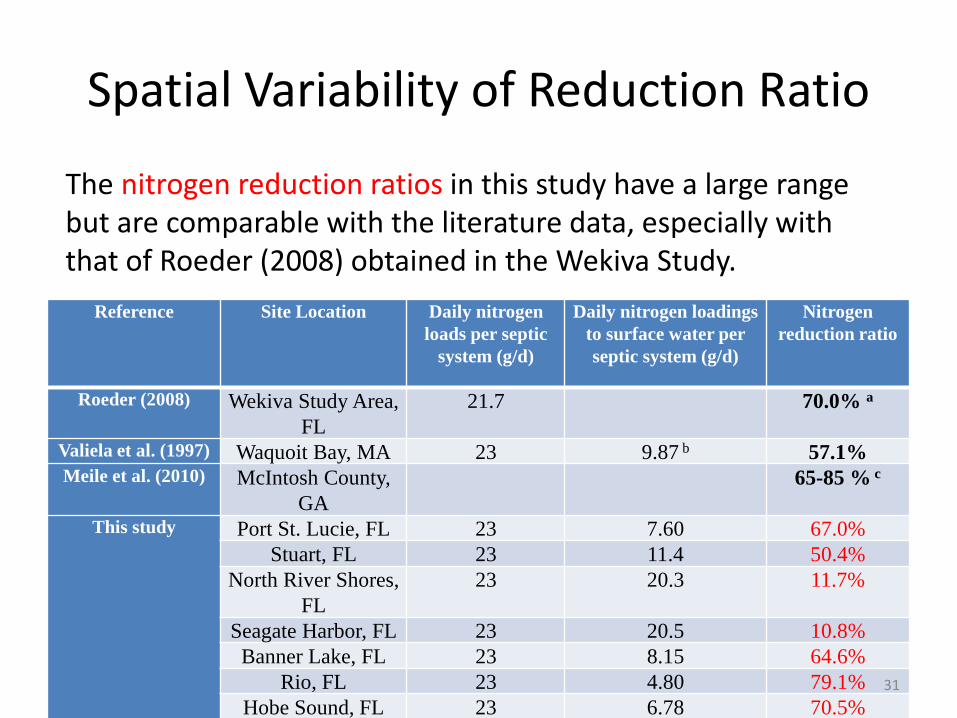
Spatial Variability of Reduction Ratio
Reference Site Location Daily nitrogen loads per septic
system (g/d)
Daily nitrogen loadings to surface water per septic system (g/d)
Nitrogen reduction ratio
Roeder (2008) Wekiva Study Area, FL
21.7 70.0% a
Valiela et al. (1997) Waquoit Bay, MA 23 9.87 b 57.1%Meile et al. (2010) McIntosh County,
GA65-85 % c
This study Port St. Lucie, FL 23 7.60 67.0%Stuart, FL 23 11.4 50.4%
The nitrogen reduction ratios in this study have a large range but are comparable with the literature data, especially with that of Roeder (2008) obtained in the Wekiva Study.
31
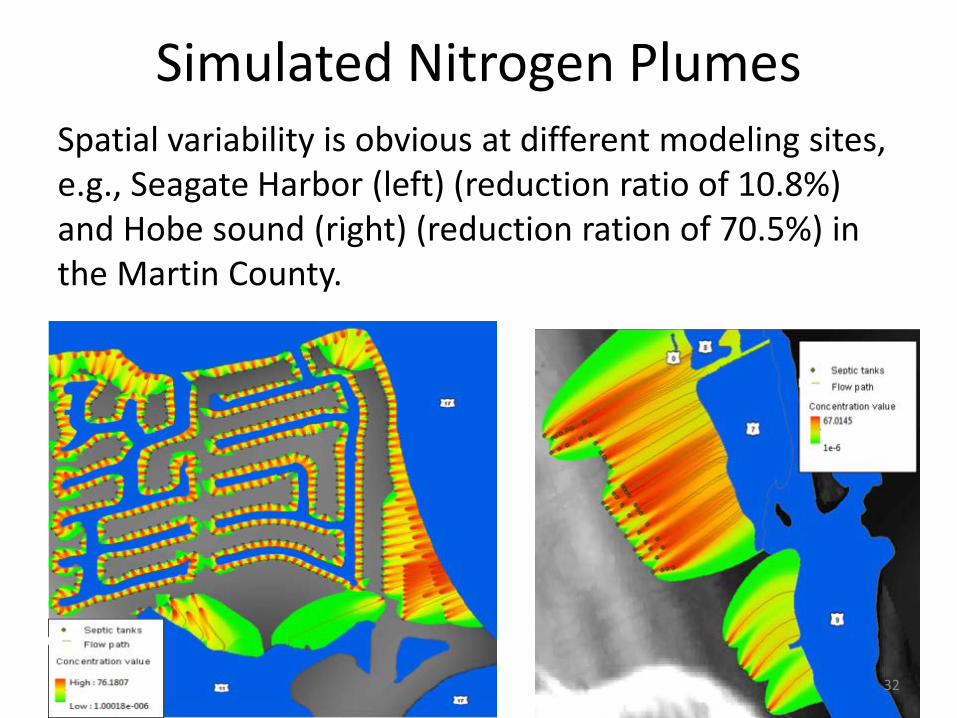
Simulated Nitrogen PlumesSpatial variability is obvious at different modeling sites, e.g., Seagate Harbor (left) (reduction ratio of 10.8%) and Hobe sound (right) (reduction ration of 70.5%) in the Martin County.
32
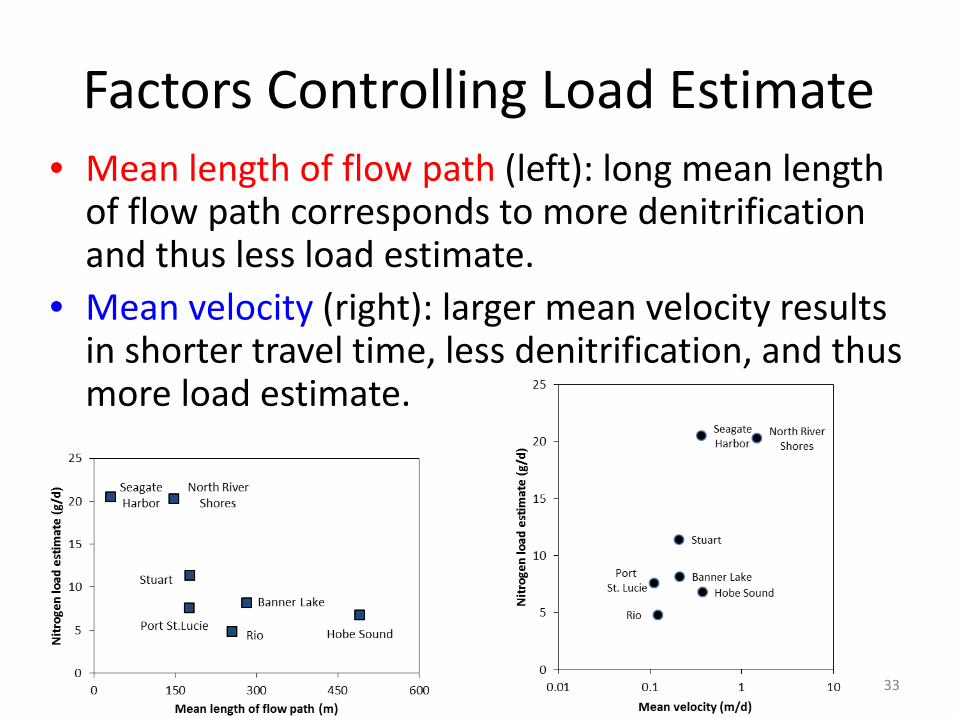
Factors Controlling Load Estimate• Mean length of flow path (left): long mean length
of flow path corresponds to more denitrification and thus less load estimate.
• Mean velocity (right): larger mean velocity results in shorter travel time, less denitrification, and thus more load estimate.
33
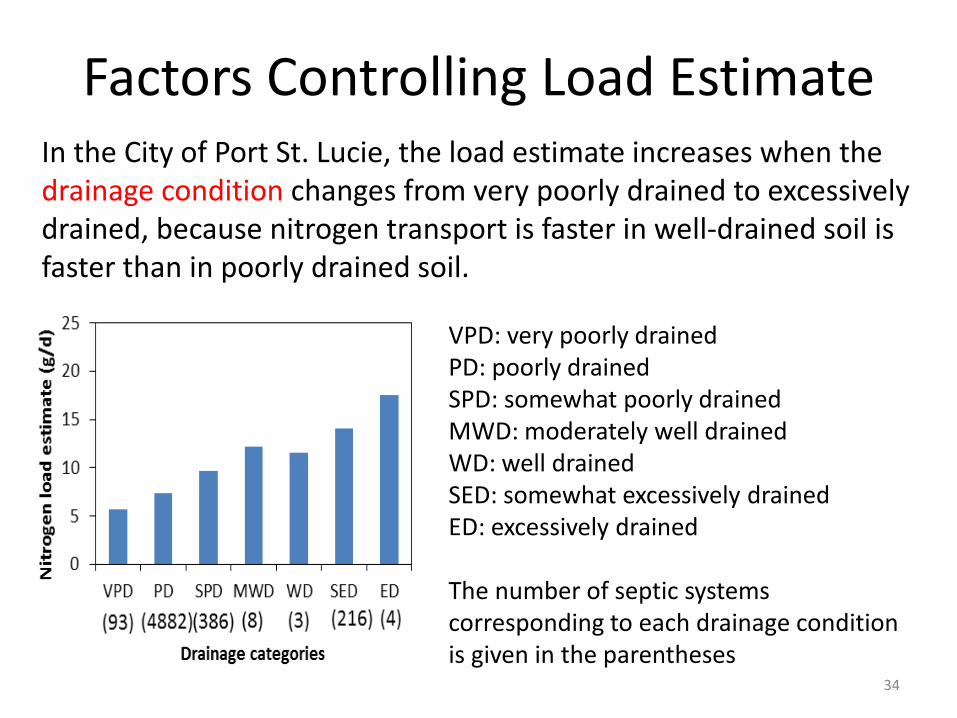
Factors Controlling Load EstimateIn the City of Port St. Lucie, the load estimate increases when the drainage condition changes from very poorly drained to excessively drained, because nitrogen transport is faster in well-drained soil is faster than in poorly drained soil.
VPD: very poorly drainedPD: poorly drainedSPD: somewhat poorly drained MWD: moderately well drainedWD: well drainedSED: somewhat excessively drainedED: excessively drained
The number of septic systems corresponding to each drainage condition is given in the parentheses
34
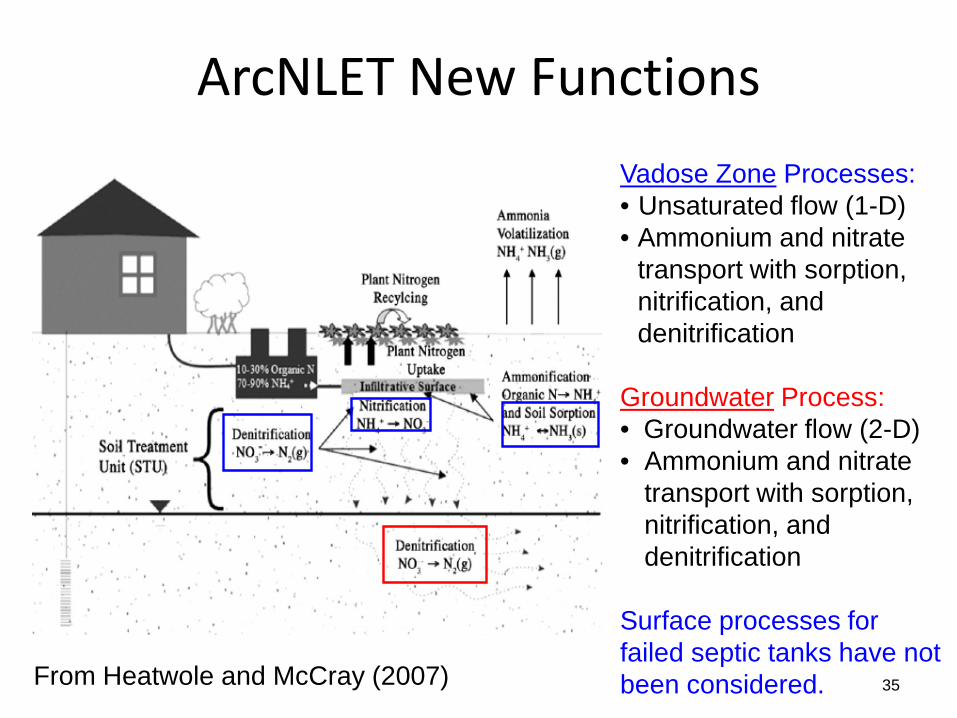
ArcNLET New Functions
From Heatwole and McCray (2007)
Vadose Zone Processes: • Unsaturated flow (1-D)• Ammonium and nitrate
transport with sorption, nitrification, and denitrification
Groundwater Process:• Groundwater flow (2-D)• Ammonium and nitrate
transport with sorption, nitrification, and denitrification
Surface processes for failed septic tanks have not been considered. 35
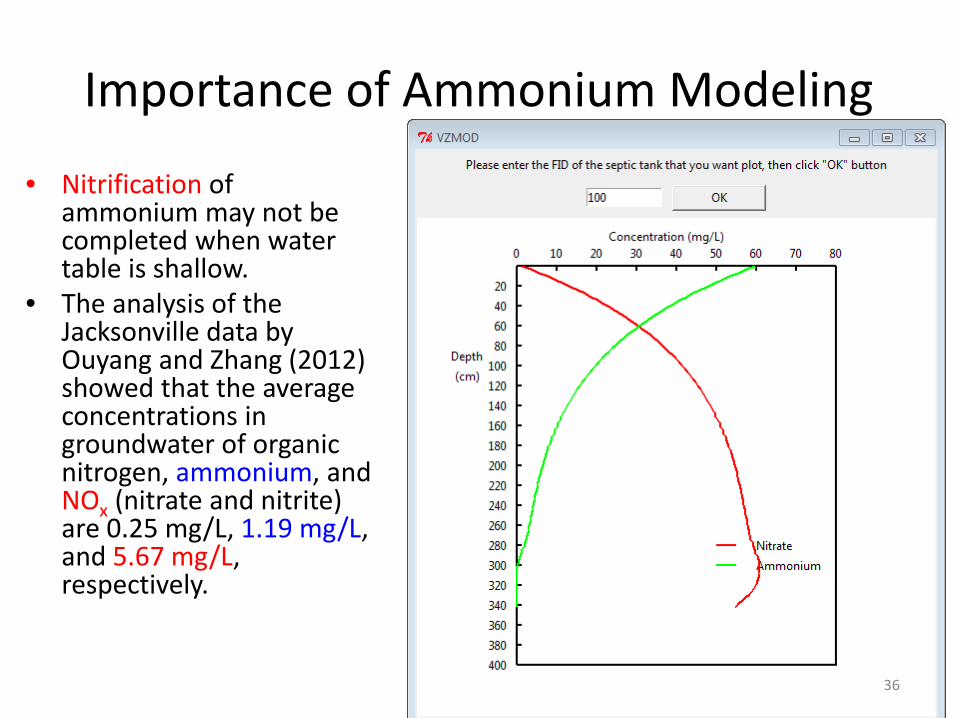
Importance of Ammonium Modeling
• Nitrification of ammonium may not be completed when water table is shallow.
• The analysis of the Jacksonville data by Ouyang and Zhang (2012) showed that the average concentrations in groundwater of organic nitrogen, ammonium, and NOx (nitrate and nitrite) are 0.25 mg/L, 1.19 mg/L, and 5.67 mg/L, respectively.
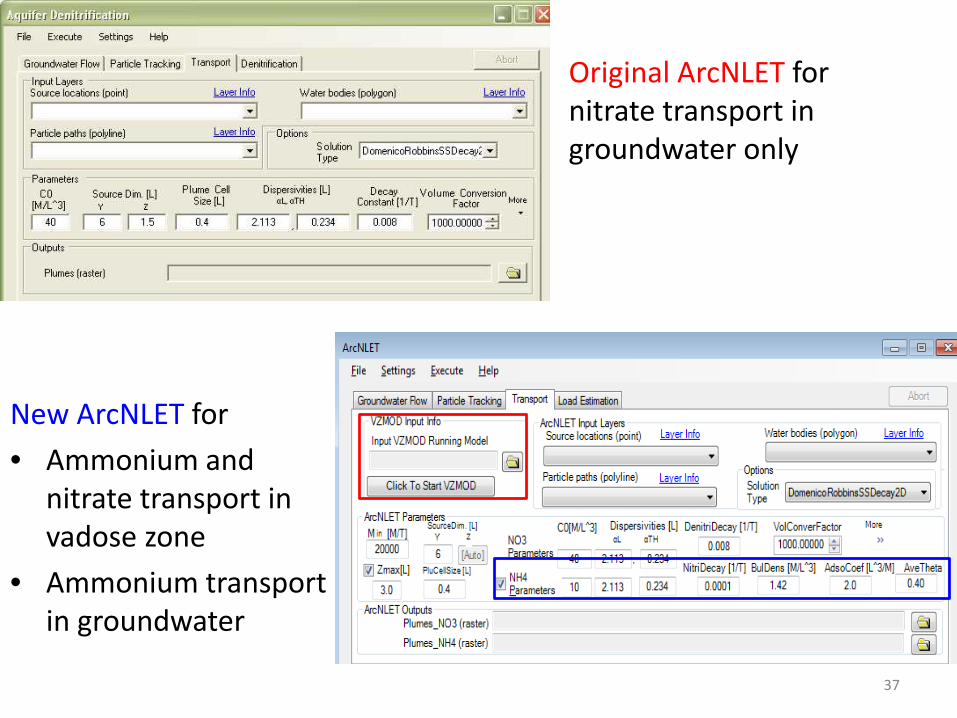
36
New ArcNLET for• Ammonium and
nitrate transport in vadose zone
• Ammonium transport in groundwater
Original ArcNLET for nitrate transport in groundwater only
37
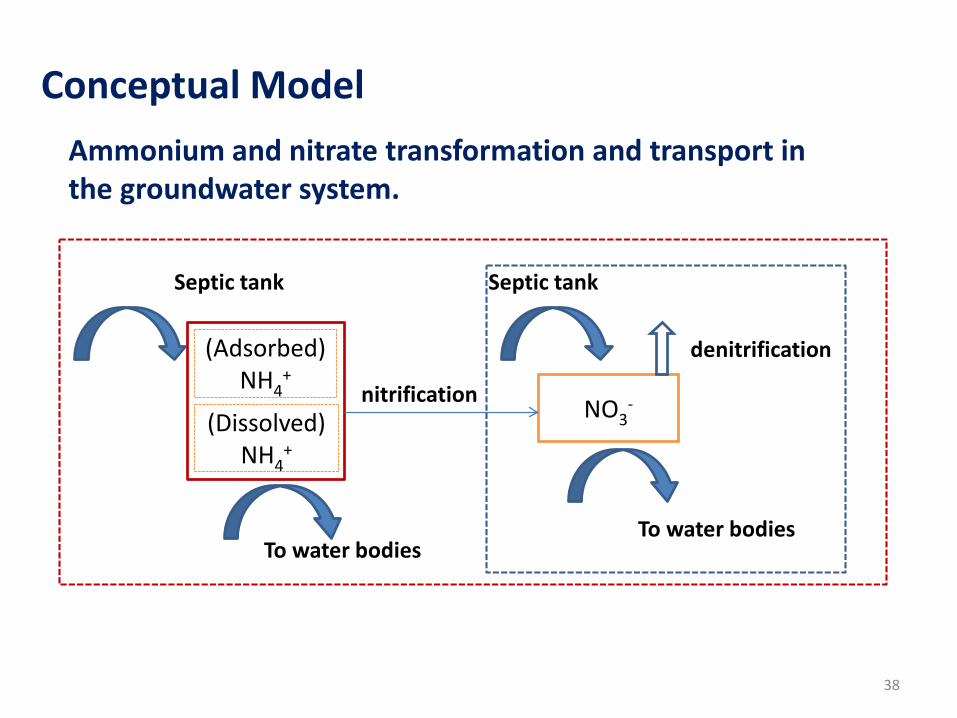
Conceptual ModelAmmonium and nitrate transformation and transport in the groundwater system.
(Dissolved)NH4
+
NO3-nitrification
denitrification
Septic tank
To water bodiesTo water bodies
Septic tank
(Adsorbed)NH4
+
38
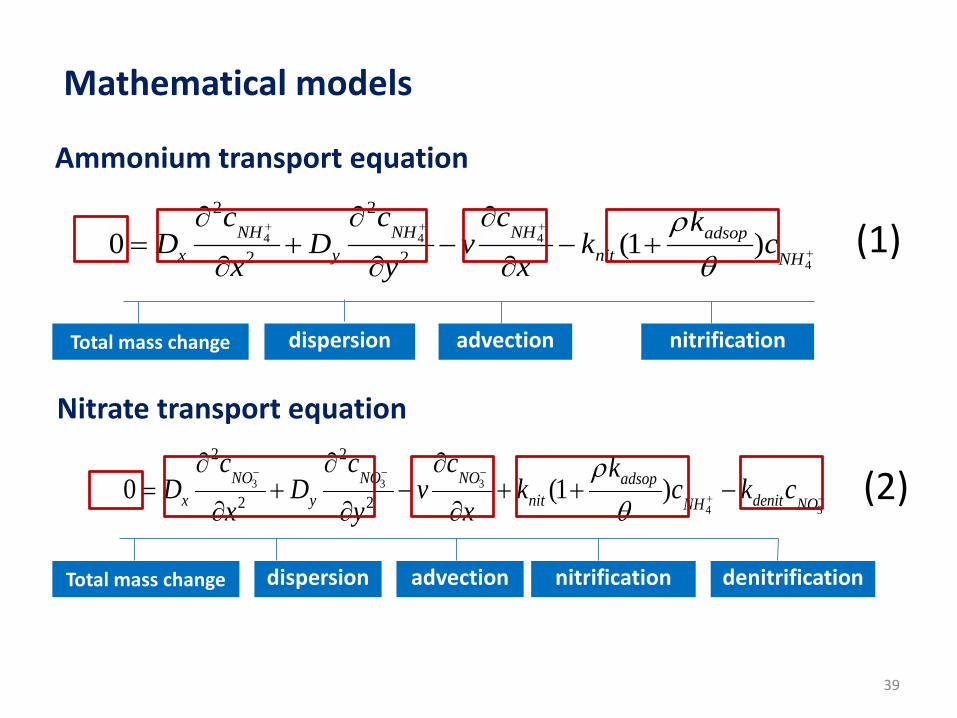
4 4 4
4
2 2
2 20 (1 )NH NH NH adsopx y nit NH
c c c kD D v k c
x y xρθ
+ + +
+
∂ ∂ ∂= + − − +
∂ ∂ ∂
3 3 3
4 3
2 2
2 20 (1 )NO NO NO adsopx y nit denitNH NO
c c c kD D v k c k c
x y xρθ
− − −
+ −
∂ ∂ ∂= + − + + −
∂ ∂ ∂
Mathematical models
Ammonium transport equation
Nitrate transport equation
dispersion advection nitrificationTotal mass change
dispersion advection denitrificationTotal mass change nitrification
(1)
(2)
39
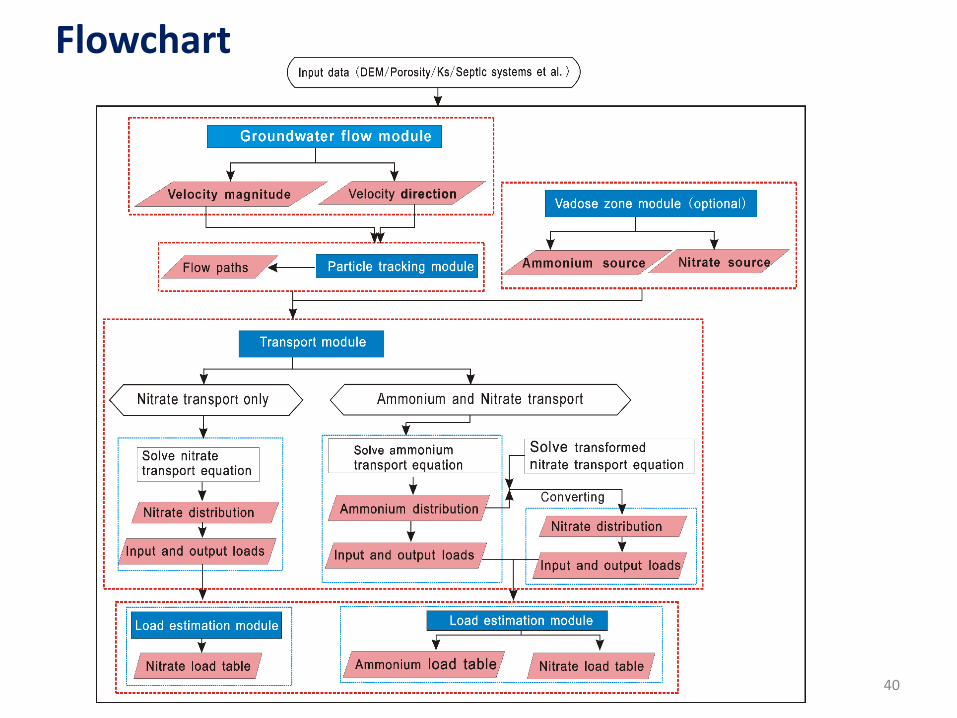
Flowchart
40
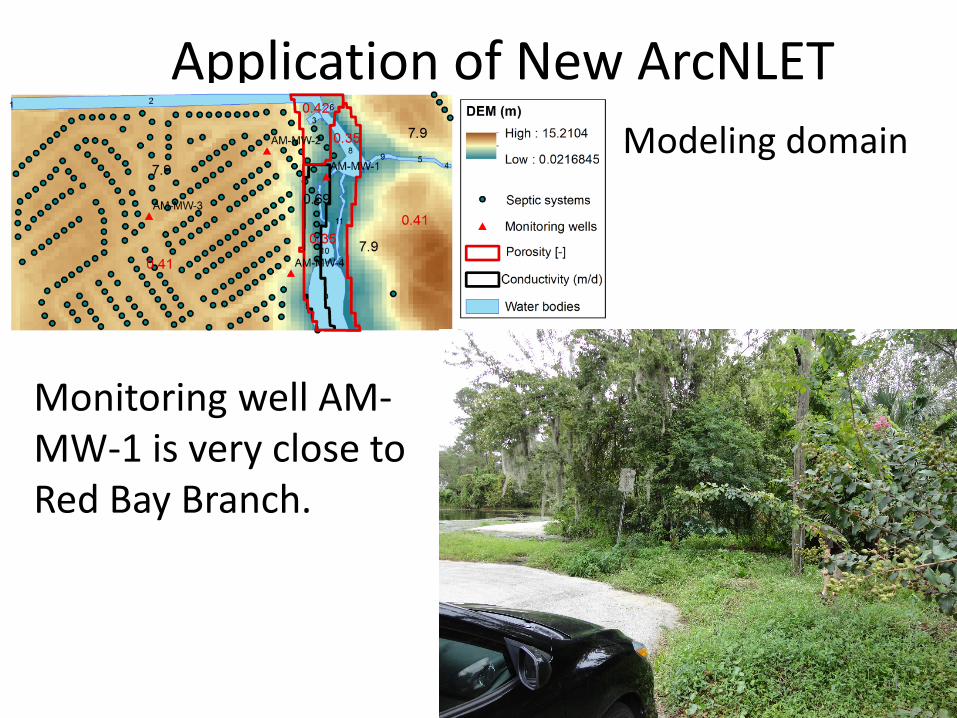
Application of New ArcNLET
Monitoring well AM-MW-1 is very close to Red Bay Branch.
Modeling domain
41
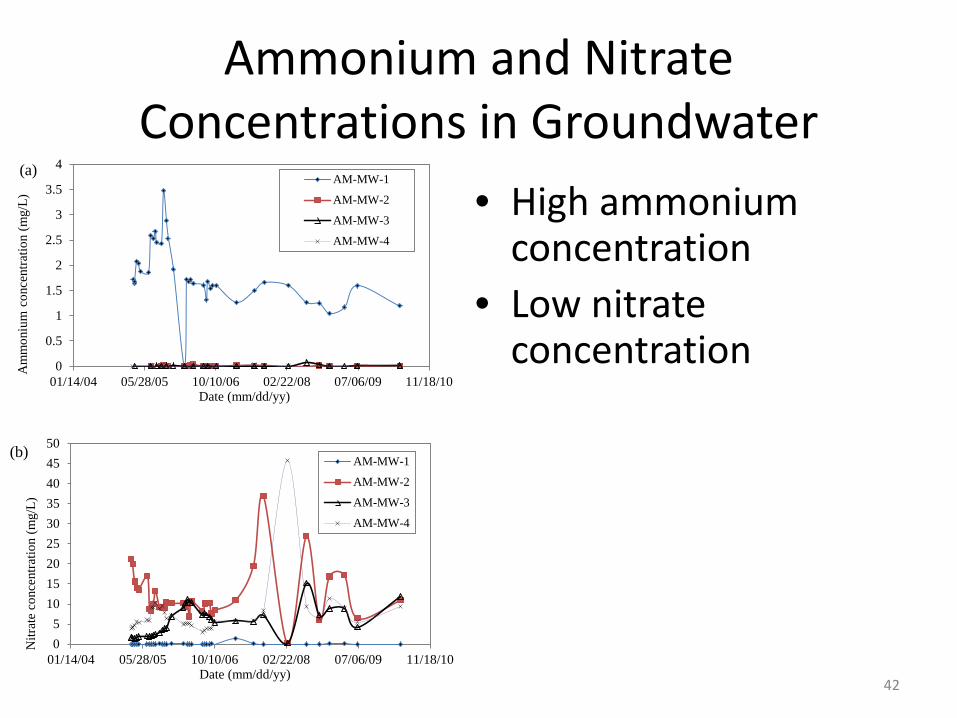
Ammonium and Nitrate Concentrations in Groundwater
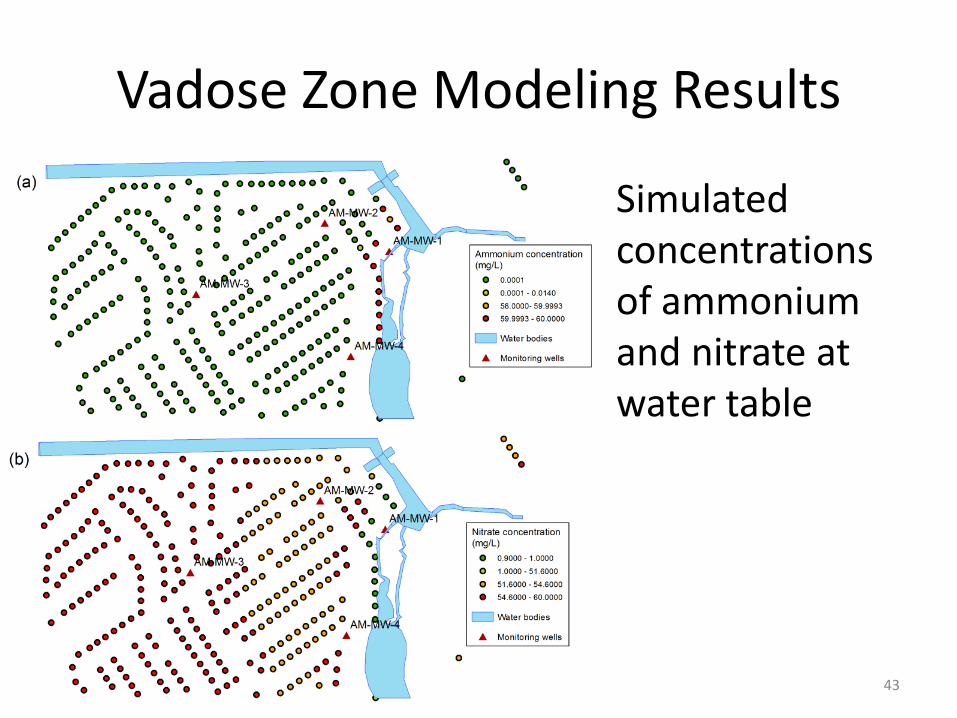
Simulated concentrations of ammonium and nitrate at water table
43
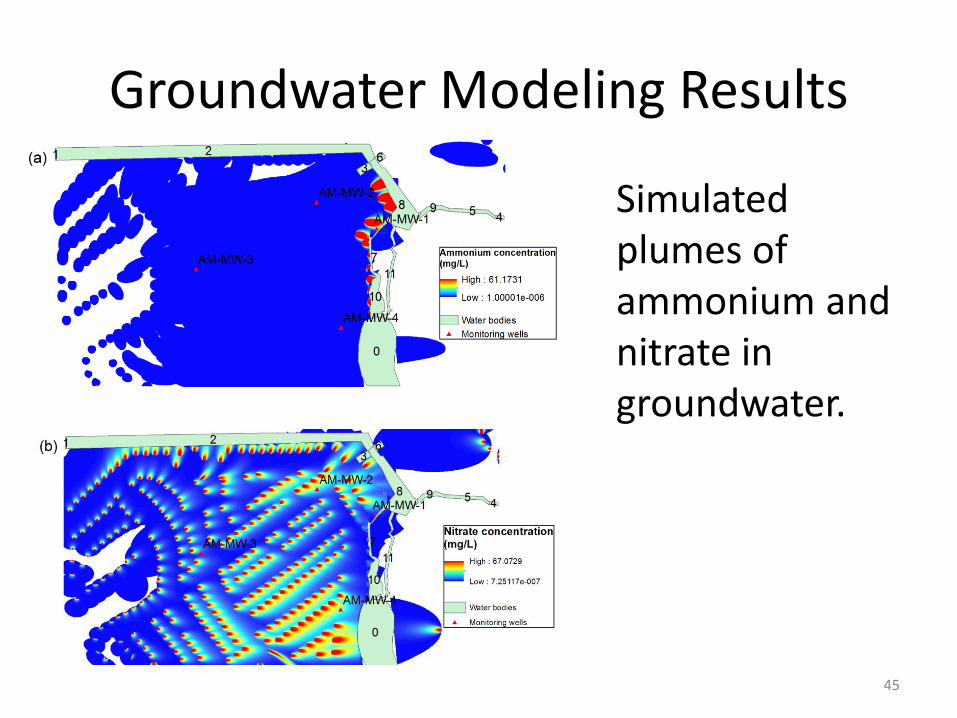
Groundwater Modeling Results
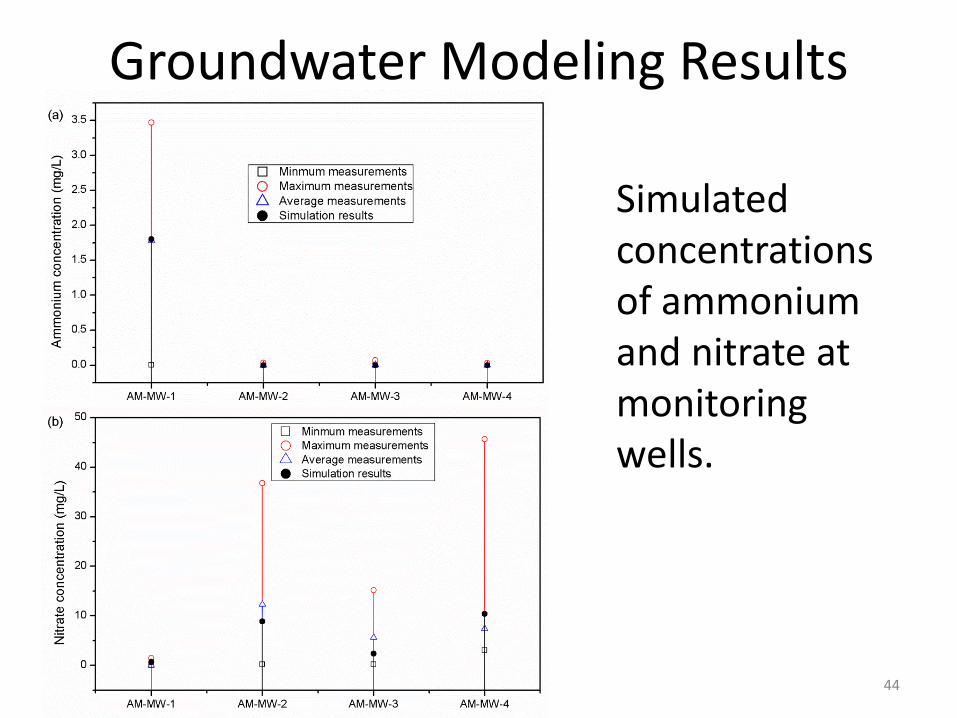
Simulated concentrations of ammonium and nitrate at monitoring wells.
44
Groundwater Modeling Results
Simulated plumes of ammonium and nitrate in groundwater.
45
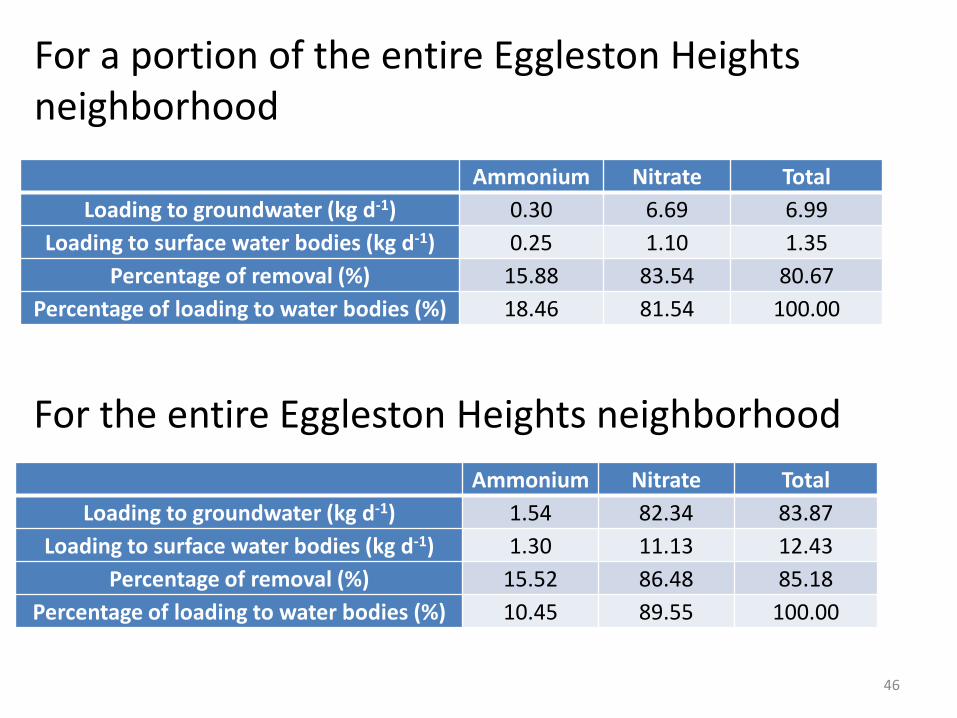
Ammonium Nitrate TotalLoading to groundwater (kg d-1) 0.30 6.69 6.99
Loading to surface water bodies (kg d-1) 0.25 1.10 1.35Percentage of removal (%) 15.88 83.54 80.67
Percentage of loading to water bodies (%) 18.46 81.54 100.00
For the entire Eggleston Heights neighborhoodAmmonium Nitrate Total
Loading to groundwater (kg d-1) 1.54 82.34 83.87Loading to surface water bodies (kg d-1) 1.30 11.13 12.43
Percentage of removal (%) 15.52 86.48 85.18Percentage of loading to water bodies (%) 10.45 89.55 100.00
For a portion of the entire Eggleston Heights neighborhood
46
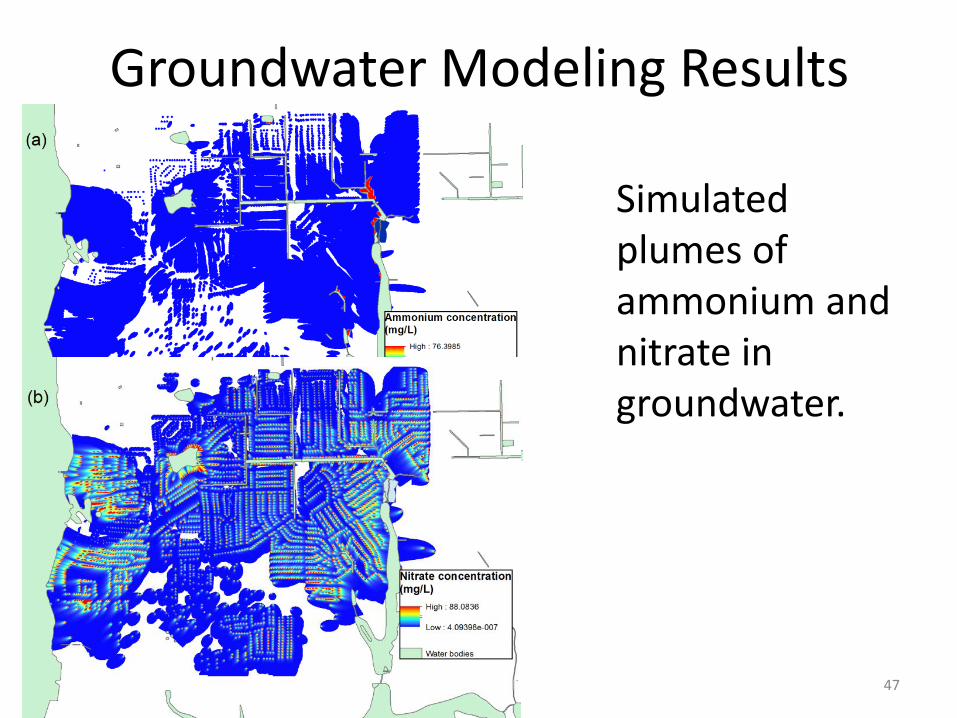
Groundwater Modeling Results
Simulated plumes of ammonium and nitrate in groundwater.
47
Conclusions• Data and information needed to establish
ArcNLET models for nitrogen load estimation are readily available in the modeling areas.
• After calibrating the ArcNLET flow and transport models, model simulations can reasonably match corresponding field observations.
• ArcNLET estimated nitrogen loads in the modeling sites vary substantially in space, and the spatial variability is useful to management of nitrogen pollution.
• The load estimates can be used directly to facilitate TMDL and BMAP planning.