An Overview of Sangam: A System for Integrating Data to Investigate Stress-Circuitry-Gene Coupling Mayank Saxena 2 , Sung-ah Kim 2 , Gully Burns 1 , Arshad M. Khan 1 , Jianwen Su 4 , Youssef Hamadi 3 and Shahram Ghandeharizadeh 2 1 Neuroscience Program, University of Southern California, Los Angeles, California 90080- 0781 2 Computer Science Department, University of Southern California, Los Angeles, California 90089-2520 3 Microsoft Research, Cambridge, CB3 OFB, United Kingdom 4 Computer Science Department, University of California, Santa Barbara, California 93106- 5110 Abstract. Sangam is an eScience collaboration between Neuroscientists and Computer Scientists to realize an environment that enables Neuroscientists to investigate “stress-circuitry-gene coupling”, that is, how particular types of stress are sensed by brain circuits, and how these activated circuits trigger gene expression in discrete brain regions. Sangam is designed to bring together di- verse information related to the stress response in mammals. We focus on stress as an eScience initiative since the integration of relevant molecular, cellular, and systems-level data may help reveal the basic biological mechanisms that are im- paired in anxiety and stress-related disorders. Sangam employs Web Services as a building block to facilitate this vision. In this paper, we provide an overview of Sangam, its final vision, and our plans to fulfill this vision. 1 Introduction Anxiety, or stress-related disorders are the most common mental illness in America, affecting about 19.1 million American adults. Some types of these disor- ders (Table 1) can be associated with other illnesses such as eating disorders, depres- sion, or drug dependency. Many scientists devote considerable energy trying to un- derstand the causal mechanisms underlying this important clinical problem, as is apparent from communities such as the Endocrine Society, which currently numbers 11,000 members in 80 countries [1]. Such scientists have obtained much data sug- gesting that anxiety disorders are caused by dysfunction within specific brain circuits, but the precise relationships between these circuits and the way in which they are recruited by stress signals is unclear. Understanding this is critical for treating stress disorders.
Transcript
An Overview of Sangam: A System for Integrating Data to Investigate Stress-Circuitry-Gene Coupling
Mayank Saxena2, Sung-ah Kim2, Gully Burns1, Arshad M. Khan1, Jianwen Su4, Youssef Hamadi3 and Shahram Ghandeharizadeh2
1 Neuroscience Program, University of Southern California, Los Angeles, California 90080-0781
2 Computer Science Department, University of Southern California, Los Angeles, California 90089-2520
3 Microsoft Research, Cambridge, CB3 OFB, United Kingdom 4 Computer Science Department, University of California, Santa Barbara, California 93106-
5110
Abstract. Sangam is an eScience collaboration between Neuroscientists and
Computer Scientists to realize an environment that enables Neuroscientists to investigate “stress-circuitry-gene coupling”, that is, how particular types of stress are sensed by brain circuits, and how these activated circuits trigger gene expression in discrete brain regions. Sangam is designed to bring together di-verse information related to the stress response in mammals. We focus on stress as an eScience initiative since the integration of relevant molecular, cellular, and systems-level data may help reveal the basic biological mechanisms that are im-paired in anxiety and stress-related disorders. Sangam employs Web Services as a building block to facilitate this vision. In this paper, we provide an overview of Sangam, its final vision, and our plans to fulfill this vision.
1 Introduction
Anxiety, or stress-related disorders are the most common mental illness in America, affecting about 19.1 million American adults. Some types of these disor-ders (Table 1) can be associated with other illnesses such as eating disorders, depres-sion, or drug dependency. Many scientists devote considerable energy trying to un-derstand the causal mechanisms underlying this important clinical problem, as is apparent from communities such as the Endocrine Society, which currently numbers 11,000 members in 80 countries [1]. Such scientists have obtained much data sug-gesting that anxiety disorders are caused by dysfunction within specific brain circuits, but the precise relationships between these circuits and the way in which they are recruited by stress signals is unclear. Understanding this is critical for treating stress disorders.
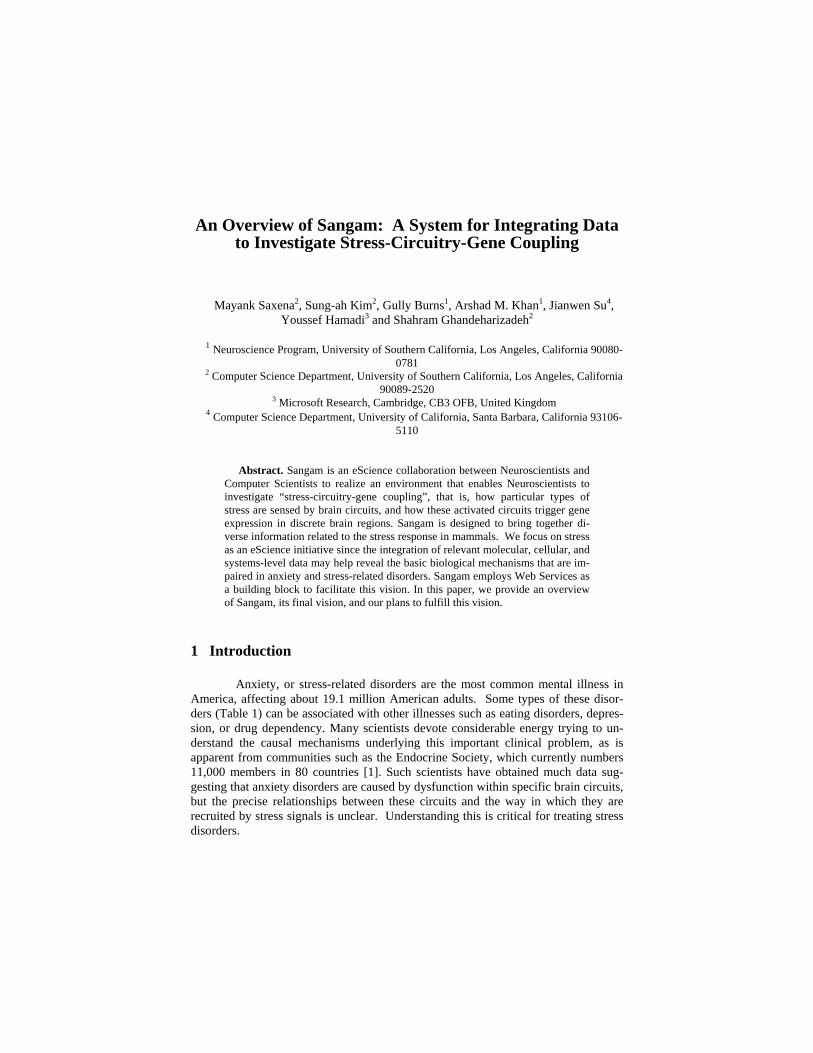
Fig 1. An Overview of the brain’s response to stress, showing the diversity
of data types that can be generated for each component in the sequence.
We propose Sangam (a Tamil word for “a symposium, a meeting or a coun-cil of scholars”; also an Urdu/Hindi word denoting “river delta”) as an end-to-end system to address this challenge. Sangam provides a what-oriented interface to facili-tate the seamless, rapid integration of different data sources using the context pro-vided by local databases of scientific data concerning brain responses to stress, as
outlined in Fig 1. It provides a graphical interface for use by a neuroscientist working in this field. Sangam demonstrates the utility of Web Services, Proteus [2], Neuro-Scholar [3], NeuARt II [4], WSE 2.0 [5], and Microsoft .NET for scientific client applications.
2 Need for Ontologies and Data Sources
As shown in Figure 1, stress stimuli are detected by bodily sensors, which can activate specific brain circuits. Since these activated circuits interconnect a vari-ety of brain regions, this leads to alterations in the synthesis or expression of specific molecules in these brain regions. Fig. 1 also illustrates how the field of stress re-search is dependent on data from many different modalities: physiology (stress stim-uli), anatomy (brain circuits and regions) and cellular/molecular biology (mole-cules/hormones). Each modality uses information according to a specific design, which must be specified in an ontology that describes the types of entities and how they relate to each other. Each data source supplying data concerning a specific mo-dality describes its own ontology explicitly according to the WSDL standard. The ontologies that we mediate across include, stress stimulus experiments (concerning the induction of stress under experimental conditions and the measurement of the animal’s response to stress), neuroanatomy (concerning the detection of genes, tran-scripts and proteins in discrete regions of the brain, and the interconnectivity of these regions), and molecular biology (involving genes [DNA], transcripts [mRNA] and proteins). Therefore, an important milestone for Sangam is to adapt the data from these sources into an explicit internal representation that establishes their relation-ships together.
At the technical level, a key component is to develop mappings (automated or semi-automated) between the ontologies so that data from different sources can be integrated. Note that this differs from the typical data integration applications where data mappings are done in advance. On the contrary, in Sangam data sources often change and data are integrated at query processing time and via Web Services.
3 Graphical User Interface
In collaboration with neuroscientists and neuroinformaticians studying brain mechanisms underlying the stress response [4, 6, 7], we are developing a preliminary user interface for Sangam (see Figures 2 and 3). This visual design of this interface is based on an atlas-viewing tool, ‘NeuARt’ [8]. It integrates different web-services (data sources) to facilitate the information about Brain Volumes, Molecule and Stressor. It is a “what-oriented” search interface for a neuroscientist. A what-oriented interface empowers scientists to focus on their target search and the retrieved results (instead of the physical location of data sources and how it should be presented). Sangam’s interface consumes the input from the scientist, retrieves the information from various sources by integrating them based on the input terms, and displays the
final results. This interface can also dynamically adapt to the changes in retrieval format or location of data sources without disturbing the scientist (by hiding the un-necessary details from the scientist).
To elaborate, Sangam’s interface is tailored to enable a scientist to search for a particular Molecule, Stressor and Brain Volume. The data retrieved in response to a query is shown in an interface, enabling the scientist to select those that should be interrogated further and potentially displayed on the brain image. The scientist may navigate across various results set to further narrow down the search. This might pose additional queries to Sangam’s execution engine. In essence, our proposed inter-face serves in two stages: First, to enable a neuroscientist to query the underlying data sources. Second, to show the retrieved result sets for the selected qualifying records. A brief description of this interface follows in subsequent paragraphs.
Figure 2 shows the left part of the interface. This has a menu consisting of the following sub-folders: Brain Volume, Molecule, and Stressor. A neuroscientist may choose any of the items, which then will be expanding to provide the text box along with sub-categories to perform the query. For example in Figure 1, the Mole-cule section is expanded and the sub-category list of DNA, RNA and Protein is show above the search text box. A user may choose one or more sub-categories to put further constraints on the query. Similarly, scientist can do the query for Brain vol-umes and Stressors sub-folders. In each sub-folder, the neuroscientist may search a particular term by inputting it into the text box. Search for a term will produce a list of qualifying candidates, which were extracted from various data sources (based on the searched term), to present it to the neuroscientist as show in Figure 3 (highlighted in purple).
The interface allows a neuroscientist to choose one or more of the qualifying candidates (e.g., qualifying Molecules) from the list to further narrow down the search. Interface then display the matching images of brain slices containing differ-ent candidates in different colors. The scientist may choose a desired brain image by clicking the appropriate colored line in the saggital view of the brain. The selected image will be shown in the center frame’s main window. All the adjacent images for the selected image will be shown in the filmstrip box below the main window. The scientist may scroll through them using the left-right arrow keys, and jump to various colored lines in the side view of brain image using the arrow keys. For example, as shown in Figure 3, the term “CRH” may be searched for in the context of “Mole-cule”, causing the interface to list matching entries. If the user selects multiple Mole-cule instances (e.g., “crh3”, “crh6”, and “crh7”) a corresponding number of different colors are used to display the results for each in the main image, and to highlight the corresponding thumbnails in the filmstrip box. The input and output connections associated with the highlighted brain volumes, that is, the connections of each brain volume containing the queried Molecule(s), are shown in the input-output box in the lower portion of the center frame. Similarly detailed information for each term and its corresponding stressors are shown in the Molecule Result and Stressor Result boxes, respectively (in the right-hand frame).
A scientist may traverse among various result sets (main and side view brain image windows; or molecule, stressor or input/output result boxes) to look up infor-mation related to the original search. For example, Figure 3 displays information
about “crh3.” By clicking on one of the yellow lines in the side view, a scientist can switch to view the next qualifying brain image for a different molecule (e.g., “crh6”). This will automatically adjust all other result boxes such that information for “crh6” is now shown, thereby allowing for information associated with “crh3” to be readily compared with that for “crh6”. Also, scientists can ‘zoom into’ or ‘zoom out of’ the main brain image to see the details of locations in the brain for various spatial in-stances of the “crh3” molecule; this is done by clicking on the various blue circles in the image which will automatically adjust the contents of the results boxes according to this new selection. This facilitates easy navigation through various result sets.
Internally, the Sangam interface uses an XML plan that directs Proteus [2] to contact various required autonomous Web Services (like KEGG, NCBI, BAMS and NeuARt II) and Proteus’ internal Web Services (named Project, Iterator, IUnion, Branch and Join) [2] to produce the results shown in Figure 3. Input and Output con-nection information will be retrieved from the BAMS web-service whereas the Neu-roScholar and NeuARt II web-service will provide the stressor information. Other data sources such as KEGG and NCBI will be used to retrieve the detailed informa-tion of Gene/Molecule. The atlas maps for the brain images [9] used within this GUI are currently only available to users who have local copies of these maps stored on their hard drives, and will not be served up on the web due to copyright restriction.
START ZOOM POINTER QUERY POINTER HELP
BRAIN VOLUMEMOLECULE
STRESSOR
INPUT OUTPUT
Search
DNA RNA Protein
Fig 2. Initial Window of Sangam GUI
START ZOOM POINTER QUERY POINTER HELP
INPUT OUTPUT
MOLECULE
STRESSOR
Crh3<Gene Sequence>
<Name>
<Position>
<Ortholog>
<condon_usage>
<other information>
Crh6
Crh7
Crh3
input1
input2
Crh6
Crh7
Crh3
output1
output2
Crh6
Crh7
Crh3
stressor1
stressor2
stressor3
stressor4
Crh6
Crh7
BRAIN VOLUMEMOLECULE
STRESSOR
CRH
Search
DNA RNA ProteinX X
Crh1
Crh2
Crh3
Crh4
Crh5
Crh6
Crh7XCrh8
Crh9
Crh10
Crh11
Crh12
More Results 1 2 3 4 5 6 7 8 9 >>
Show
Total Matches Found : 64
X
X
Fig 3. Result returned by the Sangam GUI
4 Composition of Web Services
As stated earlier, the main component in Sangam is around composing exist-ing (data) Web Services “on-the-fly” in order to support the functions in the user interface. We believe such a Web Service based paradigm has many advantages. First, it uses a more general data model based on the XML and XML Schema, which is not constrained to specific data models and representation individual data sources actually use. Second, by blending operations with data in the form of Web Services, it allows composition to be automated while retaining much of usability in the applica-tions we aim to support. Third, the data processing at the core of Sangam does not have a limit on the processing power, and thus more scalable. Indeed, the simpler Web Service interfaces make it easy to add new processors when required by the need. This resemble the benefits “grid computing” enables. In fact, “data-centric” grid computing or “data grid” would certainly benefit many applications.
One may view composition of Web Services with Sangam as having two main goals; first, to offer a consistent and efficient framework for web-services com-position and execution, and second, to initiate and facilitate collaboration between different end-users. To achieve the first objective, we define several high-level query-ing tools which will efficiently handle the complexity of web-services composition. The second objective implies some understanding of end-users’ backgrounds, work (composition) and experience. This will involve a fine analysis of end-users actions
(system configuration, requests), which will serve as an input to some high level user-matching component.
Fig 4. General architecture for web-services composition and end-users collaboration
Figure 4 presents this architecture. We can observe that end-users perform their operations through a service dedicated to web-services composition. This ser-vice represents a general front-end abstracting the practical complexity of web-services definition and composition. It internally composes the plan and integrates the various Web Service required to perform the particular operation asked by the user because of which he need not to worry about the syntactic knowledge of various technical components (like WSDL, XLANG etc.) to use this service. As discussed in previous section, this service produces the results (Figure 3) based only on user inputs (Figure 2), which are specific to brain stressors.
This service also feeds the user-matching module. Each request or system con-figuration related to any end-user is addressed to this last module, which applies a set of tool to automatically identify and connect potential co-workers. After this high level description we can now derive a more precise definition of the previous two modules. We will distinguish between two levels of raising complexity.
4.1 Composition helpers and simple matching
This first incarnation of the architecture combines some simple mechanisms, which greatly leverage the web-services composition experience. The composition module is limited to a set of typical db queries. Those queries allow a neat abstraction of low-level web-services definition languages. The matching module performs a simple matching by computing a distance between users query. This distance can be defined with respect to web-services accessed by the queries and with respect to the filtering constraints of the queries. An option is to allow user feedback in the identify-ing candidate queries. For example, the system may present the user with a choice of
Web service reposi-
Services for compo-sition and execution
User Matching
different candidate plans in the form understandable by the user (e.g., with the help of the ontologies).
4.2 Automated composition and advanced matching
This second incarnation will implement the latest development of automated planning related to web-services composition [10]. The composition module is able to interpret some high level query expressing the functionality of the resulting composi-tion. It uses an automated planner to automatically compute a plan, which represents an ordered composition of simple services.
The matching module can firstly use the high level querying objects in order to automatically connect end-users with respect to the previous distance. However, it can also perform this distance calculation with the resulting plans, which represent a practical interpretation of the high level queries. Working at this operational level may greatly simplify the matching operation.
At a more advance level is to compose complex services (e.g., existing plans). Often these services cannot be simplified to input/output operations, but rather, they are a set of “activities” with a known partial order on them. Composition of such services is generally. The deterministic automata model of complex service composi-tion in harder [Romen Model, CHIS:ICSOC04] may be used for some simple plans (that are sequences of activities). Based on these techniques, we will develop more general algorithms for Sangam.
5 Execution of Plan
The proposed user interface will broadly consists of two distinct phases: • Phase 1: Locates all matching entries for a specified search condition on
both the term, e.g., term = “crh”. • Phase 2: Retrieves information on the records selected from Phase 1. The
user-interface allows a user to select a subset of records identified during Phase 1 for submission during Phase 2.
We describe each phase in turn.
5.1 Phase 1
Phase 1 will employs the following autonomous Web Services: 1. KEGG find (K-Find) Web Service: It will takes the term parameter and call
the find web-service provided by the KEGG which will then returns the list of matching records.
2. NCBI e-search (N-eSearch) Web Service. It will also takes the term and re-trieves the matching record list by using the URL retrieval in XLM format.
The results of these two web services are combined using Sangam’s internal
Web Services. These are: Branch, Iterator, IUnion, and Join. The plan that consists of these operators along with the autonomous Web Services is as follows:
Fig 4. Execution Plan Phase 1
Sangam’s Web Services provide the following functionalities. • Branch Operator (B): it takes the input from the SANGAM user interface
and branches it out as inputs to the branches of K-Find/N-eSearch webser-vice and N-eSearch web-service.
• Iterator Operator (I): It takes the all the inputs (in this case term and spe-cies) and shower them across all the available instances of K-Find/N-eSearch webservice.
• Iunion Operator (IU): this is a pair operator for the Iterator webservice it joins all the results returned from all the K-Find/N-eSearch sub-branches and forward it to the Join operator
• Join Operator (J): Join operator will join the results from the both the main branches and give it to the SANGAM user-interface as list of DNA and Pro-tein records returns by K-Find and N-eSearch respectively.
5.2 Phase 2
The user employs an interface to specify those genes (from KEGG) and pro-teins (from NCBI) of interest. This list is submitted to Phase 2 of the system, which employs the following external Web Services:
1. KEGG Get (K-Get) web-service: It will use the Get web-service supported
by KEGG to returned the detailed information about all the records by the users.
2. NCBI eFetch (N-eFetch) web-service: It will use the eFetch URL utility provided by the NCBI to get the information of all the selected records in the XML format.
3. NeuARt II web-service: It will be used to get the related stressors for the corresponding records returned in Phase 1.
4. BAMS web-service: this web-service will provide the input and output con-nections of all the input records.
Fig 5. Execution Plan Phase 2
Once again, phase 2 employs Sangam’s internal Web Services as glue to
combine these autonomous Web Services together. In addition to the autonomous web-services used in Phase1, Phase 2 uses one more autonomous web-service called Project.
• Project Operator (P): it is placed in between the Branch and Iterator web-
service so that it filters out record-ids irrelevant for the particular branch (e.g. in the above diagram P2 will filter out all the records returned by K-Find web-service)
This whole process consisting two phases is iterative, so that user can per-
form the same operation again for different terms for Brain Volume, Molecule and Stressor through SANGAM interface.
6 Conclusion
We envision two goals for Sangam. First, Sangam will demonstrate the fea-sibility of automatic integration of diverse data sources for a particular discipline, in this case, neuroendocrinology (stress research). Sangam’s current design is a proto-typical system that demonstrates the importance, usefulness and feasibility of infor-mation integration within neuroscience. This will have an impact within the neuroin-formatics community and may encourage database developers within this field to provide web service interfaces to their systems. By providing both Sangam’s inter-faces on the Web and its software, we intend to encourage scientists to publish their data and relevant computation as Web Services.
Sangam’s second goal is for scientists to use or share each other’s data sources to extract comprehensive information by building interoperability into their respective systems using web services. Interoperability has always been emphasized by a variety of communities and funding agencies as very desirable and yet, very few online systems can run queries remotely (see, for example, the Society for Neurosci-ence's ‘Neuroscience Database Gateway (NDG)’ [11] for a list of 90 examples). Since Sangam offers the possibility of providing seamless interoperability among systems enabled as web services, and since the technical overhead of implementing web ser-vices is small, our work could conceivably set a new standard for building interop-erability into biomedical informatics systems.
The implementation details for Sangam, which is still in its infancy, might be challenging, forcing us to make changes to the overall design of the system. Once a version of Sangam is implemented, its performance must be analyzed carefully. In particular, the system must respond to a user quickly. One approach is to use caching of results in Sangam in anticipation of future use. This constitutes the focus of our future research activities beyond the first year. We would also like to focus on inte-grating the various web services during execution time based on specific queries put in by the users. Another long-term objective is to make Sangam more general so that it is applicable to a larger class of applications. This may involve the use of tech-niques that discover scientists’ contexts based on their queries and retrieved results.
References
1. The Endocrine Society, www.endo-society.org 2. S. Ghandeharizadeh, C. A. Knoblock, C. Papadopoulos, C. Shahabi, E. Alwagait, J. L.
Ambite, M. Cai, C. Chen, P. Pol, R. Schmidt, S. Song, S. Thakkar, and R. Zhou. ”Proteus: A System for Dynamically Composing and Intelligently Executing Web Ser-vices”. In the First International Conference on Web Services (ICWS), Las Vegas, Nevada, June 2003.
3. G. A. P. C. Burns (2001) Knowledge management of the neuroscientific literature: the data
model of the NeuroScholar system, Phil Trans R Soc B 356:1187-1208.
4. G.A.P.C. Burns, A.M. Khan, S. Ghandeharizadeh, M.A. O’Neill, Y-S Chen (2003) Tools and Approaches for the Construction of Knowledge Models from the Neuroscientific Litera-ture, Neuroinformatics 1(1):81-109.
5. Web Service Enhancement, http://msdn.microsoft.com/webservices/building/wse 6. A.G. Watts (1996). The impact of physiological stimuli on the expression of corticotropin-
releasing hormone (CRH) and other neuropeptide genes. Front Neuroendocrinol 17(3):281-326.
7. A. M. Khan and A. G. Watts (2004). Intravenous 2-Deoxy-D-Glucose Injection Rapidly
Elevates Levels of the Phosphorylated Forms of p44/42 Mitogen-Activated Protein Kinases (Extracellularly Regulated Kinases 1/2) in Rat Hypothalamic Parvicellular Paraventricular Neurons. Endocrinol 145(1):351-359.
8. Dashti, A. E., S. Ghandeharizadeh, J. Stone, L. W. Swanson and R. H. Thompson (1997).
Database challenges and solutions in neuroscientific applications. Neuroimage 5(2): 97-115. 9. L.W. Swanson (1998/1999). Brain Maps: Structure of the Rat Brain, Second Edition. El-
sevier: Amsterdam. 10. M. Pistore, F. Barbon, P. Bertoli, D. Shaparau, P. Traverso. Planning and Monitoring Web
Service Composition. The 11th International Conference on Artificial Intelligence, Method-ologies, Systems.
11. Society for Neuroscience, http://big.sfn.org/NDG/site/