4/29/2012 1 An Overview of Smart Grid Issues An Overview of Smart Grid Issues Oregon Public Utility Commission Smart Grid Workshop September 9, 2009 Roger Levy, Lead Consultant Smart Grid Technical Advisory Project Charles Goldman, Program Manager Electricity Markets and Policy Group Lawrence Berkeley National Laboratory 4/29/2012 1 Smart Grid Technical Advisory Project
Transcript
4/29/2012
1
An Overview of Smart Grid IssuesAn Overview of Smart Grid Issues
Oregon Public Utility CommissionSmart Grid Workshop
September 9, 2009
Roger Levy, Lead Consultant Smart Grid Technical Advisory Project
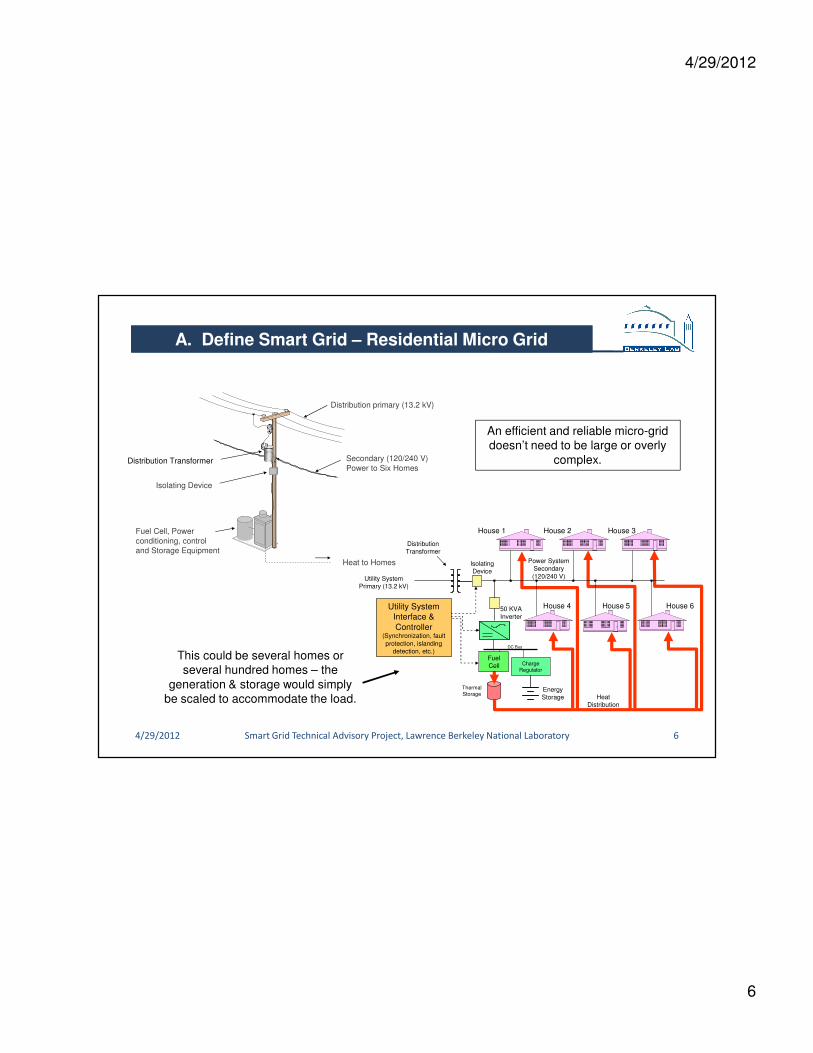
Fuel Cell, Power conditioning, control and Storage Equipment
Distribution primary (13.2 kV)
Secondary (120/240 V) Power to Six Homes
Heat to Homes
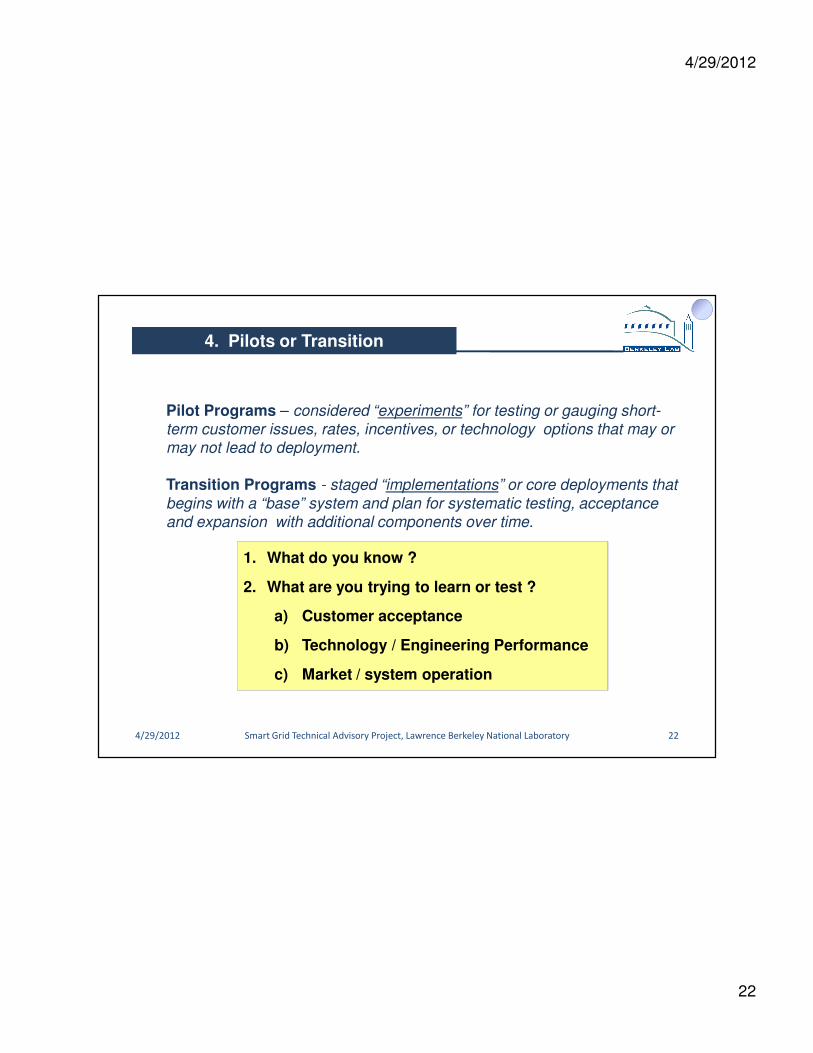
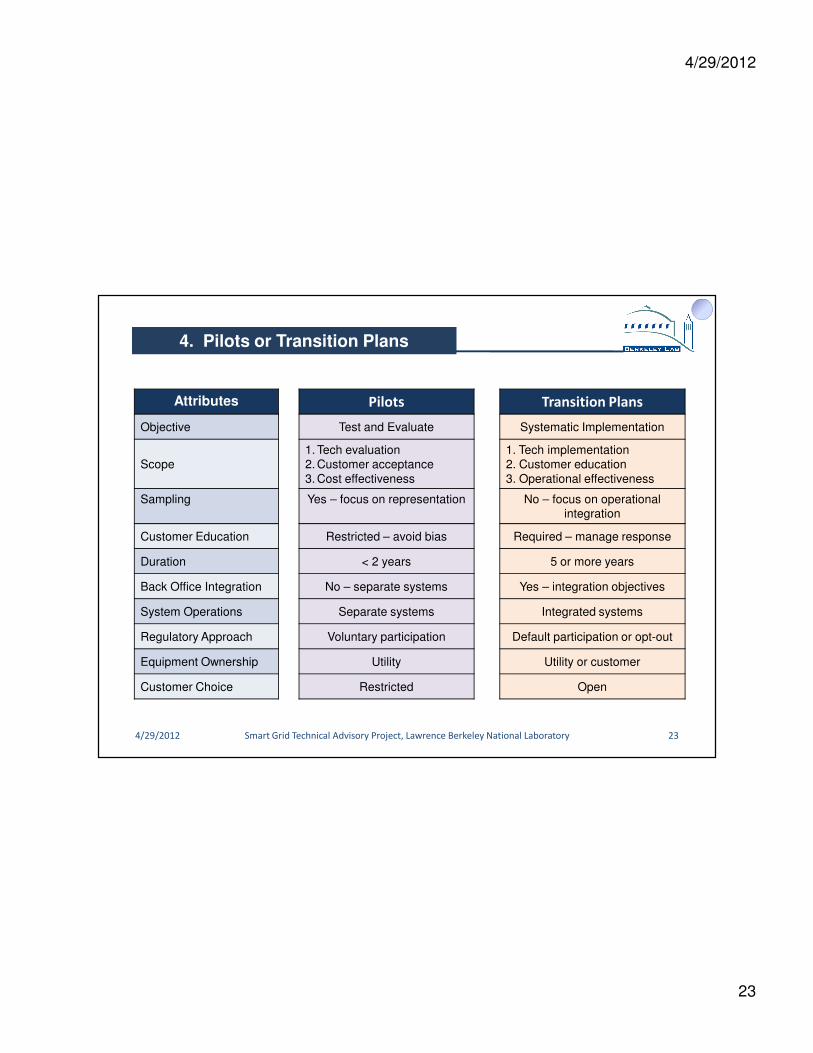
An efficient and reliable micro-grid doesn’t need to be large or overly
complex.
This could be several homes or several hundred homes – the
generation & storage would simply be scaled to accommodate the load.
4/29/2012 Smart Grid Technical Advisory Project, Lawrence Berkeley National Laboratory 6
4/29/2012
7
4/29/2012 Smart Grid Technical Advisory Project, Lawrence Berkeley National Laboratory 7
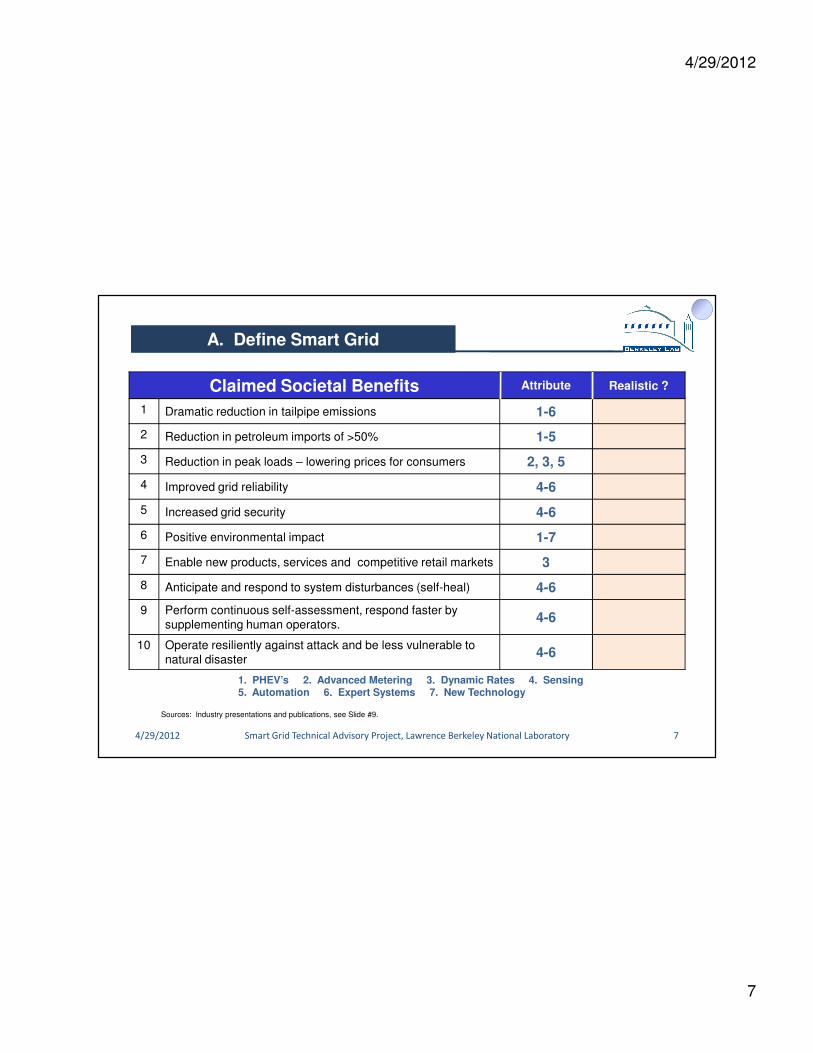
Claimed Societal Benefits Attribute Realistic ?
1 Dramatic reduction in tailpipe emissions 1-6
2 Reduction in petroleum imports of >50% 1-5
3 Reduction in peak loads – lowering prices for consumers 2, 3, 5
4 Improved grid reliability 4-6
5 Increased grid security 4-6
6 Positive environmental impact 1-7
7 Enable new products, services and competitive retail markets 3
8 Anticipate and respond to system disturbances (self-heal) 4-6
9 Perform continuous self-assessment, respond faster by supplementing human operators.
4-6
10 Operate resiliently against attack and be less vulnerable to natural disaster
4-6
1. PHEV’s 2. Advanced Metering 3. Dynamic Rates 4. Sensing 5. Automation 6. Expert Systems 7. New Technology
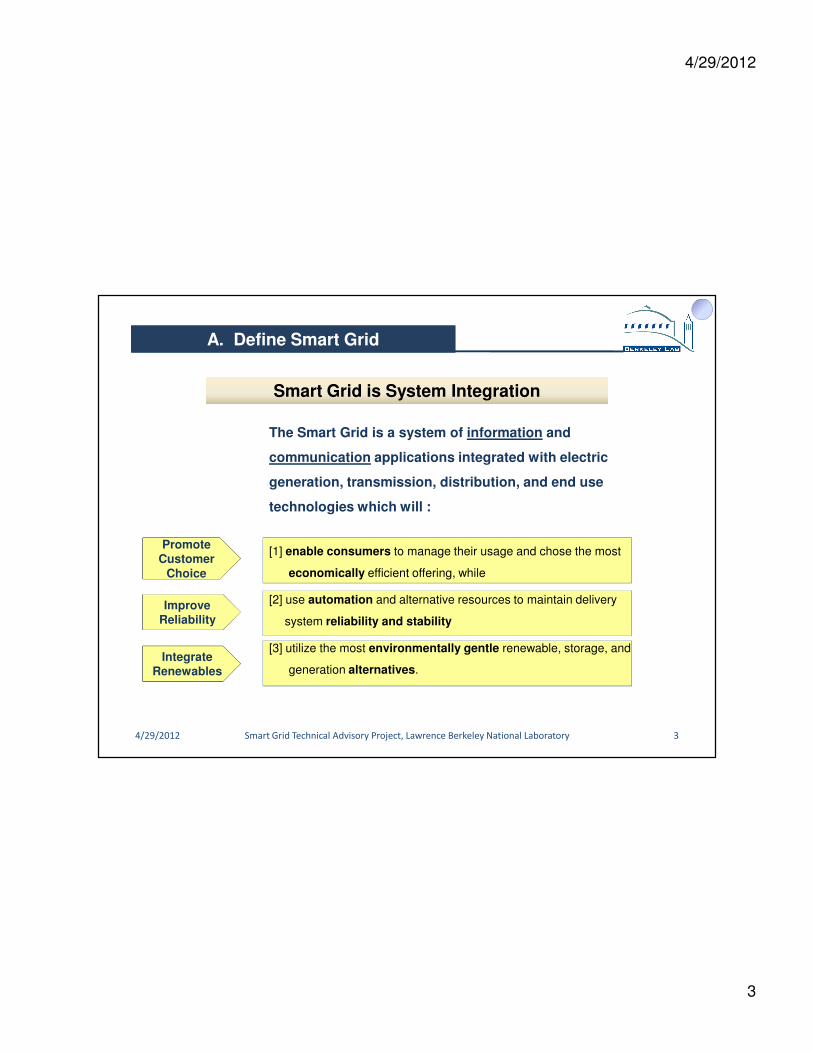
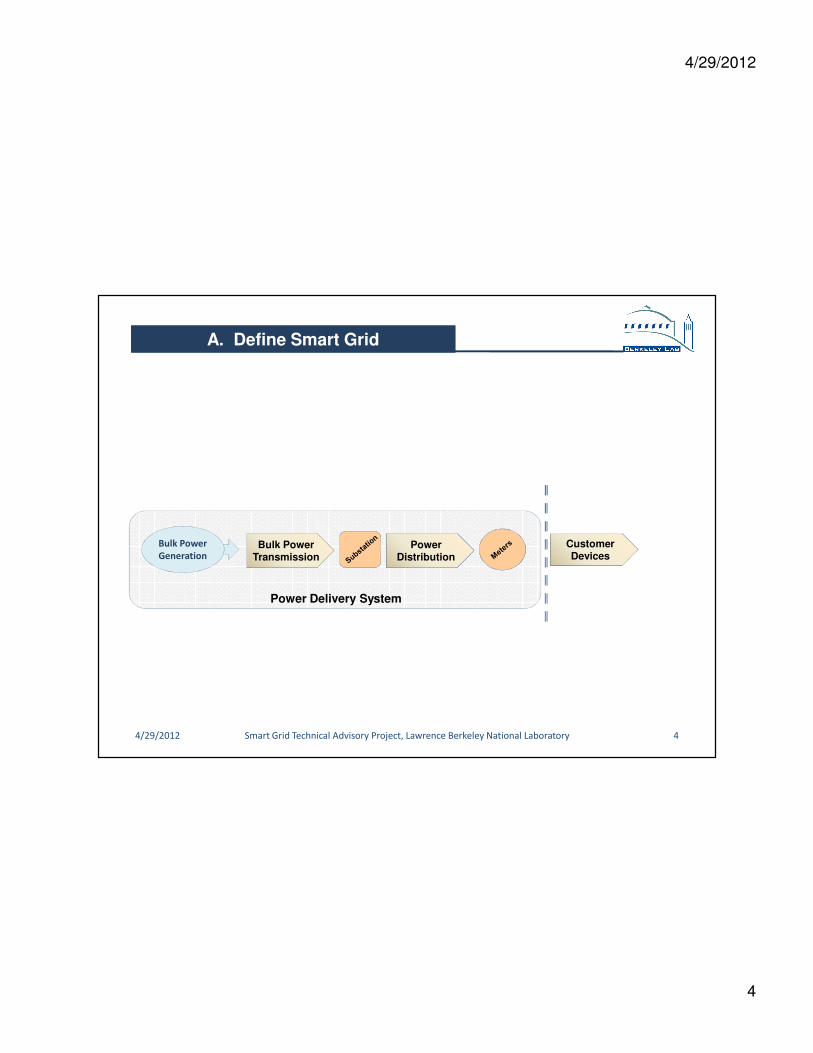
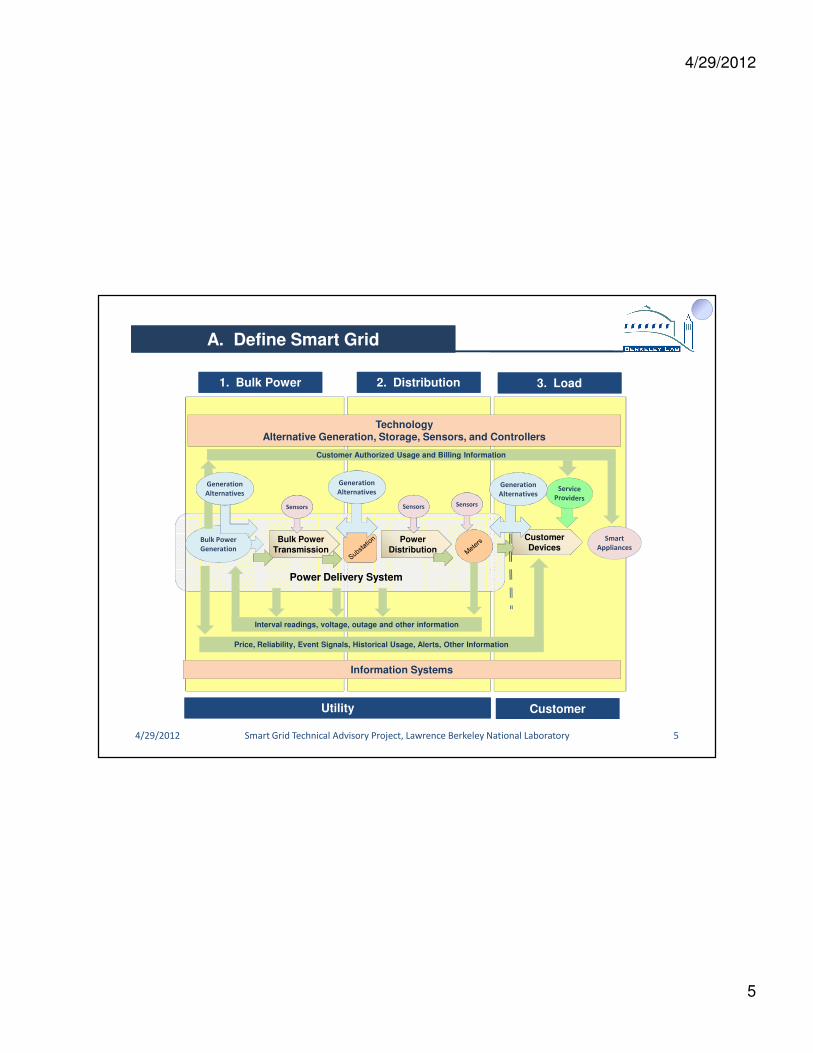
A. Define Smart GridA. Define Smart Grid
Sources: Industry presentations and publications, see Slide #9.
4/29/2012
8
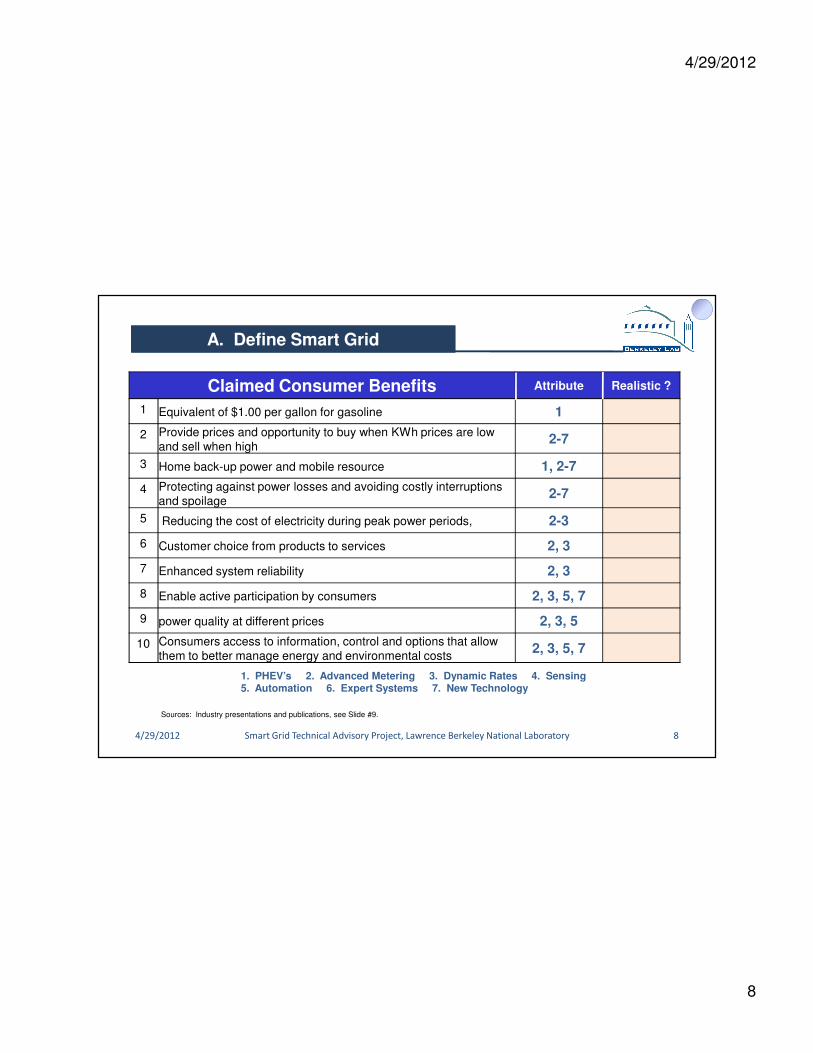
Claimed Consumer Benefits Attribute Realistic ?
1 Equivalent of $1.00 per gallon for gasoline 1
2 Provide prices and opportunity to buy when KWh prices are low and sell when high
2-7
3 Home back-up power and mobile resource 1, 2-7
4 Protecting against power losses and avoiding costly interruptions and spoilage
2-7
5 Reducing the cost of electricity during peak power periods, 2-3
6 Customer choice from products to services 2, 3
7 Enhanced system reliability 2, 3
8 Enable active participation by consumers 2, 3, 5, 7
9 power quality at different prices 2, 3, 5
10 Consumers access to information, control and options that allow them to better manage energy and environmental costs
2, 3, 5, 7
1. PHEV’s 2. Advanced Metering 3. Dynamic Rates 4. Sensing 5. Automation 6. Expert Systems 7. New Technology
4/29/2012 Smart Grid Technical Advisory Project, Lawrence Berkeley National Laboratory 8
A. Define Smart GridA. Define Smart Grid
Sources: Industry presentations and publications, see Slide #9.
4/29/2012
9
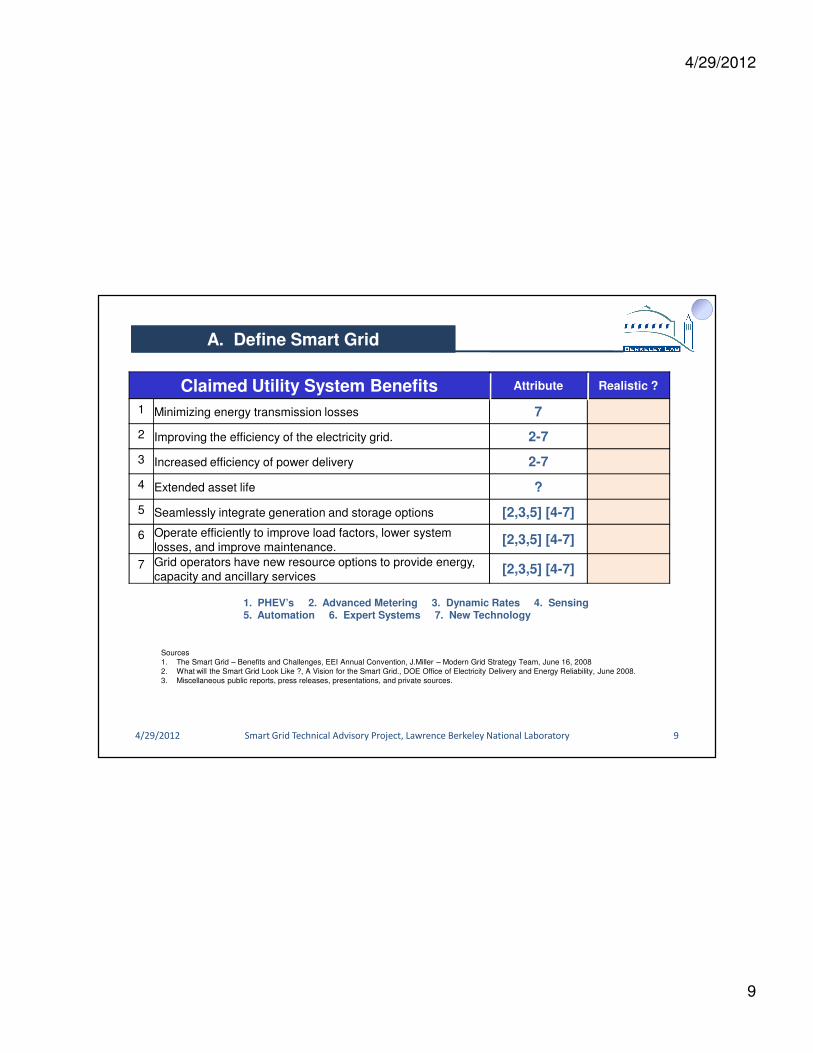
Claimed Utility System Benefits Attribute Realistic ?
1 Minimizing energy transmission losses 7
2 Improving the efficiency of the electricity grid. 2-7
3 Increased efficiency of power delivery 2-7
4 Extended asset life ?
5 Seamlessly integrate generation and storage options [2,3,5] [4-7]
6 Operate efficiently to improve load factors, lower system losses, and improve maintenance.
[2,3,5] [4-7]
7 Grid operators have new resource options to provide energy, capacity and ancillary services
[2,3,5] [4-7]
1. PHEV’s 2. Advanced Metering 3. Dynamic Rates 4. Sensing 5. Automation 6. Expert Systems 7. New Technology
4/29/2012 Smart Grid Technical Advisory Project, Lawrence Berkeley National Laboratory 9
A. Define Smart GridA. Define Smart Grid
Sources1. The Smart Grid – Benefits and Challenges, EEI Annual Convention, J.Miller – Modern Grid Strategy Team, June 16, 20082. What will the Smart Grid Look Like ?, A Vision for the Smart Grid., DOE Office of Electricity Delivery and Energy Reliability, June 2008.3. Miscellaneous public reports, press releases, presentations, and private sources.
4/29/2012
10
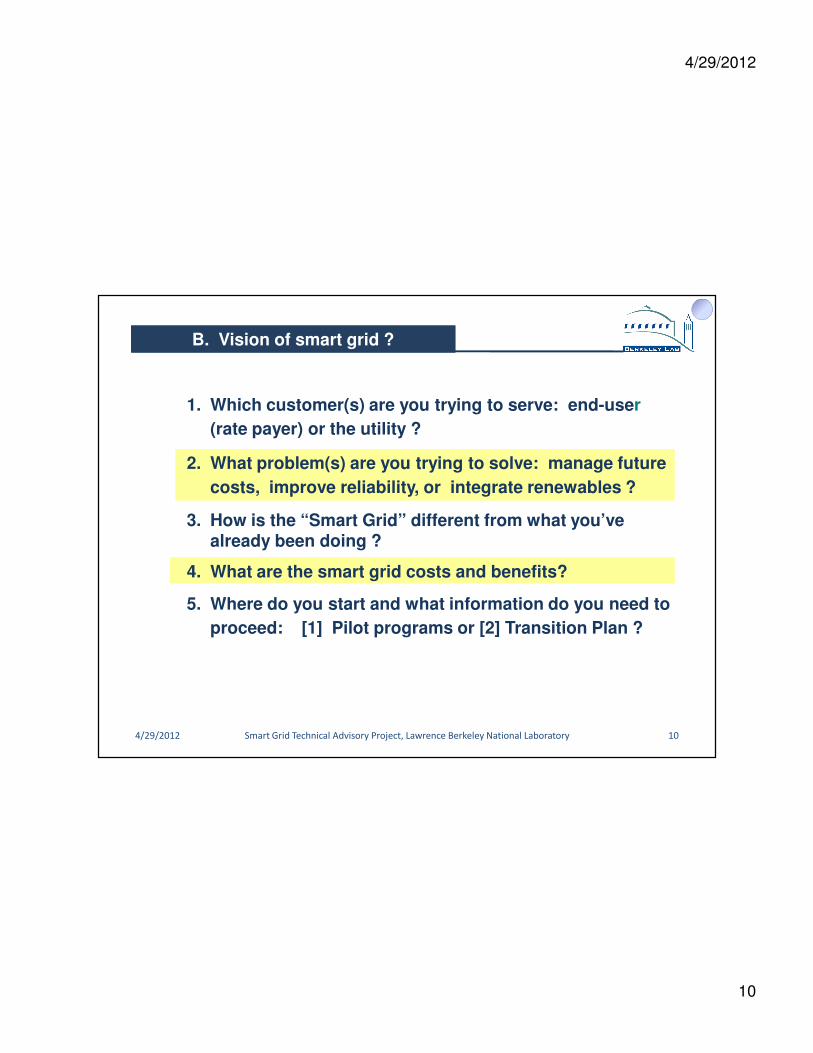
B. Vision of smart grid ?B. Vision of smart grid ?
1. Which customer(s) are you trying to serve: end-user
(rate payer) or the utility ?
2. What problem(s) are you trying to solve: manage future
costs, improve reliability, or integrate renewables ?
3. How is the “Smart Grid” different from what you’ve already been doing ?
4. What are the smart grid costs and benefits?
5. Where do you start and what information do you need to
proceed: [1] Pilot programs or [2] Transition Plan ?
4/29/2012 Smart Grid Technical Advisory Project, Lawrence Berkeley National Laboratory 10
4/29/2012 Smart Grid Technical Advisory Project, Lawrence Berkeley National Laboratory 16
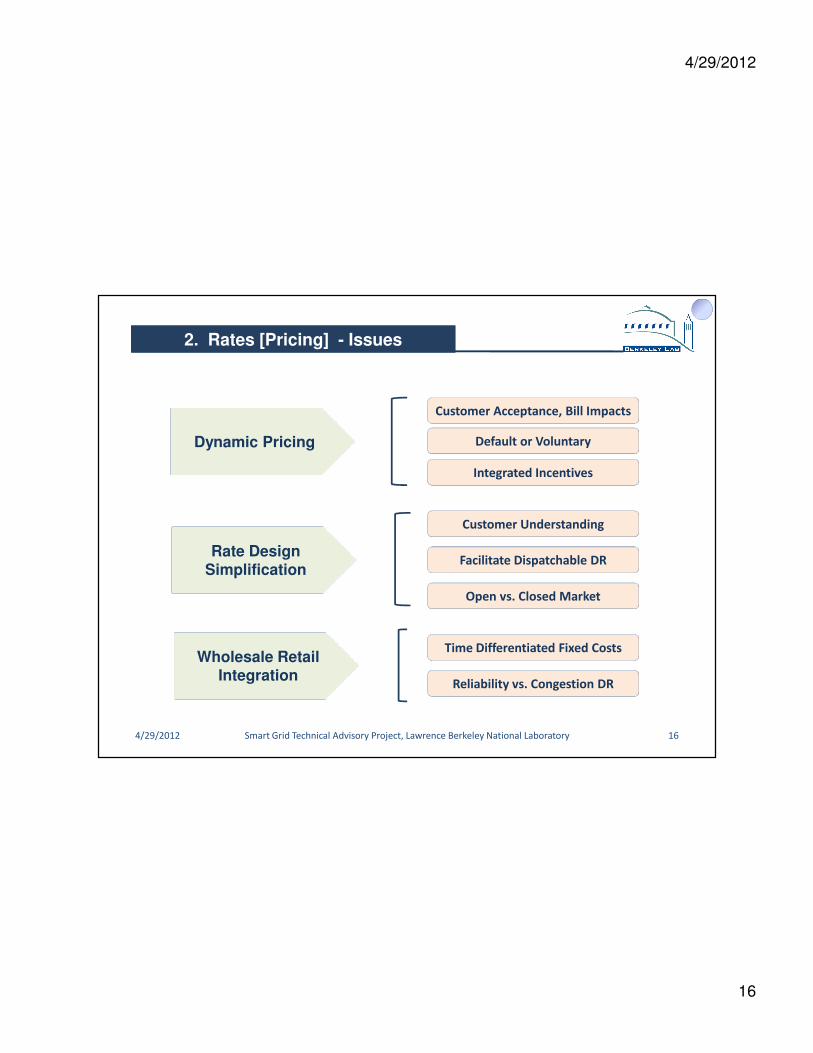
Dynamic PricingDynamic Pricing
Rate Design SimplificationRate Design
Simplification
Wholesale Retail Integration
Wholesale Retail Integration
Customer Understanding
Facilitate Dispatchable DR
Open vs. Closed Market
Customer Acceptance, Bill Impacts
Default or Voluntary
Integrated Incentives
Time Differentiated Fixed Costs
Reliability vs. Congestion DR
4/29/2012
17
• Interval metering provides data to support all rate forms.• Communication supports dynamic rate, outage
management, and customer information options.
• Dynamic rates (CPP, RTP) reflect system costs and support dispatchable economic and reliability options.
• Default, opt-out rates create a market for DR.• EE and DR implicit conditions of service for all customers• DR ubiquitous system wide• Expands and creates a market for customer ownership
and competitive equipment providers.
• Customer choice opens the market for competitive non-utility DR suppliers and service providers
• Customer value establishes technology options • Regulators establish: (1) Need for subsidies to
address market barriers, (2) Data models - to provide interoperability, and (3) Data ownership to address security and privacy
a
b
c
d
e
• Static rates do not reflect system costs or performance based rates / incentives.
g
• Voluntary, opt-in rates restrict the creation of open markets for DR and can significantly increase transaction costs for utility or ISO/RT programs.
• Limits ubiquity and value of DR.
h
• Direct control disincents customer ownership and restricts competitive equipment and service providers
i
• Utility establishes technology, value, and protocols.j
Default, opt-out
b. Dynamic
Interval & Communication
a
b
c
Metering
f. Cumulative
Rate FormStatic
Rate Participation
Voluntary, opt-in
Technology Guidance
Who Controls
DR
Utility
Customer
Open Market
TOU, Flat, Tiered
DR limited to:• Utility programs• Targeted end-uses• Voluntary participation• Participation payments• Utility owned equipment• Utility control strategies
Utility Specifies
Technology
Customer Specifies
Technology
Limited Market
Price Response
Direct Control
Expanded Direct Control
h
i
j
g
d
e
4/29/2012 Smart Grid Technical Advisory Project, Lawrence Berkeley National Laboratory 17
2. Rates and Pricing - Tradeoffs2. Rates and Pricing - Tradeoffs
4/29/2012
18
1 2 3 4 5 6
Under some utility demand response programs, customers often can participate in only one option at a time.Under some utility demand response programs, customers often can participate in only one option at a time.
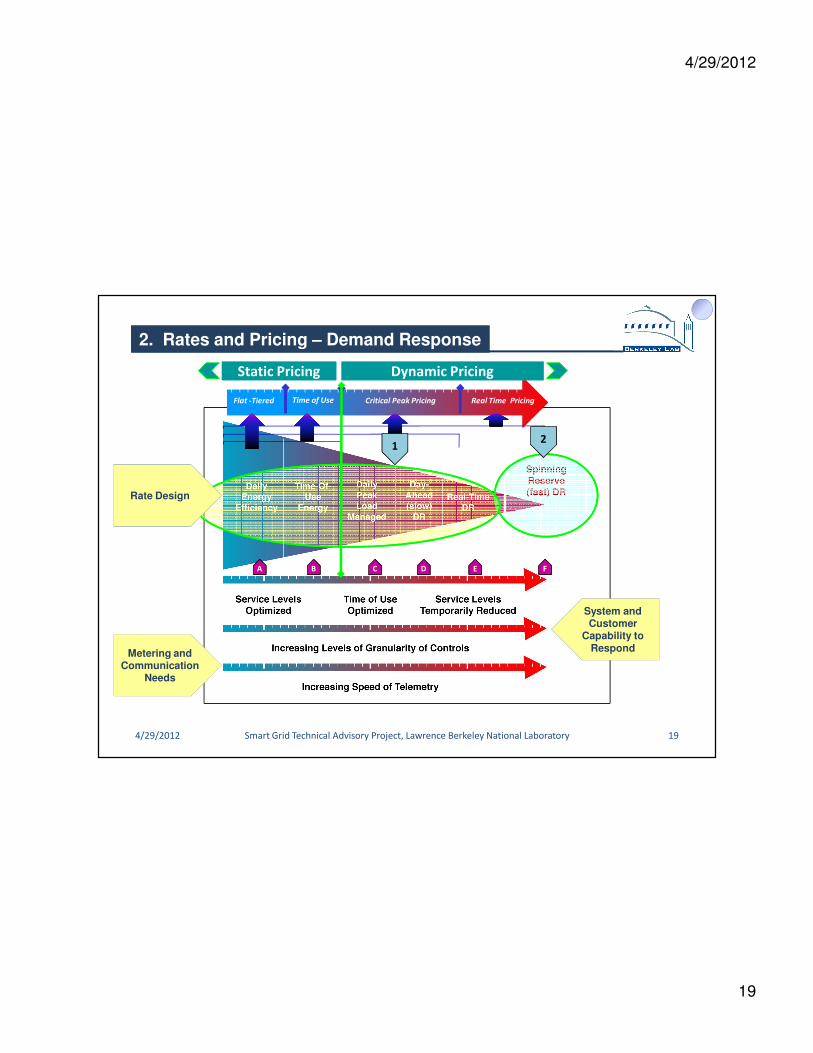
2. Rates and Pricing – Demand Response2. Rates and Pricing – Demand Response
4/29/2012 Smart Grid Technical Advisory Project, Lawrence Berkeley National Laboratory 18
4/29/2012
19
Flat -Tiered Time of Use Critical Peak Pricing Real Time Pricing
o Horizontally Integratedo Customer owns equipmento Third party installationo Customer / Third party maintains o Customer controls
Control Signals
Interoperability is a
regulatory issue.Interoperability is a
regulatory issue.Interoperability is a
market issue.Interoperability is a
market issue.
Price, Event Signals
5. Standards: Interoperability and Data Models5. Standards: Interoperability and Data Models
Data
Model
4/29/2012 Smart Grid Technical Advisory Project, Lawrence Berkeley National Laboratory 25
4/29/2012
26
Utility LSE
Demand Response Event and
Price Server
Price[Reliability and Event Signals]
Re
ce
ive
rCustomer
Owned Automated Controls
[EMS, PCT, HA]
Data Model
•“Tendril Achieves First Open ADR Compliant Platform”, January 29, 2009, http://www.tendrilinc.com/2009/01/tendril-achieves-first-open-adr-compliant-platform-2/
Rate Design
4/29/2012 Smart Grid Technical Advisory Project, Lawrence Berkeley National Laboratory 26
5. Standards: Interoperability and Data Models5. Standards: Interoperability and Data Models
“The OpenADR standard outlines specific communication models that use the Internet to
send DR signals to end-use customer systems. The standard, initially developed for
commercial and industrial applications, may be leveraged in residential settings to
reduce cost, promote interoperability among DR technologies and allow utilities and
energy providers to better manage pricing and critical load issues while actively


![[Smart Grid Market Research] India: Smart Grid Legacy, Zpryme Smart Grid Insights, September 2011](https://static.documents.pub/doc/80x56/541402518d7f7294698b47d4/smart-grid-market-research-india-smart-grid-legacy-zpryme-smart-grid-insights-september-2011.jpg)


![[Smart Grid Market Research] The Optimized Grid - Zpryme Smart Grid Insights](https://static.documents.pub/doc/80x56/541402188d7f7294698b47d2/smart-grid-market-research-the-optimized-grid-zpryme-smart-grid-insights.jpg)


