25
An Overview of the 2008 Financial Crisis (the perspective of an electrical engineer on Wall Street) 1 Samir Padalkar PhD, [email protected]
| Date post: | 11-Jan-2016 |
| Category: |
Documents |
| Upload: | malcolm-parks |
| View: | 232 times |
| Download: | 0 times |
An Overview of the 2008 Financial Crisis
(the perspective of an electrical engineer on Wall Street)
1
Samir Padalkar PhD, [email protected]
Roadmap
• Real Estate Bubble• Security Definitions• CDO Issues• Rating Agencies, FNMA, FHLMC, AIG• Federal Reserve• 2000 Internet Bubble Comparison• Where are we today
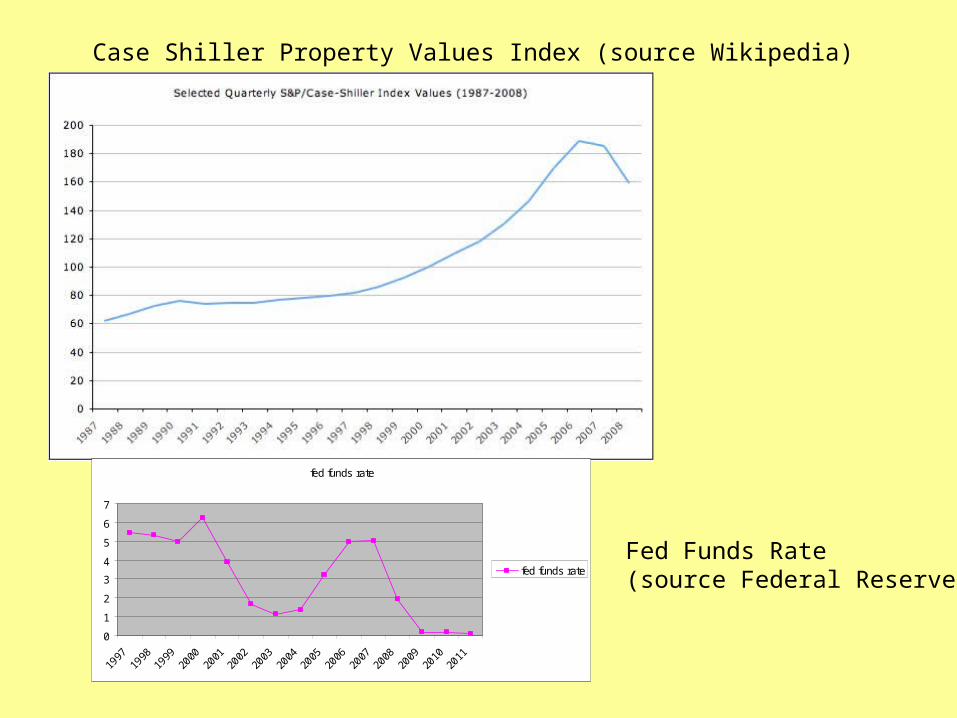
Case Shiller Property Values Index (source Wikipedia)
fed funds rate
0
1
2
3
4
5
6
7
1997
1998
1999
2000
2001
2002
2003
2004
2005
2006
2007
2008
2009
2010
2011
fed funds rateFed Funds Rate(source Federal Reserve)

mortgage$200k
6%30 years
mortgage$250K6.5%
30 years
MBS 6 %
weighted avg coupon,
30 yearweighted averagematurity
MORTGAGE BACKED SECURITY (MBS)
4
Several individual mortgages are packaged into one securityMBS has a Weighted Avg. Coupon & Weighted Avg. MaturityMortgages made to Prime customers ended up being securitizedBy FNMA & FHLMCMortgages made to Subprime customers ended up being securitizedby Private Banks
MBS6%
30 years
MBS6.5%
30 years
SeniorAAA70%
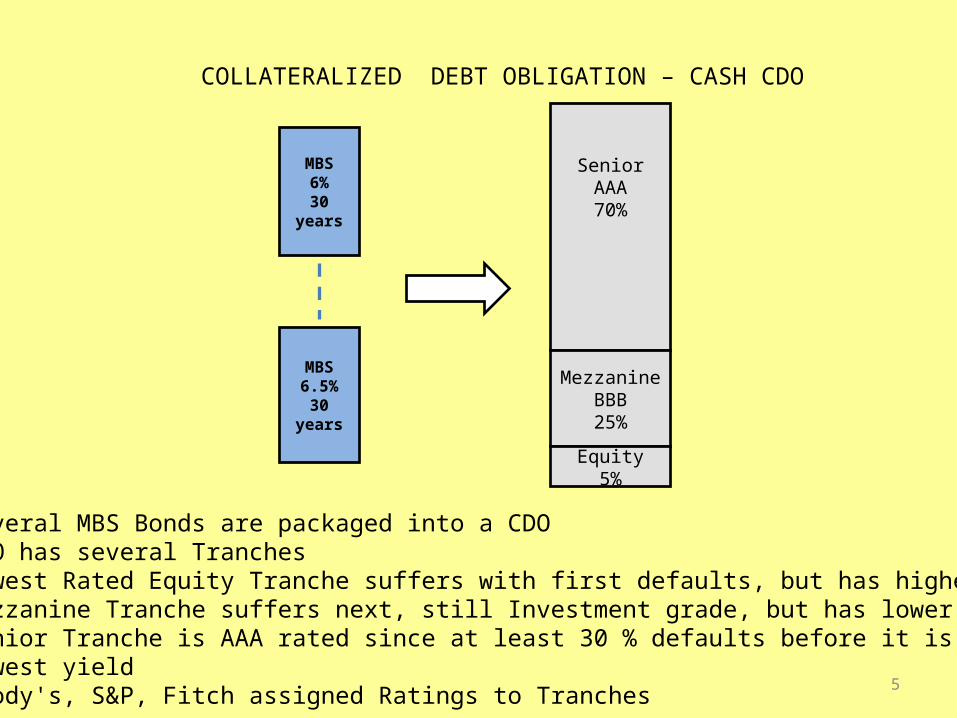
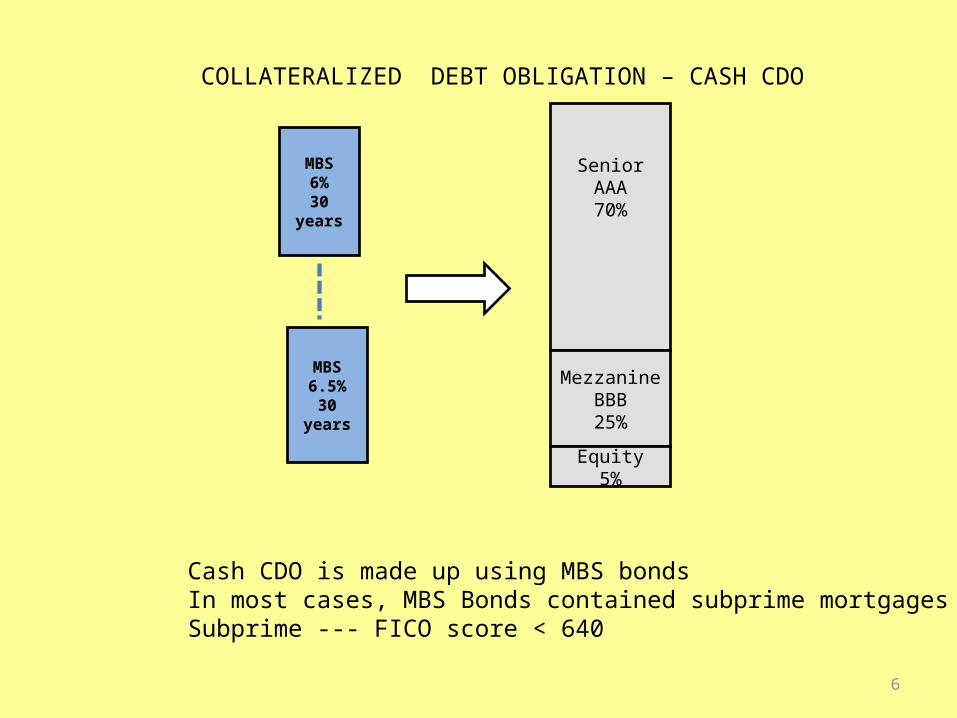
COLLATERALIZED DEBT OBLIGATION – CASH CDO
Mezzanine BBB25%
Equity5%
5
Several MBS Bonds are packaged into a CDOCDO has several TranchesLowest Rated Equity Tranche suffers with first defaults, but has highest yieldMezzanine Tranche suffers next, still Investment grade, but has lower yieldSenior Tranche is AAA rated since at least 30 % defaults before it is affected, lowest yieldMoody's, S&P, Fitch assigned Ratings to Tranches
MBS6%
30 years
MBS6.5%
30 years
SeniorAAA70%
COLLATERALIZED DEBT OBLIGATION – CASH CDO
Mezzanine BBB25%
Equity5%
6
Cash CDO is made up using MBS bondsIn most cases, MBS Bonds contained subprime mortgagesSubprime --- FICO score < 640
CDS BUYER
CDSSELLER
Reference MBS
Premium
Face Value upon default
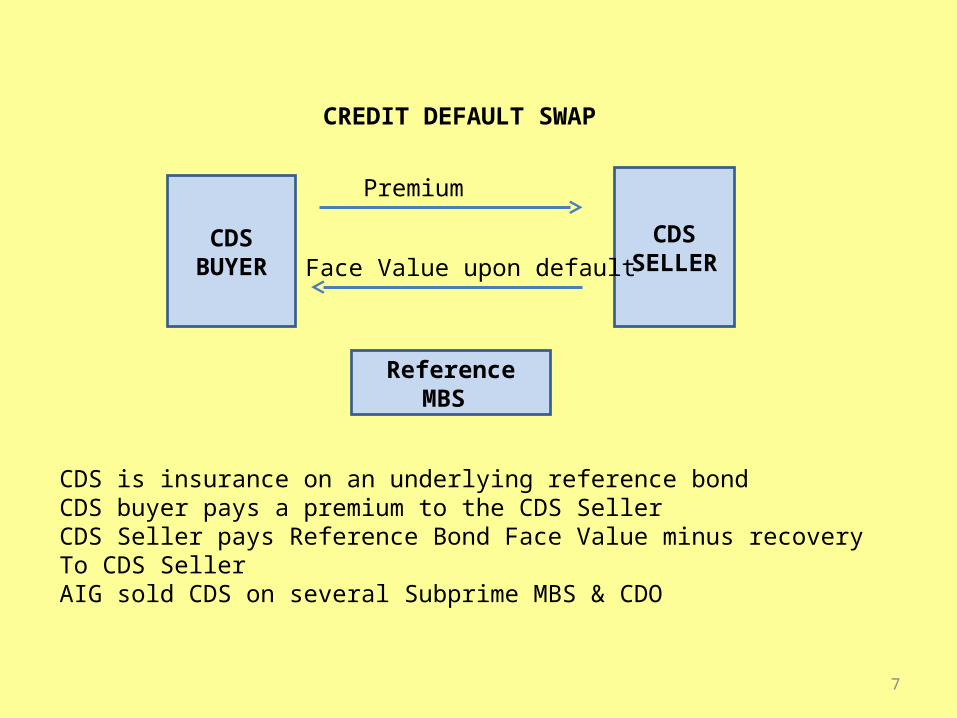
CREDIT DEFAULT SWAP
7
CDS is insurance on an underlying reference bondCDS buyer pays a premium to the CDS SellerCDS Seller pays Reference Bond Face Value minus recoveryTo CDS SellerAIG sold CDS on several Subprime MBS & CDO

CDS6%
30 years
CDS6.5%
30 years
SeniorAAA70%
COLLATERALIZED DEBT OBLIGATION – SYNTHETIC CDO
Mezzanine BBB25%
Equity5%
8
Simpler to create than Cash CDO, since actual MBS bondsAre not requiredMortgage Bubble even more inflated by such securities

Senior 70% Senior 70%
Mezz 25%Mezz 25%
Equity 5%Equity 5%
Senior70%
Equity5%
Senior70%
Equity 5%
Senior70%
Equity 5%
Senior 70%
Mezz 25%Mezz 25%
Equity 5%
Mezz 25%Mezz 25%Mezz 25%Mezz 25%Mezz 25%Mezz 25%
CDO SQUARED
9Mezzanine Tranche difficult to sell, so 4 such tranches make up a CDO^2

Senior 70% Senior 70%
Equity 5%Equity 5%
Senior70%
Equity5%Equity5%
Senior70%
Equity 5%Equity 5%
Senior70%
Equity 5%Equity 5%
Senior 70%
Mezz 25%Mezz 25%
Equity 5%Equity 5%
Mezz 25%Mezz 25%Mezz 25%Mezz 25%Mezz 25%Mezz 25%
CDO SQUARED– 10 % DEFAULT
Mezz 25 %Mezz 25 %
1010 % default results in 20 % default in CDO^2, Equity wiped out,Mezzanine suffers 15 % wipe-out out of 25 %
Mezz 25%Mezz 25%

Senior 70% Senior 70% 2%2%
Equity 5%Equity 5%
Senior70%
Equity5%Equity5%
Senior70%
Equity 5%Equity 5%
Senior70%
Equity 5%Equity 5%
Senior 70%
Mezz 25%Mezz 25%
Equity 5%Equity 5%
Mezz 25%Mezz 25%Mezz 25%Mezz 25%Mezz 25%Mezz 25%
CDO SQUARED– 13 % DEFAULT
Mezz 25%Mezz 25%
8%8%8%8% 8%8%8%8%
11
13 % defaults results in defaults in AAA Senior Tranche of CDO^2
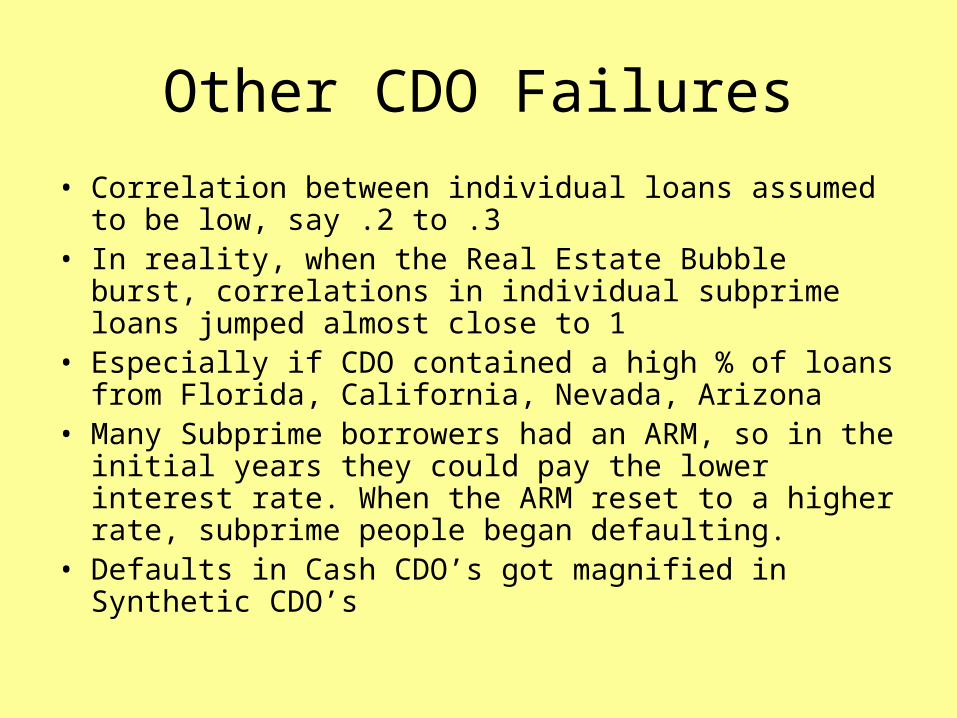
Other CDO Failures• Correlation between individual loans assumed to be low,
say .2 to .3• In reality, when the Real Estate Bubble burst, correlations in
individual subprime loans jumped almost close to 1• Especially if CDO contained a high % of loans from Florida,
California, Nevada, Arizona• Many Subprime borrowers had an ARM, so in the initial years
they could pay the lower interest rate. When the ARM reset to a higher rate, subprime people began defaulting.
• Defaults in Cash CDO’s got magnified in Synthetic CDO’s

CDO Pricing
• Gaussian Copula• Monte Carlo Simulation
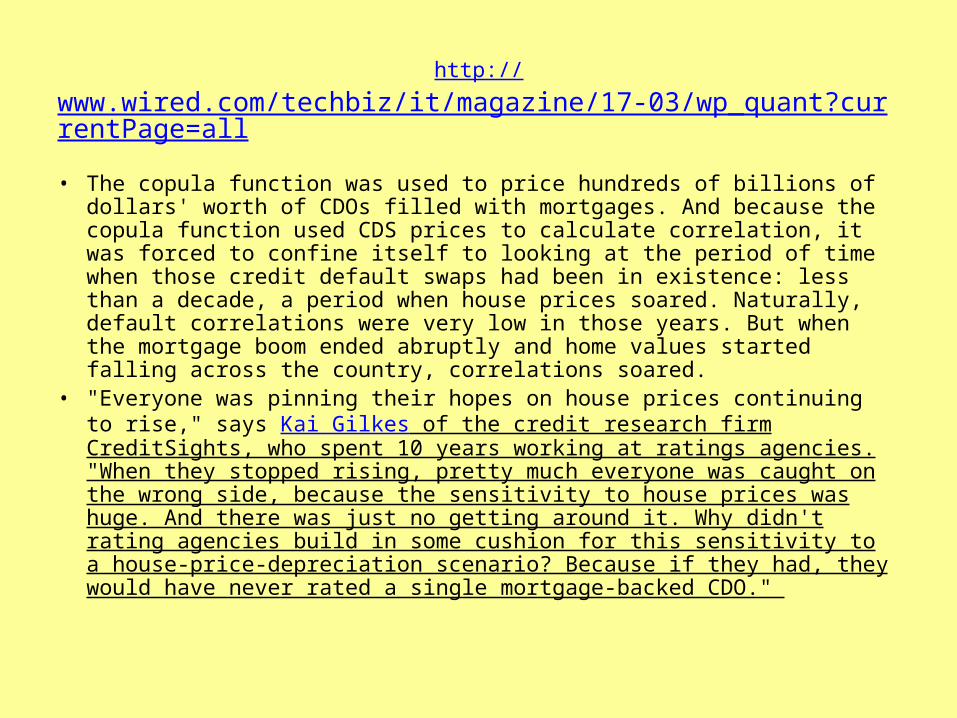
http://www.wired.com/techbiz/it/magazine/17-03/wp_quant?currentPage=all
• The copula function was used to price hundreds of billions of dollars' worth of CDOs filled with mortgages. And because the copula function used CDS prices to calculate correlation, it was forced to confine itself to looking at the period of time when those credit default swaps had been in existence: less than a decade, a period when house prices soared. Naturally, default correlations were very low in those years. But when the mortgage boom ended abruptly and home values started falling across the country, correlations soared.
• "Everyone was pinning their hopes on house prices continuing to rise," says Kai Gilkes of the credit research firm CreditSights, who spent 10 years working at ratings agencies. "When they stopped rising, pretty much everyone was caught on the wrong side, because the sensitivity to house prices was huge. And there was just no getting around it. Why didn't rating agencies build in some cushion for this sensitivity to a house-price-depreciation scenario? Because if they had, they would have never rated a single mortgage-backed CDO."
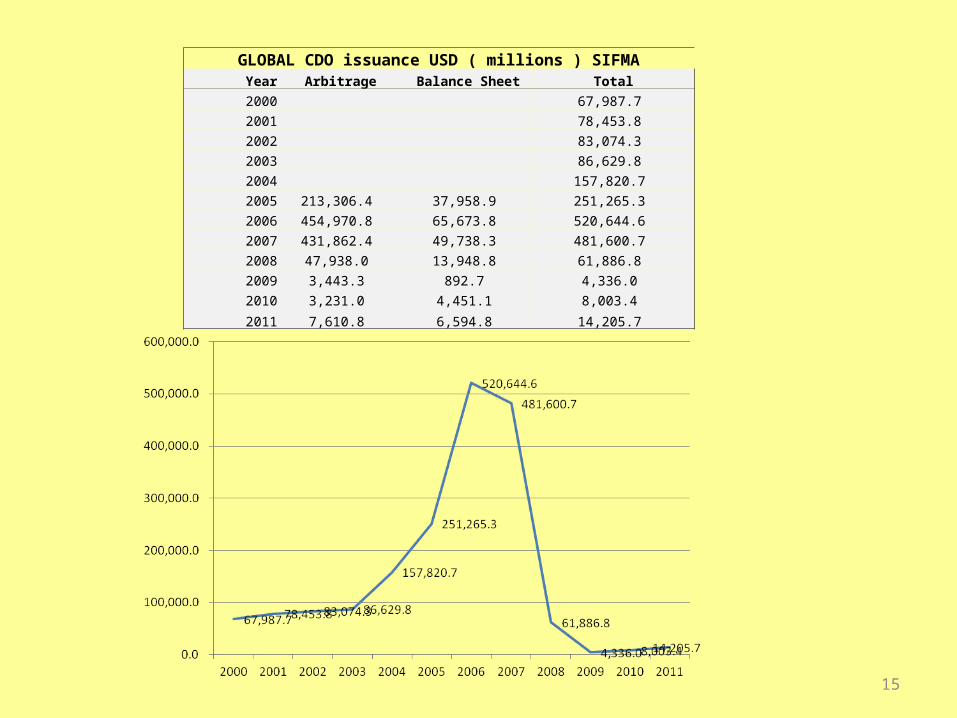
GLOBAL CDO issuance USD ( millions ) SIFMAYear Arbitrage Balance Sheet Total
2000 67,987.7
2001 78,453.8
2002 83,074.3
2003 86,629.8
2004 157,820.7
2005 213,306.4 37,958.9 251,265.3
2006 454,970.8 65,673.8 520,644.6
2007 431,862.4 49,738.3 481,600.7
2008 47,938.0 13,948.8 61,886.8
2009 3,443.3 892.7 4,336.0
2010 3,231.0 4,451.1 8,003.4
2011 7,610.8 6,594.8 14,205.7
15

Federal Reserve Response
• Almost 0 Fed Funds Rate• Massive Quantitative Easing• Balance Sheet Jan 2008 = 943 Billion• Balance Sheet Jan 2009 = 2298 Billion (2.3
Trillion)• Balance Sheet Jan 2012 = 2964 Billion (nearly
3 Trillion)
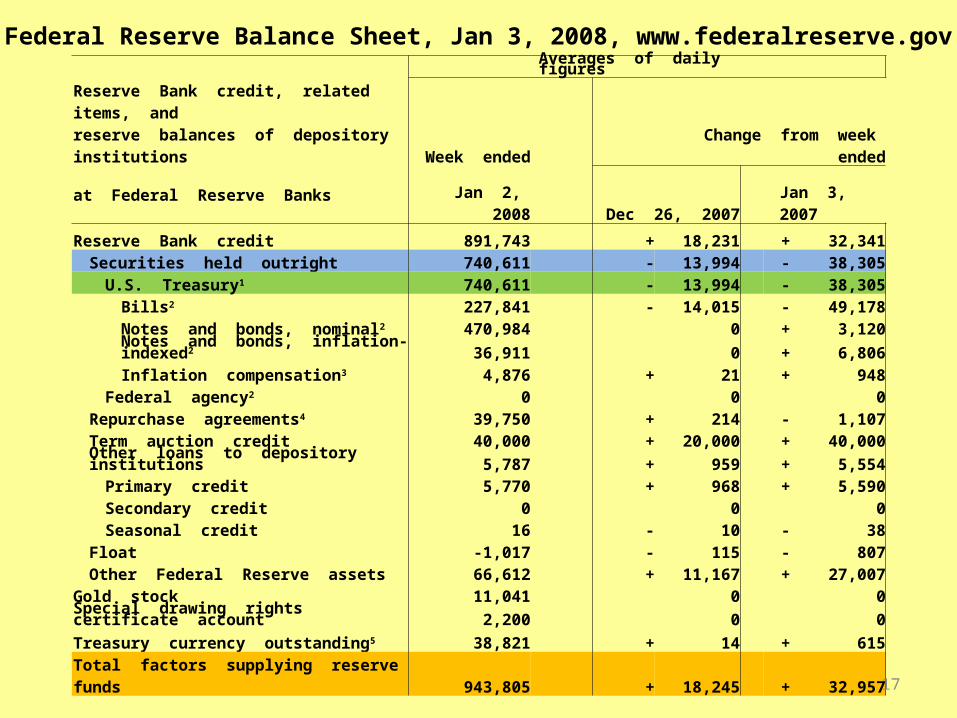
Reserve Bank credit, related items, andAverages of daily figures
Change from week endedreserve balances of depository institutions Week ended
at Federal Reserve BanksJan 2, 2008 Dec 26, 2007 Jan 3, 2007
Reserve Bank credit 891,743 + 18,231 + 32,341Securities held outright 740,611 - 13,994 - 38,305
U.S. Treasury1 740,611 - 13,994 - 38,305Bills2 227,841 - 14,015 - 49,178Notes and bonds, nominal2 470,984 0 + 3,120Notes and bonds, inflation-indexed2 36,911 0 + 6,806Inflation compensation3 4,876 + 21 + 948
Federal agency2 0 0 0Repurchase agreements4 39,750 + 214 - 1,107Term auction credit 40,000 + 20,000 + 40,000Other loans to depository institutions 5,787 + 959 + 5,554
Primary credit 5,770 + 968 + 5,590Secondary credit 0 0 0Seasonal credit 16 - 10 - 38
Float -1,017 - 115 - 807Other Federal Reserve assets 66,612 + 11,167 + 27,007
Gold stock 11,041 0 0Special drawing rights certificate account 2,200 0 0
Treasury currency outstanding5 38,821 + 14 + 615
Total factors supplying reserve funds 943,805 + 18,245 + 32,957
Federal Reserve Balance Sheet, Jan 3, 2008, www.federalreserve.gov
17

Reserve Bank credit, related items, and reserve balances (millions of dollars) of depository institutions at Federal reserve banks
Averages of daily figures
Change from week endedWeek ended
Dec 31, 2008 Dec 24, 2008 Jan 2, 2008
Reserve Bank credit 2,246,527 + 39,255 +1,354,752Securities held outright 496,227 + 233 - 244,384
U.S. Treasury1 475,961 - 106 - 264,650Repurchase agreements4 80,000 0 + 40,250Term auction credit 450,219 + 29,413 + 410,219Other loans 187,770 - 9,098 + 181,983Net portfolio holdings of Commercial Paper
Funding Facility LLC7 332,410 + 6,614 + 332,410
Net portfolio holdings of LLCs funded through themoney market investor funding facility8 0 0 0
Net portfolio holdings of Maiden Lane LLC9 26,974 + 56 + 26,974Net portfolio holdings of Maiden Lane II LLC10 20,059 + 26 + 20,059
Net portfolio holdings of Maiden Lane III LLC11 27,990 - 95 + 27,990Float -862 + 305 + 166Other Federal Reserve assets 625,741 + 11,802 + 559,086
Gold stock 11,041 0 0Special drawing rights certificate account 2,200 0 0Treasury currency outstanding12 38,857 + 14 + 176Total factors supplying reserve funds 2,298,625 + 39,269 +1,354,928
Federal Reserve Balance Sheet, Jan 2, 2009, www.federalreserve.gov
18
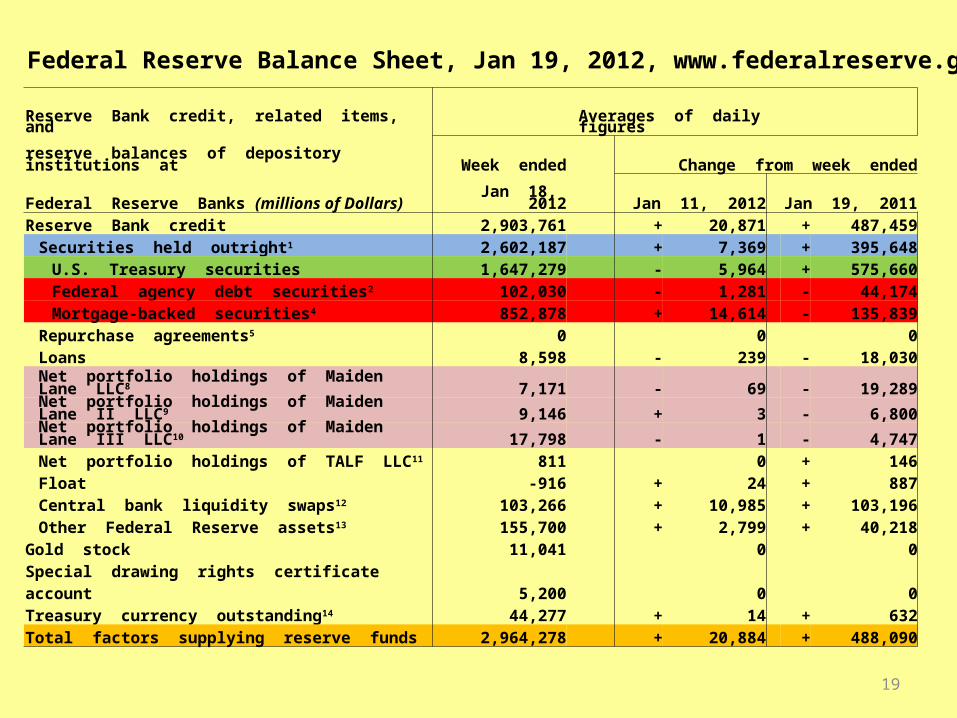
Reserve Bank credit, related items, andAverages of daily figures
reserve balances of depository institutions at Week ended Change from week ended
Federal Reserve Banks (millions of Dollars) Jan 18, 2012 Jan 11, 2012 Jan 19, 2011Reserve Bank credit 2,903,761 + 20,871 + 487,459
Securities held outright1 2,602,187 + 7,369 + 395,648U.S. Treasury securities 1,647,279 - 5,964 + 575,660Federal agency debt securities2 102,030 - 1,281 - 44,174Mortgage-backed securities4 852,878 + 14,614 - 135,839
Repurchase agreements5 0 0 0Loans 8,598 - 239 - 18,030
Net portfolio holdings of Maiden Lane LLC8 7,171 - 69 - 19,289Net portfolio holdings of Maiden Lane II LLC9 9,146 + 3 - 6,800Net portfolio holdings of Maiden Lane III LLC10 17,798 - 1 - 4,747Net portfolio holdings of TALF LLC11 811 0 + 146Float -916 + 24 + 887Central bank liquidity swaps12 103,266 + 10,985 + 103,196Other Federal Reserve assets13 155,700 + 2,799 + 40,218
Gold stock 11,041 0 0Special drawing rights certificate account 5,200 0 0Treasury currency outstanding14 44,277 + 14 + 632Total factors supplying reserve funds 2,964,278 + 20,884 + 488,090
Federal Reserve Balance Sheet, Jan 19, 2012, www.federalreserve.gov
19
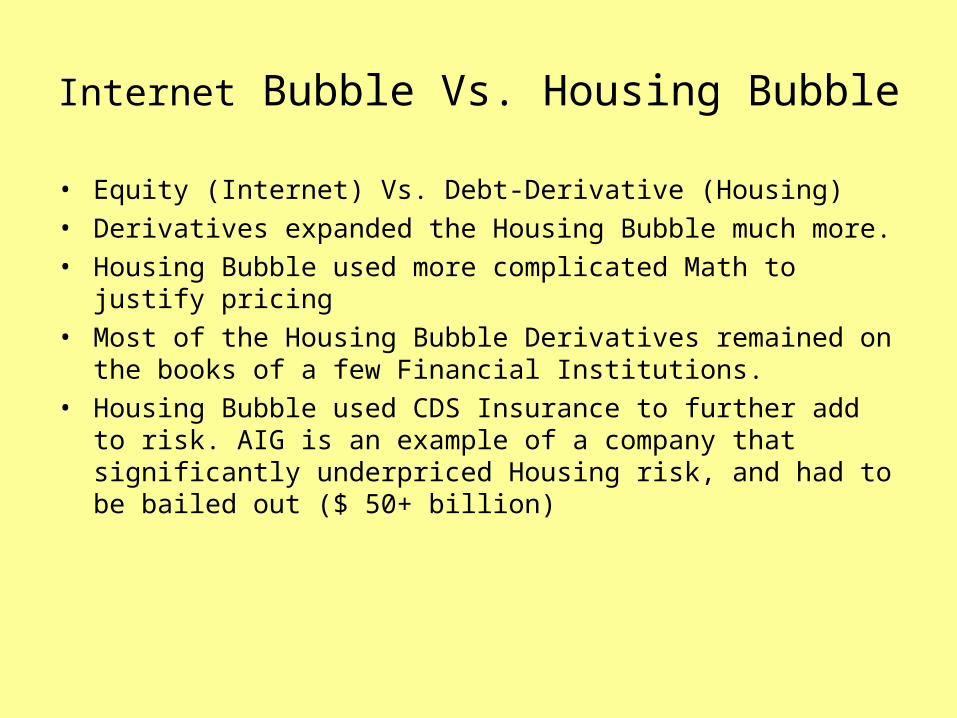
Internet Bubble Vs. Housing Bubble
• Equity (Internet) Vs. Debt-Derivative (Housing)• Derivatives expanded the Housing Bubble much more.• Housing Bubble used more complicated Math to justify pricing• Most of the Housing Bubble Derivatives remained on the books of a few
Financial Institutions.• Housing Bubble used CDS Insurance to further add to risk. AIG is an
example of a company that significantly underpriced Housing risk, and had to be bailed out ($ 50+ billion)
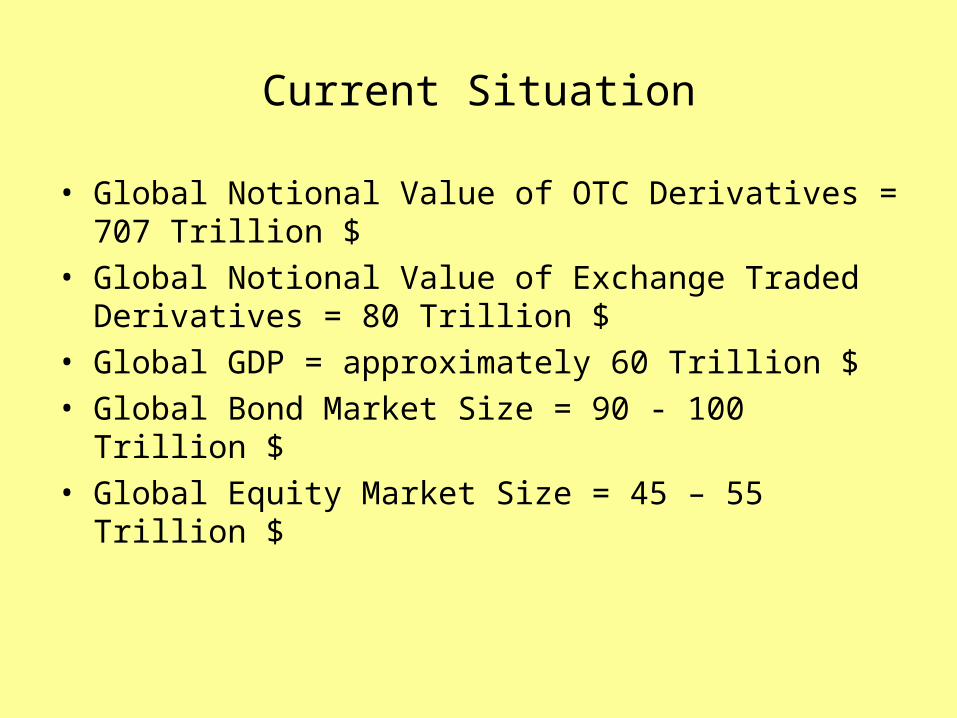
Current Situation
• Global Notional Value of OTC Derivatives = 707 Trillion $• Global Notional Value of Exchange Traded Derivatives = 80
Trillion $• Global GDP = approximately 60 Trillion $• Global Bond Market Size = 90 - 100 Trillion $• Global Equity Market Size = 45 – 55 Trillion $

Table 23A: Derivative financial instruments traded on organized exchangesBy instrument and locationNotional principal in billions of US dollars
Amounts outstanding Turnover
Instrument / location Dec 2009 Dec 2010 Jun 2011 Sep 2011 2009 2010
FuturesAll markets 21,738.1 22,312.0 30,335.3 26,313.4 1,126,519.2 1,380,538.9
Interest rate 20,627.7 21,013.4 28,933.0 24,999.2 1,016,361.6 1,235,907.4Currency 144.3 170.2 205.3 204.5 24,598.7 35,771.2Equity index 966.1 1,128.4 1,197.0 1,109.8 85,558.8 108,860.3
North America 10,720.9 11,863.5 16,523.8 14,309.6 599,025.0 729,195.9Interest rate 10,284.9 11,351.1 15,966.1 13,781.4 543,950.8 658,193.5Currency 90.7 114.8 128.9 123.9 19,606.8 28,649.0
Equity index 345.3 397.6 428.8 404.4 35,467.4 42,353.4Europe 8,053.6 6,345.3 8,933.5 7,981.1 449,389.8 533,297.9
Interest rate 7,608.7 5,816.6 8,373.4 7,453.9 420,030.6 498,836.1Currency 2.7 2.5 2.9 2.8 78.8 255.2Equity index 442.1 526.1 557.2 524.4 29,280.4 34,206.5
OptionsAll markets 51,379.6 45,634.6 52,507.6 54,207.7 533,634.9 606,661.8
Interest rate 46,428.7 40,930.0 47,105.0 49,080.7 434,601.0 468,872.0Currency 147.3 144.2 183.6 119.0 1,980.3 3,048.5Equity index 4,803.5 4,560.3 5,218.9 5,008.0 97,053.6 134,741.3
North America 23,874.9 24,353.4 28,868.2 28,162.5 216,390.4 261,543.9Interest rate 21,817.7 22,070.2 26,154.6 25,585.7 188,438.5 225,342.9Currency 65.3 72.3 61.8 77.4 657.5 1,600.9Equity index 1,991.9 2,210.9 2,651.8 2,499.5 27,294.3 34,600.2
Europe 26,322.6 19,247.2 21,641.0 24,504.6 258,556.9 251,485.3Interest rate 23,905.0 17,320.8 19,546.9 22,460.5 240,483.9 233,930.0Currency 0.3 0.3 0.2 0.2 7.7 5.1Equity index 2,417.2 1,926.1 2,093.8 2,043.9 18,065.4 17,550.2
Source- BIS
22
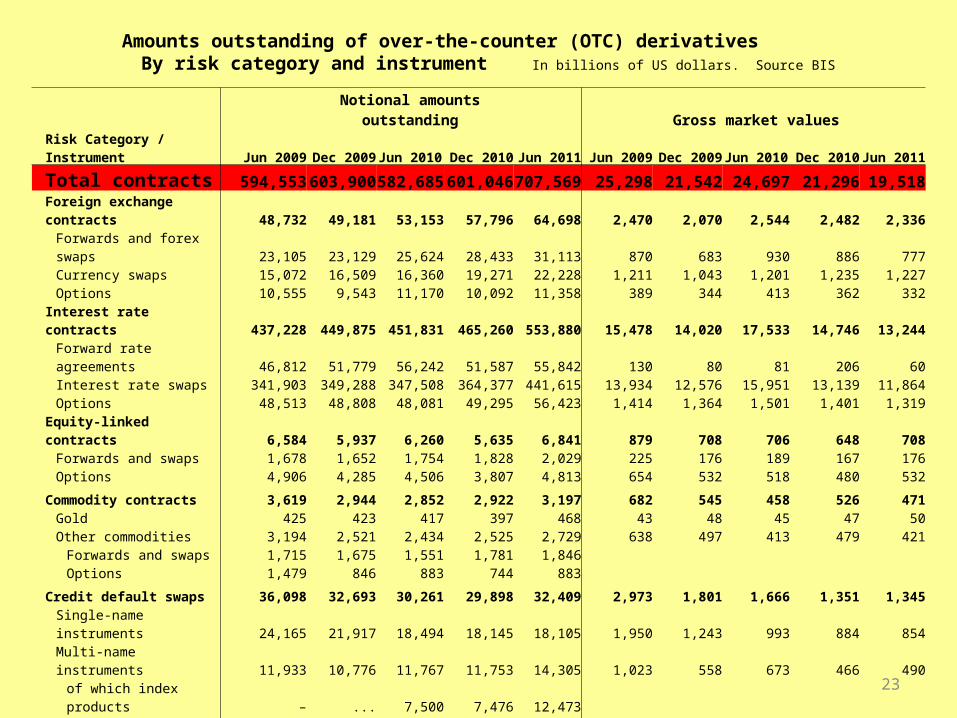
Notional amounts outstanding Gross market values
Risk Category / Instrument Jun 2009 Dec 2009 Jun 2010 Dec 2010 Jun 2011 Jun 2009 Dec 2009 Jun 2010 Dec 2010 Jun 2011
Total contracts 594,553 603,900 582,685 601,046 707,569 25,298 21,542 24,697 21,296 19,518Foreign exchange contracts 48,732 49,181 53,153 57,796 64,698 2,470 2,070 2,544 2,482 2,336
Forwards and forex swaps 23,105 23,129 25,624 28,433 31,113 870 683 930 886 777Currency swaps 15,072 16,509 16,360 19,271 22,228 1,211 1,043 1,201 1,235 1,227Options 10,555 9,543 11,170 10,092 11,358 389 344 413 362 332
Interest rate contracts 437,228 449,875 451,831 465,260 553,880 15,478 14,020 17,533 14,746 13,244Forward rate agreements 46,812 51,779 56,242 51,587 55,842 130 80 81 206 60Interest rate swaps 341,903 349,288 347,508 364,377 441,615 13,934 12,576 15,951 13,139 11,864Options 48,513 48,808 48,081 49,295 56,423 1,414 1,364 1,501 1,401 1,319
Equity-linked contracts 6,584 5,937 6,260 5,635 6,841 879 708 706 648 708Forwards and swaps 1,678 1,652 1,754 1,828 2,029 225 176 189 167 176Options 4,906 4,285 4,506 3,807 4,813 654 532 518 480 532
Commodity contracts 3,619 2,944 2,852 2,922 3,197 682 545 458 526 471Gold 425 423 417 397 468 43 48 45 47 50Other commodities 3,194 2,521 2,434 2,525 2,729 638 497 413 479 421
Forwards and swaps 1,715 1,675 1,551 1,781 1,846Options 1,479 846 883 744 883
Credit default swaps 36,098 32,693 30,261 29,898 32,409 2,973 1,801 1,666 1,351 1,345Single-name instruments 24,165 21,917 18,494 18,145 18,105 1,950 1,243 993 884 854
Multi-name instruments 11,933 10,776 11,767 11,753 14,305 1,023 558 673 466 490
of which index products – ... 7,500 7,476 12,473
Unallocated 62,291 63,270 38,329 39,536 46,543 2,816 2,398 1,789 1,543 1,414
Memorandum Item:
Gross Credit Exposure 3,744 3,521 3,581 3,480 2,971
Amounts outstanding of over-the-counter (OTC) derivativesBy risk category and instrument In billions of US dollars. Source BIS
23

Concentration of Derivative Contracts ($ Billions)
TypeTop 5 Banks
$All Other
banks $ Total $ Top 5 Banks %
Futures & Fwrds 35,797 3,994 39,791 14
Swaps 150,502 5,630 156,132 61
Options 35,157 1,211 36,368 14
Credit Derivatives 15,521 140 15,661 6
TOTAL 236,977 10,974 247,952 96
Source : Comptroller of the Currency, Washington DC, 3Q 2011
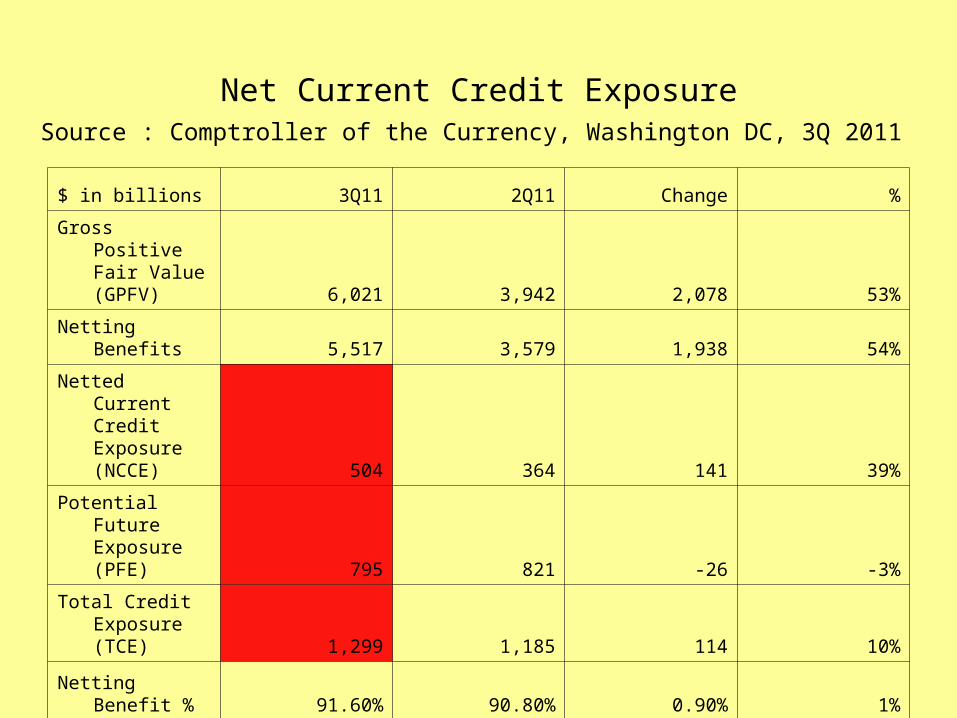
Net Current Credit Exposure
$ in billions 3Q11 2Q11 Change %
Gross Positive Fair Value (GPFV) 6,021 3,942 2,078 53%
Netting Benefits 5,517 3,579 1,938 54%
Netted Current Credit Exposure (NCCE) 504 364 141 39%
Potential Future Exposure (PFE) 795 821 -26 -3%
Total Credit Exposure (TCE) 1,299 1,185 114 10%
Netting Benefit % 91.60% 90.80% 0.90% 1%
Source : Comptroller of the Currency, Washington DC, 3Q 2011


